Notebookcheck Logo

Mediatek Helio P90 vs Qualcomm Snapdragon 675 vs Mediatek Helio G85

Mediatek Helio P90

► remove from comparison Mediatek Helio P90

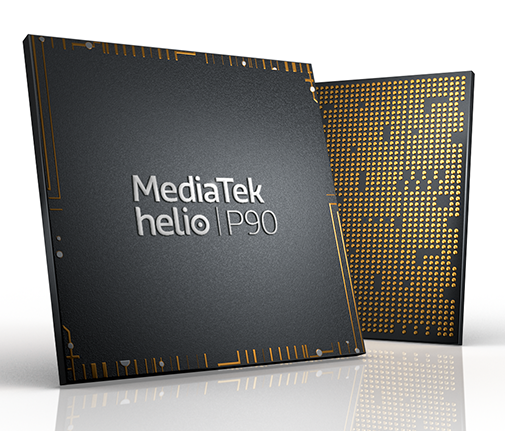
The Mediatek Helio P90 is an upper mainstream ARM SoC for smartphones (mainly Android based) that was introduced in 2019. It is manufactured in a 12 nm FinFET (12FFC) process and is equipped with 2x big ARM Cortex-A75 cores (2.2 GHz max.) and 6x small and power efficient ARM Cortex-A55 cores (2 GHz max.) in two clusters (bigLITTLE). The processor also integrates a Cat-12 (600 Mbps DL) / Cat-13 (150 Mbps UL) LTE Modem (4G), a PowerVR GM 9446 GPU, and ISP for 64 MP photos and 4K videorecording, and a AI Processing Unit with a theoretical performance of 1165 Giga-Multiply-Adds per second. The memory controller on the die supports dual-channel LPDDR4x-1866 (8 GB max.) and flash memory can be connected by UFS 2.1.

The CPU performance should be slightly below a Snapdragon 730 (e.g. in the Reno2 Z in our benchmarks) and therefore in the upper middle-class of 2019 smartphones.

Qualcomm Snapdragon 675

► remove from comparison Qualcomm SD 675

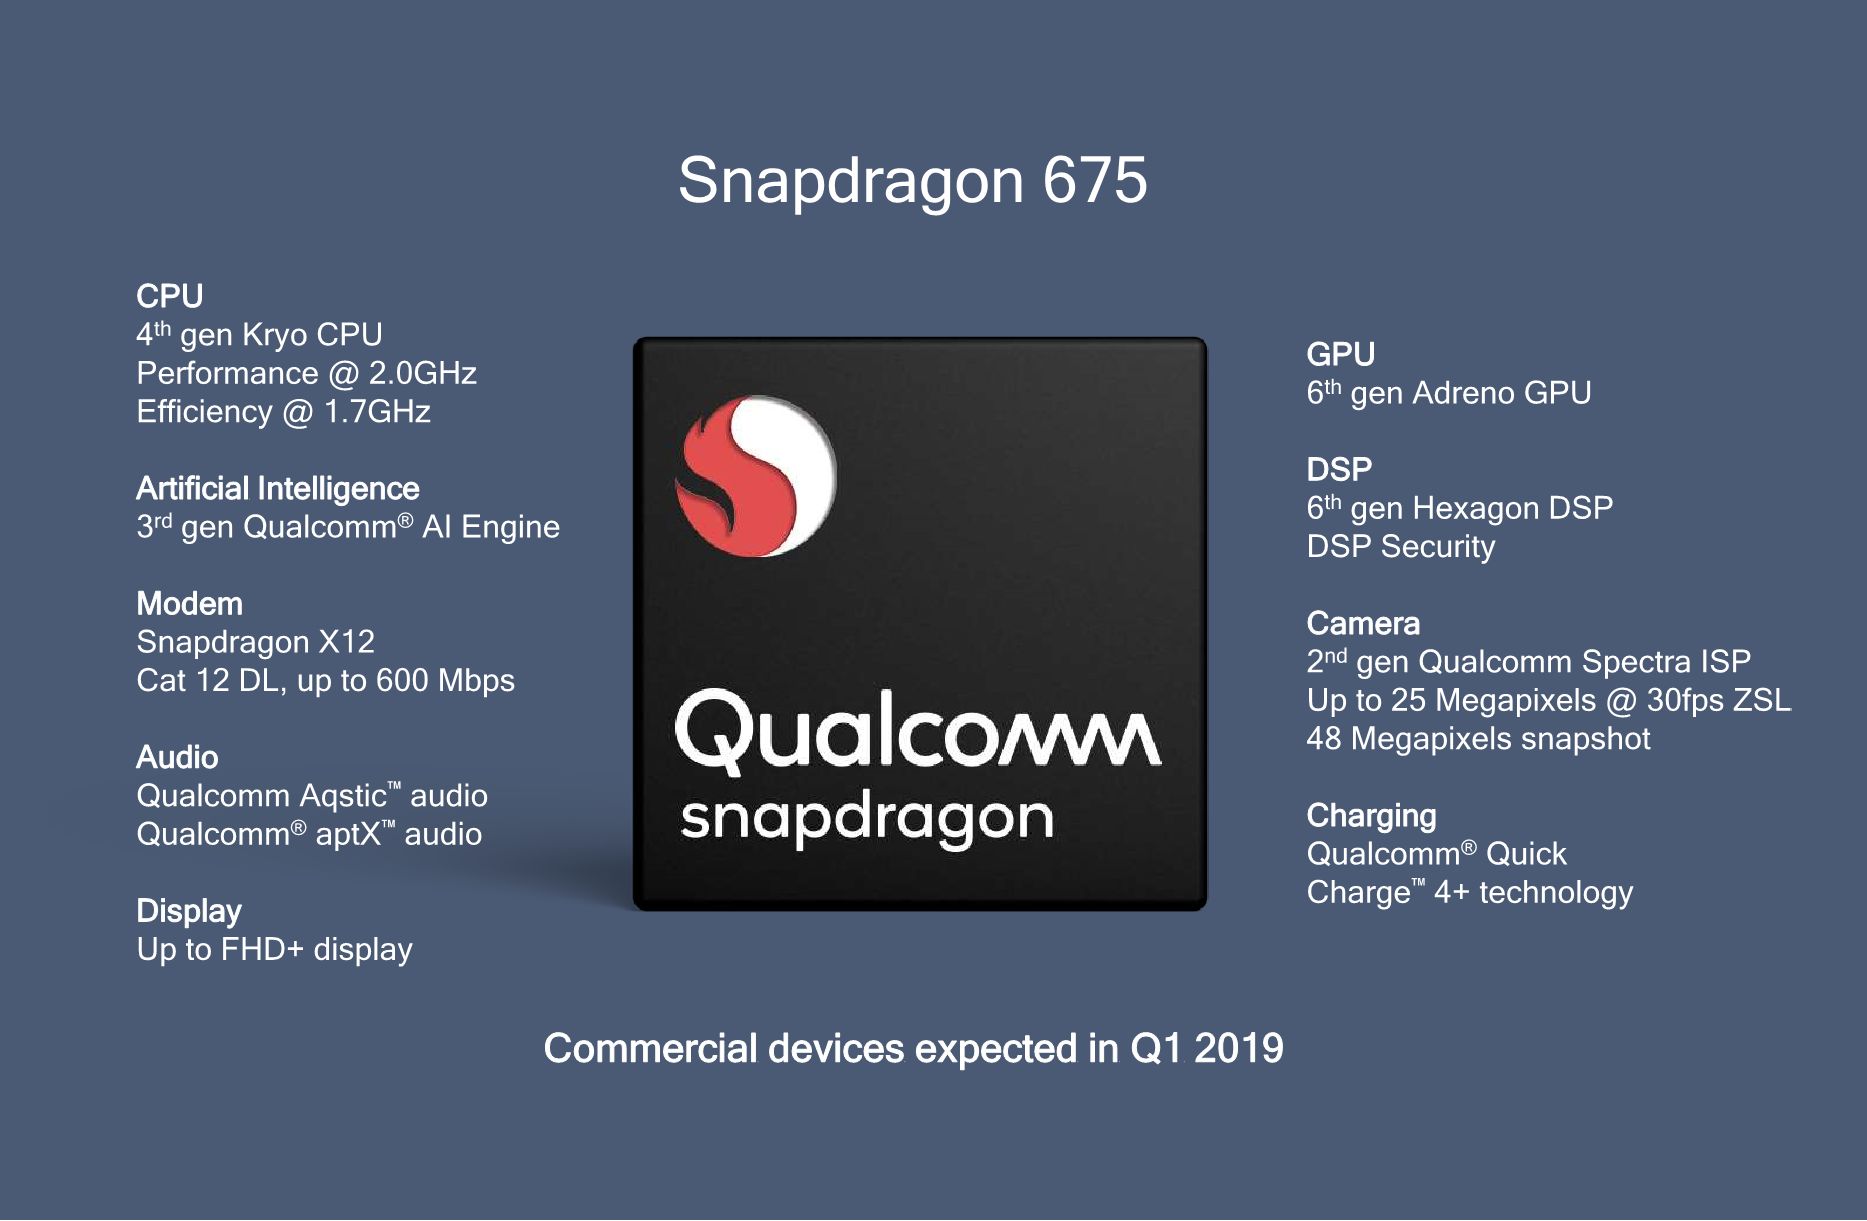
The Qualcomm Snapdragon 675 (SD675) is a fast mid-range ARM-based SoC largely found on Android tablets and smartphones. It features 8 Kryo 460 called cores (64-Bit capable) that are divided in two clusters. A fast cluster of two cores with up to 2 GHz and  based on the ARM Cortex-A76 design. And a power saving efficiency cluster with up to 1.6 GHz and based on much smaller ARM Cortex-A55 cores. Both clusters can also used together.

In addition to the 8 CPU cores, the SoC integrates a lower mid range Adreno 612 GPU, a X12 LTE Modem with up to 600 Mbps download (Cat 12) and 150 Mbps upload (Cat 13), a 802.11ac (Wifi 5) Wave 2 WLAN modem (up to 867 Mbps), a Bluetooth 5.0 radio, satellite positioning (GPS, QZSS, GLONASS, SBAS, Beidou and Galileo) and a video engine (up to 4k30 encoding and support for H.265, H.264, VP8 and VP9).

Performance

Thanks to the two fast Cortex-A76 based cores, the SD675 is able to even best the old high end Snapdragon 835 SoC in some benchmarks. The less powerful Snapdragon 670 e.g. only achieves 70 to 77% of the performance in Geekbench 4.3 (single - multi core test). Current high-end SoCs like the Snapdragon 855 however can still add 50-70% on top of the performance of the 675.

The Snapdragon 675 is produced in the new 11nm LPP (Low Power Plus) process at Samsung which is a combination of 14nm and 10nm. Compared to 14nm LPP, the 11nm LPP process should be able to increase performance by 15% and decrease the chip size by 10% according to Samsung.

Mediatek Helio G85

► remove from comparison Mediatek Helio G85

The Mediatek Helio G85 is a mainstream ARM SoC for smartphones (mainly Android based) that was introduced in 2020. It is manufactured in a 12 nm FinFET process and integrates 8 CPU cores. Two fast ARM Cortex-A75 cores with up to 2 GHz for performance tasks and six small ARM Cortex-A55 with up to 1.8 GHz for efficiency. All eight cores can be used together thanks to Heterogeneous Multi-Processing support. The integrated GPU is a ARM Mali-G52 MC2 (MP2) with two clusters at up to 1000 MHz (up from 950 MHz from the otherwise similar Helio G80). The SoC also integrates the HyperEngine that handles a dynamic management of CPU, GPU and memory.

The SoC integrates furthermore a LTE radio with Cat-7 (download) / Cat-13 (upload) support, Wifi 5 (ac), Bluetooth 5.0, LPDDR4x 1800 MHz and eMMC 5.1 storage.

ModelMediatek Helio P90Qualcomm Snapdragon 675Mediatek Helio G85
SeriesMediatek MediatekQualcomm SnapdragonMediatek Mediatek
CodenameCortex-A75 / A55Kryo 460 Gold (Cortex-A76) / Silver (Cortex-A55)Cortex-A75 / A55
Series: Mediatek Cortex-A75 / A55
Mediatek Helio P90 « 2.2 GHz8 / 8 cores Cortex-A75 / A55
Mediatek Helio P652 GHz8 / 8 cores Cortex-A75 / A55
Mediatek Helio G881.8 - 2 GHz8 / 8 cores Cortex-A75 / A55
Mediatek Helio G851.8 - 2 GHz8 / 8 cores Cortex-A75 / A55
Mediatek Helio G802 GHz8 / 8 cores Cortex-A75 / A55
Mediatek Helio G702 GHz8 / 8 cores Cortex-A75 / A55
Qualcomm Snapdragon 6781.7 - 2.2 GHz8 / 8 cores Kryo 460 Gold (Cortex-A76) / Silver (Cortex-A55)
Qualcomm Snapdragon 675 « 1.6 - 2 GHz8 / 8 cores Kryo 460 Gold (Cortex-A76) / Silver (Cortex-A55)
Mediatek Helio P902.2 GHz8 / 8 cores Cortex-A75 / A55
Mediatek Helio P652 GHz8 / 8 cores Cortex-A75 / A55
Mediatek Helio G881.8 - 2 GHz8 / 8 cores Cortex-A75 / A55
Mediatek Helio G85 « 1.8 - 2 GHz8 / 8 cores Cortex-A75 / A55
Mediatek Helio G802 GHz8 / 8 cores Cortex-A75 / A55
Mediatek Helio G702 GHz8 / 8 cores Cortex-A75 / A55
Clock2200 MHz1600 - 2000 MHz1800 - 2000 MHz
Cores / Threads8 / 88 / 88 / 8
Technology12 nm11 nm12 nm
Features4x ARM Cortex-A75, 4x ARM Cortex-A55, LPDDR4x-1866 Dual Channel, UFS 2.1, LTE Cat-12 DL/ Cat-13 UL, Wi-Fi 5, BT 5.0Adreno 612 GPU, X12 LTE Modem, Hexagon 685 DSP, Spectra 250L ISP2x Cortex-A75, 6x Cortex-A55
iGPUPowerVR GM9446Qualcomm Adreno 612ARM Mali-G52 MP2 ( - 1000 MHz)
ArchitectureARMARMARM
Announced
Manufacturerwww.mediatek.comwww.qualcomm.comwww.mediatek.com

Benchmarks

Performance Rating - Geekbench 5.5, PCM Work, Sling Shot Physics, Antutu v8 CPU - Helio P90
0.5 pt (42%)
Performance Rating - Geekbench 5.5, PCM Work, Sling Shot Physics, Antutu v8 CPU - Helio G85
0.5 pt (36%)
3DMark - 3DMark Ice Storm Unlimited Physics
min: 21123     avg: 22156     median: 22155.5 (19%)     max: 23188 Points
min: 15461     avg: 17199     median: 16912 (14%)     max: 19511 Points
min: 16484     avg: 17640     median: 17640 (15%)     max: 18796 Points
3DMark - 3DMark Sling Shot Extreme (ES 3.1) Unlimited Physics
min: 2218     avg: 2567     median: 2699 (32%)     max: 2784 Points
min: 1684     avg: 2448     median: 2548.5 (30%)     max: 3011 Points
3DMark - 3DMark Sling Shot (ES 3.0) Unlimited Physics
min: 2575     avg: 2669     median: 2657 (30%)     max: 2776 Points
min: 1657     avg: 2433     median: 2546 (29%)     max: 2984 Points
min: 2644     avg: 2697     median: 2684 (31%)     max: 2778 Points
Geekbench 6.2 - Geekbench 6.2 Single-Core
min: 366     avg: 391     median: 391 (12%)     max: 416 Points
Geekbench 6.2 - Geekbench 6.2 Multi-Core
min: 1316     avg: 1370     median: 1369.5 (5%)     max: 1423 Points
Geekbench 5.5 - Geekbench 5.1 - 5.4 64 Bit Single-Core
min: 407     avg: 410.3     median: 408 (17%)     max: 416 Points
486 Points (21%)
Geekbench 5.5 - Geekbench 5.1 - 5.4 64 Bit Multi-Core
min: 1495     avg: 1518     median: 1524 (3%)     max: 1534 Points
924 Points (2%)
Geekbench 5.0 - Geekbench 5.0 64 Bit Single-Core
100%
1 SD 675 +
min: 492     avg: 501     median: 504 (2%)     max: 506 Points
Geekbench 5.0 - Geekbench 5.0 64 Bit Multi-Core
100%
1 SD 675 +
min: 939     avg: 1389     median: 1610 (5%)     max: 1618 Points
Geekbench 4.4 - Geekbench 4.1 - 4.4 64 Bit Single-Core
1994 Points (20%)
min: 2266     avg: 2323     median: 2323 (23%)     max: 2380 Points
1662 Points (17%)
Geekbench 4.4 - Geekbench 4.1 - 4.4 64 Bit Multi-Core
6162 Points (7%)
min: 5998     avg: 6222     median: 6222 (7%)     max: 6446 Points
5301 Points (6%)
Geekbench 4.0 - Geekbench 4.0 64 Bit Single-Core
0 Points (0%)
100%
1 SD 675 +
2376 Points (32%)
Geekbench 4.0 - Geekbench 4.0 64 Bit Multi-Core
100%
1 SD 675 +
6554 Points (16%)
Geekbench 3 - Geekbench 3 32 Bit Single-Core
0 Points (0%)
Geekbench 3 - Geekbench 3 64 Bit Multi-Core
100%
1 SD 675 +
5667 Points (9%)
Geekbench 3 - Geekbench 3 64 Bit Single-Core
100%
1 SD 675 +
1893 Points (28%)
Geekbench 2 - 32 Bit - Geekbench Stream
3367 Points (27%)
2251 Points (18%)
1369 Points (11%)
Geekbench 2 - 32 Bit - Geekbench Memory
4787 Points (43%)
2956 Points (27%)
2836 Points (26%)
Geekbench 2 - 32 Bit - Geekbench Floating Point
12546 Points (25%)
11428 Points (22%)
9944 Points (19%)
Geekbench 2 - 32 Bit - Geekbench Integer
5757 Points (12%)
5292 Points (11%)
4915 Points (10%)
Geekbench 2 - 32 Bit - Geekbench Total Score
7696 Points (20%)
6668 Points (17%)
5907 Points (15%)
Mozilla Kraken 1.1 - Kraken 1.1 Total Score *
3098 ms (4%)
min: 2807     avg: 2849     median: 2848.5 (3%)     max: 2890 ms
min: 2966.5     avg: 3536     median: 3472 (4%)     max: 3939 ms
Octane V2 - Octane V2 Total Score
14607 Points (13%)
min: 15689     avg: 15703     median: 15702.5 (14%)     max: 15716 Points
min: 10299     avg: 12514     median: 12386 (11%)     max: 15430 Points
WebXPRT 4 - WebXPRT 4 Score
51 Points (15%)
WebXPRT 3 - WebXPRT 3 Score
91 Points (19%)
min: 70     avg: 76     median: 76 (16%)     max: 82 Points
min: 43     avg: 45.2     median: 45 (9%)     max: 47 Points
AnTuTu v6 - AnTuTu v6 Total Score
100%
1 SD 675 +
130196 Points (44%)
AnTuTu v7 - AnTuTu v7 MEM
100%
1 SD 675 +
min: 9191     avg: 10080     median: 10079.5 (31%)     max: 10968 Points
AnTuTu v7 - AnTuTu v7 UX
100%
1 SD 675 +
min: 42419     avg: 43904     median: 43904 (54%)     max: 45389 Points
AnTuTu v7 - AnTuTu v7 GPU
100%
1 SD 675 +
min: 33571     avg: 33624     median: 33623.5 (10%)     max: 33676 Points
AnTuTu v7 - AnTuTu v7 CPU
100%
1 SD 675 +
min: 75583     avg: 77634     median: 77634 (48%)     max: 79685 Points
AnTuTu v7 - AnTuTu v7 Total Score
100%
1 SD 675 +
min: 159646     avg: 163741     median: 163741 (29%)     max: 167836 Points
AnTuTu v8 - AnTuTu v8 UX
47600 Points (40%)
min: 33983     avg: 35191     median: 35191 (29%)     max: 36399 Points
AnTuTu v8 - AnTuTu v8 MEM
45235 Points (36%)
min: 36589     avg: 37154     median: 37153.5 (30%)     max: 37718 Points
AnTuTu v8 - AnTuTu v8 GPU
42506 Points (8%)
min: 34679     avg: 39134     median: 39134 (7%)     max: 43589 Points
AnTuTu v8 - AnTuTu v8 CPU
82458 Points (30%)
min: 62320     avg: 62867     median: 62866.5 (23%)     max: 63413 Points
AnTuTu v8 - AnTuTu v8 Total Score
217799 Points (21%)
min: 171116     avg: 174345     median: 174345 (17%)     max: 177574 Points
Antutu v9 - AnTuTu v9 Total Score
min: 191865     avg: 213512     median: 217448 (13%)     max: 231224 Points
Antutu v9 - AnTuTu v9 CPU
min: 62911     avg: 64321     median: 63851 (17%)     max: 66202 Points
PassMark PerformanceTest Mobile V1 - PerformanceTest Mobile V1 CPU Tests
195354 Points (26%)
97%
1 SD 675 +
190355 Points (25%)
PCMark for Android - PCM f. Android Work Score 3.0
7769 Points (36%)
PCMark for Android - PCM f. Android Computer Vision
6987 Points (37%)
min: 3707     avg: 3748     median: 3748 (20%)     max: 3789 Points
5692 Points (30%)
PCMark for Android - PCM f. Android Storage
12112 Points (26%)
min: 6738     avg: 8585     median: 8585 (18%)     max: 10432 Points
5697 Points (12%)
PCMark for Android - PCM f. Android Work Score 2.0
min: 7129     avg: 8150     median: 7666 (50%)     max: 9654 Points
min: 7315     avg: 7660     median: 7688 (50%)     max: 7950 Points
min: 8655     avg: 8674     median: 8670 (57%)     max: 8698 Points
PCMark for Android - PCM f. Android Work Score
min: 8736     avg: 10946     median: 10946 (55%)     max: 13156 Points
min: 9288     avg: 9371     median: 9304 (47%)     max: 9522 Points
min: 11421     avg: 11655     median: 11655 (58%)     max: 11889 Points
PCMark for Android - PCM f. Android Storage 2.0 random write internal
min: 32.5     avg: 32.7     median: 32.7 (24%)     max: 32.9 MB/s
PCMark for Android - PCM f. Android Storage 2.0 seq write internal
min: 199.8     avg: 223.4     median: 223.4 (7%)     max: 247 MB/s
PCMark for Android - PCM f. Android Storage 2.0 random read internal
min: 21.1     avg: 24.3     median: 24.3 (30%)     max: 27.4 MB/s
PCMark for Android - PCM f. Android Storage 2.0 seq read internal
min: 278     avg: 281.5     median: 281.5 (8%)     max: 285 MB/s
PCMark for Android - PCM f. Android Storage 2.0 score
min: 7835     avg: 11638     median: 11433 (18%)     max: 15849 Points
CrossMark - CrossMark Overall
min: 280     avg: 324.7     median: 325 (12%)     max: 369 Points
Power Consumption - Geekbench 5.5 Power Consumption 150cd *
min: 0     avg: 3.5     median: 3.8 (2%)     max: 6.28 Watt
Power Consumption - Idle Power Consumption 150cd 1min *
min: 0.839     avg: 1.4     median: 1.4 (2%)     max: 1.89 Watt

Average Benchmarks Mediatek Helio P90 → 100% n=19

Average Benchmarks Qualcomm Snapdragon 675 → 88% n=19

Average Benchmarks Mediatek Helio G85 → 81% n=19

- Range of benchmark values for this graphics card
- Average benchmark values for this graphics card
* Smaller numbers mean a higher performance
1 This benchmark is not used for the average calculation

v1.26
log 25. 11:22:00

#0 checking url part for id 11886 +0s ... 0s

#1 checking url part for id 11403 +0s ... 0s

#2 checking url part for id 12751 +0s ... 0s

#3 not redirecting to Ajax server +0s ... 0s

#4 did not recreate cache, as it is less than 5 days old! Created at Thu, 25 Apr 2024 05:38:32 +0200 +0.001s ... 0.001s

#5 composed specs +0.039s ... 0.04s

#6 did output specs +0s ... 0.04s

#7 getting avg benchmarks for device 11886 +0.017s ... 0.057s

#8 got single benchmarks 11886 +0.023s ... 0.08s

#9 getting avg benchmarks for device 11403 +0.003s ... 0.083s

#10 got single benchmarks 11403 +0.024s ... 0.107s

#11 getting avg benchmarks for device 12751 +0.013s ... 0.12s

#12 got single benchmarks 12751 +0.058s ... 0.178s

#13 got avg benchmarks for devices +0s ... 0.178s

#14 No cached benchmark found, getting uncached values +0.126s ... 0.304s

#15 No cached benchmark found, getting uncached values +0.008s ... 0.312s

#16 min, max, avg, median took s +0.16s ... 0.471s

#17 return log +0s ... 0.471s

Please share our article, every link counts!
> Expert Reviews and News on Laptops, Smartphones and Tech Innovations > Benchmarks / Tech > Processor Comparison - Head 2 Head
Redaktion, 2017-09- 8 (Update: 2023-07- 1)