Notebookcheck Logo

Mediatek Helio P22 MT6762 vs Qualcomm Snapdragon 450

Mediatek Helio P22 MT6762

► remove from comparison  Helio P22 MT6762

The Mediatek Helio P23 MT6763T is a mainstream ARM SoC for smartphones (mainly Android based) that was introduced in 2017. It integrates eight ARM Cortex-A53 cores in two clusters. The four performance cores clock up to 2.3 GHz (single core up to 2.5 GHz) and the four efficiency cores clock up to 1.65 GHz (big.LITTLE). The integrated graphics card is called ARM Mali-G71 MP2 and offers 2 cores with up to 770 MHz. The integrated memory controller supports LPDDR4x with 1500 MHz or 933 MHz LPDDR3. Furthermore, a LTE radio with Cat-7 DL (300 Mbps download) and Cat-13 UL (150 Mbps upload) and a 802.11 a/b/g/n WiFi modem is integrated.

Qualcomm Snapdragon 450

► remove from comparison Qualcomm SD 450

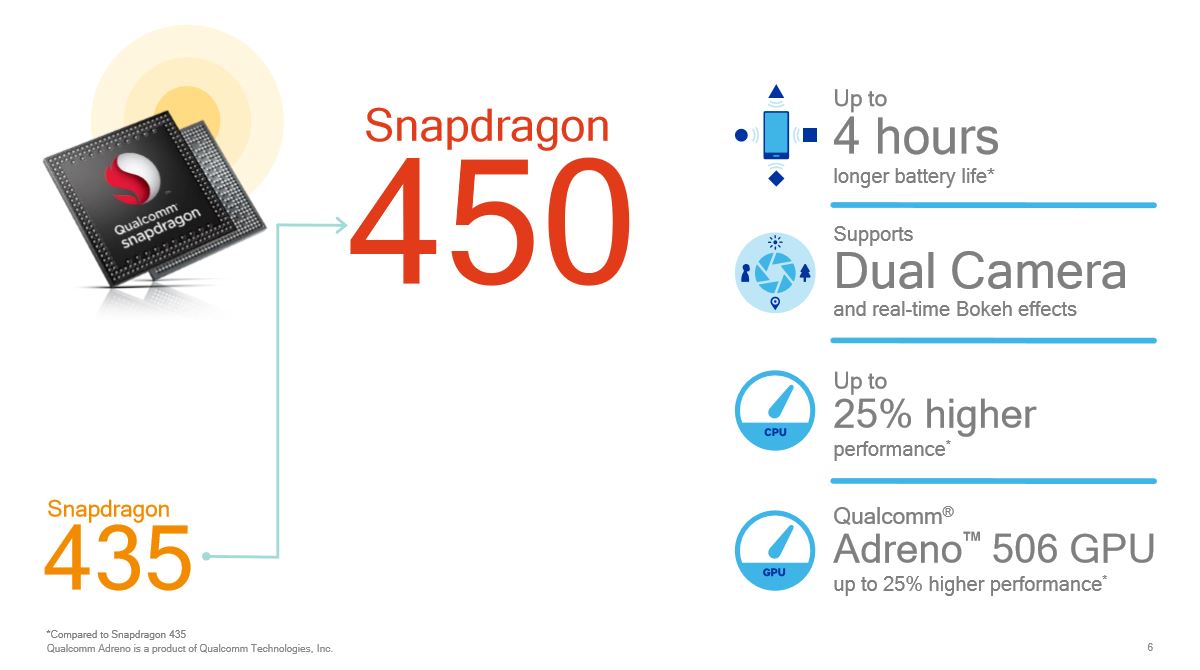
The Qualcomm Snapdragon 450 (SD450) is a lower mainstream SoC for (Android based) smartphones and tablets. It features eight ARM Cortex-A53 cores at up to 1.8 GHz and is already manufactured in the power efficient 14nm process. The integrated X9 LTE modem supports Cat. 7 with maximum transfer rates of 300 Mbps (downstream) and 150 Mbps (upstream). The SoC also includes an Adreno 506 GPU with support for Vulkan and OpenGL ES 3.1. WiFi 802.11ac (1x1, max 364 Mbps) and Bluetooth 4.1 are supported as well. The memory controller supports LPDDR3 (single channel) and the integrated video engine supports H.264 (encode and decode) and HEVC (only decode) in 1080p.

ModelMediatek Helio P22 MT6762Qualcomm Snapdragon 450
Series Mediatek Helio 20Qualcomm Snapdragon
CodenameCortex-A53Cortex-A53
Series: Snapdragon Cortex-A53
Mediatek Helio P25 compare2.6 GHz8 / 8 cores Cortex-A53
Mediatek Helio A25 compare1.8 GHz8 / 8 cores Cortex-A53
Mediatek Helio P23 MT6763T compare2.3 - 2.5 GHz8 / 8 cores Cortex-A53
Mediatek Helio P23 MT6763V compare2 GHz8 / 8 cores Cortex-A53
Mediatek Helio P20 (LP4) MT6757 compare2.3 GHz8 / 8 cores Cortex-A53
Mediatek Helio P22 MT6762 « 2 GHz8 / 8 cores Cortex-A53
Mediatek Helio A22 MT6762M compare2 GHz4 / 4 cores Cortex-A53
Mediatek Helio A22 MT6761 compare2 GHz4 / 4 cores Cortex-A53
Mediatek Helio A20 MT6761D compare1.8 GHz4 / 4 cores Cortex-A53
Qualcomm Snapdragon 630 compare2.2 GHz8 / 8 cores Cortex-A53
Qualcomm Snapdragon 626 compare2.2 GHz8 / 8 cores Cortex-A53
Qualcomm Snapdragon 625 compare2 GHz8 / 8 cores Cortex-A53
Qualcomm Snapdragon 439 compare2 GHz8 / 8 cores Cortex-A53
Qualcomm Snapdragon 450 « 1.8 GHz8 / 8 cores Cortex-A53
Qualcomm Snapdragon 429 compare2 GHz4 / 4 cores Cortex-A53
Qualcomm Snapdragon 617 MSM8952 compare1.5 GHz8 / 8 cores Cortex-A53
Qualcomm Snapdragon 616 MSM8939v2 compare1.7 GHz8 / 8 cores Cortex-A53
Qualcomm Snapdragon 615 MSM8939 compare1.7 GHz8 / 8 cores Cortex-A53
Qualcomm Snapdragon 610 MSM8936 compare1.7 GHz4 / 4 cores Cortex-A53
Qualcomm Snapdragon 435 compare1.4 GHz8 / 8 cores Cortex-A53
Qualcomm Snapdragon 430 (MSM8937) compare1.4 GHz8 / 8 cores Cortex-A53
Qualcomm Snapdragon 415 MSM8929 compare1.4 GHz8 / 8 cores Cortex-A53
Qualcomm Snapdragon 425 (MSM8917) compare1.4 GHz4 / 4 cores Cortex-A53
Qualcomm Snapdragon 410 MSM8916 compare1.4 GHz4 / 4 cores Cortex-A53
Qualcomm Snapdragon 410 APQ8016 compare1.2 GHz4 / 4 cores Cortex-A53
Clock2000 MHz1800 MHz
Cores / Threads8 / 88 / 8
Technology16 nm14 nm
FeaturesPowerVR GE8320 650MHz, Dual-Channel LPDDR4X-3200Adreno 506 GPU, X9 LTE Modem (300 / 150 Mbps)
iGPUPowerVR GE8320 ( - 650 MHz)Qualcomm Adreno 506
ArchitectureARMARM
Announced
Manufacturerwww.mediatek.comwww.qualcomm.com

Benchmarks

Performance Rating - Geekbench 5.5, PCM Work, Sling Shot Physics, Antutu v8 CPU - SD 450
0.2 pt (14%)
3DMark - 3DMark Ice Storm Physics
12643 Points (10%)
3DMark - 3DMark Ice Storm Extreme Physics
min: 12836     avg: 13038     median: 13038 (11%)     max: 13240 Points
11735 Points (10%)
min: 131     avg: 140.3     median: 131 (6%)     max: 159 Points
min: 493     avg: 631     median: 498 (1%)     max: 902 Points
Geekbench 4.0 - Geekbench 4.0 64 Bit Single-Core
100%
1 SD 450 +
min: 709     avg: 733     median: 732.5 (10%)     max: 756 Points
Geekbench 4.0 - Geekbench 4.0 64 Bit Multi-Core
100%
1 SD 450 +
min: 3625     avg: 3691     median: 3690.5 (9%)     max: 3756 Points
Geekbench 3 - Geekbench 3 64 Bit Multi-Core
100%
1 SD 450 +
min: 3963     avg: 3981     median: 3980.5 (6%)     max: 3998 Points
Geekbench 3 - Geekbench 3 64 Bit Single-Core
100%
1 SD 450 +
707 Points (11%)
Geekbench 2 - 32 Bit - Geekbench Stream
100%
1 SD 450 +
min: 737     avg: 747     median: 746.5 (6%)     max: 756 Points
Geekbench 2 - 32 Bit - Geekbench Memory
100%
1 SD 450 +
min: 1708     avg: 2113     median: 2112.5 (19%)     max: 2517 Points
Geekbench 2 - 32 Bit - Geekbench Floating Point
100%
1 SD 450 +
min: 5993     avg: 6011     median: 6010.5 (12%)     max: 6028 Points
Geekbench 2 - 32 Bit - Geekbench Integer
100%
1 SD 450 +
min: 3340     avg: 3381     median: 3381 (7%)     max: 3422 Points
Geekbench 2 - 32 Bit - Geekbench Total Score
100%
1 SD 450 +
min: 3683     avg: 3784     median: 3783.5 (10%)     max: 3884 Points
Mozilla Kraken 1.1 - Kraken 1.1 Total Score *
min: 10846     avg: 11753     median: 11757 (14%)     max: 12799 ms
min: 11012     avg: 11506     median: 11492.5 (13%)     max: 11863 ms
Octane V2 - Octane V2 Total Score
min: 3312     avg: 4166     median: 4257 (4%)     max: 4508 Points
min: 3470     avg: 3981     median: 3997 (4%)     max: 4115 Points
WebXPRT 3 - WebXPRT 3 Score
min: 26     avg: 28.6     median: 29 (6%)     max: 30 Points
min: 28     avg: 31.3     median: 31.5 (7%)     max: 34 Points
AnTuTu v6 - AnTuTu v6 Total Score
min: 52433     avg: 54829     median: 55042 (19%)     max: 57309 Points
min: 54731     avg: 57703     median: 57827.5 (20%)     max: 60077 Points
AnTuTu v8 - AnTuTu v8 UX
100%
1 SD 450 +
min: 26309     avg: 28038     median: 28107 (24%)     max: 29697 Points
AnTuTu v8 - AnTuTu v8 MEM
100%
1 SD 450 +
min: 13168     avg: 16031     median: 15671 (13%)     max: 19253 Points
AnTuTu v8 - AnTuTu v8 GPU
100%
1 SD 450 +
min: 9371     avg: 9408     median: 9408 (2%)     max: 9444 Points
AnTuTu v8 - AnTuTu v8 CPU
100%
1 SD 450 +
min: 28376     avg: 35468     median: 38797 (14%)     max: 39230 Points
AnTuTu v8 - AnTuTu v8 Total Score
100%
1 SD 450 +
min: 89022     avg: 92277     median: 90185 (9%)     max: 97624 Points
AndEBench - AndEBench Java
0 Iter./s (0%)
AndEBench - AndEBench Native
0 Iter./s (0%)
PassMark PerformanceTest Mobile V1 - PerformanceTest Mobile V1 CPU Tests
100%
1 SD 450 +
101906 Points (13%)
PCMark for Android - PCM f. Android Storage 2.0 score
min: 7238     avg: 7314     median: 7314 (12%)     max: 7390 Points
PCMark for Android - PCM f. Android Work Score 3.0
min: 4779     avg: 4953     median: 4952.5 (23%)     max: 5126 Points
PCMark for Android - PCM f. Android Computer Vision
2883 Points (15%)
min: 2140     avg: 2239     median: 2157 (11%)     max: 2583 Points
PCMark for Android - PCM f. Android Storage
5989 Points (13%)
min: 3145     avg: 5094     median: 4391 (9%)     max: 7635 Points
PCMark for Android - PCM f. Android Work 2.0 Battery Life
100%
1 SD 450 +
652 min (12%)

Average Benchmarks Mediatek Helio P22 MT6762 → 100% n=21

Average Benchmarks Qualcomm Snapdragon 450 → 102% n=21

- Range of benchmark values for this graphics card
- Average benchmark values for this graphics card
* Smaller numbers mean a higher performance
1 This benchmark is not used for the average calculation

Add one or more devices and compare

In the following list you can select (and also search for) devices that should be added to the comparison. You can select more than one device.

restrict list:

show all (including archived), 2024, 2023
v1.26
log 25. 07:34:42

#0 checking url part for id 10561 +0s ... 0s

#1 checking url part for id 9946 +0s ... 0s

#2 not redirecting to Ajax server +0s ... 0s

#3 did not recreate cache, as it is less than 5 days old! Created at Thu, 25 Apr 2024 05:38:32 +0200 +0.001s ... 0.001s

#4 composed specs +0.022s ... 0.024s

#5 did output specs +0s ... 0.024s

#6 getting avg benchmarks for device 10561 +0.003s ... 0.027s

#7 got single benchmarks 10561 +0.093s ... 0.12s

#8 getting avg benchmarks for device 9946 +0.012s ... 0.132s

#9 got single benchmarks 9946 +0.054s ... 0.186s

#10 got avg benchmarks for devices +0s ... 0.186s

#11 No cached benchmark found, getting uncached values +0.197s ... 0.383s

#12 No cached benchmark found, getting uncached values +0.001s ... 0.384s

#13 min, max, avg, median took s +0.026s ... 0.41s

#14 return log +0.037s ... 0.448s

Please share our article, every link counts!
> Expert Reviews and News on Laptops, Smartphones and Tech Innovations > Benchmarks / Tech > Processor Comparison - Head 2 Head
Redaktion, 2017-09- 8 (Update: 2023-07- 1)