Intel HD Graphics (Haswell) vs Intel HD Graphics 5000 vs Intel HD Graphics (Cherry Trail)
Intel HD Graphics (Haswell) ► remove from comparison
The Intel HD Graphics (Haswell) is an integrated graphics card in the Haswell codenamed processors (Celeron and Pentium). It is the successor the the Intel HD Graphics in the Ivy Bridge CPUs and performs slightly better. Depending on the processor model, the base and turbo clock rates may differ, resulting in varying graphics performance between CPU models.
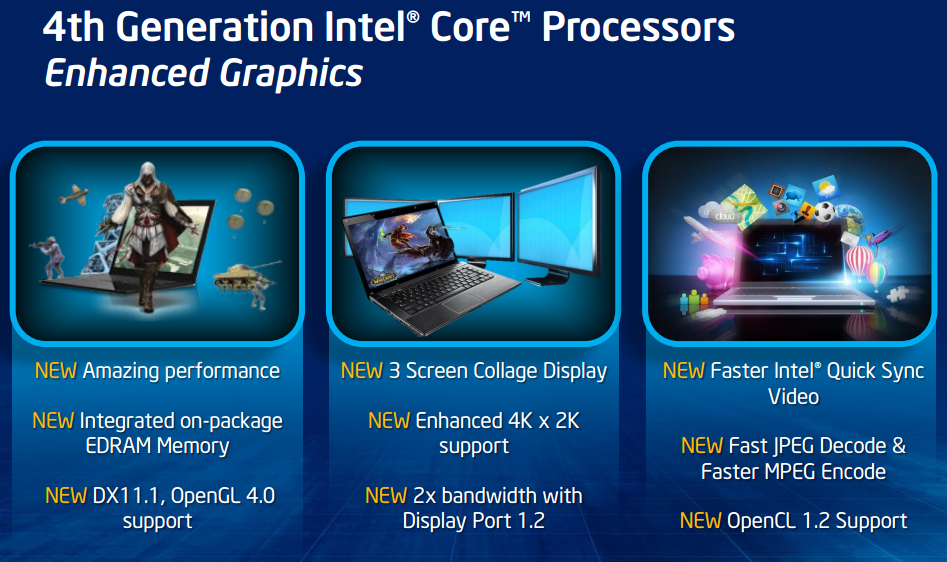
In comparison to the HD 4000, the graphics core has been modified extensively. The GPU supports DirectX 11.1, OpenCL 1.2 and OpenGL 4.0. It also features an improved decoder for 4K videos and the fast Quick Sync encoder (deactivated in many entry level models).
The Performance of the HD Graphics (Haswell) is similar to the old HD Graphics 3000 or the AMD Radeon HD 8250 . Only a few modern games like Dota 2 can be played fluently in very low details and resolutions.
Due to the 22nm 3D Tri-Gate production process, the power consumption should be relatively low (the development was focused on performance per Watt). The GPU can be found in ULV models and regular (37 W) dual core CPUs.
Intel HD Graphics 5000 ► remove from comparison
The Intel HD Graphics 5000 (GT3) is a processor graphics card included in some of the ULV Haswell processors of 2013 (e.g. Core i5-4250U ). It represents the highest configuration of the integrated graphics unit (40 execution units), but lacks the additional eDRAM cache of the Iris Pro Graphics 5200 . The relatively low base clock can be automatically overclocked using Turbo Boost technology. Depending on the processor model, the base and turbo clock rates may differ, resulting in varying graphics performance between CPU models.
In comparison to the HD 4000, the graphics core has been modified extensively. The GPU supports DirectX 11.1, OpenCL 1.2 and OpenGL 4.0. It also features an improved decoder for 4K videos and the fast Quick Sync encoder.
According to benchmarks in 3DMark 11, the HD Graphics 5000 is up to 50 percent faster than the previous HD 4000 . In games, however, the performance advantage is significantly lower. With simultaneous load on the CPU, the low TDP of the ULV models (15 W) limits the Turbo Boost of the GPU. Although the HD 5000 features 40 Execution Units, the graphics performance is still somewhat below the HD Graphics 4600 with only 20 EUs (HD 4000 : 16 EUs). Overall, the HD 5000 is thus just behind the AMD Radeon HD 7660G and at the level of a dedicated Radeon HD 7650M . Current games (as of 2013) will run fluently in low to medium-low settings.
Due to the 22nm 3D Tri-Gate production process, power consumption is relatively low. The HD Graphics 5000 is available on certain ULV dual-core Haswell models in the 15 Watt TDP range.
Intel HD Graphics (Cherry Trail) ► remove from comparison
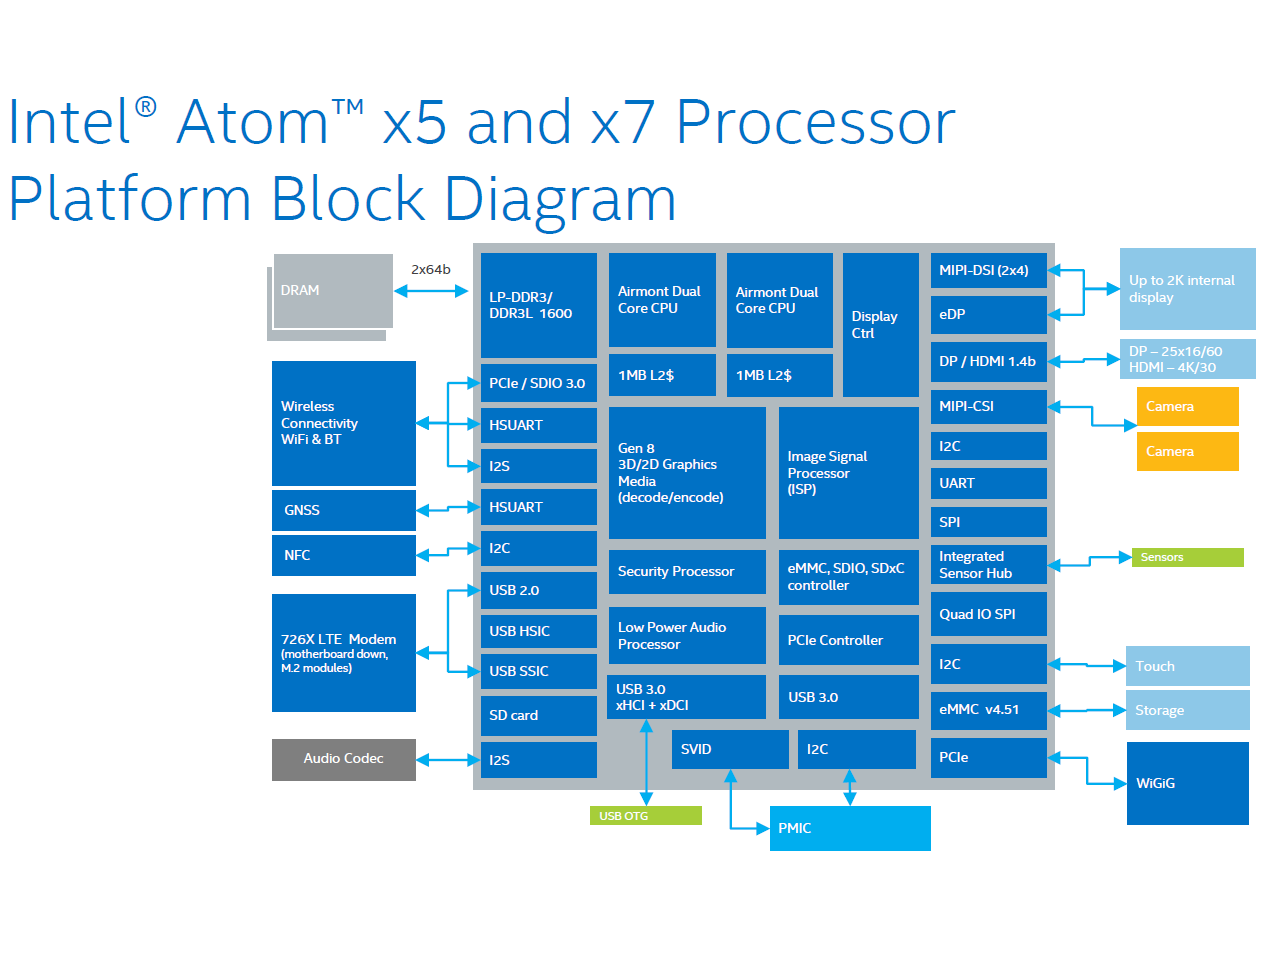
The Intel HD Graphics (Cherry Trail) is an integrated graphics card in the Cherry-Trail SoCs (e.g. Atom x7-Z8700). Based on a Broadwell GPU (Intel Gen8) and supports DirectX 11.2. Depending on the SoC offers 12 or 16 EUs.
Atom x7-Z8700: 16 EUs @ 200 - 600 MHz, dual-channel memory
In Windows, gaming is limited to less demanding or quite old games. Using Android, even high end 3D games should run fluently. For example Team Fortress 2 was running on the Surface 3 (x7-Z8700) only in lowest settings and 1280x720 fluently (11 - 69 fps range).
The integrated video decoder is able to display even 4K videos (H.264 tested) fluently.
The Intel HD Graphics GPU in our review sample of the MS Surface 3 (Atom x7-Z8700) only supported DisplayPort 1.1 as it seems, as 4K (3840x2160) with 30 Hz was the maximum Refresh Rate we could achieve (no 60 Hz selectable with the pre-installed drivers).
Intel HD Graphics (Haswell) Intel HD Graphics 5000 Intel HD Graphics (Cherry Trail) HD Graphics Series Codename Haswell GT1 Haswell GT3 Cherry Trail Architecture Gen. 7.5 Haswell Gen. 7.5 Haswell Gen. 8 Pipelines 10 - unified 40 - unified 16 - unified Core Speed 200 - 1000 (Boost) MHz 200 - 1100 (Boost) MHz 200 - 600 (Boost) MHz Memory Bus Width 64/128 Bit 64/128 Bit 64/128 Bit Shared Memory yes yes yes API DirectX 11.1, Shader 5.0 DirectX 11.1, Shader 5.0, OpenGL 4.0 DirectX 12 (FL 11_1), Shader 5.0, OpenGL 4.3 technology 22 nm 22 nm 14 nm Date of Announcement 01.10.2012 05.06.2013 02.03.2015 Features QuickSync
CPU in HD Graphics (Haswell) GPU Base Speed GPU Boost / Turbo Intel Pentium 3560M 2 x 2400 MHz, 37 W 400 MHz 1100 MHz Intel Pentium 3550M 2 x 2300 MHz, 37 W 400 MHz 1100 MHz Intel Celeron 2970M 2 x 2200 MHz, 37 W 400 MHz 1100 MHz » show 10 more Intel Celeron 2950M 2 x 2000 MHz, 37 W 400 MHz 1100 MHz Intel Pentium 3558U 2 x 1700 MHz, 15 W 200 MHz 1000 MHz Intel Pentium 3556U 2 x 1700 MHz, 15 W 200 MHz 1000 MHz Intel Celeron 2981U 2 x 1600 MHz, 15 W 200 MHz 1000 MHz Intel Celeron 2980U 2 x 1600 MHz, 15 W 200 MHz 1000 MHz Intel Celeron 2957U 2 x 1400 MHz, 15 W 200 MHz 1000 MHz Intel Celeron 2955U 2 x 1400 MHz, 15 W 200 MHz 1000 MHz Intel Pentium 3561Y 2 x 1200 MHz, 11.5 W 200 MHz 850 MHz Intel Pentium 3560Y 2 x 1200 MHz, 11.5 W 200 MHz 850 MHz Intel Celeron 2961Y 2 x 1100 MHz, 11.5 W 200 MHz 850 MHz min. - max. 200 - 400 MHz 850 - 1100 MHz
CPU in HD Graphics 5000 GPU Base Speed GPU Boost / Turbo Intel Core i7-4650U 2 x 1700 MHz, 15 W 200 MHz 1100 MHz Intel Core i7-4550U 2 x 1500 MHz, 15 W 200 MHz 1100 MHz Intel Core i5-4360U 2 x 1500 MHz, 15 W 200 MHz 1100 MHz » show 3 more Intel Core i5-4350U 2 x 1400 MHz, 15 W 200 MHz 1100 MHz Intel Core i5-4260U 2 x 1400 MHz, 15 W 200 MHz 1000 MHz Intel Core i5-4250U 2 x 1300 MHz, 15 W 200 MHz 1000 MHz min. - max. 200 - 400 MHz 850 - 1100 MHz
CPU in HD Graphics (Cherry Trail) GPU Base Speed GPU Boost / Turbo Intel Atom x7-Z8700 4 x 1600 MHz 200 MHz 600 MHz Intel Atom x5-Z8500 4 x 1440 MHz 200 MHz 600 MHz Intel Atom x5-Z8350 4 x 1440 MHz 200 MHz 500 MHz » show 2 more Intel Atom x5-Z8300 4 x 1440 MHz 200 MHz 500 MHz Intel Atom x5-E8000 4 x 1040 MHz, 5 W 320 MHz ? MHz min. - max. 200 - 400 MHz ? - 1100 MHz
Benchmarks Performance Rating - 3DMark 11 + Fire Strike + Time Spy - HD Graphics (Haswell)
0.2 pt (0%)
...
Intel HD Graphics (Haswell)
...
max:
Performance Rating - 3DMark 11 + Fire Strike + Time Spy - HD Graphics 5000
0.3 pt (1%)
...
...
max:
Performance Rating - 3DMark 11 + Fire Strike + Time Spy - HD Graphics (Cherry Trail)
0.1 pt (0%)
Intel HD Graphics (Cherry Trail)
...
max:
3DMark - 3DMark Ice Storm Unlimited Graphics
43493 Points (5%)
65904 Points (7%)
min: 18563 avg: 20873 median: 19303 (2%) max: 27537 Points
3DMark - 3DMark Ice Storm Extreme Graphics
37346 Points (5%)
3DMark - 3DMark Cloud Gate Score
min: 2141 avg: 2403 median: 2335.5 (2%) max: 3011 Points
min: 4331 avg: 4586 median: 4496.5 (5%) max: 5059 Points
min: 769 avg: 1454 median: 1488 (2%) max: 1905 Points
3DMark - 3DMark Cloud Gate Graphics
min: 3111 avg: 3415 median: 3278 (1%) max: 4199 Points
min: 5381 avg: 5981 median: 5693.5 (1%) max: 6762 Points
min: 1537 avg: 1851 median: 1783.5 (0%) max: 2272 Points
3DMark - 3DMark Fire Strike Standard Score
min: 300 avg: 323.8 median: 314 (1%) max: 383 Points
min: 583 avg: 669 median: 651 (1%) max: 808 Points
min: 174 avg: 390.4 median: 248 (0%) max: 1059 Points
3DMark - 3DMark Fire Strike Standard Graphics
min: 340 avg: 370.8 median: 362.5 (0%) max: 433 Points
min: 620 avg: 725 median: 715.5 (1%) max: 875 Points
min: 193 avg: 233 median: 225 (0%) max: 281 Points
3DMark - 3DMark Ice Storm Graphics
min: 29291 avg: 34138 median: 34675 (4%) max: 40515 Points
min: 35584 avg: 41867 median: 40454 (5%) max: 52302 Points
min: 7544 avg: 16078 median: 17063.5 (2%) max: 23395 Points
3DMark - 3DMark Sling Shot (ES 3.0) Unlimited
min: 1445 avg: 1525 median: 1525 (7%) max: 1605 Points
3DMark - 3DMark Sling Shot (ES 3.0) Unlimited Graphics
min: 1598 avg: 1684 median: 1684 (4%) max: 1770 Points
3DMark - 3DMark Sling Shot Extreme (ES 3.1) Unlimited
min: 1072 avg: 1215 median: 1159 (6%) max: 1414 Points
3DMark - 3DMark Sling Shot Extreme (ES 3.1) Unlimited Graphics
min: 1058 avg: 1251 median: 1142 (3%) max: 1554 Points
3DMark 11 - 3DM11 Performance Score
min: 435 avg: 543 median: 544 (1%) max: 688 Points
min: 962 avg: 1088 median: 1125.5 (2%) max: 1163 Points
min: 314 avg: 359.4 median: 343 (0%) max: 562 Points
3DMark 11 - 3DM11 Performance GPU
min: 384 avg: 479.6 median: 484 (0%) max: 602 Points
min: 859 avg: 993 median: 1033.5 (1%) max: 1072 Points
min: 278 avg: 319.9 median: 298 (0%) max: 494 Points
3DMark Vantage + Intel HD Graphics (Haswell) 3DMark Vantage - 3DM Vant. Perf. total
min: 2146 avg: 2163 median: 2163 (1%) max: 2180 Points
3DM Vant. Perf. total + Intel HD Graphics 5000
min: 3418 avg: 4231 median: 4276.5 (1%) max: 4734 Points
3DM Vant. Perf. GPU no PhysX + Intel HD Graphics (Haswell) 3DMark Vantage - 3DM Vant. Perf. GPU no PhysX
min: 1848 avg: 1859 median: 1859 (1%) max: 1870 Points
3DM Vant. Perf. GPU no PhysX + Intel HD Graphics 5000
min: 2917 avg: 3639 median: 3665 (2%) max: 4108 Points
3DMark 03 - 3DMark 03 - Standard
min: 15752 avg: 18768 median: 18768 (10%) max: 21784 Points
3DMark 05 - 3DMark 05 - Standard
min: 9623 avg: 9763 median: 9763 (11%) max: 9903 Points
3DMark 06 3DMark 06 - Standard 1280x1024 + Intel HD Graphics (Haswell)
min: 2917 avg: 3274 median: 3357.5 (4%) max: 3463 Points
3DMark 06 - Standard 1280x1024 + Intel HD Graphics 5000
min: 4751 avg: 5775 median: 5940 (8%) max: 6160 Points
3DMark 06 - Standard 1280x1024 + Intel HD Graphics (Cherry Trail)
min: 2403 avg: 2833 median: 2595 (3%) max: 3330 Points
3DMark 06 - Standard 1280x800 + Intel HD Graphics 5000
6675 Points (9%)
3DMark 06 - Standard 1024x768 + Intel HD Graphics (Cherry Trail)
2877 Points (4%)
Unigine Valley 1.0 - Unigine Valley 1.0 DX
1.2 fps (0%)
Unigine Heaven 3.0 - Unigine Heaven 3.0 DX 11
12.1 fps (4%)
Unigine Heaven 3.0 - Unigine Heaven 3.0 OpenGL
12.1 fps (5%)
Unigine Heaven 2.1 - Heaven 2.1 high
min: 12.3 avg: 13 median: 13.1 (2%) max: 13.5 fps
5.7 fps (1%)
SPECviewperf 11 + Intel HD Graphics 5000 SPECviewperf 11 - specvp11 snx-01
min: 1.26 avg: 1.5 median: 1.5 (1%) max: 1.64 fps
specvp11 tcvis-02 + Intel HD Graphics 5000 SPECviewperf 11 - specvp11 tcvis-02
min: 1.77 avg: 2.1 median: 2.1 (1%) max: 2.51 fps
specvp11 sw-02 + Intel HD Graphics 5000 SPECviewperf 11 - specvp11 sw-02
min: 7.95 avg: 9.9 median: 9.9 (8%) max: 11.8 fps
specvp11 proe-05 + Intel HD Graphics 5000 SPECviewperf 11 - specvp11 proe-05
min: 1.42 avg: 1.6 median: 1.6 (2%) max: 1.78 fps
specvp11 maya-03 + Intel HD Graphics 5000 SPECviewperf 11 - specvp11 maya-03
min: 12.95 avg: 14.2 median: 14.2 (11%) max: 15.43 fps
specvp11 lightwave-01 + Intel HD Graphics 5000 SPECviewperf 11 - specvp11 lightwave-01
min: 13.34 avg: 14.5 median: 14.5 (16%) max: 15.62 fps
specvp11 ensight-04 + Intel HD Graphics 5000 SPECviewperf 11 - specvp11 ensight-04
min: 2.06 avg: 2.1 median: 2.1 (1%) max: 2.11 fps
specvp11 catia-03 + Intel HD Graphics 5000 SPECviewperf 11 - specvp11 catia-03
4.5 fps (2%)
Windows 7 Experience Index - Win7 Gaming graphics
6.3 Points (80%)
min: 6.5 avg: 6.6 median: 6.6 (84%) max: 6.7 Points
Windows 7 Experience Index - Win7 Graphics
4.7 Points (59%)
min: 5.8 avg: 5.9 median: 5.9 (74%) max: 5.9 Points
Cinebench R10 Cinebench R10 Shading (32bit) + Intel HD Graphics (Haswell) Cinebench R10 - Cinebench R10 Shading (32bit)
min: 3867 avg: 4235 median: 4215.5 (3%) max: 4642 Points
Cinebench R10 Shading (32bit) + Intel HD Graphics 5000
min: 5143 avg: 6901 median: 6946.5 (5%) max: 7959 Points
Cinebench R10 Shading (32bit) + Intel HD Graphics (Cherry Trail)
min: 1192 avg: 2009 median: 1973 (1%) max: 2551 Points
Cinebench R11.5 Cinebench R11.5 OpenGL 64 Bit + Intel HD Graphics (Haswell) Cinebench R11.5 - Cinebench R11.5 OpenGL 64 Bit
min: 9.38 avg: 11.4 median: 11.6 (4%) max: 12.78 fps
Cinebench R11.5 OpenGL 64 Bit + Intel HD Graphics 5000
min: 15.01 avg: 19.6 median: 19.6 (7%) max: 24.76 fps
Cinebench R11.5 OpenGL 64 Bit + Intel HD Graphics (Cherry Trail)
min: 4.01 avg: 8.8 median: 8.4 (3%) max: 11.71 fps
Cinebench R15 + Intel HD Graphics (Haswell) Cinebench R15 - Cinebench R15 OpenGL 64 Bit
min: 10.28 avg: 13.2 median: 13.9 (1%) max: 14.59 fps
Cinebench R15 OpenGL 64 Bit + Intel HD Graphics 5000
min: 24.15 avg: 27.4 median: 27.4 (2%) max: 30.64 fps
Cinebench R15 OpenGL 64 Bit + Intel HD Graphics (Cherry Trail)
min: 6.64 avg: 10.3 median: 9.7 (1%) max: 15.52 fps
Cinebench R15 OpenGL Ref. Match 64 Bit + Intel HD Graphics (Haswell) Cinebench R15 - Cinebench R15 OpenGL Ref. Match 64 Bit
98 % (98%)
Cinebench R15 OpenGL Ref. Match 64 Bit + Intel HD Graphics 5000
min: 63.3 avg: 81.1 median: 80.7 (81%) max: 99.6 %
Cinebench R15 OpenGL Ref. Match 64 Bit + Intel HD Graphics (Cherry Trail)
min: 98 avg: 98 median: 98 (98%) max: 98.6 %
GFXBench - GFXBench Car Chase Offscreen
11.6 fps (1%)
min: 6.3 avg: 7.3 median: 7 (1%) max: 9 fps
GFXBench 3.1 - GFXBench Manhattan ES 3.1 Offscreen
20.1 fps (0%)
min: 9.2 avg: 10.8 median: 11 (0%) max: 13 fps
GFXBench 3.0 - GFXBench 3.0 Manhattan Offscreen
28.7 fps (2%)
22.5 fps (1%)
min: 8.4 avg: 13.8 median: 13.5 (1%) max: 18 fps
GFXBench (DX / GLBenchmark) 2.7 + Intel HD Graphics (Haswell) GFXBench (DX / GLBenchmark) 2.7 - GFXBench T-Rex HD Offscreen C24Z16
53.5 fps (0%)
GFXBench T-Rex HD Offscreen C24Z16 + Intel HD Graphics 5000
min: 62 avg: 72.5 median: 72.5 (1%) max: 83 fps
GFXBench T-Rex HD Offscreen C24Z16 + Intel HD Graphics (Cherry Trail) min: 22 avg: 30.5 median: 32 (0%) max: 38.5 fps
LuxMark v2.0 64Bit - LuxMark v2.0 Room GPU
min: 77 avg: 93 median: 93 (0%) max: 109 Samples/s
min: 139 avg: 187 median: 201 (1%) max: 221 Samples/s
min: 48 avg: 58.7 median: 59 (0%) max: 69 Samples/s
LuxMark v2.0 64Bit - LuxMark v2.0 Sala GPU
min: 115 avg: 140 median: 140 (0%) max: 165 Samples/s
min: 286 avg: 305.3 median: 306 (1%) max: 324 Samples/s
min: 69 avg: 87.7 median: 89 (0%) max: 105 Samples/s
ComputeMark v2.1 - ComputeMark v2.1 Result
min: 355 avg: 370 median: 370 (0%) max: 385 Points
min: 775 avg: 817 median: 816.5 (1%) max: 858 Points
277 Points (0%)
Power Consumption - Furmark Stress Test Power Consumption - external Monitor *
43.7 Watt (6%)
Power Consumption - The Witcher 3 Power Consumption - external Monitor *
30.5 Watt (4%)
Average Benchmarks Intel HD Graphics (Haswell) → 100% n=18 Average Benchmarks Intel HD Graphics 5000 → 173% n=18 Average Benchmarks Intel HD Graphics (Cherry Trail) → 64% n=18
- Range of benchmark values for this graphics card
- Average benchmark values for this graphics card
* Smaller numbers mean a higher performance
1 This benchmark is not used for the average calculation
Game Benchmarks The following benchmarks stem from our benchmarks of review laptops. The performance depends on the used graphics memory, clock rate, processor, system settings, drivers, and operating systems. So the results don't have to be representative for all laptops with this GPU. For detailed information on the benchmark results, click on the fps number.
HD Graphics (Haswell):
0 (!) [X] MSI CX61 2QC 2970M MS-16GD Intel Celeron 2970M 2.2GHz
HD Graphics (Haswell)
fps
100%
HD Graphics (Haswell):
4.9 (!) [X] MSI CX61 2QC 2970M MS-16GD Intel Celeron 2970M 2.2GHz
HD Graphics (Haswell)
min:
1 fps, max:
7 fps
fps
100%
HD Graphics (Haswell):
14.3 [X] MSI CX61 2QC 2970M MS-16GD Intel Celeron 2970M 2.2GHz
HD Graphics (Haswell)
fps
100%
HD Graphics (Haswell):
8 [X] MSI CX61 2QC 2970M MS-16GD Intel Celeron 2970M 2.2GHz
HD Graphics (Haswell)
fps
100%
HD Graphics (Haswell):
5.9 [X] MSI CX61 2QC 2970M MS-16GD Intel Celeron 2970M 2.2GHz
HD Graphics (Haswell)
min:
5 fps, max:
7 fps
fps
100%
HD Graphics (Haswell):
13 [X] MSI CX61 2QC 2970M MS-16GD Intel Celeron 2970M 2.2GHz
HD Graphics (Haswell)
min:
7 fps, max:
13 fps
fps
100%
HD Graphics (Haswell):
62 [X] MSI CX61 2QC 2970M MS-16GD Intel Celeron 2970M 2.2GHz
HD Graphics (Haswell)
min:
54 fps
fps
35%
HD Graphics (Cherry Trail):
21.4 fps
100%
HD Graphics (Haswell):
28.6 [X] MSI CX61 2QC 2970M MS-16GD Intel Celeron 2970M 2.2GHz
HD Graphics (Haswell)
min:
19 fps
fps
100%
HD Graphics (Haswell):
16.4 [X] MSI CX61 2QC 2970M MS-16GD Intel Celeron 2970M 2.2GHz
HD Graphics (Haswell)
min:
14 fps, max:
19 fps
fps
100%
HD Graphics (Haswell):
45.1 [X] MSI CX61 2QC 2970M MS-16GD Intel Celeron 2970M 2.2GHz
HD Graphics (Haswell)
min:
37 fps, max:
54 fps
fps
34%
HD Graphics (Cherry Trail):
15.5 fps
100%
HD Graphics (Haswell):
15.9 [X] MSI CX61 2QC 2970M MS-16GD Intel Celeron 2970M 2.2GHz
HD Graphics (Haswell)
min:
13 fps, max:
19 fps
fps
HD Graphics (Haswell):
0 (!) [X] MSI CX61 2QC 2970M MS-16GD Intel Celeron 2970M 2.2GHz
HD Graphics (Haswell)
fps
100%
HD Graphics (Haswell):
17.8 [X] MSI CX61 2QC 2970M MS-16GD Intel Celeron 2970M 2.2GHz
HD Graphics (Haswell)
min:
15 fps, max:
21 fps
fps
100%
HD Graphics (Haswell):
38.6 [X] MSI CX61 2QC 2970M MS-16GD Intel Celeron 2970M 2.2GHz
HD Graphics (Haswell)
min:
35 fps, max:
52 fps
fps
59%
HD Graphics (Cherry Trail):
22.6 [X] Chuwi Hi12 Intel Atom x5-Z8300 1.4GHz
HD Graphics (Cherry Trail)
min:
21 fps, max:
27 fps
fps
100%
HD Graphics (Haswell):
21.6 [X] MSI CX61 2QC 2970M MS-16GD Intel Celeron 2970M 2.2GHz
HD Graphics (Haswell)
min:
19 fps, max:
28 fps
fps
100%
HD Graphics (Haswell):
6.3 [X] MSI CX61 2QC 2970M MS-16GD Intel Celeron 2970M 2.2GHz
HD Graphics (Haswell)
min:
5 fps, max:
8 fps
fps
100%
HD Graphics (Haswell):
14.1 [X] MSI CX61 2QC 2970M MS-16GD Intel Celeron 2970M 2.2GHz
HD Graphics (Haswell)
min:
12 fps, max:
15 fps
fps
100%
HD Graphics (Haswell):
12.4 [X] MSI CX61 2QC 2970M MS-16GD Intel Celeron 2970M 2.2GHz
HD Graphics (Haswell)
min:
11 fps, max:
14 fps
fps
100%
HD Graphics (Haswell):
7.1 [X] MSI CX61 2QC 2970M MS-16GD Intel Celeron 2970M 2.2GHz
HD Graphics (Haswell)
min:
6 fps, max:
8 fps
fps
100%
HD Graphics (Haswell):
26.1 [X] MSI CX61 2QC 2970M MS-16GD Intel Celeron 2970M 2.2GHz
HD Graphics (Haswell)
min:
19 fps, max:
33 fps
fps
100%
HD Graphics (Haswell):
16.3 [X] MSI CX61 2QC 2970M MS-16GD Intel Celeron 2970M 2.2GHz
HD Graphics (Haswell)
min:
12 fps, max:
21 fps
fps
HD Graphics (Haswell):
0 (!) [X] MSI CX61 2QC 2970M MS-16GD Intel Celeron 2970M 2.2GHz
HD Graphics (Haswell)
fps
100%
HD Graphics (Haswell):
6 [X] MSI CX61 2QC 2970M MS-16GD Intel Celeron 2970M 2.2GHz
HD Graphics (Haswell)
min:
3 fps, max:
9 fps
fps
100%
HD Graphics (Haswell):
8.5 [X] MSI CX61 2QC 2970M MS-16GD Intel Celeron 2970M 2.2GHz
HD Graphics (Haswell)
min:
6 fps, max:
11 fps
fps
100%
HD Graphics (Haswell):
9 [X] MSI CX61 2QC 2970M MS-16GD Intel Celeron 2970M 2.2GHz
HD Graphics (Haswell)
min:
8 fps, max:
11 fps
fps
100%
HD Graphics (Haswell):
9.4 [X] MSI CX61 2QC 2970M MS-16GD Intel Celeron 2970M 2.2GHz
HD Graphics (Haswell)
min:
8 fps, max:
11 fps
fps
100%
HD Graphics (Haswell):
5.3 [X] MSI CX61 2QC 2970M MS-16GD Intel Celeron 2970M 2.2GHz
HD Graphics (Haswell)
fps
100%
HD Graphics (Haswell):
2.5 [X] MSI CX61 2QC 2970M MS-16GD Intel Celeron 2970M 2.2GHz
HD Graphics (Haswell)
fps
100%
HD Graphics (Haswell):
1.8 [X] MSI CX61 2QC 2970M MS-16GD Intel Celeron 2970M 2.2GHz
HD Graphics (Haswell)
fps
100%
HD Graphics (Haswell):
13.7 [X] MSI CX61 2QC 2970M MS-16GD Intel Celeron 2970M 2.2GHz
HD Graphics (Haswell)
min:
5 fps, max:
75 fps
fps
84%
HD Graphics (Cherry Trail):
11.5 fps
100%
HD Graphics (Haswell):
8.9 [X] MSI CX61 2QC 2970M MS-16GD Intel Celeron 2970M 2.2GHz
HD Graphics (Haswell)
min:
4 fps, max:
65 fps
fps
79%
HD Graphics (Cherry Trail):
7 fps
100%
HD Graphics (Haswell):
11.7 [X] MSI CX61 2QC 2970M MS-16GD Intel Celeron 2970M 2.2GHz
HD Graphics (Haswell)
min:
10 fps, max:
14 fps
fps
HD Graphics (Haswell):
0 (!) [X] MSI CX61 2QC 2970M MS-16GD Intel Celeron 2970M 2.2GHz
HD Graphics (Haswell)
fps
HD Graphics (Cherry Trail):
8.8 fps
HD Graphics (Cherry Trail):
4.8 fps
HD Graphics (Cherry Trail):
8.1 fps
HD Graphics (Cherry Trail):
3.9 fps
100%
HD Graphics (Haswell):
41.4 [X] MSI CX61 2QC 2970M MS-16GD Intel Celeron 2970M 2.2GHz
HD Graphics (Haswell)
min:
21 fps, max:
51 fps
fps
36%
HD Graphics (Cherry Trail):
13.9 [X] Chuwi Hi12 Intel Atom x5-Z8300 1.4GHz
HD Graphics (Cherry Trail)
min:
7 fps, max:
19 fps
16.8 ~ 15 fps
100%
HD Graphics (Haswell):
24.1 [X] MSI CX61 2QC 2970M MS-16GD Intel Celeron 2970M 2.2GHz
HD Graphics (Haswell)
min:
11 fps, max:
35 fps
fps
100%
HD Graphics (Haswell):
11.4 [X] MSI CX61 2QC 2970M MS-16GD Intel Celeron 2970M 2.2GHz
HD Graphics (Haswell)
min:
5 fps, max:
18 fps
fps
HD Graphics (Cherry Trail):
15.1 fps
HD Graphics (Cherry Trail):
9.8 fps
HD Graphics (Cherry Trail):
20 [X] Chuwi Hi12 Intel Atom x5-Z8300 1.4GHz
HD Graphics (Cherry Trail)
min:
18 fps
fps
HD Graphics (Cherry Trail):
15.2 [X] Chuwi Hi12 Intel Atom x5-Z8300 1.4GHz
HD Graphics (Cherry Trail)
min:
13 fps
fps
HD Graphics (Cherry Trail):
7.2 [X] Chuwi Hi12 Intel Atom x5-Z8300 1.4GHz
HD Graphics (Cherry Trail)
min:
6 fps
fps
100%
HD Graphics (Haswell):
8.9 [X] MSI CX61 2QC 2970M MS-16GD Intel Celeron 2970M 2.2GHz
HD Graphics (Haswell)
min:
5 fps, max:
12 fps
fps
100%
HD Graphics (Haswell):
5.2 [X] MSI CX61 2QC 2970M MS-16GD Intel Celeron 2970M 2.2GHz
HD Graphics (Haswell)
min:
3 fps, max:
8 fps
5.8 ~ 6 fps
100%
HD Graphics (Haswell):
3.1 fps
100%
HD Graphics (Haswell):
52.4 fps
38%
HD Graphics (Cherry Trail):
20.1 fps
100%
HD Graphics (Haswell):
12.8 fps
98%
HD Graphics (Cherry Trail):
12.5 fps
HD Graphics 5000:
19.2 fps
HD Graphics (Cherry Trail):
10.8 (!) [X] Microsoft Surface 3 Intel Atom x7-Z8700 1.6GHz
HD Graphics (Cherry Trail)
fps
100%
HD Graphics (Haswell):
15.9 fps
131%
HD Graphics 5000:
20.8 fps
100%
HD Graphics (Haswell):
11.2 fps
135%
HD Graphics 5000:
15.1 fps
100%
HD Graphics (Haswell):
7.7 fps
165%
HD Graphics 5000:
12.7 fps
100%
HD Graphics (Haswell):
5.7 fps
168%
HD Graphics 5000:
9.6 fps
100%
HD Graphics (Haswell):
9.7 fps
163%
HD Graphics 5000:
15.8 fps
100%
HD Graphics (Haswell):
8.4 fps
126%
HD Graphics 5000:
10.6 fps
100%
HD Graphics (Haswell):
10.9 fps
160%
HD Graphics 5000:
17.4 fps
87%
HD Graphics (Cherry Trail):
9.5 fps
100%
HD Graphics (Haswell):
7 fps
171%
HD Graphics 5000:
12 fps
81%
HD Graphics (Cherry Trail):
5.7 fps
HD Graphics 5000:
14.3 fps
HD Graphics 5000:
10.6 fps
HD Graphics 5000:
25.4 fps
HD Graphics 5000:
16.2 fps
HD Graphics 5000:
15.5 fps
HD Graphics (Cherry Trail):
16.2 fps
HD Graphics 5000:
12.2 fps
HD Graphics (Cherry Trail):
6.1 fps
100%
HD Graphics (Haswell):
31 fps
165%
HD Graphics 5000:
51 fps
52%
HD Graphics (Cherry Trail):
16 fps
100%
HD Graphics (Haswell):
20 fps
175%
HD Graphics 5000:
35 fps
60%
HD Graphics (Cherry Trail):
12 fps
HD Graphics 5000:
14.2 fps
HD Graphics 5000:
10.6 fps
100%
HD Graphics (Haswell):
9 fps
163%
HD Graphics 5000:
14.7 fps
100%
HD Graphics (Haswell):
5.8 fps
159%
HD Graphics 5000:
9.2 fps
100%
HD Graphics (Haswell):
21.6 fps
134%
HD Graphics 5000:
28.9 fps
100%
HD Graphics (Haswell):
12.9 fps
162%
HD Graphics 5000:
20.9 fps
HD Graphics 5000:
11.4 fps
100%
HD Graphics (Haswell):
13.5 fps
149%
HD Graphics 5000:
20.1 fps
100%
HD Graphics (Haswell):
8.3 fps
157%
HD Graphics 5000:
13 fps
100%
HD Graphics (Haswell):
16.4 fps
221%
HD Graphics 5000:
36.2 fps
95%
HD Graphics (Cherry Trail):
15.6 fps
100%
HD Graphics (Haswell):
11.3 fps
249%
HD Graphics 5000:
28.1 fps
HD Graphics 5000:
17.4 fps
100%
HD Graphics (Haswell):
123.6 fps
136%
HD Graphics 5000:
168.3 fps
100%
HD Graphics (Haswell):
26.2 fps
125%
HD Graphics 5000:
32.8 fps
HD Graphics 5000:
14.2 fps
HD Graphics (Cherry Trail):
5.5 10 ~ 8 fps
100%
HD Graphics (Haswell):
13.3 fps
216%
HD Graphics 5000:
28.7 fps
100%
HD Graphics (Haswell):
9.7 fps
181%
HD Graphics 5000:
17.6 fps
100%
HD Graphics (Haswell):
58.2 fps
147%
HD Graphics 5000:
85.7 fps
43%
HD Graphics (Cherry Trail):
22 27.3 ~ 25 fps
100%
HD Graphics (Haswell):
19.6 fps
154%
HD Graphics 5000:
30.2 fps
66%
HD Graphics (Cherry Trail):
12.5 13.5 ~ 13 fps
HD Graphics 5000:
14.9 fps
HD Graphics 5000:
12.5 fps
100%
HD Graphics (Haswell):
2.2 fps
818%
HD Graphics 5000:
17 18.1 ~ 18 fps
100%
HD Graphics (Haswell):
19.9 fps
137%
HD Graphics 5000:
27.2 fps
100%
HD Graphics (Haswell):
14 fps
158%
HD Graphics 5000:
22.1 fps
HD Graphics 5000:
10.7 fps
100%
HD Graphics (Haswell):
35.2 fps
100%
HD Graphics (Haswell):
13.6 fps
100%
HD Graphics (Haswell):
9 fps
100%
HD Graphics (Haswell):
23.1 fps
144%
HD Graphics 5000:
33.2 fps
100%
HD Graphics (Haswell):
13.7 fps
147%
HD Graphics 5000:
20.2 fps
HD Graphics 5000:
13.2 fps
100%
HD Graphics (Haswell):
10.1 fps
129%
HD Graphics 5000:
11.9 14.8 ~ 13 fps
100%
HD Graphics (Haswell):
5.7 fps
158%
HD Graphics 5000:
8.4 9.7 ~ 9 fps
100%
HD Graphics (Haswell):
22.1 fps
100%
HD Graphics (Haswell):
13 fps
100%
HD Graphics (Haswell):
11.1 fps
HD Graphics 5000:
20.5 fps
100%
HD Graphics (Haswell):
12.8 27.8 [X] MSI CX61 2QC 2970M MS-16GD Intel Celeron 2970M 2.2GHz
HD Graphics (Haswell)
~ 20 fps
143%
HD Graphics 5000:
28.6 fps
67%
HD Graphics (Cherry Trail):
13.3 fps
100%
HD Graphics (Haswell):
10 18.2 [X] MSI CX61 2QC 2970M MS-16GD Intel Celeron 2970M 2.2GHz
HD Graphics (Haswell)
~ 14 fps
142%
HD Graphics 5000:
19.9 fps
100%
HD Graphics (Haswell):
11.8 [X] MSI CX61 2QC 2970M MS-16GD Intel Celeron 2970M 2.2GHz
HD Graphics (Haswell)
fps
113%
HD Graphics 5000:
13.3 fps
100%
HD Graphics (Haswell):
3.9 [X] MSI CX61 2QC 2970M MS-16GD Intel Celeron 2970M 2.2GHz
HD Graphics (Haswell)
fps
100%
HD Graphics (Haswell):
21 fps
100%
HD Graphics (Haswell):
12 fps
100%
HD Graphics (Haswell):
27 fps
189%
HD Graphics 5000:
51 fps
100%
HD Graphics (Haswell):
18 fps
189%
HD Graphics 5000:
34 fps
100%
HD Graphics (Haswell):
14 fps
200%
HD Graphics 5000:
28 fps
HD Graphics 5000:
165.1 fps
100%
HD Graphics (Haswell):
57.7 fps
174%
HD Graphics 5000:
100.2 fps
100%
HD Graphics (Haswell):
37 fps
193%
HD Graphics 5000:
71.4 fps
HD Graphics 5000:
39.3 fps
100%
HD Graphics (Haswell):
22.4 fps
178%
HD Graphics 5000:
39.8 fps
100%
HD Graphics (Haswell):
16.9 fps
174%
HD Graphics 5000:
29.4 fps
HD Graphics 5000:
21.6 fps
100%
HD Graphics (Haswell):
14 fps
100%
HD Graphics (Haswell):
7.8 fps
100%
HD Graphics (Haswell):
15.9 fps
100%
HD Graphics (Haswell):
8.9 fps
100%
HD Graphics (Haswell):
14.2 fps
100%
HD Graphics (Haswell):
11.5 fps
HD Graphics (Cherry Trail):
58 fps
HD Graphics (Cherry Trail):
47 fps
100%
HD Graphics (Haswell):
36.9 fps
176%
HD Graphics 5000:
59.6 69.8 ~ 65 fps
80%
HD Graphics (Cherry Trail):
29.7 fps
100%
HD Graphics (Haswell):
24.2 fps
140%
HD Graphics 5000:
31.5 36.8 ~ 34 fps
68%
HD Graphics (Cherry Trail):
16.5 fps
100%
HD Graphics (Haswell):
7.2 fps
185%
HD Graphics 5000:
13.3 fps
HD Graphics 5000:
10.4 fps
100%
HD Graphics (Haswell):
38 38.5 ~ 38 fps
154%
HD Graphics 5000:
58.6 fps
63%
HD Graphics (Cherry Trail):
24 fps
100%
HD Graphics (Haswell):
18.6 19.6 ~ 19 fps
165%
HD Graphics 5000:
31.3 fps
71%
HD Graphics (Cherry Trail):
13.5 fps
100%
HD Graphics (Haswell):
13.2 fps
172%
HD Graphics 5000:
22.7 fps
HD Graphics 5000:
12.5 fps
100%
HD Graphics (Haswell):
11.2 fps
170%
HD Graphics 5000:
18.8 18.9 ~ 19 fps
100%
HD Graphics (Haswell):
23 32.8 [X] MSI CX61 2QC 2970M MS-16GD Intel Celeron 2970M 2.2GHz
HD Graphics (Haswell)
~ 28 fps
125%
HD Graphics 5000:
32 [X] Dell XPS 12 Haswell Intel Core i7-4650U 1.7GHz
HD Graphics 5000
34.3 34.3 38.3 ~ 35 fps
68%
HD Graphics (Cherry Trail):
16 18 18.9 [X] Medion Akoya E2215T Intel Atom x5-Z8350 1.4GHz
HD Graphics (Cherry Trail)
19.8 20.1 20.5 ~ 19 fps
100%
HD Graphics (Haswell):
10.3 14.2 [X] MSI CX61 2QC 2970M MS-16GD Intel Celeron 2970M 2.2GHz
HD Graphics (Haswell)
~ 12 fps
167%
HD Graphics 5000:
17 [X] Dell XPS 12 Haswell Intel Core i7-4650U 1.7GHz
HD Graphics 5000
20.1 20.9 22.5 ~ 20 fps
75%
HD Graphics (Cherry Trail):
6.4 7.9 [X] Medion Akoya E2215T Intel Atom x5-Z8350 1.4GHz
HD Graphics (Cherry Trail)
9.3 9.8 10 10 ~ 9 fps
100%
HD Graphics (Haswell):
11.9 [X] MSI CX61 2QC 2970M MS-16GD Intel Celeron 2970M 2.2GHz
HD Graphics (Haswell)
fps
134%
HD Graphics 5000:
14 [X] Dell XPS 12 Haswell Intel Core i7-4650U 1.7GHz
HD Graphics 5000
14.2 16.6 18.2 ~ 16 fps
59%
HD Graphics (Cherry Trail):
5.6 5.7 [X] Medion Akoya E2215T Intel Atom x5-Z8350 1.4GHz
HD Graphics (Cherry Trail)
6.7 7.6 7.9 8.4 ~ 7 fps
100%
HD Graphics (Haswell):
3.7 [X] MSI CX61 2QC 2970M MS-16GD Intel Celeron 2970M 2.2GHz
HD Graphics (Haswell)
fps
208%
HD Graphics 5000:
7.7 fps
54%
HD Graphics (Cherry Trail):
2.4 2.6 ~ 2 fps
100%
HD Graphics (Haswell):
96.5 fps
100%
HD Graphics (Haswell):
28.3 fps
100%
HD Graphics (Haswell):
15 fps
100%
HD Graphics (Haswell):
59.6 fps
100%
HD Graphics (Haswell):
11.2 fps
177%
HD Graphics 5000:
44 [X] Dell XPS 12 Haswell Intel Core i7-4650U 1.7GHz
HD Graphics 5000
52.5 53.9 54.3 55.3 56 ~ 53 fps
186%
HD Graphics 5000:
23 [X] Dell XPS 12 Haswell Intel Core i7-4650U 1.7GHz
HD Graphics 5000
25 26 27.5 28.3 28.6 ~ 26 fps
200%
HD Graphics 5000:
14 14.9 15 [X] Dell XPS 12 Haswell Intel Core i7-4650U 1.7GHz
HD Graphics 5000
15.8 17.4 17.5 ~ 16 fps
100%
HD Graphics (Cherry Trail):
7 8.3 9 ~ 8 fps
HD Graphics 5000:
7.9 8 [X] Dell XPS 12 Haswell Intel Core i7-4650U 1.7GHz
HD Graphics 5000
9.5 ~ 8 fps
HD Graphics (Cherry Trail):
3.7 3.8 ~ 4 fps
100%
HD Graphics (Haswell):
12.2 fps
171%
HD Graphics 5000:
20.9 fps
100%
HD Graphics (Haswell):
7.6 fps
171%
HD Graphics 5000:
13 fps
100%
HD Graphics (Haswell):
38.7 fps
100%
HD Graphics (Haswell):
17.7 fps
100%
HD Graphics (Haswell):
13.1 fps
HD Graphics (Cherry Trail):
34 fps
100%
HD Graphics (Haswell):
18.7 fps
153%
HD Graphics 5000:
28.6 fps
100%
HD Graphics (Haswell):
11.4 fps
168%
HD Graphics 5000:
19.2 fps
HD Graphics 5000:
16.6 fps
HD Graphics 5000:
11.2 fps
100%
HD Graphics (Haswell):
12.3 fps
181%
HD Graphics 5000:
22.3 fps
100%
HD Graphics (Haswell):
9.9 fps
159%
HD Graphics 5000:
15.7 fps
100%
HD Graphics (Haswell):
25.6 fps
158%
HD Graphics 5000:
40.5 fps
100%
HD Graphics (Haswell):
17.6 fps
159%
HD Graphics 5000:
28 fps
HD Graphics 5000:
14.1 fps
100%
HD Graphics (Haswell):
22.3 fps
68%
HD Graphics (Cherry Trail):
15.2 fps
100%
HD Graphics (Haswell):
16.8 fps
69%
HD Graphics (Cherry Trail):
11.6 fps
HD Graphics (Cherry Trail):
0 (!) [X] Microsoft Surface 3 Intel Atom x7-Z8700 1.6GHz
HD Graphics (Cherry Trail)
fps
HD Graphics (Cherry Trail):
0 (!) [X] Microsoft Surface 3 Intel Atom x7-Z8700 1.6GHz
HD Graphics (Cherry Trail)
fps
100%
HD Graphics (Haswell):
46.2 fps
100%
HD Graphics (Haswell):
34.7 fps
100%
HD Graphics (Haswell):
22.5 fps
90%
HD Graphics (Cherry Trail):
20.3 fps
HD Graphics (Cherry Trail):
11.4 fps
100%
HD Graphics (Haswell):
31 fps
100%
HD Graphics (Haswell):
18.8 fps
100%
HD Graphics (Haswell):
11.7 fps
100%
HD Graphics (Haswell):
36.9 fps
154%
HD Graphics 5000:
54 58 59 [X] Dell XPS 12 Haswell Intel Core i7-4650U 1.7GHz
HD Graphics 5000
~ 57 fps
76%
HD Graphics (Cherry Trail):
24.3 [X] Chuwi Hi12 Intel Atom x5-Z8300 1.4GHz
HD Graphics (Cherry Trail)
min:
20 fps, max:
29 fps
31.9 ~ 28 fps
100%
HD Graphics (Haswell):
23 fps
174%
HD Graphics 5000:
38 [X] Dell XPS 12 Haswell Intel Core i7-4650U 1.7GHz
HD Graphics 5000
42 ~ 40 fps
78%
HD Graphics (Cherry Trail):
16 [X] Chuwi Hi12 Intel Atom x5-Z8300 1.4GHz
HD Graphics (Cherry Trail)
min:
13 fps, max:
19 fps
19 ~ 18 fps
100%
HD Graphics (Haswell):
19.5 fps
164%
HD Graphics 5000:
31 [X] Dell XPS 12 Haswell Intel Core i7-4650U 1.7GHz
HD Graphics 5000
32 ~ 32 fps
HD Graphics 5000:
13 19 21 [X] Dell XPS 12 Haswell Intel Core i7-4650U 1.7GHz
HD Graphics 5000
~ 18 fps
100%
HD Graphics (Haswell):
12.5 fps
100%
HD Graphics (Haswell):
36 fps
164%
HD Graphics 5000:
57.8 59.2 61 [X] Dell XPS 12 Haswell Intel Core i7-4650U 1.7GHz
HD Graphics 5000
~ 59 fps
100%
HD Graphics (Haswell):
16 fps
200%
HD Graphics 5000:
30 [X] Dell XPS 12 Haswell Intel Core i7-4650U 1.7GHz
HD Graphics 5000
32.2 32.8 ~ 32 fps
100%
HD Graphics (Haswell):
9.8 fps
184%
HD Graphics 5000:
16.2 18 [X] Dell XPS 12 Haswell Intel Core i7-4650U 1.7GHz
HD Graphics 5000
20.1 ~ 18 fps
82%
HD Graphics (Cherry Trail):
8 fps
HD Graphics 5000:
9 [X] Dell XPS 12 Haswell Intel Core i7-4650U 1.7GHz
HD Graphics 5000
fps
100%
HD Graphics (Haswell):
21.7 22.2 ~ 22 fps
134%
HD Graphics 5000:
29.5 fps
77%
HD Graphics (Cherry Trail):
15.5 18.9 ~ 17 fps
100%
HD Graphics (Haswell):
11.2 11.3 ~ 11 fps
167%
HD Graphics 5000:
18.4 fps
73%
HD Graphics (Cherry Trail):
7.2 8.5 ~ 8 fps
100%
HD Graphics (Haswell):
6.8 fps
171%
HD Graphics 5000:
11.6 fps
100%
HD Graphics (Haswell):
36.8 fps
70%
HD Graphics (Cherry Trail):
25.6 fps
100%
HD Graphics (Haswell):
16.7 fps
72%
HD Graphics (Cherry Trail):
12 fps
100%
HD Graphics (Haswell):
51.9 fps
54%
HD Graphics (Cherry Trail):
28.1 fps
100%
HD Graphics (Haswell):
27.4 fps
46%
HD Graphics (Cherry Trail):
12.5 fps
100%
HD Graphics (Haswell):
14.8 fps
100%
HD Graphics (Haswell):
49.2 fps
180%
HD Graphics 5000:
88.8 fps
HD Graphics (Cherry Trail):
18.7 fps
HD Graphics 5000:
126 169 [X] Dell XPS 12 Haswell Intel Core i7-4650U 1.7GHz
HD Graphics 5000
~ 148 fps
HD Graphics (Cherry Trail):
63.2 64 ~ 64 fps
HD Graphics 5000:
38 43 [X] Dell XPS 12 Haswell Intel Core i7-4650U 1.7GHz
HD Graphics 5000
~ 41 fps
HD Graphics (Cherry Trail):
18 18.8 ~ 18 fps
HD Graphics 5000:
24 26 [X] Dell XPS 12 Haswell Intel Core i7-4650U 1.7GHz
HD Graphics 5000
~ 25 fps
HD Graphics (Cherry Trail):
14 fps
HD Graphics 5000:
10 16 [X] Dell XPS 12 Haswell Intel Core i7-4650U 1.7GHz
HD Graphics 5000
~ 13 fps
HD Graphics (Cherry Trail):
7 fps
100%
HD Graphics (Haswell):
28 fps
100%
HD Graphics (Haswell):
21.2 fps
100%
HD Graphics (Haswell):
42.6 fps
100%
HD Graphics (Haswell):
17.8 fps
100%
HD Graphics (Haswell):
113 fps
100%
HD Graphics (Haswell):
45.1 fps
100%
HD Graphics (Haswell):
93.7 fps
173%
HD Graphics 5000:
162 fps
50%
HD Graphics (Cherry Trail):
44 50.9 [X] Chuwi Hi12 Intel Atom x5-Z8300 1.4GHz
HD Graphics (Cherry Trail)
min:
40 fps, max:
60 fps
~ 47 fps
100%
HD Graphics (Haswell):
39.2 fps
199%
HD Graphics 5000:
78 fps
47%
HD Graphics (Cherry Trail):
18.3 [X] Chuwi Hi12 Intel Atom x5-Z8300 1.4GHz
HD Graphics (Cherry Trail)
min:
13 fps, max:
29 fps
fps
Average Gaming Intel HD Graphics (Haswell) → 100% Average Gaming 30-70 fps → 100%
Average Gaming Intel HD Graphics 5000 → 174% Average Gaming 30-70 fps → 166%
Average Gaming Intel HD Graphics (Cherry Trail) → 68% Average Gaming 30-70 fps → 50%
For more games that might be playable and a list of all games and graphics cards visit our Gaming List
v1.26
log 19. 05:09:07
#0 checking url part for id 4622 +0s ... 0s
#1 checking url part for id 4574 +0s ... 0s
#2 checking url part for id 6197 +0s ... 0s
#3 not redirecting to Ajax server +0s ... 0s
#4 did not recreate cache, as it is less than 5 days old! Created at Tue, 16 Apr 2024 05:39:00 +0200 +0.001s ... 0.001s
#5 composed specs +0.178s ... 0.18s
#6 did output specs +0s ... 0.18s
#7 start showIntegratedCPUs +0s ... 0.18s
#8 getting avg benchmarks for device 4622 +0.079s ... 0.259s
#9 got single benchmarks 4622 +0.044s ... 0.302s
#10 getting avg benchmarks for device 4574 +0.021s ... 0.323s
#11 got single benchmarks 4574 +0.028s ... 0.351s
#12 getting avg benchmarks for device 6197 +0.015s ... 0.367s
#13 got single benchmarks 6197 +0.079s ... 0.445s
#14 got avg benchmarks for devices +0s ... 0.445s
#15 min, max, avg, median took s +0.525s ... 0.971s
#16 before gaming benchmark output +0s ... 0.971s
#17 Got 515 rows for game benchmarks. +0.053s ... 1.024s
#18 composed SQL query for gamebenchmarks +0s ... 1.024s
#19 got data and put it in $dataArray +0.075s ... 1.1s
#20 benchmarks composed for output. +0.241s ... 1.341s
#21 calculated avg scores. +0s ... 1.341s
#22 return log +0.004s ... 1.344s
Please share our article, every link counts!
Redaktion, 2017-09- 8 (Update: 2023-07- 1)
 Deutsch
 English
 Español
 Français
 Italiano
 Nederlands
 Polski
 Português
 Русский
 Türkçe
 Svenska
 Chinese
 Magyar