Intel HD Graphics (Bay Trail) vs Intel HD Graphics (Cherry Trail) vs Intel HD Graphics 3000
Intel HD Graphics (Bay Trail) ► remove from comparison
The Intel HD Graphics (Bay Trail) is a low-end integrated Bay Trail graphics card found in certain Atom models (Z3770 ), nettops (J2850 ) and notebook SoCs (N3510 ). It supports DirectX 11 and is based on the Ivy Bridge GPU. Clock rates and shader cores, however, are considerably lower.
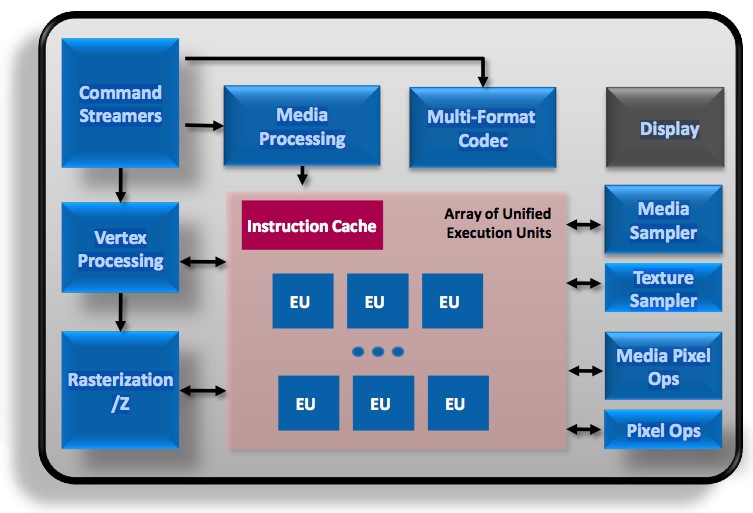
Compared to Ivy Bridge, which offers either 6 or 16 Execution Units, the HD Graphics (Bay Trail) comes with only 4 EUs. The core clock is significantly lower as well. Depending on the specific model, the maximum Turbo Boost is 896 MHz or less and the memory controller can support DDR3(L), DDR3L-RS or LPDDR3 in single- or dual-channel operation.
The fastest notebook models equipped with this GPU nearly match the performance of the HD Graphics (Sandy Bridge) and the AMD Radeon HD 6310 . Therefore, older and less demanding Windows games like World of Warcraft or Half-Life 2 can be played fluently in very low settings. Performance is not sufficient for most modern titles.
Compared to competing ARM SoCs, Bay Trail outperforms the Adreno 320 (which can be found in different Qualcomm SoCs like the Snapdragon 600 ) and offers a performance similar to the Tegra 4 GPU. That is enough power to run even the most demanding Android games smoothly in very high resolutions as of 2013.
The integrated video decoder supports all popular codecs such as MPEG2, H.264, VC1, VP8 and MVC and is suitable for resolutions up to 4K up to 100 Mbit/s. The user can connect up to two displays via HDMI 1.4 (max. 1920 x 1080) or DisplayPort 1.2 (max. 2560 x 1600). Another new feature is the support for Wireless Display and Quick Sync, Intel's fast and power efficient H-264 hardware encoder. Some of these features are not available on all models.
Depending on the model, the power consumption of the entire SoC is somewhere between 2 and 10 W. The most efficient versions are therefore suitable for passively cooled tablets, whereas faster variants are used in larger subnotebooks with active cooling.
Intel HD Graphics (Cherry Trail) ► remove from comparison
The Intel HD Graphics (Cherry Trail) is an integrated graphics card in the Cherry-Trail SoCs (e.g. Atom x7-Z8700). Based on a Broadwell GPU (Intel Gen8) and supports DirectX 11.2. Depending on the SoC offers 12 or 16 EUs.
Atom x7-Z8700: 16 EUs @ 200 - 600 MHz, dual-channel memory
In Windows, gaming is limited to less demanding or quite old games. Using Android, even high end 3D games should run fluently. For example Team Fortress 2 was running on the Surface 3 (x7-Z8700) only in lowest settings and 1280x720 fluently (11 - 69 fps range).
The integrated video decoder is able to display even 4K videos (H.264 tested) fluently.
The Intel HD Graphics GPU in our review sample of the MS Surface 3 (Atom x7-Z8700) only supported DisplayPort 1.1 as it seems, as 4K (3840x2160) with 30 Hz was the maximum Refresh Rate we could achieve (no 60 Hz selectable with the pre-installed drivers).
Intel HD Graphics 3000 ► remove from comparison
The Intel HD Graphics 3000 (or Intel Graphics Media Accelerator HD 3000, GMA HD 3000, Intel HD Graphics 200) is an integrated graphics card in the Sandy Bridge codenamed processors. The HD Graphics 3000 has no dedicated memory but shares the Level 3 / LLC Cache with the CPU cores and also part of the main memory. Due to TurboBoost, the GPU can be overclocked depending on the current CPU load and power consumption. The base speed and the turbo boost speed of the HD Graphics 3000 depend on the processor:
ULV processors Core ix-2xx7 (base 350MHz, Turbo 900-1000MHz) LV processors Core ix-2xx5 (base 500MHz, Turbo 1000MHz) Mainstream and high-end Dual und Quad-Core Core ix-2xx0 (base 650MHz, Turbo 1100-1300MHz) Desktop K processors (base 850, Turbo 1100-1350MHz) The HD 3000 offers 12 Execution Units (EUs) like the old Intel GMA HD but due to architectural changes each EU is now faster. The slower HD Graphics 2000 uses only 6 Execution Units. The EUs can be accessed using DirectX 10.1, OpenGL 3.0 and DirectCompute 4.1. OpenCL is not supported (the media SDK only uses the CPU).
Our performance tests with the high clocked mainstream version of the HD Graphics 3000 in quad-core processors showed a performance level on par with older entry level generations from NVIDIA (e.g. GeForce 310M ) and AMD (HD 5450 ). In comparison with AMD's APU models, the HD 3000 can only compete against the C-and E-series, but not the faster Llano and Trinity models. The quality of the Intel drivers has been improved over the years, so most games are flawlessly playable (if the minimum requirements are fullfilled).
We could measure smooth frame rates in games like Dead Space 3, World of Tanks, Fifa 13, Torchlight 2, Counter-Strike: GO reach, Diablo 3, and many older games, though usually only in minimal detail settings. For accurate performance analysis and gaming benchmarks, read our article "Intel HD Graphics 3000" or scroll down in this article.
Altought 2x Antialiasing (AA) is supported, the chip is as fast as when rendering 4x AA. In the Unigine Valley benchmark a i7-2637M for example reached the same score with 2x AA and 4x AA.
In addition to the GPU, the chip also houses some dedicated units for decoding and encoding HD videos . On the IDF Intel demonstrated the encoding of a 3 minute long 1080p video to an iPhone compatible format in 640x360 in only 14s. Another novelty of the Sandy Bridge GPU is the embedded DisplayPort eDP to connect internal Displays.
Due to the integration in the 32nm built CPU, the power consumption of the GPU should be quite low.
Intel HD Graphics (Bay Trail) Intel HD Graphics (Cherry Trail) Intel HD Graphics 3000 HD Graphics Series Codename Bay Trail Cherry Trail Sandy Bridge Architecture Gen. 7 Ivy Bridge Gen. 8 Gen. 6 Sandy Bridge Pipelines 4 - unified 16 - unified 12 - unified Core Speed 311 - 896 (Boost) MHz 200 - 600 (Boost) MHz 350 - 1350 (Boost) MHz Memory Bus Width 32/64/128 Bit 64/128 Bit 64/128 Bit Shared Memory yes yes yes API DirectX 11, Shader 5.0, OpenGL 4.0, ES 3.0 DirectX 12 (FL 11_1), Shader 5.0, OpenGL 4.3 DirectX 10.1, Shader 4.1, OpenGL 3.0 technology 22 nm 14 nm 32 nm Date of Announcement 11.09.2013 02.03.2015 01.02.2011
CPU in HD Graphics (Bay Trail) GPU Base Speed GPU Boost / Turbo Intel Pentium N3540 4 x 2160 MHz, 7.5 W 313 MHz 896 MHz Intel Pentium J2900 4 x 2410 MHz, 10 W 688 MHz 896 MHz Intel Pentium N3530 4 x 2160 MHz, 7.5 W 313 MHz 896 MHz » show 43 more Intel Pentium J2850 4 x 2400 MHz, 10 W 688 MHz 792 MHz Intel Pentium N3520 4 x 2167 MHz, 7.5 W 313 MHz 854 MHz Intel Celeron J1900 4 x 2000 MHz, 10 W 688 MHz 854 MHz Intel Atom Z3795 4 x 1590 MHz, <4 W 311 MHz 778 MHz Intel Atom Z3785 4 x 1490 MHz, <4 W 313 MHz 833 MHz Intel Atom Z3775 4 x 1460 MHz, <4 W 311 MHz 778 MHz Intel Atom Z3775D 4 x 1490 MHz, <4 W 311 MHz 792 MHz Intel Atom Z3770 4 x 1460 MHz, <4 W 311 MHz 667 MHz Intel Atom Z3770D 4 x 1500 MHz, 4 W 313 MHz 688 MHz Intel Celeron N2940 4 x 1830 MHz, 7.5 W 313 MHz 854 MHz Intel Celeron N2930 4 x 1830 MHz, 7.5 W 313 MHz 854 MHz Intel Celeron J1850 4 x 2000 MHz, 10 W 688 MHz 792 MHz Intel Pentium N3510 4 x 2000 MHz, 7.5 W 313 MHz 750 MHz Intel Celeron N2920 4 x 1860 MHz, 7.5 W 313 MHz 854 MHz Intel Atom E3845 4 x 1910 MHz, 10 W 542 MHz 792 MHz Intel Atom Z3736F 4 x 1330 MHz, 4 W 313 MHz 646 MHz Intel Atom Z3736G 4 x 1330 MHz, <4 W 313 MHz 646 MHz Intel Atom Z3745 4 x 1330 MHz, <4 W 311 MHz 778 MHz Intel Atom Z3745D 4 x 1330 MHz, <4 W 311 MHz 792 MHz Intel Atom Z3740 4 x 1330 MHz, <4 W 311 MHz 667 MHz Intel Atom Z3740D 4 x 1330 MHz, <4 W 313 MHz 688 MHz Intel Atom Z3735D 4 x 1330 MHz, <4 W 311 MHz 646 MHz Intel Atom Z3735E 4 x 1330 MHz, <4 W 311 MHz 646 MHz Intel Atom Z3735F 4 x 1330 MHz, <4 W 311 MHz 646 MHz Intel Atom Z3735G 4 x 1330 MHz, <4 W 311 MHz 646 MHz Intel Celeron J1800 2 x 2410 MHz, 10 W 688 MHz 792 MHz Intel Celeron N2840 2 x 2160 MHz, 7.5 W 313 MHz 792 MHz Intel Celeron J1750 2 x 2410 MHz, 10 W 688 MHz 750 MHz Intel Celeron N2910 4 x 1600 MHz, 7.5 W 313 MHz 756 MHz Intel Celeron N2830 2 x 2160 MHz, 7.5 W 313 MHz 750 MHz Intel Celeron N2820 2 x 2170 MHz, 7.5 W 313 MHz 756 MHz Intel Celeron N2815 2 x 1860 MHz, 7.5 W 313 MHz 756 MHz Intel Celeron N2810 2 x 2000 MHz, 7.5 W 313 MHz 756 MHz Intel Atom Z3680 2 x 1330 MHz, 4 W 311 MHz 667 MHz Intel Atom Z3680D 2 x 1330 MHz, 4 W 313 MHz 688 MHz Intel Celeron N2808 2 x 1580 MHz, 4.3 W 313 MHz 792 MHz Intel Celeron N2807 2 x 1580 MHz, 4.3 W 313 MHz 750 MHz Intel Celeron N2806 2 x 1580 MHz, 4.5 W 313 MHz 756 MHz Intel Atom E3827 2 x 1750 MHz, 8 W 542 MHz 792 MHz Intel Atom E3826 2 x 1460 MHz, 7 W 533 MHz 667 MHz Intel Celeron N2805 2 x 1460 MHz, 4.3 W 313 MHz 667 MHz Intel Atom E3825 2 x 1330 MHz, 6 W ? MHz 533 MHz Intel Atom E3815 1 x 1460 MHz, 5 W ? MHz 400 MHz min. - max. 311 - ? MHz 400 - 896 MHz
CPU in HD Graphics (Cherry Trail) GPU Base Speed GPU Boost / Turbo Intel Atom x7-Z8700 4 x 1600 MHz 200 MHz 600 MHz Intel Atom x5-Z8500 4 x 1440 MHz 200 MHz 600 MHz Intel Atom x5-Z8350 4 x 1440 MHz 200 MHz 500 MHz » show 2 more Intel Atom x5-Z8300 4 x 1440 MHz 200 MHz 500 MHz Intel Atom x5-E8000 4 x 1040 MHz, 5 W 320 MHz ? MHz min. - max. 200 - ? MHz ? - 896 MHz
CPU in HD Graphics 3000 GPU Base Speed GPU Boost / Turbo Intel Core i7-2700K 4 x 3500 MHz, 95 W 850 MHz 1350 MHz Intel Core i7-2600K 4 x 3400 MHz, 95 W 850 MHz 1350 MHz Intel Core i7-2960XM 4 x 2700 MHz, 55 W 650 MHz 1300 MHz » show 41 more Intel Core i7-2860QM 4 x 2500 MHz, 45 W 650 MHz 1300 MHz Intel Core i7-2920XM 4 x 2500 MHz, 55 W 650 MHz 1300 MHz Intel Core i5-2500K 4 x 3300 MHz, 95 W 850 MHz 1100 MHz Intel Core i7-2760QM 4 x 2400 MHz, 45 W 650 MHz 1300 MHz Intel Core i7-2820QM 4 x 2300 MHz, 45 W 650 MHz 1300 MHz Intel Core i7-2720QM 4 x 2200 MHz, 45 W 650 MHz 1300 MHz Intel Core i7-2675QM 4 x 2200 MHz, 45 W 650 MHz 1200 MHz Intel Core i7-2670QM 4 x 2200 MHz, 45 W 650 MHz 1100 MHz Intel Core i7-2635QM 4 x 2000 MHz, 45 W 650 MHz 1200 MHz Intel Core i7-2630QM 4 x 2000 MHz, 45 W 650 MHz 1100 MHz Intel Core i7-2640M 2 x 2800 MHz, 35 W 650 MHz 1300 MHz Intel Core i7-2620M 2 x 2700 MHz, 35 W 650 MHz 1300 MHz Intel Core i5-2540M 2 x 2600 MHz, 35 W 650 MHz 1300 MHz Intel Core i5-2520M 2 x 2500 MHz, 35 W 650 MHz 1300 MHz Intel Core i5-2450M 2 x 2500 MHz, 35 W 650 MHz 1300 MHz Intel Core i5-2435M 2 x 2400 MHz, 35 W 650 MHz 1300 MHz Intel Core i5-2430M 2 x 2400 MHz, 35 W 650 MHz 1200 MHz Intel Core i5-2415M 2 x 2300 MHz, 35 W 650 MHz 1300 MHz Intel Core i5-2410M 2 x 2300 MHz, 35 W 650 MHz 1200 MHz Intel Core i7-2649M 2 x 2300 MHz, 25 W 500 MHz 1100 MHz Intel Core i3-2370M 2 x 2400 MHz, 35 W 650 MHz 1150 MHz Intel Core i3-2350M 2 x 2300 MHz, 35 W 650 MHz 1150 MHz Intel Core i3-2348M 2 x 2300 MHz, 35 W 650 MHz 1150 MHz Intel Core i7-2629M 2 x 2100 MHz, 25 W 500 MHz 1100 MHz Intel Core i7-2677M 2 x 1800 MHz, 17 W 350 MHz 1200 MHz Intel Core i3-2330M 2 x 2200 MHz, 35 W 650 MHz 1100 MHz Intel Core i3-2328M 2 x 2200 MHz, 35 W 650 MHz 1100 MHz Intel Core i7-2637M 2 x 1700 MHz, 17 W 350 MHz 1200 MHz Intel Core i7-2657M 2 x 1600 MHz, 17 W 350 MHz 1000 MHz Intel Core i3-2312M 2 x 2100 MHz, 35 W 350 MHz 1100 MHz Intel Core i3-2310M 2 x 2100 MHz, 35 W 650 MHz 1100 MHz Intel Core i3-2308M 2 x 2100 MHz, 35 W 650 MHz 1100 MHz Intel Core i5-2557M 2 x 1700 MHz, 17 W 350 MHz 1200 MHz Intel Core i7-2617M 2 x 1500 MHz, 17 W 350 MHz 950 MHz Intel Core i5-2467M 2 x 1600 MHz, 17 W 350 MHz 1150 MHz Intel Core i5-2537M 2 x 1400 MHz, 17 W 350 MHz 900 MHz Intel Core i3-2377M 2 x 1500 MHz, 17 W 350 MHz 1000 MHz Intel Core i3-2375M 2 x 1500 MHz, 17 W 350 MHz 1000 MHz Intel Core i3-2367M 2 x 1400 MHz, 17 W 350 MHz 1000 MHz Intel Core i3-2365M 2 x 1400 MHz, 17 W 350 MHz 1000 MHz Intel Core i3-2357M 2 x 1300 MHz, 17 W 350 MHz 950 MHz min. - max. 200 - ? MHz 900 - 1350 MHz
Benchmarks Performance Rating - 3DMark 11 + Fire Strike + Time Spy - HD Graphics (Bay Trail)
0.1 pt (0%)
Intel HD Graphics (Bay Trail)
...
max:
Performance Rating - 3DMark 11 + Fire Strike + Time Spy - HD Graphics (Cherry Trail)
0.1 pt (0%)
Intel HD Graphics (Cherry Trail)
...
max:
3DMark - 3DMark Ice Storm Unlimited Graphics
min: 11835 avg: 14513 median: 14748.5 (2%) max: 17613 Points
min: 18563 avg: 20873 median: 19303 (2%) max: 27537 Points
3DMark - 3DMark Ice Storm Extreme Graphics
min: 4751 avg: 7342 median: 7498 (1%) max: 9234 Points
3DMark - 3DMark Cloud Gate Score
min: 354 avg: 1182 median: 1188 (1%) max: 1703 Points
min: 769 avg: 1454 median: 1488 (2%) max: 1905 Points
min: 2277 avg: 2642 median: 2656.5 (3%) max: 2979 Points
3DMark - 3DMark Cloud Gate Graphics
min: 362 avg: 1230 median: 1228.5 (0%) max: 1670 Points
min: 1537 avg: 1851 median: 1783.5 (0%) max: 2272 Points
min: 2356 avg: 2593 median: 2502.5 (1%) max: 3011 Points
3DMark - 3DMark Fire Strike Standard Score
min: 83 avg: 185 median: 147 (0%) max: 495 Points
min: 174 avg: 390.4 median: 248 (0%) max: 1059 Points
3DMark - 3DMark Fire Strike Standard Graphics
min: 90 avg: 149.1 median: 149 (0%) max: 200 Points
min: 193 avg: 233 median: 225 (0%) max: 281 Points
3DMark - 3DMark Ice Storm Graphics
min: 5056 avg: 15391 median: 16047 (2%) max: 21351 Points
min: 7544 avg: 16078 median: 17063.5 (2%) max: 23395 Points
min: 25494 avg: 29036 median: 27124 (3%) max: 36403 Points
3DMark - 3DMark Sling Shot (ES 3.0) Unlimited
min: 1445 avg: 1525 median: 1525 (7%) max: 1605 Points
3DMark - 3DMark Sling Shot (ES 3.0) Unlimited Graphics
min: 1598 avg: 1684 median: 1684 (4%) max: 1770 Points
3DMark - 3DMark Sling Shot Extreme (ES 3.1) Unlimited
min: 1072 avg: 1215 median: 1159 (6%) max: 1414 Points
3DMark - 3DMark Sling Shot Extreme (ES 3.1) Unlimited Graphics
min: 1058 avg: 1251 median: 1142 (3%) max: 1554 Points
3DMark 11 - 3DM11 Performance Score
min: 143 avg: 222.6 median: 216 (0%) max: 280 Points
min: 314 avg: 359.4 median: 343 (0%) max: 562 Points
3DMark 11 - 3DM11 Performance GPU
min: 122 avg: 192.1 median: 186.5 (0%) max: 237 Points
min: 278 avg: 319.9 median: 298 (0%) max: 494 Points
3DMark Vantage + Intel HD Graphics (Bay Trail) 3DMark Vantage - 3DM Vant. Perf. total
min: 507 avg: 666 median: 637 (0%) max: 846 Points
3DM Vant. Perf. total + Intel HD Graphics 3000
min: 1135 avg: 1560 median: 1568 (0%) max: 2164 Points
3DM Vant. Perf. GPU no PhysX + Intel HD Graphics (Bay Trail) 3DMark Vantage - 3DM Vant. Perf. GPU no PhysX
min: 395 avg: 512 median: 503 (0%) max: 667 Points
3DM Vant. Perf. GPU no PhysX + Intel HD Graphics 3000
min: 927 avg: 1331 median: 1240 (1%) max: 8858 Points
3DMark 2001SE - 3DMark 2001 - Standard
7727 Points (8%)
min: 7796 avg: 12752 median: 11654 (12%) max: 19742 Points
3DMark 03 - 3DMark 03 - Standard
min: 4226 avg: 4997 median: 5220 (3%) max: 5323 Points
min: 5162 avg: 8577 median: 7751 (4%) max: 12358 Points
3DMark 05 - 3DMark 05 - Standard
min: 2666 avg: 3195 median: 3331 (4%) max: 3445 Points
min: 3498 avg: 6355 median: 5968 (7%) max: 9344 Points
3DMark 06 3DMark 06 - Score Unknown Settings + Intel HD Graphics (Bay Trail)
2108 Points (3%)
3DMark 06 - Score Unknown Settings + Intel HD Graphics 3000
min: 3508 avg: 3847 median: 3617 (5%) max: 5041 Points
3DMark 06 - Standard 1280x1024 + Intel HD Graphics (Bay Trail)
min: 814 avg: 1785 median: 1866 (2%) max: 2151 Points
3DMark 06 - Standard 1280x1024 + Intel HD Graphics (Cherry Trail)
min: 2403 avg: 2833 median: 2595 (3%) max: 3330 Points
3DMark 06 - Standard 1280x1024 + Intel HD Graphics 3000
min: 1392 avg: 3451 median: 3286.5 (4%) max: 5853 Points
3DMark 06 - Standard 1280x800 + Intel HD Graphics (Bay Trail)
2087 Points (3%)
3DMark 06 - Standard 1280x800 + Intel HD Graphics 3000
min: 2550 avg: 3176 median: 3224 (4%) max: 3753 Points
3DMark 06 - Standard 1024x768 + Intel HD Graphics (Cherry Trail)
2877 Points (4%)
3DMark 06 - Standard 1280x768 + Intel HD Graphics 3000
min: 2788 avg: 3293 median: 3308 (4%) max: 3942 Points
Unigine Valley 1.0 - Unigine Valley 1.0 DX
1.2 fps (0%)
Unigine Heaven 3.0 - Unigine Heaven 3.0 DX 11
3.6 fps (1%)
Unigine Heaven 2.1 - Heaven 2.1 high
min: 2.4 avg: 2.8 median: 2.8 (1%) max: 3.4 fps
5.7 fps (1%)
min: 4 avg: 7.7 median: 7.8 (1%) max: 9.3 fps
SPECviewperf 11 + Intel HD Graphics 3000 SPECviewperf 11 - specvp11 snx-01
min: 0.18 avg: 0.3 median: 0.2 (0%) max: 0.75 fps
specvp11 tcvis-02 + Intel HD Graphics 3000 SPECviewperf 11 - specvp11 tcvis-02
min: 0.12 avg: 0.3 median: 0.2 (0%) max: 0.86 fps
specvp11 sw-02 + Intel HD Graphics 3000 SPECviewperf 11 - specvp11 sw-02
min: 2.55 avg: 3.6 median: 3.6 (3%) max: 4.61 fps
specvp11 proe-05 + Intel HD Graphics 3000 SPECviewperf 11 - specvp11 proe-05
min: 0.26 avg: 0.5 median: 0.5 (1%) max: 0.65 fps
specvp11 maya-03 + Intel HD Graphics 3000 SPECviewperf 11 - specvp11 maya-03
min: 1.07 avg: 4.6 median: 5 (4%) max: 7.63 fps
specvp11 lightwave-01 + Intel HD Graphics 3000 SPECviewperf 11 - specvp11 lightwave-01
min: 3.63 avg: 5.5 median: 5.5 (6%) max: 7.35 fps
specvp11 ensight-04 + Intel HD Graphics 3000 SPECviewperf 11 - specvp11 ensight-04
min: 0.1 avg: 0.4 median: 0.1 (0%) max: 1.29 fps
Windows 7 Experience Index - Win7 Gaming graphics
min: 5.5 avg: 6.1 median: 6.1 (77%) max: 6.4 Points
Windows 7 Experience Index - Win7 Graphics
min: 4.1 avg: 5.1 median: 4.7 (59%) max: 6.4 Points
Cinebench R10 Cinebench R10 Shading (32bit) + Intel HD Graphics (Bay Trail) Cinebench R10 - Cinebench R10 Shading (32bit)
min: 898 avg: 2014 median: 1991.5 (1%) max: 2889 Points
Cinebench R10 Shading (32bit) + Intel HD Graphics (Cherry Trail)
min: 1192 avg: 2009 median: 1973 (1%) max: 2551 Points
Cinebench R10 Shading (32bit) + Intel HD Graphics 3000
min: 1712 avg: 4274 median: 4414 (3%) max: 7038 Points
Cinebench R11.5 Cinebench R11.5 OpenGL 64 Bit + Intel HD Graphics (Bay Trail) Cinebench R11.5 - Cinebench R11.5 OpenGL 64 Bit
min: 0.37 avg: 6.2 median: 6.4 (2%) max: 7.69 fps
Cinebench R11.5 OpenGL 64 Bit + Intel HD Graphics (Cherry Trail)
min: 4.01 avg: 8.8 median: 8.4 (3%) max: 11.71 fps
Cinebench R11.5 OpenGL 64 Bit + Intel HD Graphics 3000
min: 4.75 avg: 8.7 median: 8.4 (3%) max: 13.02 fps
Cinebench R15 + Intel HD Graphics (Bay Trail) Cinebench R15 - Cinebench R15 OpenGL 64 Bit
min: 2.88 avg: 5 median: 5.5 (0%) max: 6.55 fps
Cinebench R15 OpenGL 64 Bit + Intel HD Graphics (Cherry Trail)
min: 6.64 avg: 10.3 median: 9.7 (1%) max: 15.52 fps
Cinebench R15 OpenGL 64 Bit + Intel HD Graphics 3000 0 fps (0%)
Cinebench R15 OpenGL Ref. Match 64 Bit + Intel HD Graphics (Bay Trail) Cinebench R15 - Cinebench R15 OpenGL Ref. Match 64 Bit
min: 63 avg: 96.1 median: 97.8 (98%) max: 97.8 %
Cinebench R15 OpenGL Ref. Match 64 Bit + Intel HD Graphics (Cherry Trail)
min: 98 avg: 98 median: 98 (98%) max: 98.6 %
Cinebench R15 OpenGL Ref. Match 64 Bit + Intel HD Graphics 3000
min: 32.2 avg: 32.6 median: 32.6 (33%) max: 32.9 %
GFXBench - GFXBench Car Chase Offscreen
min: 6.3 avg: 7.3 median: 7 (1%) max: 9 fps
GFXBench 3.1 - GFXBench Manhattan ES 3.1 Offscreen
5.2 fps (0%)
min: 9.2 avg: 10.8 median: 11 (0%) max: 13 fps
GFXBench 3.0 - GFXBench 3.0 Manhattan Offscreen
min: 6 avg: 9.7 median: 8.8 (1%) max: 16 fps
min: 8.4 avg: 13.8 median: 13.5 (1%) max: 18 fps
GFXBench (DX / GLBenchmark) 2.7 + Intel HD Graphics (Bay Trail) GFXBench (DX / GLBenchmark) 2.7 - GFXBench T-Rex HD Offscreen C24Z16
min: 6 avg: 15.7 median: 16 (0%) max: 20.2 fps
GFXBench T-Rex HD Offscreen C24Z16 + Intel HD Graphics (Cherry Trail) min: 22 avg: 30.5 median: 32 (0%) max: 38.5 fps
Basemark ES 2.0 - Basemark ES 2.0
min: 45.08 avg: 49.1 median: 49.1 (81%) max: 53.1 fps
Basemark X 1.0 - Basemark X 1.0 Off-Screen
10.1 fps (48%)
Basemark X 1.1 - Basemark X 1.1 High Quality
min: 3008 avg: 6663 median: 8456 (19%) max: 8524 Points
Basemark X 1.1 - Basemark X 1.1 Medium Quality
min: 4802 avg: 12880 median: 14509 (32%) max: 17701 Points
NenaMark2 - NenaMark2 Score
min: 59 avg: 59.4 median: 59.4 (88%) max: 59.7 fps
LuxMark v2.0 64Bit - LuxMark v2.0 Room GPU
min: 25 avg: 28.5 median: 27 (0%) max: 35 Samples/s
min: 48 avg: 58.7 median: 59 (0%) max: 69 Samples/s
LuxMark v2.0 64Bit - LuxMark v2.0 Sala GPU
min: 26 avg: 29 median: 29 (0%) max: 34 Samples/s
min: 69 avg: 87.7 median: 89 (0%) max: 105 Samples/s
ComputeMark v2.1 - ComputeMark v2.1 Result
min: 160 avg: 172.8 median: 174 (0%) max: 192 Points
277 Points (0%)
PassMark PerformanceTest Mobile V1 - PerformanceTest Mobile V1 2D Graphics Tests
min: 3822 avg: 4036 median: 3866 (4%) max: 4588 Points
PassMark PerformanceTest Mobile V1 - PerformanceTest Mobile V1 3D Graphics Tests
min: 1058 avg: 1251 median: 1228 (2%) max: 1488 Points
Smartbench 2012 - Smartbench 2012 Gaming Index
min: 2679 avg: 3414 median: 3385 (74%) max: 4274 Points
Average Benchmarks Intel HD Graphics (Bay Trail) → 100% n=9 Average Benchmarks Intel HD Graphics (Cherry Trail) → 137% n=9 Average Benchmarks Intel HD Graphics 3000 → 160% n=9
- Range of benchmark values for this graphics card
- Average benchmark values for this graphics card
* Smaller numbers mean a higher performance
1 This benchmark is not used for the average calculation
Game Benchmarks The following benchmarks stem from our benchmarks of review laptops. The performance depends on the used graphics memory, clock rate, processor, system settings, drivers, and operating systems. So the results don't have to be representative for all laptops with this GPU. For detailed information on the benchmark results, click on the fps number.
100%
HD Graphics (Bay Trail):
26.7 [X] Intel NUC Kit DN2820FYKH Intel Celeron N2820 2.2GHz
HD Graphics (Bay Trail)
min:
23 fps
fps
80%
HD Graphics (Cherry Trail):
21.4 fps
181%
HD Graphics 3000:
48.4 [X] Acer Aspire M3-581TG Intel Core i7-2637M 1.7GHz
HD Graphics 3000
min:
40 fps
fps
100%
HD Graphics (Bay Trail):
23.4 [X] Intel NUC Kit DN2820FYKH Intel Celeron N2820 2.2GHz
HD Graphics (Bay Trail)
min:
21 fps
fps
100%
HD Graphics (Bay Trail):
6 [X] Intel NUC Kit DN2820FYKH Intel Celeron N2820 2.2GHz
HD Graphics (Bay Trail)
fps
100%
HD Graphics (Bay Trail):
12.6 [X] Intel NUC Kit DN2820FYKH Intel Celeron N2820 2.2GHz
HD Graphics (Bay Trail)
min:
7 fps, max:
15 fps
fps
123%
HD Graphics (Cherry Trail):
15.5 fps
HD Graphics (Cherry Trail):
22.6 [X] Chuwi Hi12 Intel Atom x5-Z8300 1.4GHz
HD Graphics (Cherry Trail)
min:
21 fps, max:
27 fps
fps
HD Graphics 3000:
22.1 [X] Acer Aspire M3-581TG Intel Core i7-2637M 1.7GHz
HD Graphics 3000
min:
13 fps, max:
27 fps
fps
HD Graphics 3000:
13.2 [X] Acer Aspire M3-581TG Intel Core i7-2637M 1.7GHz
HD Graphics 3000
min:
6 fps, max:
17 fps
fps
HD Graphics 3000:
0 (!) [X] Acer Aspire M3-581TG Intel Core i7-2637M 1.7GHz
HD Graphics 3000
fps
HD Graphics (Cherry Trail):
11.5 fps
HD Graphics (Cherry Trail):
7 fps
HD Graphics (Cherry Trail):
8.8 fps
HD Graphics (Cherry Trail):
4.8 fps
HD Graphics (Bay Trail):
0 (!) [X] Intel NUC Kit DN2820FYKH Intel Celeron N2820 2.2GHz
HD Graphics (Bay Trail)
fps
HD Graphics (Cherry Trail):
8.1 fps
HD Graphics (Cherry Trail):
3.9 fps
HD Graphics 3000:
0 (!) [X] Acer Aspire M3-581TG Intel Core i7-2637M 1.7GHz
HD Graphics 3000
fps
100%
HD Graphics (Bay Trail):
12.1 [X] Intel NUC Kit DN2820FYKH Intel Celeron N2820 2.2GHz
HD Graphics (Bay Trail)
min:
5 fps, max:
18 fps
fps
124%
HD Graphics (Cherry Trail):
13.9 [X] Chuwi Hi12 Intel Atom x5-Z8300 1.4GHz
HD Graphics (Cherry Trail)
min:
7 fps, max:
19 fps
16.8 ~ 15 fps
264%
HD Graphics 3000:
25.1 [X] Acer Aspire M3-581TG Intel Core i7-2637M 1.7GHz
HD Graphics 3000
38 [X] Compal Barebone Intel Core i7-2860QM 2.5GHz
HD Graphics 3000
min:
29 fps, max:
49 fps
~ 32 fps
HD Graphics 3000:
15.6 [X] Acer Aspire M3-581TG Intel Core i7-2637M 1.7GHz
HD Graphics 3000
min:
11 fps, max:
21 fps
21.7 [X] Compal Barebone Intel Core i7-2860QM 2.5GHz
HD Graphics 3000
min:
14 fps, max:
31 fps
~ 19 fps
100%
HD Graphics (Bay Trail):
10.8 [X] Intel NUC Kit DN2820FYKH Intel Celeron N2820 2.2GHz
HD Graphics (Bay Trail)
min:
10 fps, max:
12 fps
fps
140%
HD Graphics (Cherry Trail):
15.1 fps
HD Graphics (Cherry Trail):
9.8 fps
100%
HD Graphics (Bay Trail):
24.7 [X] Intel NUC Kit DN2820FYKH Intel Celeron N2820 2.2GHz
HD Graphics (Bay Trail)
min:
22.2 fps
fps
81%
HD Graphics (Cherry Trail):
20 [X] Chuwi Hi12 Intel Atom x5-Z8300 1.4GHz
HD Graphics (Cherry Trail)
min:
18 fps
fps
202%
HD Graphics 3000:
48.1 [X] Compal Barebone Intel Core i7-2860QM 2.5GHz
HD Graphics 3000
min:
41.1 fps
50.9 [X] Acer Aspire M3-581TG Intel Core i7-2637M 1.7GHz
HD Graphics 3000
min:
42 fps
~ 50 fps
100%
HD Graphics (Bay Trail):
9.7 [X] Intel NUC Kit DN2820FYKH Intel Celeron N2820 2.2GHz
HD Graphics (Bay Trail)
min:
8.8 fps
fps
157%
HD Graphics (Cherry Trail):
15.2 [X] Chuwi Hi12 Intel Atom x5-Z8300 1.4GHz
HD Graphics (Cherry Trail)
min:
13 fps
fps
206%
HD Graphics 3000:
19.4 [X] Acer Aspire M3-581TG Intel Core i7-2637M 1.7GHz
HD Graphics 3000
min:
17 fps
21.3 [X] Compal Barebone Intel Core i7-2860QM 2.5GHz
HD Graphics 3000
min:
19.8 fps
~ 20 fps
100%
HD Graphics (Bay Trail):
5.5 [X] Intel NUC Kit DN2820FYKH Intel Celeron N2820 2.2GHz
HD Graphics (Bay Trail)
min:
-1.4 fps
fps
131%
HD Graphics (Cherry Trail):
7.2 [X] Chuwi Hi12 Intel Atom x5-Z8300 1.4GHz
HD Graphics (Cherry Trail)
min:
6 fps
fps
151%
HD Graphics 3000:
8.3 [X] Compal Barebone Intel Core i7-2860QM 2.5GHz
HD Graphics 3000
min:
7.9 fps
fps
100%
HD Graphics (Bay Trail):
5.4 [X] Intel NUC Kit DN2820FYKH Intel Celeron N2820 2.2GHz
HD Graphics (Bay Trail)
min:
-3 fps
fps
137%
HD Graphics 3000:
7.4 [X] Compal Barebone Intel Core i7-2860QM 2.5GHz
HD Graphics 3000
min:
7.1 fps
fps
100%
HD Graphics (Bay Trail):
22 [X] Intel NUC Kit DN2820FYKH Intel Celeron N2820 2.2GHz
HD Graphics (Bay Trail)
min:
16 fps, max:
33 fps
24.2 ~ 23 fps
87%
HD Graphics (Cherry Trail):
20.1 fps
0%
HD Graphics 3000:
0 (!) [X] Acer Aspire M3-581TG Intel Core i7-2637M 1.7GHz
HD Graphics 3000
fps
100%
HD Graphics (Bay Trail):
0 (!) [X] Intel NUC Kit DN2820FYKH Intel Celeron N2820 2.2GHz
HD Graphics (Bay Trail)
12.5 ~ 6 fps
208%
HD Graphics (Cherry Trail):
12.5 fps
HD Graphics (Cherry Trail):
10.8 (!) [X] Microsoft Surface 3 Intel Atom x7-Z8700 1.6GHz
HD Graphics (Cherry Trail)
fps
HD Graphics 3000:
7.5 [X] Acer Aspire M3-581TG Intel Core i7-2637M 1.7GHz
HD Graphics 3000
min:
4 fps, max:
17 fps
fps
100%
HD Graphics (Bay Trail):
7.3 fps
100%
HD Graphics (Bay Trail):
5.1 fps
100%
HD Graphics (Bay Trail):
3.2 fps
0%
HD Graphics 3000:
0 (!) [X] Acer Aspire M3-581TG Intel Core i7-2637M 1.7GHz
HD Graphics 3000
fps
100%
HD Graphics (Bay Trail):
1.7 fps
100%
HD Graphics (Bay Trail):
8.1 fps
100%
HD Graphics (Bay Trail):
4.7 fps
100%
HD Graphics (Bay Trail):
7 fps
136%
HD Graphics (Cherry Trail):
9.5 fps
100%
HD Graphics (Bay Trail):
4.6 fps
124%
HD Graphics (Cherry Trail):
5.7 fps
100%
HD Graphics (Bay Trail):
5.6 fps
0%
HD Graphics 3000:
0 (!) [X] Acer Aspire M3-581TG Intel Core i7-2637M 1.7GHz
HD Graphics 3000
fps
100%
HD Graphics (Bay Trail):
3.8 fps
100%
HD Graphics (Bay Trail):
4.3 fps
100%
HD Graphics (Bay Trail):
2.4 fps
100%
HD Graphics (Bay Trail):
9.6 11.5 ~ 11 fps
147%
HD Graphics (Cherry Trail):
16.2 fps
86%
HD Graphics 3000:
9.5 [X] Acer Aspire M3-581TG Intel Core i7-2637M 1.7GHz
HD Graphics 3000
min:
4 fps, max:
15 fps
fps
100%
HD Graphics (Bay Trail):
4.3 fps
142%
HD Graphics (Cherry Trail):
6.1 fps
100%
HD Graphics (Bay Trail):
12 14 ~ 13 fps
123%
HD Graphics (Cherry Trail):
16 fps
100%
HD Graphics (Bay Trail):
12 fps
100%
HD Graphics (Cherry Trail):
12 fps
100%
HD Graphics (Bay Trail):
5.2 fps
100%
HD Graphics (Bay Trail):
3.6 fps
100%
HD Graphics (Bay Trail):
3.7 fps
100%
HD Graphics (Bay Trail):
2.5 fps
100%
HD Graphics (Bay Trail):
9.1 fps
100%
HD Graphics (Bay Trail):
5.1 fps
100%
HD Graphics (Bay Trail):
8.5 fps
100%
HD Graphics (Bay Trail):
6.1 fps
100%
HD Graphics (Bay Trail):
12.4 fps
126%
HD Graphics (Cherry Trail):
15.6 fps
100%
HD Graphics (Bay Trail):
8.5 fps
100%
HD Graphics (Bay Trail):
53.7 56 ~ 55 fps
100%
HD Graphics (Bay Trail):
6.6 7 ~ 7 fps
HD Graphics (Cherry Trail):
5.5 10 ~ 8 fps
100%
HD Graphics (Bay Trail):
8.4 fps
202%
HD Graphics 3000:
17 [X] Acer Aspire M3-581TG Intel Core i7-2637M 1.7GHz
HD Graphics 3000
min:
13 fps, max:
22 fps
fps
100%
HD Graphics (Bay Trail):
5.9 fps
161%
HD Graphics 3000:
9.5 [X] Acer Aspire M3-581TG Intel Core i7-2637M 1.7GHz
HD Graphics 3000
min:
6 fps, max:
14 fps
fps
HD Graphics 3000:
4.3 [X] Acer Aspire M3-581TG Intel Core i7-2637M 1.7GHz
HD Graphics 3000
fps
HD Graphics 3000:
3.4 [X] Acer Aspire M3-581TG Intel Core i7-2637M 1.7GHz
HD Graphics 3000
fps
100%
HD Graphics (Bay Trail):
31.6 41.8 ~ 37 fps
68%
HD Graphics (Cherry Trail):
22 27.3 ~ 25 fps
178%
HD Graphics 3000:
50 [X] Acer Aspire M3-581TG Intel Core i7-2637M 1.7GHz
HD Graphics 3000
min:
37 fps, max:
65 fps
82.5 [X] i7-2600K HD Graphics 3000 Intel Core i7-2600K 3.4GHz
HD Graphics 3000
min:
59 fps, max:
109 fps
~ 66 fps
100%
HD Graphics (Bay Trail):
12.5 12.5 ~ 13 fps
100%
HD Graphics (Cherry Trail):
12.5 13.5 ~ 13 fps
177%
HD Graphics 3000:
17.8 [X] Acer Aspire M3-581TG Intel Core i7-2637M 1.7GHz
HD Graphics 3000
min:
14 fps, max:
25 fps
27.2 [X] i7-2600K HD Graphics 3000 Intel Core i7-2600K 3.4GHz
HD Graphics 3000
min:
22 fps, max:
36 fps
~ 23 fps
HD Graphics 3000:
12.5 [X] Acer Aspire M3-581TG Intel Core i7-2637M 1.7GHz
HD Graphics 3000
min:
12.5 fps, max:
14 fps
13.2 [X] i7-2600K HD Graphics 3000 Intel Core i7-2600K 3.4GHz
HD Graphics 3000
min:
13 fps, max:
16 fps
~ 13 fps
HD Graphics 3000:
12.5 [X] Acer Aspire M3-581TG Intel Core i7-2637M 1.7GHz
HD Graphics 3000
min:
12.5 fps, max:
12.5 fps
fps
100%
HD Graphics (Bay Trail):
8.3 fps
0%
HD Graphics 3000:
0 (!) [X] Acer Aspire M3-581TG Intel Core i7-2637M 1.7GHz
HD Graphics 3000
fps
100%
HD Graphics (Bay Trail):
4.6 fps
100%
HD Graphics (Bay Trail):
11.1 fps
0%
HD Graphics 3000:
0 (!) [X] Acer Aspire M3-581TG Intel Core i7-2637M 1.7GHz
HD Graphics 3000
fps
100%
HD Graphics (Bay Trail):
9.6 fps
100%
HD Graphics (Bay Trail):
25.2 fps
89%
HD Graphics 3000:
22.5 [X] Acer Aspire M3-581TG Intel Core i7-2637M 1.7GHz
HD Graphics 3000
min:
17 fps, max:
26 fps
fps
100%
HD Graphics (Bay Trail):
9.2 fps
161%
HD Graphics 3000:
14.8 [X] Acer Aspire M3-581TG Intel Core i7-2637M 1.7GHz
HD Graphics 3000
min:
12 fps, max:
19 fps
fps
HD Graphics 3000:
0 (!) [X] Acer Aspire M3-581TG Intel Core i7-2637M 1.7GHz
HD Graphics 3000
fps
100%
HD Graphics (Bay Trail):
3.1 [X] Medion Akoya S6213T MD98716 Intel Pentium N3530 2.2GHz
HD Graphics (Bay Trail)
5.1 ~ 4 fps
100%
HD Graphics (Bay Trail):
3.3 fps
100%
HD Graphics (Bay Trail):
8.7 fps
106%
HD Graphics 3000:
9.2 [X] Acer Aspire M3-581TG Intel Core i7-2637M 1.7GHz
HD Graphics 3000
min:
5 fps, max:
18 fps
fps
100%
HD Graphics (Bay Trail):
5.8 fps
100%
HD Graphics (Bay Trail):
12.8 fps
141%
HD Graphics 3000:
14.6 [X] Acer Aspire M3-581TG Intel Core i7-2637M 1.7GHz
HD Graphics 3000
21.5 [X] Compal Barebone Intel Core i7-2860QM 2.5GHz
HD Graphics 3000
~ 18 fps
100%
HD Graphics (Bay Trail):
6 fps
167%
HD Graphics 3000:
8 [X] Acer Aspire M3-581TG Intel Core i7-2637M 1.7GHz
HD Graphics 3000
11.3 [X] Compal Barebone Intel Core i7-2860QM 2.5GHz
HD Graphics 3000
~ 10 fps
HD Graphics 3000:
4 [X] Acer Aspire M3-581TG Intel Core i7-2637M 1.7GHz
HD Graphics 3000
5.7 [X] Compal Barebone Intel Core i7-2860QM 2.5GHz
HD Graphics 3000
~ 5 fps
HD Graphics 3000:
2.9 [X] Acer Aspire M3-581TG Intel Core i7-2637M 1.7GHz
HD Graphics 3000
3.9 [X] Compal Barebone Intel Core i7-2860QM 2.5GHz
HD Graphics 3000
~ 3 fps
100%
HD Graphics (Bay Trail):
7.3 fps
182%
HD Graphics (Cherry Trail):
13.3 fps
0%
HD Graphics 3000:
0 (!) [X] Acer Aspire M3-581TG Intel Core i7-2637M 1.7GHz
HD Graphics 3000
fps
100%
HD Graphics (Bay Trail):
14 fps
229%
HD Graphics 3000:
32 [X] Schenker Xesia M501 Intel Core i7-2630QM 2GHz
HD Graphics 3000
fps
100%
HD Graphics (Bay Trail):
8 fps
263%
HD Graphics 3000:
21 [X] Schenker Xesia M501 Intel Core i7-2630QM 2GHz
HD Graphics 3000
fps
100%
HD Graphics (Bay Trail):
12 fps
250%
HD Graphics 3000:
26 [X] Acer Aspire M3-581TG Intel Core i7-2637M 1.7GHz
HD Graphics 3000
min:
19 fps
34 [X] Schenker Xesia M501 Intel Core i7-2630QM 2GHz
HD Graphics 3000
~ 30 fps
HD Graphics 3000:
19 [X] Acer Aspire M3-581TG Intel Core i7-2637M 1.7GHz
HD Graphics 3000
min:
14 fps
24 [X] Schenker Xesia M501 Intel Core i7-2630QM 2GHz
HD Graphics 3000
~ 22 fps
HD Graphics 3000:
15 [X] Acer Aspire M3-581TG Intel Core i7-2637M 1.7GHz
HD Graphics 3000
min:
12 fps
17 [X] Schenker Xesia M501 Intel Core i7-2630QM 2GHz
HD Graphics 3000
~ 16 fps
HD Graphics 3000:
12 [X] Schenker Xesia M501 Intel Core i7-2630QM 2GHz
HD Graphics 3000
fps
100%
HD Graphics (Bay Trail):
12.6 18.7 19.9 29.8 33.6 60 [X] Medion Akoya P2211T MD98602 Intel Celeron N2910 1.6GHz
HD Graphics (Bay Trail)
~ 29 fps
431%
HD Graphics 3000:
124.9 [X] Schenker Xesia M501 Intel Core i7-2630QM 2GHz
HD Graphics 3000
fps
100%
HD Graphics (Bay Trail):
10.5 19.5 33 [X] Medion Akoya P2211T MD98602 Intel Celeron N2910 1.6GHz
HD Graphics (Bay Trail)
~ 21 fps
290%
HD Graphics 3000:
58 [X] Acer Aspire M3-581TG Intel Core i7-2637M 1.7GHz
HD Graphics 3000
min:
46 fps
63.6 [X] Schenker Xesia M501 Intel Core i7-2630QM 2GHz
HD Graphics 3000
~ 61 fps
100%
HD Graphics (Bay Trail):
7.8 12.8 22 [X] Medion Akoya P2211T MD98602 Intel Celeron N2910 1.6GHz
HD Graphics (Bay Trail)
~ 14 fps
229%
HD Graphics 3000:
30.5 [X] Acer Aspire M3-581TG Intel Core i7-2637M 1.7GHz
HD Graphics 3000
min:
25 fps
34.2 [X] Schenker Xesia M501 Intel Core i7-2630QM 2GHz
HD Graphics 3000
~ 32 fps
HD Graphics 3000:
17 [X] Schenker Xesia M501 Intel Core i7-2630QM 2GHz
HD Graphics 3000
18 [X] Acer Aspire M3-581TG Intel Core i7-2637M 1.7GHz
HD Graphics 3000
~ 18 fps
100%
HD Graphics (Bay Trail):
7.7 fps
247%
HD Graphics 3000:
18.4 [X] Acer Aspire M3-581TG Intel Core i7-2637M 1.7GHz
HD Graphics 3000
min:
15 fps
19.2 [X] Schenker Xesia M501 Intel Core i7-2630QM 2GHz
HD Graphics 3000
~ 19 fps
HD Graphics 3000:
14 [X] Acer Aspire M3-581TG Intel Core i7-2637M 1.7GHz
HD Graphics 3000
min:
12 fps
14.2 [X] Schenker Xesia M501 Intel Core i7-2630QM 2GHz
HD Graphics 3000
~ 14 fps
100%
HD Graphics (Bay Trail):
6.3 fps
206%
HD Graphics 3000:
11.5 [X] Acer Aspire M3-581TG Intel Core i7-2637M 1.7GHz
HD Graphics 3000
14 [X] Schenker Xesia M501 Intel Core i7-2630QM 2GHz
HD Graphics 3000
~ 13 fps
HD Graphics 3000:
9.5 [X] Schenker Xesia M501 Intel Core i7-2630QM 2GHz
HD Graphics 3000
fps
HD Graphics 3000:
6.5 [X] Schenker Xesia M501 Intel Core i7-2630QM 2GHz
HD Graphics 3000
fps
HD Graphics 3000:
4.1 [X] Schenker Xesia M501 Intel Core i7-2630QM 2GHz
HD Graphics 3000
fps
100%
HD Graphics (Bay Trail):
10.2 fps
176%
HD Graphics 3000:
16.8 [X] Acer Aspire M3-581TG Intel Core i7-2637M 1.7GHz
HD Graphics 3000
19.4 [X] Schenker Xesia M501 Intel Core i7-2630QM 2GHz
HD Graphics 3000
~ 18 fps
100%
HD Graphics (Bay Trail):
6.1 fps
100%
HD Graphics (Bay Trail):
11 fps
199%
HD Graphics 3000:
21.9 [X] Schenker Xesia M501 Intel Core i7-2630QM 2GHz
HD Graphics 3000
fps
100%
HD Graphics (Bay Trail):
7.8 fps
HD Graphics (Cherry Trail):
58 fps
HD Graphics (Cherry Trail):
47 fps
100%
HD Graphics (Bay Trail):
18.2 [X] Medion Akoya P2211T MD98602 Intel Celeron N2910 1.6GHz
HD Graphics (Bay Trail)
20.8 28.4 31.9 [X] Asus Transformer Book T200TA PL Intel Atom Z3775 1.5GHz
HD Graphics (Bay Trail)
~ 25 fps
119%
HD Graphics (Cherry Trail):
29.7 fps
224%
HD Graphics 3000:
47.8 [X] Acer Aspire M3-581TG Intel Core i7-2637M 1.7GHz
HD Graphics 3000
63.8 [X] Schenker Xesia M501 Intel Core i7-2630QM 2GHz
HD Graphics 3000
~ 56 fps
100%
HD Graphics (Bay Trail):
9.5 [X] Medion Akoya P2211T MD98602 Intel Celeron N2910 1.6GHz
HD Graphics (Bay Trail)
10.4 13.7 19.4 [X] Asus Transformer Book T200TA PL Intel Atom Z3775 1.5GHz
HD Graphics (Bay Trail)
~ 13 fps
127%
HD Graphics (Cherry Trail):
16.5 fps
223%
HD Graphics 3000:
24.9 [X] Acer Aspire M3-581TG Intel Core i7-2637M 1.7GHz
HD Graphics 3000
33.4 [X] Schenker Xesia M501 Intel Core i7-2630QM 2GHz
HD Graphics 3000
~ 29 fps
HD Graphics 3000:
11.2 [X] Acer Aspire M3-581TG Intel Core i7-2637M 1.7GHz
HD Graphics 3000
11.5 [X] Schenker Xesia M501 Intel Core i7-2630QM 2GHz
HD Graphics 3000
~ 11 fps
100%
HD Graphics (Bay Trail):
4.4 [X] Medion Akoya E6239T Intel Pentium N3510 2GHz
HD Graphics (Bay Trail)
fps
202%
HD Graphics 3000:
8.9 [X] Schenker Xesia M501 Intel Core i7-2630QM 2GHz
HD Graphics 3000
fps
HD Graphics 3000:
6.6 [X] Schenker Xesia M501 Intel Core i7-2630QM 2GHz
HD Graphics 3000
fps
HD Graphics 3000:
3.9 [X] Schenker Xesia M501 Intel Core i7-2630QM 2GHz
HD Graphics 3000
fps
100%
HD Graphics (Bay Trail):
14.1 16.2 17.9 20.4 [X] Medion Akoya E6239T Intel Pentium N3510 2GHz
HD Graphics (Bay Trail)
23.2 ~ 18 fps
133%
HD Graphics (Cherry Trail):
24 fps
222%
HD Graphics 3000:
39.9 [X] Schenker Xesia M501 Intel Core i7-2630QM 2GHz
HD Graphics 3000
fps
100%
HD Graphics (Bay Trail):
12.5 12.6 [X] Medion Akoya E6239T Intel Pentium N3510 2GHz
HD Graphics (Bay Trail)
~ 13 fps
104%
HD Graphics (Cherry Trail):
13.5 fps
188%
HD Graphics 3000:
24.4 [X] Schenker Xesia M501 Intel Core i7-2630QM 2GHz
HD Graphics 3000
fps
HD Graphics 3000:
14.9 [X] Schenker Xesia M501 Intel Core i7-2630QM 2GHz
HD Graphics 3000
fps
100%
HD Graphics (Bay Trail):
5 fps
220%
HD Graphics 3000:
10.6 (!) [X] Acer Aspire M3-581TG Intel Core i7-2637M 1.7GHz
HD Graphics 3000
11.2 [X] Schenker Xesia M501 Intel Core i7-2630QM 2GHz
HD Graphics 3000
~ 11 fps
HD Graphics 3000:
7.4 [X] Schenker Xesia M501 Intel Core i7-2630QM 2GHz
HD Graphics 3000
fps
158%
HD Graphics (Cherry Trail):
16 18 18.9 [X] Medion Akoya E2215T Intel Atom x5-Z8350 1.4GHz
HD Graphics (Cherry Trail)
19.8 20.1 20.5 ~ 19 fps
192%
HD Graphics 3000:
22.8 [X] Acer Aspire M3-581TG Intel Core i7-2637M 1.7GHz
HD Graphics 3000
23.3 [X] Schenker Xesia M501 Intel Core i7-2630QM 2GHz
HD Graphics 3000
~ 23 fps
150%
HD Graphics (Cherry Trail):
6.4 7.9 [X] Medion Akoya E2215T Intel Atom x5-Z8350 1.4GHz
HD Graphics (Cherry Trail)
9.3 9.8 10 10 ~ 9 fps
183%
HD Graphics 3000:
10.6 [X] Schenker Xesia M501 Intel Core i7-2630QM 2GHz
HD Graphics 3000
10.7 [X] Acer Aspire M3-581TG Intel Core i7-2637M 1.7GHz
HD Graphics 3000
~ 11 fps
140%
HD Graphics (Cherry Trail):
5.6 5.7 [X] Medion Akoya E2215T Intel Atom x5-Z8350 1.4GHz
HD Graphics (Cherry Trail)
6.7 7.6 7.9 8.4 ~ 7 fps
180%
HD Graphics 3000:
9.2 [X] Schenker Xesia M501 Intel Core i7-2630QM 2GHz
HD Graphics 3000
9.3 [X] Acer Aspire M3-581TG Intel Core i7-2637M 1.7GHz
HD Graphics 3000
~ 9 fps
100%
HD Graphics (Bay Trail):
1.2 fps
167%
HD Graphics (Cherry Trail):
2.4 2.6 ~ 2 fps
100%
HD Graphics (Bay Trail):
39 56.2 69 [X] Baytrail Reference Tablet Intel Atom Z3770 1.5GHz
HD Graphics (Bay Trail)
~ 55 fps
191%
HD Graphics 3000:
71 107 [X] Acer Aspire M3-581TG Intel Core i7-2637M 1.7GHz
HD Graphics 3000
138 [X] Schenker Xesia M501 Intel Core i7-2630QM 2GHz
HD Graphics 3000
~ 105 fps
100%
HD Graphics (Bay Trail):
12.3 12.8 14 [X] Baytrail Reference Tablet Intel Atom Z3770 1.5GHz
HD Graphics (Bay Trail)
min:
8 fps
~ 13 fps
169%
HD Graphics 3000:
19.4 [X] Acer Aspire M3-581TG Intel Core i7-2637M 1.7GHz
HD Graphics 3000
20 27 [X] Schenker Xesia M501 Intel Core i7-2630QM 2GHz
HD Graphics 3000
~ 22 fps
HD Graphics 3000:
10 12.4 [X] Schenker Xesia M501 Intel Core i7-2630QM 2GHz
HD Graphics 3000
~ 11 fps
HD Graphics 3000:
4.2 [X] Schenker Xesia M501 Intel Core i7-2630QM 2GHz
HD Graphics 3000
fps
HD Graphics 3000:
15.8 [X] Schenker Xesia M501 Intel Core i7-2630QM 2GHz
HD Graphics 3000
fps
HD Graphics 3000:
8.4 [X] Schenker Xesia M501 Intel Core i7-2630QM 2GHz
HD Graphics 3000
fps
HD Graphics 3000:
6.4 [X] Schenker Xesia M501 Intel Core i7-2630QM 2GHz
HD Graphics 3000
fps
186%
HD Graphics 3000:
26 [X] Schenker Xesia M501 Intel Core i7-2630QM 2GHz
HD Graphics 3000
fps
196%
HD Graphics 3000:
13.7 [X] Schenker Xesia M501 Intel Core i7-2630QM 2GHz
HD Graphics 3000
fps
160%
HD Graphics (Cherry Trail):
7 8.3 9 ~ 8 fps
198%
HD Graphics 3000:
9.9 [X] Schenker Xesia M501 Intel Core i7-2630QM 2GHz
HD Graphics 3000
fps
100%
HD Graphics (Bay Trail):
0.3 fps
1333%
HD Graphics (Cherry Trail):
3.7 3.8 ~ 4 fps
100%
HD Graphics (Bay Trail):
15.1 23.6 ~ 19 fps
268%
HD Graphics 3000:
48 [X] Acer Aspire M3-581TG Intel Core i7-2637M 1.7GHz
HD Graphics 3000
54.3 [X] Schenker Xesia M501 Intel Core i7-2630QM 2GHz
HD Graphics 3000
~ 51 fps
100%
HD Graphics (Bay Trail):
5.2 9.7 ~ 7 fps
314%
HD Graphics 3000:
21 [X] Acer Aspire M3-581TG Intel Core i7-2637M 1.7GHz
HD Graphics 3000
22.7 [X] Schenker Xesia M501 Intel Core i7-2630QM 2GHz
HD Graphics 3000
~ 22 fps
HD Graphics 3000:
16.7 [X] Schenker Xesia M501 Intel Core i7-2630QM 2GHz
HD Graphics 3000
fps
HD Graphics 3000:
9.1 [X] Schenker Xesia M501 Intel Core i7-2630QM 2GHz
HD Graphics 3000
fps
HD Graphics (Cherry Trail):
34 fps
100%
HD Graphics (Bay Trail):
10.3 fps
198%
HD Graphics 3000:
20.4 [X] Schenker Xesia M501 Intel Core i7-2630QM 2GHz
HD Graphics 3000
fps
100%
HD Graphics (Bay Trail):
6.2 fps
203%
HD Graphics 3000:
12.6 [X] Schenker Xesia M501 Intel Core i7-2630QM 2GHz
HD Graphics 3000
fps
HD Graphics 3000:
10.7 [X] Acer Aspire M3-581TG Intel Core i7-2637M 1.7GHz
HD Graphics 3000
13.9 [X] Schenker Xesia M501 Intel Core i7-2630QM 2GHz
HD Graphics 3000
~ 12 fps
HD Graphics 3000:
12 [X] Schenker Xesia M501 Intel Core i7-2630QM 2GHz
HD Graphics 3000
fps
100%
HD Graphics (Bay Trail):
10.1 fps
158%
HD Graphics 3000:
16 [X] Schenker Xesia M501 Intel Core i7-2630QM 2GHz
HD Graphics 3000
fps
100%
HD Graphics (Bay Trail):
6 fps
207%
HD Graphics 3000:
12.4 [X] Schenker Xesia M501 Intel Core i7-2630QM 2GHz
HD Graphics 3000
fps
HD Graphics 3000:
1.9 [X] Schenker Xesia M501 Intel Core i7-2630QM 2GHz
HD Graphics 3000
fps
100%
HD Graphics (Bay Trail):
12.4 fps
137%
HD Graphics 3000:
16.4 [X] Acer Aspire M3-581TG Intel Core i7-2637M 1.7GHz
HD Graphics 3000
16.9 [X] Schenker Xesia M501 Intel Core i7-2630QM 2GHz
HD Graphics 3000
~ 17 fps
100%
HD Graphics (Bay Trail):
7.3 fps
167%
HD Graphics 3000:
12.2 [X] Schenker Xesia M501 Intel Core i7-2630QM 2GHz
HD Graphics 3000
fps
HD Graphics 3000:
4.4 [X] Schenker Xesia M501 Intel Core i7-2630QM 2GHz
HD Graphics 3000
fps
HD Graphics 3000:
16.7 [X] Acer Aspire M3-581TG Intel Core i7-2637M 1.7GHz
HD Graphics 3000
20.6 [X] Schenker Xesia M501 Intel Core i7-2630QM 2GHz
HD Graphics 3000
~ 19 fps
HD Graphics 3000:
12.6 [X] Schenker Xesia M501 Intel Core i7-2630QM 2GHz
HD Graphics 3000
fps
HD Graphics 3000:
7.7 [X] Schenker Xesia M501 Intel Core i7-2630QM 2GHz
HD Graphics 3000
fps
HD Graphics 3000:
17.4 [X] Schenker Xesia M501 Intel Core i7-2630QM 2GHz
HD Graphics 3000
fps
HD Graphics 3000:
11 [X] Schenker Xesia M501 Intel Core i7-2630QM 2GHz
HD Graphics 3000
fps
HD Graphics 3000:
8.8 [X] Schenker Xesia M501 Intel Core i7-2630QM 2GHz
HD Graphics 3000
fps
100%
HD Graphics (Bay Trail):
12.5 14.3 ~ 13 fps
117%
HD Graphics (Cherry Trail):
15.2 fps
185%
HD Graphics 3000:
16.4 24.4 [X] Acer Aspire M3-581TG Intel Core i7-2637M 1.7GHz
HD Graphics 3000
29.7 [X] Schenker Xesia M501 Intel Core i7-2630QM 2GHz
HD Graphics 3000
~ 24 fps
100%
HD Graphics (Bay Trail):
9.8 11.2 ~ 11 fps
105%
HD Graphics (Cherry Trail):
11.6 fps
200%
HD Graphics 3000:
19.9 [X] Acer Aspire M3-581TG Intel Core i7-2637M 1.7GHz
HD Graphics 3000
23.5 [X] Schenker Xesia M501 Intel Core i7-2630QM 2GHz
HD Graphics 3000
~ 22 fps
HD Graphics 3000:
18.3 [X] Acer Aspire M3-581TG Intel Core i7-2637M 1.7GHz
HD Graphics 3000
21.1 [X] Schenker Xesia M501 Intel Core i7-2630QM 2GHz
HD Graphics 3000
~ 20 fps
HD Graphics 3000:
11.6 [X] Schenker Xesia M501 Intel Core i7-2630QM 2GHz
HD Graphics 3000
fps
HD Graphics 3000:
51 [X] Acer Aspire M3-581TG Intel Core i7-2637M 1.7GHz
HD Graphics 3000
64.3 [X] Schenker Xesia M501 Intel Core i7-2630QM 2GHz
HD Graphics 3000
~ 58 fps
HD Graphics 3000:
19.2 [X] Acer Aspire M3-581TG Intel Core i7-2637M 1.7GHz
HD Graphics 3000
19.4 [X] Schenker Xesia M501 Intel Core i7-2630QM 2GHz
HD Graphics 3000
~ 19 fps
HD Graphics 3000:
14.6 [X] Schenker Xesia M501 Intel Core i7-2630QM 2GHz
HD Graphics 3000
fps
HD Graphics 3000:
7.6 [X] Schenker Xesia M501 Intel Core i7-2630QM 2GHz
HD Graphics 3000
fps
HD Graphics 3000:
16.6 [X] Schenker Xesia M501 Intel Core i7-2630QM 2GHz
HD Graphics 3000
16.6 [X] Acer Aspire M3-581TG Intel Core i7-2637M 1.7GHz
HD Graphics 3000
~ 17 fps
HD Graphics 3000:
23 49 [X] Schenker Xesia M501 Intel Core i7-2630QM 2GHz
HD Graphics 3000
~ 36 fps
HD Graphics 3000:
15 27 [X] Schenker Xesia M501 Intel Core i7-2630QM 2GHz
HD Graphics 3000
~ 21 fps
HD Graphics 3000:
12 17 [X] Schenker Xesia M501 Intel Core i7-2630QM 2GHz
HD Graphics 3000
~ 15 fps
HD Graphics 3000:
12 [X] Schenker Xesia M501 Intel Core i7-2630QM 2GHz
HD Graphics 3000
fps
HD Graphics (Cherry Trail):
0 (!) [X] Microsoft Surface 3 Intel Atom x7-Z8700 1.6GHz
HD Graphics (Cherry Trail)
fps
HD Graphics 3000:
20.9 [X] Schenker Xesia M501 Intel Core i7-2630QM 2GHz
HD Graphics 3000
27 ~ 24 fps
HD Graphics (Cherry Trail):
0 (!) [X] Microsoft Surface 3 Intel Atom x7-Z8700 1.6GHz
HD Graphics (Cherry Trail)
fps
HD Graphics 3000:
13 17 [X] Schenker Xesia M501 Intel Core i7-2630QM 2GHz
HD Graphics 3000
~ 15 fps
HD Graphics 3000:
12.3 [X] Schenker Xesia M501 Intel Core i7-2630QM 2GHz
HD Graphics 3000
fps
HD Graphics 3000:
6.4 [X] Schenker Xesia M501 Intel Core i7-2630QM 2GHz
HD Graphics 3000
fps
100%
HD Graphics (Bay Trail):
42 fps
126%
HD Graphics 3000:
42 56.5 [X] Acer Aspire M3-581TG Intel Core i7-2637M 1.7GHz
HD Graphics 3000
61.9 [X] Schenker Xesia M501 Intel Core i7-2630QM 2GHz
HD Graphics 3000
~ 53 fps
HD Graphics 3000:
19.8 26.6 [X] Acer Aspire M3-581TG Intel Core i7-2637M 1.7GHz
HD Graphics 3000
32.8 [X] Schenker Xesia M501 Intel Core i7-2630QM 2GHz
HD Graphics 3000
~ 26 fps
HD Graphics 3000:
15.7 [X] Acer Aspire M3-581TG Intel Core i7-2637M 1.7GHz
HD Graphics 3000
16.8 [X] Schenker Xesia M501 Intel Core i7-2630QM 2GHz
HD Graphics 3000
~ 16 fps
HD Graphics 3000:
20 22 22.6 [X] Acer Aspire M3-581TG Intel Core i7-2637M 1.7GHz
HD Graphics 3000
37.5 [X] Schenker Xesia M501 Intel Core i7-2630QM 2GHz
HD Graphics 3000
~ 26 fps
HD Graphics 3000:
7 8 8.1 [X] Acer Aspire M3-581TG Intel Core i7-2637M 1.7GHz
HD Graphics 3000
9.2 [X] Schenker Xesia M501 Intel Core i7-2630QM 2GHz
HD Graphics 3000
~ 8 fps
HD Graphics 3000:
3.1 [X] Acer Aspire M3-581TG Intel Core i7-2637M 1.7GHz
HD Graphics 3000
fps
100%
HD Graphics (Bay Trail):
26.1 [X] Intel NUC Kit DN2820FYKH Intel Celeron N2820 2.2GHz
HD Graphics (Bay Trail)
min:
16 fps, max:
38 fps
46.6 ~ 36 fps
169%
HD Graphics 3000:
50.4 70.8 [X] Schenker Xesia M501 Intel Core i7-2630QM 2GHz
HD Graphics 3000
~ 61 fps
100%
HD Graphics (Bay Trail):
20 [X] Intel NUC Kit DN2820FYKH Intel Celeron N2820 2.2GHz
HD Graphics (Bay Trail)
min:
13 fps, max:
29 fps
23.9 ~ 22 fps
168%
HD Graphics 3000:
33.4 41.4 [X] Schenker Xesia M501 Intel Core i7-2630QM 2GHz
HD Graphics 3000
~ 37 fps
HD Graphics (Cherry Trail):
20.3 fps
HD Graphics 3000:
13.6 19.7 [X] Schenker Xesia M501 Intel Core i7-2630QM 2GHz
HD Graphics 3000
~ 17 fps
HD Graphics (Cherry Trail):
11.4 fps
HD Graphics 3000:
10.6 [X] Schenker Xesia M501 Intel Core i7-2630QM 2GHz
HD Graphics 3000
fps
HD Graphics 3000:
18.4 [X] Acer Aspire M3-581TG Intel Core i7-2637M 1.7GHz
HD Graphics 3000
18.6 [X] Schenker Xesia M501 Intel Core i7-2630QM 2GHz
HD Graphics 3000
~ 19 fps
HD Graphics 3000:
10 [X] Schenker Xesia M501 Intel Core i7-2630QM 2GHz
HD Graphics 3000
10 [X] Acer Aspire M3-581TG Intel Core i7-2637M 1.7GHz
HD Graphics 3000
~ 10 fps
100%
HD Graphics (Bay Trail):
12.9 13.2 ~ 13 fps
162%
HD Graphics 3000:
21 [X] Schenker Xesia M501 Intel Core i7-2630QM 2GHz
HD Graphics 3000
fps
100%
HD Graphics (Bay Trail):
7.5 8.1 ~ 8 fps
188%
HD Graphics 3000:
15 [X] Schenker Xesia M501 Intel Core i7-2630QM 2GHz
HD Graphics 3000
fps
HD Graphics 3000:
6.8 [X] Schenker Xesia M501 Intel Core i7-2630QM 2GHz
HD Graphics 3000
fps
HD Graphics 3000:
13.7 [X] Schenker Xesia M501 Intel Core i7-2630QM 2GHz
HD Graphics 3000
fps
HD Graphics 3000:
11.3 [X] Schenker Xesia M501 Intel Core i7-2630QM 2GHz
HD Graphics 3000
fps
HD Graphics 3000:
8.7 [X] Acer Aspire M3-581TG Intel Core i7-2637M 1.7GHz
HD Graphics 3000
9.4 [X] Schenker Xesia M501 Intel Core i7-2630QM 2GHz
HD Graphics 3000
~ 9 fps
HD Graphics 3000:
17.6 [X] Schenker Xesia M501 Intel Core i7-2630QM 2GHz
HD Graphics 3000
fps
HD Graphics 3000:
12.7 [X] Schenker Xesia M501 Intel Core i7-2630QM 2GHz
HD Graphics 3000
fps
100%
HD Graphics (Bay Trail):
28 fps
111%
HD Graphics 3000:
24.8 24.8 31.1 33.8 [X] Acer Aspire M3-581TG Intel Core i7-2637M 1.7GHz
HD Graphics 3000
40.6 [X] Schenker XMG A501 Intel Core i7-2630QM 2GHz
HD Graphics 3000
~ 31 fps
HD Graphics 3000:
15.1 15.1 17.2 19 [X] Acer Aspire M3-581TG Intel Core i7-2637M 1.7GHz
HD Graphics 3000
25.3 [X] Schenker XMG A501 Intel Core i7-2630QM 2GHz
HD Graphics 3000
~ 18 fps
HD Graphics 3000:
8.6 9.5 9.5 13 [X] Acer Aspire M3-581TG Intel Core i7-2637M 1.7GHz
HD Graphics 3000
13.1 [X] Schenker XMG A501 Intel Core i7-2630QM 2GHz
HD Graphics 3000
~ 11 fps
100%
HD Graphics (Bay Trail):
9.2 10.7 14.8 15.6 16.5 [X] Medion Akoya P2214T MD 99430 Intel Celeron N2940 1.8GHz
HD Graphics (Bay Trail)
18.4 19.3 [X] Intel NUC Kit DN2820FYKH Intel Celeron N2820 2.2GHz
HD Graphics (Bay Trail)
min:
14 fps, max:
23 fps
~ 15 fps
187%
HD Graphics (Cherry Trail):
24.3 [X] Chuwi Hi12 Intel Atom x5-Z8300 1.4GHz
HD Graphics (Cherry Trail)
min:
20 fps, max:
29 fps
31.9 ~ 28 fps
233%
HD Graphics 3000:
24.6 25.6 27 30.4 31.3 39 41 [X] Acer Aspire M3-581TG Intel Core i7-2637M 1.7GHz
HD Graphics 3000
44 [X] Schenker XMG A501 Intel Core i7-2630QM 2GHz
HD Graphics 3000
56 ~ 35 fps
100%
HD Graphics (Bay Trail):
6 9.5 [X] Medion Akoya P2214T MD 99430 Intel Celeron N2940 1.8GHz
HD Graphics (Bay Trail)
10.3 11.4 12 ~ 10 fps
180%
HD Graphics (Cherry Trail):
16 [X] Chuwi Hi12 Intel Atom x5-Z8300 1.4GHz
HD Graphics (Cherry Trail)
min:
13 fps, max:
19 fps
19 ~ 18 fps
170%
HD Graphics 3000:
14.8 15 15.7 [X] Schenker XMG A501 Intel Core i7-2630QM 2GHz
HD Graphics 3000
16 [X] Acer Aspire M3-581TG Intel Core i7-2637M 1.7GHz
HD Graphics 3000
18 18.7 19.6 21.2 ~ 17 fps
100%
HD Graphics (Bay Trail):
7.9 [X] Medion Akoya P2214T MD 99430 Intel Celeron N2940 1.8GHz
HD Graphics (Bay Trail)
9.6 ~ 9 fps
122%
HD Graphics 3000:
7 8.2 [X] Schenker XMG A501 Intel Core i7-2630QM 2GHz
HD Graphics 3000
8.5 [X] Acer Aspire M3-581TG Intel Core i7-2637M 1.7GHz
HD Graphics 3000
8.5 [X] Acer Aspire M3-581TG Intel Core i7-2637M 1.7GHz
HD Graphics 3000
12.9 13 15.8 18 ~ 11 fps
100%
HD Graphics (Bay Trail):
5 [X] Medion Akoya P2214T MD 99430 Intel Celeron N2940 1.8GHz
HD Graphics (Bay Trail)
5.9 ~ 5 fps
240%
HD Graphics 3000:
6.3 [X] Schenker XMG A501 Intel Core i7-2630QM 2GHz
HD Graphics 3000
17 ~ 12 fps
HD Graphics 3000:
16.3 [X] Acer Aspire M3-581TG Intel Core i7-2637M 1.7GHz
HD Graphics 3000
17.6 [X] Schenker XMG A501 Intel Core i7-2630QM 2GHz
HD Graphics 3000
~ 17 fps
HD Graphics 3000:
11.3 [X] Acer Aspire M3-581TG Intel Core i7-2637M 1.7GHz
HD Graphics 3000
11.9 [X] Schenker XMG A501 Intel Core i7-2630QM 2GHz
HD Graphics 3000
~ 12 fps
HD Graphics 3000:
8.5 [X] Schenker XMG A501 Intel Core i7-2630QM 2GHz
HD Graphics 3000
8.6 [X] Acer Aspire M3-581TG Intel Core i7-2637M 1.7GHz
HD Graphics 3000
~ 9 fps
100%
HD Graphics (Bay Trail):
8.5 12.4 ~ 10 fps
250%
HD Graphics 3000:
21.2 21.4 31 [X] Schenker XMG A501 Intel Core i7-2630QM 2GHz
HD Graphics 3000
~ 25 fps
100%
HD Graphics (Bay Trail):
8.1 fps
235%
HD Graphics 3000:
15.8 21.7 [X] Schenker XMG A501 Intel Core i7-2630QM 2GHz
HD Graphics 3000
~ 19 fps
HD Graphics 3000:
12.3 [X] Schenker XMG A501 Intel Core i7-2630QM 2GHz
HD Graphics 3000
fps
100%
HD Graphics (Bay Trail):
5.8 fps
103%
HD Graphics 3000:
4 4 9.1 [X] Schenker XMG A501 Intel Core i7-2630QM 2GHz
HD Graphics 3000
~ 6 fps
100%
HD Graphics (Bay Trail):
2.3 fps
270%
HD Graphics 3000:
6.2 [X] Schenker XMG A501 Intel Core i7-2630QM 2GHz
HD Graphics 3000
fps
HD Graphics 3000:
41.3 [X] Schenker Xesia M501 Intel Core i5-2430M 2.4GHz
HD Graphics 3000
fps
HD Graphics 3000:
11 [X] Schenker Xesia M501 Intel Core i5-2430M 2.4GHz
HD Graphics 3000
fps
188%
HD Graphics 3000:
21 21.5 22 24 29.3 [X] Dell Inspiron N411z (C0425821) Intel Core i3-2330M 2.2GHz
HD Graphics 3000
29.3 29.6 30 30 30.2 30.3 30.6 30.7 31.1 31.4 31.6 32 [X] Sony Vaio VPCCA290X Intel Core i5-2410M 2.3GHz
HD Graphics 3000
32 32 32.7 33.4 34 [X] Acer Aspire 3830TG-6431 Intel Core i5-2410M 2.3GHz
HD Graphics 3000
35 35.2 35.3 [X] Asus X501A-XX381H Intel Core i3-2328M 2.2GHz
HD Graphics 3000
36.7 [X] Schenker XMG A501 Intel Core i7-2630QM 2GHz
HD Graphics 3000
39.2 [X] Asus B33E PL Intel Core i7-2620M 2.7GHz
HD Graphics 3000
42 [X] no model Intel Core i7-2860QM 2.5GHz
HD Graphics 3000
47.4 ~ 32 fps
200%
HD Graphics (Cherry Trail):
8 fps
200%
HD Graphics 3000:
6 6.1 7 7 7.4 [X] Dell Inspiron N411z (C0425821) Intel Core i3-2330M 2.2GHz
HD Graphics 3000
7.7 8 [X] Sony Vaio VPCCA290X Intel Core i5-2410M 2.3GHz
HD Graphics 3000
8.1 8.6 8.8 9 9 9.6 [X] Asus B33E PL Intel Core i7-2620M 2.7GHz
HD Graphics 3000
~ 8 fps
100%
HD Graphics (Bay Trail):
1.1 fps
273%
HD Graphics 3000:
3 [X] Sony Vaio VPCCA290X Intel Core i5-2410M 2.3GHz
HD Graphics 3000
fps
100%
HD Graphics (Bay Trail):
11 11.8 ~ 11 fps
155%
HD Graphics (Cherry Trail):
15.5 18.9 ~ 17 fps
173%
HD Graphics 3000:
12 [X] Sony Vaio VPCCA290X Intel Core i5-2410M 2.3GHz
HD Graphics 3000
17 17 18 [X] Acer Aspire 3830TG-6431 Intel Core i5-2410M 2.3GHz
HD Graphics 3000
18 18 18.7 19.4 19.7 21.1 22.5 25 [X] no model Intel Core i7-2860QM 2.5GHz
HD Graphics 3000
25.2 [X] Schenker XMG A501 Intel Core i7-2630QM 2GHz
HD Graphics 3000
~ 19 fps
100%
HD Graphics (Bay Trail):
10 fps
80%
HD Graphics (Cherry Trail):
7.2 8.5 ~ 8 fps
100%
HD Graphics 3000:
8 [X] Sony Vaio VPCCA290X Intel Core i5-2410M 2.3GHz
HD Graphics 3000
8 9 [X] Acer Aspire 3830TG-6431 Intel Core i5-2410M 2.3GHz
HD Graphics 3000
9 9 9.2 9.6 9.9 10 10.5 11.2 13 [X] no model Intel Core i7-2860QM 2.5GHz
HD Graphics 3000
~ 10 fps
HD Graphics 3000:
7 [X] Acer Aspire 3830TG-6431 Intel Core i5-2410M 2.3GHz
HD Graphics 3000
8.5 ~ 8 fps
HD Graphics 3000:
70.9 [X] Schenker XMG A501 Intel Core i7-2630QM 2GHz
HD Graphics 3000
fps
HD Graphics 3000:
31.9 [X] Schenker XMG A501 Intel Core i7-2630QM 2GHz
HD Graphics 3000
fps
HD Graphics 3000:
13.4 [X] Schenker XMG A501 Intel Core i7-2630QM 2GHz
HD Graphics 3000
fps
HD Graphics 3000:
6.9 [X] Schenker XMG A501 Intel Core i7-2630QM 2GHz
HD Graphics 3000
fps
100%
HD Graphics (Bay Trail):
8 fps
138%
HD Graphics 3000:
7 (!) [X] Acer Aspire 3830TG-6431 Intel Core i5-2410M 2.3GHz
HD Graphics 3000
7 (!) [X] no model Intel Core i7-2860QM 2.5GHz
HD Graphics 3000
13.8 16.6 [X] Schenker XMG A501 Intel Core i7-2630QM 2GHz
HD Graphics 3000
~ 11 fps
100%
HD Graphics (Bay Trail):
4.8 fps
HD Graphics 3000:
23 23 45 [X] no model Intel Core i7-2860QM 2.5GHz
HD Graphics 3000
~ 30 fps
HD Graphics 3000:
18 18 32 [X] no model Intel Core i7-2860QM 2.5GHz
HD Graphics 3000
~ 23 fps
HD Graphics 3000:
49.9 49.9 55 63 66.5 67 69 76 76.3 79 80.4 81 84 [X] Acer Aspire 3830TG-6431 Intel Core i5-2410M 2.3GHz
HD Graphics 3000
94 [X] Asus X501A-XX381H Intel Core i3-2328M 2.2GHz
HD Graphics 3000
106.5 108.6 [X] Dell Inspiron N411z (C0425821) Intel Core i3-2330M 2.2GHz
HD Graphics 3000
118.6 [X] Asus B33E PL Intel Core i7-2620M 2.7GHz
HD Graphics 3000
120.4 185 [X] no model Intel Core i7-2860QM 2.5GHz
HD Graphics 3000
~ 86 fps
HD Graphics 3000:
22.9 22.9 29.5 33 34 37 42 42.7 47 47.1 48 49.2 [X] Asus X501A-XX381H Intel Core i3-2328M 2.2GHz
HD Graphics 3000
53.4 54.1 57 [X] Acer Aspire 3830TG-6431 Intel Core i5-2410M 2.3GHz
HD Graphics 3000
61.7 [X] Dell Inspiron N411z (C0425821) Intel Core i3-2330M 2.2GHz
HD Graphics 3000
65.1 86.5 [X] Asus B33E PL Intel Core i7-2620M 2.7GHz
HD Graphics 3000
91 [X] no model Intel Core i7-2860QM 2.5GHz
HD Graphics 3000
~ 49 fps
HD Graphics 3000:
18 18 19 19.9 21 25 25.5 26.6 27 27 27.8 28 [X] Acer Aspire 3830TG-6431 Intel Core i5-2410M 2.3GHz
HD Graphics 3000
28 30.2 30.6 [X] Schenker XMG A501 Intel Core i7-2630QM 2GHz
HD Graphics 3000
30.9 46 [X] no model Intel Core i7-2860QM 2.5GHz
HD Graphics 3000
47.7 [X] Asus B33E PL Intel Core i7-2620M 2.7GHz
HD Graphics 3000
~ 28 fps
HD Graphics 3000:
19 [X] Acer Aspire 3830TG-6431 Intel Core i5-2410M 2.3GHz
HD Graphics 3000
19 27 [X] no model Intel Core i7-2860QM 2.5GHz
HD Graphics 3000
~ 22 fps
HD Graphics 3000:
30 33 38.5 48 [X] Acer Aspire 3830TG-6431 Intel Core i5-2410M 2.3GHz
HD Graphics 3000
70 [X] no model Intel Core i7-2860QM 2.5GHz
HD Graphics 3000
~ 44 fps
HD Graphics 3000:
16 18 20 22 [X] Acer Aspire 3830TG-6431 Intel Core i5-2410M 2.3GHz
HD Graphics 3000
30 [X] Schenker XMG A501 Intel Core i7-2630QM 2GHz
HD Graphics 3000
35 [X] no model Intel Core i7-2860QM 2.5GHz
HD Graphics 3000
~ 24 fps
100%
HD Graphics (Bay Trail):
19.7 fps
130%
HD Graphics (Cherry Trail):
25.6 fps
183%
HD Graphics 3000:
24 26.7 28 31.2 33 42 [X] Acer Aspire 3830TG-6431 Intel Core i5-2410M 2.3GHz
HD Graphics 3000
51 [X] no model Intel Core i7-2860QM 2.5GHz
HD Graphics 3000
53 [X] Alienware M18x Intel Core i7-2920XM @4GHz
HD Graphics 3000
~ 36 fps
HD Graphics (Cherry Trail):
12 fps
100%
HD Graphics (Bay Trail):
24.1 36.9 ~ 31 fps
91%
HD Graphics (Cherry Trail):
28.1 fps
100%
HD Graphics (Bay Trail):
12.9 13.3 ~ 13 fps
96%
HD Graphics (Cherry Trail):
12.5 fps
200%
HD Graphics 3000:
12.3 21.6 22 23 25.1 29 29 30.6 [X] no model Intel Core i7-2820QM 2.3GHz
HD Graphics 3000
31 31 31.8 [X] Schenker XMG A501 Intel Core i7-2630QM 2GHz
HD Graphics 3000
~ 26 fps
HD Graphics 3000:
8.3 16 18 18 18 18 19.9 [X] no model Intel Core i7-2820QM 2.3GHz
HD Graphics 3000
~ 17 fps
HD Graphics 3000:
12.9 [X] no model Intel Core i7-2820QM 2.3GHz
HD Graphics 3000
13 13 ~ 13 fps
HD Graphics 3000:
13 [X] Acer Aspire 3830TG-6431 Intel Core i5-2410M 2.3GHz
HD Graphics 3000
fps
HD Graphics 3000:
27 [X] MSI CX640-i547W7P Intel Core i5-2410M 2.3GHz
HD Graphics 3000
30 30 33 [X] no model Intel Core i7-2820QM 2.3GHz
HD Graphics 3000
~ 30 fps
HD Graphics 3000:
18 [X] MSI CX640-i547W7P Intel Core i5-2410M 2.3GHz
HD Graphics 3000
18.5 [X] Schenker XMG A501 Intel Core i7-2630QM 2GHz
HD Graphics 3000
19 19 20 [X] no model Intel Core i7-2820QM 2.3GHz
HD Graphics 3000
~ 19 fps
HD Graphics 3000:
13 [X] MSI CX640-i547W7P Intel Core i5-2410M 2.3GHz
HD Graphics 3000
15 15 16 [X] no model Intel Core i7-2820QM 2.3GHz
HD Graphics 3000
~ 15 fps
HD Graphics 3000:
4 [X] MSI CX640-i547W7P Intel Core i5-2410M 2.3GHz
HD Graphics 3000
4 4 ~ 4 fps
HD Graphics 3000:
59.1 62.7 79 [X] Acer Aspire 3830TG-6431 Intel Core i5-2410M 2.3GHz
HD Graphics 3000
88 [X] Alienware M18x Intel Core i7-2920XM @4GHz
HD Graphics 3000
~ 72 fps
HD Graphics 3000:
5 (!) [X] Toshiba Portégé Z830-10N Intel Core i3-2367M 1.4GHz
HD Graphics 3000
6 [X] Alienware M18x Intel Core i7-2920XM @4GHz
HD Graphics 3000
6.2 [X] Acer Aspire 3830TG-6431 Intel Core i5-2410M 2.3GHz
HD Graphics 3000
15.7 ~ 8 fps
HD Graphics 3000:
-1 [X] Alienware M18x Intel Core i7-2920XM @4GHz
HD Graphics 3000
fps
HD Graphics 3000:
20.9 [X] Asus U30SD-XA1 Intel HD 3000 Intel Core i5-2410M 2.3GHz
HD Graphics 3000
21 21 22.7 [X] Asus N53SV HD3000 Intel Core i7-2720QM 2.2GHz
HD Graphics 3000
24.4 25 26 27 27 29 [X] no model Intel Core i7-2820QM 2.3GHz
HD Graphics 3000
32 [X] no model Intel Core i5-2500K 3.3GHz
HD Graphics 3000
32 [X] no model Intel Core i7-2600K 3.4GHz
HD Graphics 3000
~ 26 fps
HD Graphics 3000:
15 15.6 [X] Asus U30SD-XA1 Intel HD 3000 Intel Core i5-2410M 2.3GHz
HD Graphics 3000
16 16.5 18 18 18 18.3 [X] Asus N53SV HD3000 Intel Core i7-2720QM 2.2GHz
HD Graphics 3000
19 [X] no model Intel Core i7-2820QM 2.3GHz
HD Graphics 3000
22 [X] no model Intel Core i5-2500K 3.3GHz
HD Graphics 3000
27 [X] Schenker XMG A501 Intel Core i7-2630QM 2GHz
HD Graphics 3000
~ 18 fps
HD Graphics 3000:
9.3 [X] Asus U30SD-XA1 Intel HD 3000 Intel Core i5-2410M 2.3GHz
HD Graphics 3000
10.2 13 13 14 [X] no model Intel Core i5-2500K 3.3GHz
HD Graphics 3000
14 17.9 [X] Asus N53SV HD3000 Intel Core i7-2720QM 2.2GHz
HD Graphics 3000
~ 13 fps
HD Graphics 3000:
5.7 6 6 ~ 6 fps
HD Graphics 3000:
53 [X] Samsung 350U2A-A01PL Intel Core i3-2357M 1.3GHz
HD Graphics 3000
80.7 [X] MSI CR640-048XPL Intel Core i3-2310M 2.1GHz
HD Graphics 3000
88.3 [X] Toshiba Satellite Pro R850-122 Intel Core i3-2310M 2.1GHz
HD Graphics 3000
97.7 [X] HP ProBook 6360b LG632EA Intel Core i5-2410M 2.3GHz
HD Graphics 3000
98 98 98 99.8 [X] Fujitsu LifeBook P771 (VFY:P7710MF011PL) Intel Core i7-2617M 1.5GHz
HD Graphics 3000
101 101 101.8 [X] HP Folio 13 (B0N00AA) Intel Core i5-2467M 1.6GHz
HD Graphics 3000
107.3 [X] Samsung QX311-A01PL Intel Core i5-2410M 2.3GHz
HD Graphics 3000
117 127 [X] Chiligreen Platin TS Intel Core i3-2330M 2.2GHz
HD Graphics 3000
132.8 ~ 100 fps
HD Graphics 3000:
31.1 [X] Samsung 350U2A-A01PL Intel Core i3-2357M 1.3GHz
HD Graphics 3000
48.2 [X] Asus K53E-SX058V Intel Core i3-2310M 2.1GHz
HD Graphics 3000
49.3 [X] MSI CR640-048XPL Intel Core i3-2310M 2.1GHz
HD Graphics 3000
54 54 54 55.1 [X] Fujitsu LifeBook P771 (VFY:P7710MF011PL) Intel Core i7-2617M 1.5GHz
HD Graphics 3000
55.8 [X] HP Folio 13 (B0N00AA) Intel Core i5-2467M 1.6GHz
HD Graphics 3000
55.9 [X] Toshiba Satellite Pro R850-122 Intel Core i3-2310M 2.1GHz
HD Graphics 3000
56 56 57 [X] HP ProBook 6360b LG632EA Intel Core i5-2410M 2.3GHz
HD Graphics 3000
61 [X] Chiligreen Platin TS Intel Core i3-2330M 2.2GHz
HD Graphics 3000
62.6 [X] Asus Zenbook UX21E-KX004V Intel Core i5-2467M 1.6GHz
HD Graphics 3000
63 63.5 [X] Samsung QX311-A01PL Intel Core i5-2410M 2.3GHz
HD Graphics 3000
65.7 ~ 55 fps
HD Graphics 3000:
21.4 [X] MSI CR640-048XPL Intel Core i3-2310M 2.1GHz
HD Graphics 3000
21.7 [X] HP ProBook 6360b LG632EA Intel Core i5-2410M 2.3GHz
HD Graphics 3000
24 [X] Asus K53E-SX058V Intel Core i3-2310M 2.1GHz
HD Graphics 3000
26.2 [X] Toshiba Satellite Pro R850-122 Intel Core i3-2310M 2.1GHz
HD Graphics 3000
29.4 [X] HP Folio 13 (B0N00AA) Intel Core i5-2467M 1.6GHz
HD Graphics 3000
32 32 32 32 32 32 32 [X] Chiligreen Platin TS Intel Core i3-2330M 2.2GHz
HD Graphics 3000
35.9 [X] Samsung QX311-A01PL Intel Core i5-2410M 2.3GHz
HD Graphics 3000
36.2 [X] Asus Zenbook UX21E-KX004V Intel Core i5-2467M 1.6GHz
HD Graphics 3000
41.4 44 [X] no model Intel Core i5-2500K 3.3GHz
HD Graphics 3000
46 [X] no model Intel Core i7-2820QM 2.3GHz
HD Graphics 3000
~ 32 fps
HD Graphics 3000:
21 23 [X] no model Intel Core i7-2820QM 2.3GHz
HD Graphics 3000
23 23 25 [X] no model Intel Core i5-2500K 3.3GHz
HD Graphics 3000
~ 23 fps
100%
HD Graphics (Bay Trail):
9.3 fps
201%
HD Graphics (Cherry Trail):
18.7 fps
161%
HD Graphics 3000:
9.8 16.9 [X] Alienware M18x Intel Core i7-2920XM @4GHz
HD Graphics 3000
16.9 [X] Acer Aspire 3830TG-6431 Intel Core i5-2410M 2.3GHz
HD Graphics 3000
~ 15 fps
HD Graphics 3000:
5 (!) [X] Alienware M18x Intel Core i7-2920XM @4GHz
HD Graphics 3000
fps
100%
HD Graphics (Bay Trail):
5 10.5 [X] Asus Transformer Book T200TA PL Intel Atom Z3775 1.5GHz
HD Graphics (Bay Trail)
~ 8 fps
163%
HD Graphics 3000:
7 7 7.7 9 9 20.5 20.8 23 [X] MSI CX640-i547W7P Intel Core i5-2410M 2.3GHz
HD Graphics 3000
~ 13 fps
100%
HD Graphics (Bay Trail):
5.6 [X] Asus Transformer Book T200TA PL Intel Atom Z3775 1.5GHz
HD Graphics (Bay Trail)
fps
304%
HD Graphics 3000:
5.8 17.4 [X] Schenker XMG A501 Intel Core i7-2630QM 2GHz
HD Graphics 3000
17.6 19 [X] MSI CX640-i547W7P Intel Core i5-2410M 2.3GHz
HD Graphics 3000
19 19 19 19 19 ~ 17 fps
100%
HD Graphics (Bay Trail):
3.7 [X] Asus Transformer Book T200TA PL Intel Atom Z3775 1.5GHz
HD Graphics (Bay Trail)
fps
378%
HD Graphics 3000:
4.8 14.4 15 [X] MSI CX640-i547W7P Intel Core i5-2410M 2.3GHz
HD Graphics 3000
15 15 15 15 15 ~ 14 fps
HD Graphics 3000:
8.5 9 [X] MSI CX640-i547W7P Intel Core i5-2410M 2.3GHz
HD Graphics 3000
9 9 ~ 9 fps
100%
HD Graphics (Bay Trail):
32 48 49 53.3 ~ 46 fps
139%
HD Graphics (Cherry Trail):
63.2 64 ~ 64 fps
100%
HD Graphics (Bay Trail):
6 9 9 ~ 8 fps
225%
HD Graphics (Cherry Trail):
18 18.8 ~ 18 fps
225%
HD Graphics 3000:
12 13.3 14 14 15 15 16 16 16 16.3 16.6 17 17 17.8 18 19 [X] no model Intel Core i5-2500K 3.3GHz
HD Graphics 3000
19 19 19.5 [X] Schenker XMG A501 Intel Core i7-2630QM 2GHz
HD Graphics 3000
20 20.4 [X] Asus N53SV HD3000 Intel Core i7-2720QM 2.2GHz
HD Graphics 3000
21 [X] no model Intel Core i7-2820QM 2.3GHz
HD Graphics 3000
21 [X] MSI CX640-i547W7P Intel Core i5-2410M 2.3GHz
HD Graphics 3000
21 22 23 [X] no model Intel Core i7-2600K 3.4GHz
HD Graphics 3000
31.4 ~ 18 fps
100%
HD Graphics (Bay Trail):
3 fps
467%
HD Graphics (Cherry Trail):
14 fps
367%
HD Graphics 3000:
7 7 8 9 10 10 10 10.1 10.2 10.6 11 [X] no model Intel Core i7-2820QM 2.3GHz
HD Graphics 3000
11 11 11 12 [X] no model Intel Core i5-2500K 3.3GHz
HD Graphics 3000
12 [X] MSI CX640-i547W7P Intel Core i5-2410M 2.3GHz
HD Graphics 3000
12 13 13 13.1 [X] Asus N53SV HD3000 Intel Core i7-2720QM 2.2GHz
HD Graphics 3000
14 15 [X] no model Intel Core i7-2600K 3.4GHz
HD Graphics 3000
21.8 ~ 11 fps
HD Graphics (Cherry Trail):
7 fps
HD Graphics 3000:
5 7 [X] MSI CX640-i547W7P Intel Core i5-2410M 2.3GHz
HD Graphics 3000
7 8 [X] no model Intel Core i7-2600K 3.4GHz
HD Graphics 3000
8 8 8.8 9 [X] no model Intel Core i5-2500K 3.3GHz
HD Graphics 3000
~ 8 fps
HD Graphics 3000:
2.7 [X] Acer Aspire 3830TG-6431 Intel Core i5-2410M 2.3GHz
HD Graphics 3000
fps
100%
HD Graphics (Bay Trail):
12 [X] Asus Transformer Book T200TA PL Intel Atom Z3775 1.5GHz
HD Graphics (Bay Trail)
fps
192%
HD Graphics 3000:
18.2 [X] Asus K53E-SX058V Intel Core i3-2310M 2.1GHz
HD Graphics 3000
19.4 [X] Samsung 400B2B-H01PL Intel Core i5-2410M 2.3GHz
HD Graphics 3000
21.1 [X] Fujitsu LifeBook P771 (VFY:P7710MF011PL) Intel Core i7-2617M 1.5GHz
HD Graphics 3000
24 25 [X] no model Intel Core i5-2500K 3.3GHz
HD Graphics 3000
26 [X] no model Intel Core i7-2820QM 2.3GHz
HD Graphics 3000
30.3 [X] Schenker XMG A501 Intel Core i7-2630QM 2GHz
HD Graphics 3000
~ 23 fps
100%
HD Graphics (Bay Trail):
9 [X] Asus Transformer Book T200TA PL Intel Atom Z3775 1.5GHz
HD Graphics (Bay Trail)
fps
133%
HD Graphics 3000:
11 12 [X] no model Intel Core i5-2500K 3.3GHz
HD Graphics 3000
13 [X] no model Intel Core i7-2820QM 2.3GHz
HD Graphics 3000
~ 12 fps
HD Graphics 3000:
31.1 39 [X] Acer Aspire 3830TG-6431 Intel Core i5-2410M 2.3GHz
HD Graphics 3000
41 [X] Alienware M18x Intel Core i7-2920XM @4GHz
HD Graphics 3000
~ 37 fps
HD Graphics 3000:
12.4 16.3 [X] Acer Aspire 3830TG-6431 Intel Core i5-2410M 2.3GHz
HD Graphics 3000
16.6 [X] Alienware M18x Intel Core i7-2920XM @4GHz
HD Graphics 3000
~ 15 fps
100%
HD Graphics (Bay Trail):
12.8 fps
258%
HD Graphics 3000:
12.1 28 34 [X] no model Intel Core i5-2500K 3.3GHz
HD Graphics 3000
34 [X] MSI CX640-i547W7P Intel Core i5-2410M 2.3GHz
HD Graphics 3000
38 41 [X] no model Intel Core i7-2820QM 2.3GHz
HD Graphics 3000
44 [X] no model Intel Core i7-2600K 3.4GHz
HD Graphics 3000
~ 33 fps
100%
HD Graphics (Bay Trail):
9 fps
200%
HD Graphics 3000:
7.6 14.6 18 22 [X] no model Intel Core i7-2820QM 2.3GHz
HD Graphics 3000
22 [X] MSI CX640-i547W7P Intel Core i5-2410M 2.3GHz
HD Graphics 3000
25.4 [X] Asus N53SV HD3000 Intel Core i7-2720QM 2.2GHz
HD Graphics 3000
~ 18 fps
HD Graphics 3000:
4.6 10.5 14 [X] no model Intel Core i7-2820QM 2.3GHz
HD Graphics 3000
14 [X] MSI CX640-i547W7P Intel Core i5-2410M 2.3GHz
HD Graphics 3000
15.5 [X] Asus N53SV HD3000 Intel Core i7-2720QM 2.2GHz
HD Graphics 3000
~ 12 fps
HD Graphics 3000:
5 [X] no model Intel Core i5-2500K 3.3GHz
HD Graphics 3000
6 [X] MSI CX640-i547W7P Intel Core i5-2410M 2.3GHz
HD Graphics 3000
~ 6 fps
HD Graphics 3000:
55 [X] no model Intel Core i5-2500K 3.3GHz
HD Graphics 3000
61.7 [X] Asus N53SV HD3000 Intel Core i7-2720QM 2.2GHz
HD Graphics 3000
~ 58 fps
HD Graphics 3000:
16 [X] no model Intel Core i5-2500K 3.3GHz
HD Graphics 3000
fps
HD Graphics 3000:
12 [X] no model Intel Core i5-2500K 3.3GHz
HD Graphics 3000
fps
146%
HD Graphics 3000:
19.5 [X] MSI CR640-048XPL Intel Core i3-2310M 2.1GHz
HD Graphics 3000
25.4 [X] Lenovo ThinkPad Edge E420s NWD2QPB Intel Core i3-2310M 2.1GHz
HD Graphics 3000
30 [X] Asus K53E-SX058V Intel Core i3-2310M 2.1GHz
HD Graphics 3000
31.1 [X] Dell Inspiron N411z (C0425821) Intel Core i3-2330M 2.2GHz
HD Graphics 3000
37.7 [X] HP ProBook 6360b LG632EA Intel Core i5-2410M 2.3GHz
HD Graphics 3000
37.9 [X] Fujitsu LifeBook P771 (VFY:P7710MF011PL) Intel Core i7-2617M 1.5GHz
HD Graphics 3000
38 39 [X] Asus B33E PL Intel Core i7-2620M 2.7GHz
HD Graphics 3000
39.5 57 [X] no model Intel Core i5-2500K 3.3GHz
HD Graphics 3000
60 [X] no model Intel Core i7-2820QM 2.3GHz
HD Graphics 3000
~ 38 fps
160%
HD Graphics 3000:
9.7 [X] MSI CR640-048XPL Intel Core i3-2310M 2.1GHz
HD Graphics 3000
14.9 [X] Dell Inspiron N411z (C0425821) Intel Core i3-2330M 2.2GHz
HD Graphics 3000
15 [X] HP ProBook 6360b LG632EA Intel Core i5-2410M 2.3GHz
HD Graphics 3000
15.7 [X] Asus K53E-SX058V Intel Core i3-2310M 2.1GHz
HD Graphics 3000
16 16.1 [X] Fujitsu LifeBook P771 (VFY:P7710MF011PL) Intel Core i7-2617M 1.5GHz
HD Graphics 3000
16.3 [X] Lenovo ThinkPad Edge E420s NWD2QPB Intel Core i3-2310M 2.1GHz
HD Graphics 3000
17.4 18.4 [X] Asus B33E PL Intel Core i7-2620M 2.7GHz
HD Graphics 3000
19 [X] no model Intel Core i5-2500K 3.3GHz
HD Graphics 3000
22 [X] no model Intel Core i7-2820QM 2.3GHz
HD Graphics 3000
~ 16 fps
HD Graphics 3000:
7.7 [X] MSI CR640-048XPL Intel Core i3-2310M 2.1GHz
HD Graphics 3000
9.7 [X] HP ProBook 6360b LG632EA Intel Core i5-2410M 2.3GHz
HD Graphics 3000
10.1 [X] Dell Inspiron N411z (C0425821) Intel Core i3-2330M 2.2GHz
HD Graphics 3000
12.3 [X] Asus B33E PL Intel Core i7-2620M 2.7GHz
HD Graphics 3000
14 [X] no model Intel Core i5-2500K 3.3GHz
HD Graphics 3000
~ 11 fps
229%
HD Graphics 3000:
37 40.6 [X] Asus U30SD-XA1 Intel HD 3000 Intel Core i5-2410M 2.3GHz
HD Graphics 3000
48.7 50.7 58.4 [X] Asus N53SV HD3000 Intel Core i7-2720QM 2.2GHz
HD Graphics 3000
60.5 [X] no model Intel Core i7-2820QM 2.3GHz
HD Graphics 3000
71.1 [X] no model Intel Core i7-2600K 3.4GHz
HD Graphics 3000
72.1 [X] no model Intel Core i5-2500K 3.3GHz
HD Graphics 3000
~ 55 fps
HD Graphics 3000:
14.7 15.3 [X] Asus U30SD-XA1 Intel HD 3000 Intel Core i5-2410M 2.3GHz
HD Graphics 3000
15.9 20.2 20.8 [X] no model Intel Core i7-2820QM 2.3GHz
HD Graphics 3000
20.9 [X] Asus N53SV HD3000 Intel Core i7-2720QM 2.2GHz
HD Graphics 3000
21.6 [X] no model Intel Core i5-2500K 3.3GHz
HD Graphics 3000
23.4 [X] no model Intel Core i7-2600K 3.4GHz
HD Graphics 3000
~ 19 fps
HD Graphics 3000:
5.7 [X] Asus U30SD-XA1 Intel HD 3000 Intel Core i5-2410M 2.3GHz
HD Graphics 3000
7.8 8.4 9.5 [X] no model Intel Core i5-2500K 3.3GHz
HD Graphics 3000
10 [X] no model Intel Core i7-2820QM 2.3GHz
HD Graphics 3000
10.8 [X] no model Intel Core i7-2600K 3.4GHz
HD Graphics 3000
~ 9 fps
HD Graphics 3000:
24.9 [X] HP ProBook 6360b LG632EA Intel Core i5-2410M 2.3GHz
HD Graphics 3000
33.8 [X] MSI CR640-048XPL Intel Core i3-2310M 2.1GHz
HD Graphics 3000
37.1 [X] Asus N53SV HD3000 Intel Core i7-2720QM 2.2GHz
HD Graphics 3000
~ 32 fps
HD Graphics 3000:
11.5 [X] HP ProBook 6360b LG632EA Intel Core i5-2410M 2.3GHz
HD Graphics 3000
14.9 [X] MSI CR640-048XPL Intel Core i3-2310M 2.1GHz
HD Graphics 3000
23.6 [X] Asus N53SV HD3000 Intel Core i7-2720QM 2.2GHz
HD Graphics 3000
~ 17 fps
HD Graphics 3000:
8.7 [X] HP ProBook 6360b LG632EA Intel Core i5-2410M 2.3GHz
HD Graphics 3000
9.3 [X] MSI CR640-048XPL Intel Core i3-2310M 2.1GHz
HD Graphics 3000
19.4 [X] Asus N53SV HD3000 Intel Core i7-2720QM 2.2GHz
HD Graphics 3000
~ 12 fps
HD Graphics 3000:
18.7 [X] MSI CR640-048XPL Intel Core i3-2310M 2.1GHz
HD Graphics 3000
19.7 [X] Toshiba Satellite Pro R850-122 Intel Core i3-2310M 2.1GHz
HD Graphics 3000
21.2 [X] HP ProBook 6360b LG632EA Intel Core i5-2410M 2.3GHz
HD Graphics 3000
22.4 [X] Samsung 350U2A-A01PL Intel Core i3-2357M 1.3GHz
HD Graphics 3000
28.7 [X] Asus K53E-SX058V Intel Core i3-2310M 2.1GHz
HD Graphics 3000
29.7 [X] Fujitsu LifeBook P771 (VFY:P7710MF011PL) Intel Core i7-2617M 1.5GHz
HD Graphics 3000
31.4 [X] Lenovo ThinkPad Edge E420s NWD2QPB Intel Core i3-2310M 2.1GHz
HD Graphics 3000
32.9 [X] Asus Zenbook UX21E-KX004V Intel Core i5-2467M 1.6GHz
HD Graphics 3000
33.4 [X] HP Folio 13 (B0N00AA) Intel Core i5-2467M 1.6GHz
HD Graphics 3000
34.2 [X] Samsung 400B2B-H01PL Intel Core i5-2410M 2.3GHz
HD Graphics 3000
34.5 [X] HP ProBook 4340s (B6M41EA) Intel Core i3-2370M 2.4GHz
HD Graphics 3000
35.4 38.2 [X] no model Intel Core i5-2500K 3.3GHz
HD Graphics 3000
38.7 [X] Samsung QX311-A01PL Intel Core i5-2410M 2.3GHz
HD Graphics 3000
40.9 [X] no model Intel Core i7-2820QM 2.3GHz
HD Graphics 3000
45.1 [X] no model Intel Core i7-2600K 3.4GHz
HD Graphics 3000
~ 32 fps
HD Graphics 3000:
13.3 [X] Samsung 350U2A-A01PL Intel Core i3-2357M 1.3GHz
HD Graphics 3000
16 [X] MSI CR640-048XPL Intel Core i3-2310M 2.1GHz
HD Graphics 3000
16.6 [X] Toshiba Satellite Pro R850-122 Intel Core i3-2310M 2.1GHz
HD Graphics 3000
17.8 [X] HP ProBook 6360b LG632EA Intel Core i5-2410M 2.3GHz
HD Graphics 3000
19.2 [X] Asus K53E-SX058V Intel Core i3-2310M 2.1GHz
HD Graphics 3000
19.6 [X] Lenovo ThinkPad Edge E420s NWD2QPB Intel Core i3-2310M 2.1GHz
HD Graphics 3000
19.8 [X] Fujitsu LifeBook P771 (VFY:P7710MF011PL) Intel Core i7-2617M 1.5GHz
HD Graphics 3000
21.1 21.7 [X] Samsung 400B2B-H01PL Intel Core i5-2410M 2.3GHz
HD Graphics 3000
21.7 [X] HP Folio 13 (B0N00AA) Intel Core i5-2467M 1.6GHz
HD Graphics 3000
22.2 [X] Asus Zenbook UX21E-KX004V Intel Core i5-2467M 1.6GHz
HD Graphics 3000
24.1 [X] Samsung QX311-A01PL Intel Core i5-2410M 2.3GHz
HD Graphics 3000
24.2 [X] Dell Vostro 3450 (Vostro0150) Intel Core i3-2310M 2.1GHz
HD Graphics 3000
24.2 [X] HP ProBook 4340s (B6M41EA) Intel Core i3-2370M 2.4GHz
HD Graphics 3000
26.2 [X] no model Intel Core i5-2500K 3.3GHz
HD Graphics 3000
30 [X] no model Intel Core i7-2600K 3.4GHz
HD Graphics 3000
30.6 [X] no model Intel Core i7-2820QM 2.3GHz
HD Graphics 3000
~ 22 fps
HD Graphics 3000:
12.7 [X] MSI CR640-048XPL Intel Core i3-2310M 2.1GHz
HD Graphics 3000
12.7 [X] HP Folio 13 (B0N00AA) Intel Core i5-2467M 1.6GHz
HD Graphics 3000
12.7 [X] HP ProBook 4340s (B6M41EA) Intel Core i3-2370M 2.4GHz
HD Graphics 3000
12.8 13.2 [X] Toshiba Satellite Pro R850-122 Intel Core i3-2310M 2.1GHz
HD Graphics 3000
13.6 [X] HP ProBook 6360b LG632EA Intel Core i5-2410M 2.3GHz
HD Graphics 3000
14.5 [X] Asus K53E-SX058V Intel Core i3-2310M 2.1GHz
HD Graphics 3000
15.9 [X] no model Intel Core i5-2500K 3.3GHz
HD Graphics 3000
17.7 [X] no model Intel Core i7-2820QM 2.3GHz
HD Graphics 3000
18.8 [X] no model Intel Core i7-2600K 3.4GHz
HD Graphics 3000
~ 14 fps
HD Graphics 3000:
12.7 [X] no model Intel Core i5-2500K 3.3GHz
HD Graphics 3000
12.7 [X] no model Intel Core i7-2600K 3.4GHz
HD Graphics 3000
12.7 [X] no model Intel Core i7-2820QM 2.3GHz
HD Graphics 3000
~ 13 fps
HD Graphics 3000:
37.6 [X] Samsung 350U2A-A01PL Intel Core i3-2357M 1.3GHz
HD Graphics 3000
40 [X] no model Intel Core i5-2500K 3.3GHz
HD Graphics 3000
45.7 [X] Asus N53SV HD3000 Intel Core i7-2720QM 2.2GHz
HD Graphics 3000
45.9 [X] Lenovo ThinkPad Edge E420s NWD2QPB Intel Core i3-2310M 2.1GHz
HD Graphics 3000
46.3 [X] Chiligreen Platin TS Intel Core i3-2330M 2.2GHz
HD Graphics 3000
51.2 [X] Asus K53E-SX058V Intel Core i3-2310M 2.1GHz
HD Graphics 3000
53.1 [X] Samsung 400B2B-H01PL Intel Core i5-2410M 2.3GHz
HD Graphics 3000
58.6 [X] HP Folio 13 (B0N00AA) Intel Core i5-2467M 1.6GHz
HD Graphics 3000
70.5 [X] Fujitsu LifeBook P771 (VFY:P7710MF011PL) Intel Core i7-2617M 1.5GHz
HD Graphics 3000
~ 50 fps
HD Graphics 3000:
7 [X] no model Intel Core i5-2500K 3.3GHz
HD Graphics 3000
7.2 [X] Fujitsu LifeBook P771 (VFY:P7710MF011PL) Intel Core i7-2617M 1.5GHz
HD Graphics 3000
8.8 [X] Asus N53SV HD3000 Intel Core i7-2720QM 2.2GHz
HD Graphics 3000
9.3 [X] HP Folio 13 (B0N00AA) Intel Core i5-2467M 1.6GHz
HD Graphics 3000
10.3 [X] Samsung 400B2B-H01PL Intel Core i5-2410M 2.3GHz
HD Graphics 3000
~ 9 fps
HD Graphics 3000:
3 (!) [X] Alienware M18x Intel Core i7-2920XM @4GHz
HD Graphics 3000
fps
HD Graphics 3000:
63 93 111 164 [X] no model Intel Core i5-2500K 3.3GHz
HD Graphics 3000
~ 108 fps
HD Graphics 3000:
25.9 33 [X] no model Intel Core i5-2500K 3.3GHz
HD Graphics 3000
38 45 ~ 35 fps
HD Graphics 3000:
18 [X] no model Intel Core i5-2500K 3.3GHz
HD Graphics 3000
23 ~ 21 fps
HD Graphics 3000:
59.4 84 [X] no model Intel Core i7-2820QM 2.3GHz
HD Graphics 3000
~ 72 fps
HD Graphics 3000:
18.1 32 [X] no model Intel Core i7-2820QM 2.3GHz
HD Graphics 3000
~ 25 fps
HD Graphics 3000:
11.2 fps
HD Graphics 3000:
-1 [X] no model Intel Core i5-2500K 3.3GHz
HD Graphics 3000
-1 ~ -1 fps
HD Graphics 3000:
117.1 [X] Asus N53SV HD3000 Intel Core i7-2720QM 2.2GHz
HD Graphics 3000
fps
HD Graphics 3000:
55 [X] no model Intel Core i7-2820QM 2.3GHz
HD Graphics 3000
69.3 [X] Asus N53SV HD3000 Intel Core i7-2720QM 2.2GHz
HD Graphics 3000
72 [X] no model Intel Core i7-2600K 3.4GHz
HD Graphics 3000
~ 65 fps
HD Graphics 3000:
62.7 [X] Asus N53SV HD3000 Intel Core i7-2720QM 2.2GHz
HD Graphics 3000
fps
HD Graphics 3000:
18.8 [X] Asus N53SV HD3000 Intel Core i7-2720QM 2.2GHz
HD Graphics 3000
fps
HD Graphics 3000:
25.7 31.8 35.5 [X] Toshiba Satellite Pro R850-122 Intel Core i3-2310M 2.1GHz
HD Graphics 3000
~ 31 fps
HD Graphics 3000:
21.6 [X] Toshiba Satellite Pro R850-122 Intel Core i3-2310M 2.1GHz
HD Graphics 3000
22.3 26.1 ~ 23 fps
100%
HD Graphics (Bay Trail):
42.9 69.8 69.8 71.6 72 72.7 75.1 75.5 76 [X] Medion Akoya E1232T-MD99410 Intel Celeron N2807 1.6GHz
HD Graphics (Bay Trail)
76.7 77.1 80.9 83.1 83.9 84.3 [X] Captiva PAD 10.1 Windows Intel Atom Z3735D 1.3GHz
HD Graphics (Bay Trail)
84.8 [X] ODYS Winpad V10 Intel Atom Z3735F 1.3GHz
HD Graphics (Bay Trail)
85.6 [X] cmx WinTek 101-1016 Intel Atom Z3735F 1.3GHz
HD Graphics (Bay Trail)
86.9 90.2 ~ 77 fps
157%
HD Graphics 3000:
99 125 127 127 128 [X] MSI CX640-i547W7P Intel Core i5-2410M 2.3GHz
HD Graphics 3000
~ 121 fps
100%
HD Graphics (Bay Trail):
10.3 14 [X] Medion Akoya E1232T-MD99410 Intel Celeron N2807 1.6GHz
HD Graphics (Bay Trail)
17.7 18 18.1 18.1 18.7 18.8 [X] Captiva PAD 10.1 Windows Intel Atom Z3735D 1.3GHz
HD Graphics (Bay Trail)
19.3 19.4 19.4 19.8 19.8 20.5 20.5 [X] cmx WinTek 101-1016 Intel Atom Z3735F 1.3GHz
HD Graphics (Bay Trail)
20.6 21 [X] ODYS Winpad V10 Intel Atom Z3735F 1.3GHz
HD Graphics (Bay Trail)
21.5 23.6 ~ 19 fps
205%
HD Graphics 3000:
21.2 36.6 41 [X] MSI CX640-i547W7P Intel Core i5-2410M 2.3GHz
HD Graphics 3000
42 42 49.5 [X] no model Intel Core i5-2500K 3.3GHz
HD Graphics 3000
~ 39 fps
100%
HD Graphics (Bay Trail):
6.4 [X] Captiva PAD 10.1 Windows Intel Atom Z3735D 1.3GHz
HD Graphics (Bay Trail)
7.7 ~ 7 fps
186%
HD Graphics 3000:
11 (!) [X] Toshiba Portégé Z830-10N Intel Core i3-2367M 1.4GHz
HD Graphics 3000
13 [X] MSI CX640-i547W7P Intel Core i5-2410M 2.3GHz
HD Graphics 3000
14.2 [X] no model Intel Core i5-2500K 3.3GHz
HD Graphics 3000
~ 13 fps
HD Graphics 3000:
62.3 [X] MSI CR640-048XPL Intel Core i3-2310M 2.1GHz
HD Graphics 3000
63.2 [X] Toshiba Satellite Pro R850-122 Intel Core i3-2310M 2.1GHz
HD Graphics 3000
83 [X] no model Intel Core i5-2500K 3.3GHz
HD Graphics 3000
~ 70 fps
HD Graphics 3000:
30.4 [X] MSI CR640-048XPL Intel Core i3-2310M 2.1GHz
HD Graphics 3000
30.6 [X] Toshiba Satellite Pro R850-122 Intel Core i3-2310M 2.1GHz
HD Graphics 3000
35 [X] no model Intel Core i5-2500K 3.3GHz
HD Graphics 3000
~ 32 fps
HD Graphics 3000:
12 [X] no model Intel Core i5-2500K 3.3GHz
HD Graphics 3000
fps
HD Graphics 3000:
16.9 19 28.2 34.7 [X] no model Intel Core i7-2820QM 2.3GHz
HD Graphics 3000
38.1 54.9 [X] no model Intel Core i5-2500K 3.3GHz
HD Graphics 3000
~ 32 fps
HD Graphics 3000:
5.1 11.1 13 18.5 [X] no model Intel Core i5-2500K 3.3GHz
HD Graphics 3000
~ 12 fps
100%
HD Graphics (Bay Trail):
18.9 19 ~ 19 fps
189%
HD Graphics 3000:
24.8 35 [X] MSI CX640-i547W7P Intel Core i5-2410M 2.3GHz
HD Graphics 3000
35.3 42.2 [X] no model Intel Core i7-2820QM 2.3GHz
HD Graphics 3000
44 [X] no model Intel Core i5-2500K 3.3GHz
HD Graphics 3000
~ 36 fps
100%
HD Graphics (Bay Trail):
7.6 8.7 ~ 8 fps
238%
HD Graphics 3000:
17 [X] MSI CX640-i547W7P Intel Core i5-2410M 2.3GHz
HD Graphics 3000
17.4 18 [X] no model Intel Core i7-2820QM 2.3GHz
HD Graphics 3000
24.8 [X] no model Intel Core i5-2500K 3.3GHz
HD Graphics 3000
~ 19 fps
HD Graphics 3000:
10.6 11.6 [X] no model Intel Core i5-2500K 3.3GHz
HD Graphics 3000
12 [X] MSI CX640-i547W7P Intel Core i5-2410M 2.3GHz
HD Graphics 3000
~ 11 fps
HD Graphics 3000:
3.1 [X] no model Intel Core i5-2500K 3.3GHz
HD Graphics 3000
fps
HD Graphics 3000:
26 34.2 36 [X] MSI CX640-i547W7P Intel Core i5-2410M 2.3GHz
HD Graphics 3000
44.1 [X] no model Intel Core i7-2820QM 2.3GHz
HD Graphics 3000
~ 35 fps
HD Graphics 3000:
15 [X] MSI CX640-i547W7P Intel Core i5-2410M 2.3GHz
HD Graphics 3000
15.6 [X] no model Intel Core i7-2820QM 2.3GHz
HD Graphics 3000
16.2 ~ 16 fps
HD Graphics 3000:
9.4 11 [X] MSI CX640-i547W7P Intel Core i5-2410M 2.3GHz
HD Graphics 3000
~ 10 fps
HD Graphics 3000:
33 40 41 69 [X] MSI CX640-i547W7P Intel Core i5-2410M 2.3GHz
HD Graphics 3000
71 88 [X] no model Intel Core i7-2820QM 2.3GHz
HD Graphics 3000
~ 57 fps
HD Graphics 3000:
11 12 14 22 26 [X] MSI CX640-i547W7P Intel Core i5-2410M 2.3GHz
HD Graphics 3000
32 [X] no model Intel Core i7-2820QM 2.3GHz
HD Graphics 3000
~ 20 fps
HD Graphics 3000:
4 9 10 11 [X] MSI CX640-i547W7P Intel Core i5-2410M 2.3GHz
HD Graphics 3000
14 [X] no model Intel Core i7-2820QM 2.3GHz
HD Graphics 3000
~ 10 fps
HD Graphics 3000:
4 [X] no model Intel Core i7-2820QM 2.3GHz
HD Graphics 3000
4 [X] MSI CX640-i547W7P Intel Core i5-2410M 2.3GHz
HD Graphics 3000
4 ~ 4 fps
HD Graphics 3000:
9.1 [X] Toshiba Satellite Pro R850-122 Intel Core i3-2310M 2.1GHz
HD Graphics 3000
10 ~ 10 fps
HD Graphics 3000:
107 [X] MSI CX640-i547W7P Intel Core i5-2410M 2.3GHz
HD Graphics 3000
123 [X] no model Intel Core i7-2820QM 2.3GHz
HD Graphics 3000
140.5 [X] no model Intel Core i5-2500K 3.3GHz
HD Graphics 3000
~ 124 fps
HD Graphics 3000:
49 [X] no model Intel Core i5-2500K 3.3GHz
HD Graphics 3000
fps
100%
HD Graphics (Bay Trail):
33 33 35 38 [X] MSI S100 Intel Atom Z3740D 1.3GHz
HD Graphics (Bay Trail)
44 46.2 47 48 49 49 [X] Intel NUC Kit DN2820FYKH Intel Celeron N2820 2.2GHz
HD Graphics (Bay Trail)
min:
39 fps, max:
59 fps
50 [X] Baytrail Reference Tablet Intel Atom Z3770 1.5GHz
HD Graphics (Bay Trail)
min:
36 fps
52 ~ 44 fps
107%
HD Graphics (Cherry Trail):
44 50.9 [X] Chuwi Hi12 Intel Atom x5-Z8300 1.4GHz
HD Graphics (Cherry Trail)
min:
40 fps, max:
60 fps
~ 47 fps
220%
HD Graphics 3000:
61 73 93 103 [X] MSI CX640-i547W7P Intel Core i5-2410M 2.3GHz
HD Graphics 3000
125 129 [X] no model Intel Core i7-2820QM 2.3GHz
HD Graphics 3000
~ 97 fps
100%
HD Graphics (Bay Trail):
9.6 [X] Intel NUC Kit DN2820FYKH Intel Celeron N2820 2.2GHz
HD Graphics (Bay Trail)
min:
3 fps, max:
13 fps
11.5 [X] Baytrail Reference Tablet Intel Atom Z3770 1.5GHz
HD Graphics (Bay Trail)
min:
8 fps
20 22 23 25.3 26 26 28 [X] MSI S100 Intel Atom Z3740D 1.3GHz
HD Graphics (Bay Trail)
34 ~ 23 fps
80%
HD Graphics (Cherry Trail):
18.3 [X] Chuwi Hi12 Intel Atom x5-Z8300 1.4GHz
HD Graphics (Cherry Trail)
min:
13 fps, max:
29 fps
fps
217%
HD Graphics 3000:
32 39 [X] MSI CX640-i547W7P Intel Core i5-2410M 2.3GHz
HD Graphics 3000
47 48 [X] no model Intel Core i7-2820QM 2.3GHz
HD Graphics 3000
58 74 ~ 50 fps
100%
HD Graphics (Bay Trail):
12 12 13.5 ~ 13 fps
77%
HD Graphics 3000:
6 8 12 [X] MSI CX640-i547W7P Intel Core i5-2410M 2.3GHz
HD Graphics 3000
12 13 [X] no model Intel Core i7-2820QM 2.3GHz
HD Graphics 3000
~ 10 fps
100%
HD Graphics (Bay Trail):
5.6 7 ~ 6 fps
100%
HD Graphics 3000:
6 fps
HD Graphics 3000:
75 110 [X] no model Intel Core i7-2820QM 2.3GHz
HD Graphics 3000
~ 93 fps
HD Graphics 3000:
23.5 fps
HD Graphics 3000:
22 37.6 46.8 [X] no model Intel Core i7-2820QM 2.3GHz
HD Graphics 3000
48.6 [X] no model Intel Core i5-2500K 3.3GHz
HD Graphics 3000
~ 39 fps
100%
HD Graphics (Bay Trail):
190 [X] Baytrail Reference Tablet Intel Atom Z3770 1.5GHz
HD Graphics (Bay Trail)
fps
117%
HD Graphics 3000:
203 241.7 [X] no model Intel Core i7-2820QM 2.3GHz
HD Graphics 3000
~ 222 fps
Average Gaming Intel HD Graphics (Bay Trail) → 100% Average Gaming 30-70 fps → 100%
Average Gaming Intel HD Graphics (Cherry Trail) → 165% Average Gaming 30-70 fps → 123%
Average Gaming Intel HD Graphics 3000 → 184% Average Gaming 30-70 fps → 204%
For more games that might be playable and a list of all games and graphics cards visit our Gaming List
v1.26
log 20. 04:55:29
#0 checking url part for id 4922 +0s ... 0s
#1 checking url part for id 6197 +0s ... 0s
#2 checking url part for id 1956 +0s ... 0s
#3 not redirecting to Ajax server +0s ... 0s
#4 did not recreate cache, as it is less than 5 days old! Created at Fri, 19 Apr 2024 05:40:26 +0200 +0.001s ... 0.001s
#5 composed specs +0.172s ... 0.173s
#6 did output specs +0s ... 0.173s
#7 start showIntegratedCPUs +0s ... 0.173s
#8 getting avg benchmarks for device 4922 +0.108s ... 0.281s
#9 got single benchmarks 4922 +0.307s ... 0.588s
#10 getting avg benchmarks for device 6197 +0.014s ... 0.602s
#11 got single benchmarks 6197 +0.083s ... 0.685s
#12 getting avg benchmarks for device 1956 +0.003s ... 0.688s
#13 got single benchmarks 1956 +0.515s ... 1.202s
#14 got avg benchmarks for devices +0s ... 1.202s
#15 No cached benchmark found, getting uncached values +0.824s ... 2.026s
#16 min, max, avg, median took s +0.064s ... 2.091s
#17 before gaming benchmark output +0s ... 2.091s
#18 Got 1606 rows for game benchmarks. +0.256s ... 2.347s
#19 composed SQL query for gamebenchmarks +0s ... 2.347s
#20 got data and put it in $dataArray +0.1s ... 2.447s
#21 benchmarks composed for output. +0.324s ... 2.771s
#22 calculated avg scores. +0s ... 2.771s
#23 return log +0.006s ... 2.777s
Please share our article, every link counts!
Redaktion, 2017-09- 8 (Update: 2023-07- 1)
 Deutsch
 English
 Español
 Français
 Italiano
 Nederlands
 Polski
 Português
 Русский
 Türkçe
 Svenska
 Chinese
 Magyar