Intel HD Graphics (Bay Trail) vs Intel HD Graphics (Cherry Trail) vs Intel HD Graphics 2000
Intel HD Graphics (Bay Trail) ► remove from comparison
The Intel HD Graphics (Bay Trail) is a low-end integrated Bay Trail graphics card found in certain Atom models (Z3770 ), nettops (J2850 ) and notebook SoCs (N3510 ). It supports DirectX 11 and is based on the Ivy Bridge GPU. Clock rates and shader cores, however, are considerably lower.
Compared to Ivy Bridge, which offers either 6 or 16 Execution Units, the HD Graphics (Bay Trail) comes with only 4 EUs. The core clock is significantly lower as well. Depending on the specific model, the maximum Turbo Boost is 896 MHz or less and the memory controller can support DDR3(L), DDR3L-RS or LPDDR3 in single- or dual-channel operation.
The fastest notebook models equipped with this GPU nearly match the performance of the HD Graphics (Sandy Bridge) and the AMD Radeon HD 6310 . Therefore, older and less demanding Windows games like World of Warcraft or Half-Life 2 can be played fluently in very low settings. Performance is not sufficient for most modern titles.
Compared to competing ARM SoCs, Bay Trail outperforms the Adreno 320 (which can be found in different Qualcomm SoCs like the Snapdragon 600 ) and offers a performance similar to the Tegra 4 GPU. That is enough power to run even the most demanding Android games smoothly in very high resolutions as of 2013.
The integrated video decoder supports all popular codecs such as MPEG2, H.264, VC1, VP8 and MVC and is suitable for resolutions up to 4K up to 100 Mbit/s. The user can connect up to two displays via HDMI 1.4 (max. 1920 x 1080) or DisplayPort 1.2 (max. 2560 x 1600). Another new feature is the support for Wireless Display and Quick Sync, Intel's fast and power efficient H-264 hardware encoder. Some of these features are not available on all models.
Depending on the model, the power consumption of the entire SoC is somewhere between 2 and 10 W. The most efficient versions are therefore suitable for passively cooled tablets, whereas faster variants are used in larger subnotebooks with active cooling.
Intel HD Graphics (Cherry Trail) ► remove from comparison
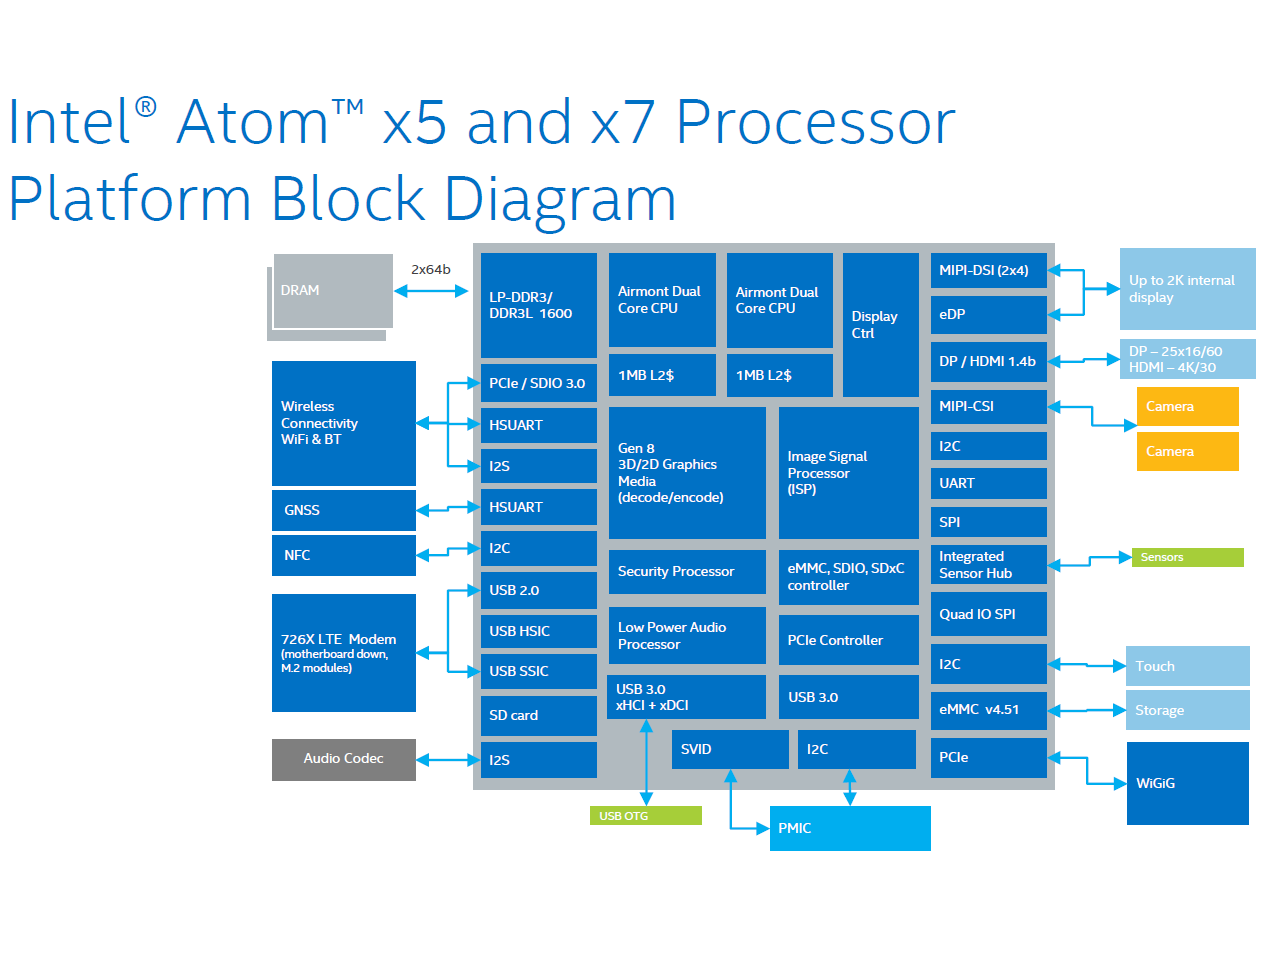
The Intel HD Graphics (Cherry Trail) is an integrated graphics card in the Cherry-Trail SoCs (e.g. Atom x7-Z8700). Based on a Broadwell GPU (Intel Gen8) and supports DirectX 11.2. Depending on the SoC offers 12 or 16 EUs.
Atom x7-Z8700: 16 EUs @ 200 - 600 MHz, dual-channel memory
In Windows, gaming is limited to less demanding or quite old games. Using Android, even high end 3D games should run fluently. For example Team Fortress 2 was running on the Surface 3 (x7-Z8700) only in lowest settings and 1280x720 fluently (11 - 69 fps range).
The integrated video decoder is able to display even 4K videos (H.264 tested) fluently.
The Intel HD Graphics GPU in our review sample of the MS Surface 3 (Atom x7-Z8700) only supported DisplayPort 1.1 as it seems, as 4K (3840x2160) with 30 Hz was the maximum Refresh Rate we could achieve (no 60 Hz selectable with the pre-installed drivers).
Intel HD Graphics 2000 ► remove from comparison
The Intel HD Graphics 2000 (or Intel Graphics Media Accelerator HD 2000 or GMA HD 2000) is an integrated graphics card in the Sandy Bridge codenamed processors. It is included in slower mobile processors (Pentium brand e.g. but called only Intel HD Graphics ) and in most desktop processors. The HD Graphics 2000 has no dedicated memory but shares the fast Level 3 Cache with the CPU cores and also part of the main memory. Due to Turbo Boost, the GPU can be overclocked depending on the current CPU load and power consumption. The GMA HD 2000 offers only half of the 12 Execution Units (EUs) of the Intel GMA HD 3000 .
Because of the halfed amount of shaders, the gaming performance is only compareable to the old Intel GMA HD (in the Arrandale CPUs) . Our tests with a desktop i5-2400 showed a performance level of a Geforce G 105M e.g. which is slightly faster. Therefore, only low demanding games like Sims 3 or World of Warcraft can be played in low detail settings fluently.
Altought 2x Antialiasing (AA) is supported, the chip is as fast as when rendering 4x AA. In the Unigine Valley benchmark a similar HD 3000 i7-2637M for example reached the same score with 2x AA and 4x AA.
In addition to the GPU, the chip also houses some dedicated units for decoding and encoding HD videos . On the IDF Intel demonstrated the encoding of a 3 minute long 1080p video to an iPhone compatible format in 640x360 in only 14s. Another novelty of the Sandy Bridge GPU is the embedded DisplayPort eDP to connect internal Displays.
Due to the integration in the 32nm built CPU and the halfed amount of shaders, the power consumption of the GPU should be quite low and also suited for small and light laptops.
Intel HD Graphics (Bay Trail) Intel HD Graphics (Cherry Trail) Intel HD Graphics 2000 HD Graphics Series Codename Bay Trail Cherry Trail Sandy Bridge Architecture Gen. 7 Ivy Bridge Gen. 8 Gen. 6 Sandy Bridge Pipelines 4 - unified 16 - unified 6 - unified Core Speed 311 - 896 (Boost) MHz 200 - 600 (Boost) MHz 850/1100 - 1350 (Boost) MHz Memory Bus Width 32/64/128 Bit 64/128 Bit 64/128 Bit Shared Memory yes yes yes API DirectX 11, Shader 5.0, OpenGL 4.0, ES 3.0 DirectX 12 (FL 11_1), Shader 5.0, OpenGL 4.3 DirectX 10.1, Shader 4.1 technology 22 nm 14 nm 32 nm Date of Announcement 11.09.2013 02.03.2015 01.02.2011
CPU in HD Graphics (Bay Trail) GPU Base Speed GPU Boost / Turbo Intel Pentium N3540 4 x 2160 MHz, 7.5 W 313 MHz 896 MHz Intel Pentium J2900 4 x 2410 MHz, 10 W 688 MHz 896 MHz Intel Pentium N3530 4 x 2160 MHz, 7.5 W 313 MHz 896 MHz » show 43 more Intel Pentium J2850 4 x 2400 MHz, 10 W 688 MHz 792 MHz Intel Pentium N3520 4 x 2167 MHz, 7.5 W 313 MHz 854 MHz Intel Celeron J1900 4 x 2000 MHz, 10 W 688 MHz 854 MHz Intel Atom Z3795 4 x 1590 MHz, <4 W 311 MHz 778 MHz Intel Atom Z3785 4 x 1490 MHz, <4 W 313 MHz 833 MHz Intel Atom Z3775 4 x 1460 MHz, <4 W 311 MHz 778 MHz Intel Atom Z3775D 4 x 1490 MHz, <4 W 311 MHz 792 MHz Intel Atom Z3770 4 x 1460 MHz, <4 W 311 MHz 667 MHz Intel Atom Z3770D 4 x 1500 MHz, 4 W 313 MHz 688 MHz Intel Celeron N2940 4 x 1830 MHz, 7.5 W 313 MHz 854 MHz Intel Celeron N2930 4 x 1830 MHz, 7.5 W 313 MHz 854 MHz Intel Celeron J1850 4 x 2000 MHz, 10 W 688 MHz 792 MHz Intel Pentium N3510 4 x 2000 MHz, 7.5 W 313 MHz 750 MHz Intel Celeron N2920 4 x 1860 MHz, 7.5 W 313 MHz 854 MHz Intel Atom E3845 4 x 1910 MHz, 10 W 542 MHz 792 MHz Intel Atom Z3736F 4 x 1330 MHz, 4 W 313 MHz 646 MHz Intel Atom Z3736G 4 x 1330 MHz, <4 W 313 MHz 646 MHz Intel Atom Z3745 4 x 1330 MHz, <4 W 311 MHz 778 MHz Intel Atom Z3745D 4 x 1330 MHz, <4 W 311 MHz 792 MHz Intel Atom Z3740 4 x 1330 MHz, <4 W 311 MHz 667 MHz Intel Atom Z3740D 4 x 1330 MHz, <4 W 313 MHz 688 MHz Intel Atom Z3735D 4 x 1330 MHz, <4 W 311 MHz 646 MHz Intel Atom Z3735E 4 x 1330 MHz, <4 W 311 MHz 646 MHz Intel Atom Z3735F 4 x 1330 MHz, <4 W 311 MHz 646 MHz Intel Atom Z3735G 4 x 1330 MHz, <4 W 311 MHz 646 MHz Intel Celeron J1800 2 x 2410 MHz, 10 W 688 MHz 792 MHz Intel Celeron N2840 2 x 2160 MHz, 7.5 W 313 MHz 792 MHz Intel Celeron J1750 2 x 2410 MHz, 10 W 688 MHz 750 MHz Intel Celeron N2910 4 x 1600 MHz, 7.5 W 313 MHz 756 MHz Intel Celeron N2830 2 x 2160 MHz, 7.5 W 313 MHz 750 MHz Intel Celeron N2820 2 x 2170 MHz, 7.5 W 313 MHz 756 MHz Intel Celeron N2815 2 x 1860 MHz, 7.5 W 313 MHz 756 MHz Intel Celeron N2810 2 x 2000 MHz, 7.5 W 313 MHz 756 MHz Intel Atom Z3680 2 x 1330 MHz, 4 W 311 MHz 667 MHz Intel Atom Z3680D 2 x 1330 MHz, 4 W 313 MHz 688 MHz Intel Celeron N2808 2 x 1580 MHz, 4.3 W 313 MHz 792 MHz Intel Celeron N2807 2 x 1580 MHz, 4.3 W 313 MHz 750 MHz Intel Celeron N2806 2 x 1580 MHz, 4.5 W 313 MHz 756 MHz Intel Atom E3827 2 x 1750 MHz, 8 W 542 MHz 792 MHz Intel Atom E3826 2 x 1460 MHz, 7 W 533 MHz 667 MHz Intel Celeron N2805 2 x 1460 MHz, 4.3 W 313 MHz 667 MHz Intel Atom E3825 2 x 1330 MHz, 6 W ? MHz 533 MHz Intel Atom E3815 1 x 1460 MHz, 5 W ? MHz 400 MHz min. - max. 311 - ? MHz 400 - 896 MHz
CPU in HD Graphics (Cherry Trail) GPU Base Speed GPU Boost / Turbo Intel Atom x7-Z8700 4 x 1600 MHz 200 MHz 600 MHz Intel Atom x5-Z8500 4 x 1440 MHz 200 MHz 600 MHz Intel Atom x5-Z8350 4 x 1440 MHz 200 MHz 500 MHz » show 2 more Intel Atom x5-Z8300 4 x 1440 MHz 200 MHz 500 MHz Intel Atom x5-E8000 4 x 1040 MHz, 5 W 320 MHz ? MHz min. - max. 200 - ? MHz ? - 896 MHz
CPU in HD Graphics 2000 GPU Base Speed GPU Boost / Turbo Intel Core i5-2400 4 x 3100 MHz, 95 W 850 MHz 1100 MHz
Benchmarks Performance Rating - 3DMark 11 + Fire Strike + Time Spy - HD Graphics (Bay Trail)
0.1 pt (0%)
Intel HD Graphics (Bay Trail)
...
max:
Performance Rating - 3DMark 11 + Fire Strike + Time Spy - HD Graphics (Cherry Trail)
0.1 pt (0%)
Intel HD Graphics (Cherry Trail)
...
max:
3DMark - 3DMark Ice Storm Unlimited Graphics
min: 11835 avg: 14513 median: 14748.5 (2%) max: 17613 Points
min: 18563 avg: 20873 median: 19303 (2%) max: 27537 Points
3DMark - 3DMark Ice Storm Extreme Graphics
min: 4751 avg: 7342 median: 7498 (1%) max: 9234 Points
3DMark - 3DMark Cloud Gate Score
min: 354 avg: 1182 median: 1188 (1%) max: 1703 Points
min: 769 avg: 1454 median: 1488 (2%) max: 1905 Points
3DMark - 3DMark Cloud Gate Graphics
min: 362 avg: 1230 median: 1228.5 (0%) max: 1670 Points
min: 1537 avg: 1851 median: 1783.5 (0%) max: 2272 Points
3DMark - 3DMark Fire Strike Standard Score
min: 83 avg: 185 median: 147 (0%) max: 495 Points
min: 174 avg: 390.4 median: 248 (0%) max: 1059 Points
3DMark - 3DMark Fire Strike Standard Graphics
min: 90 avg: 149.1 median: 149 (0%) max: 200 Points
min: 193 avg: 233 median: 225 (0%) max: 281 Points
3DMark - 3DMark Ice Storm Graphics
min: 5056 avg: 15391 median: 16047 (2%) max: 21351 Points
min: 7544 avg: 16078 median: 17063.5 (2%) max: 23395 Points
3DMark - 3DMark Sling Shot (ES 3.0) Unlimited
min: 1445 avg: 1525 median: 1525 (7%) max: 1605 Points
3DMark - 3DMark Sling Shot (ES 3.0) Unlimited Graphics
min: 1598 avg: 1684 median: 1684 (4%) max: 1770 Points
3DMark - 3DMark Sling Shot Extreme (ES 3.1) Unlimited
min: 1072 avg: 1215 median: 1159 (6%) max: 1414 Points
3DMark - 3DMark Sling Shot Extreme (ES 3.1) Unlimited Graphics
min: 1058 avg: 1251 median: 1142 (3%) max: 1554 Points
3DMark 11 - 3DM11 Performance Score
min: 143 avg: 222.6 median: 216 (0%) max: 280 Points
min: 314 avg: 359.4 median: 343 (0%) max: 562 Points
3DMark 11 - 3DM11 Performance GPU
min: 122 avg: 192.1 median: 186.5 (0%) max: 237 Points
min: 278 avg: 319.9 median: 298 (0%) max: 494 Points
3DMark Vantage + Intel HD Graphics (Bay Trail) 3DMark Vantage - 3DM Vant. Perf. total
min: 507 avg: 666 median: 637 (0%) max: 846 Points
3DM Vant. Perf. total + Intel HD Graphics 2000 min: 789 avg: 896 median: 895.5 (0%) max: 1002 Points
3DM Vant. Perf. GPU no PhysX + Intel HD Graphics (Bay Trail) 3DMark Vantage - 3DM Vant. Perf. GPU no PhysX
min: 395 avg: 512 median: 503 (0%) max: 667 Points
3DM Vant. Perf. GPU no PhysX + Intel HD Graphics 2000 min: 626 avg: 695 median: 694.5 (0%) max: 763 Points
3DMark 2001SE - 3DMark 2001 - Standard
7727 Points (8%)
15201 Points (16%)
3DMark 03 - 3DMark 03 - Standard
min: 4226 avg: 4997 median: 5220 (3%) max: 5323 Points
min: 6077 avg: 7083 median: 7083 (4%) max: 8089 Points
3DMark 05 - 3DMark 05 - Standard
min: 2666 avg: 3195 median: 3331 (4%) max: 3445 Points
min: 4585 avg: 5194 median: 5193.5 (6%) max: 5802 Points
3DMark 06 3DMark 06 - Score Unknown Settings + Intel HD Graphics (Bay Trail)
2108 Points (3%)
3DMark 06 - Standard 1280x1024 + Intel HD Graphics (Bay Trail)
min: 814 avg: 1785 median: 1866 (2%) max: 2151 Points
3DMark 06 - Standard 1280x1024 + Intel HD Graphics (Cherry Trail)
min: 2403 avg: 2833 median: 2595 (3%) max: 3330 Points
3DMark 06 - Standard 1280x1024 + Intel HD Graphics 2000
min: 1217 avg: 2222 median: 2288 (3%) max: 3162 Points
3DMark 06 - Standard 1280x800 + Intel HD Graphics (Bay Trail)
2087 Points (3%)
3DMark 06 - Standard 1024x768 + Intel HD Graphics (Cherry Trail)
2877 Points (4%)
Unigine Valley 1.0 - Unigine Valley 1.0 DX
1.2 fps (0%)
Unigine Heaven 3.0 - Unigine Heaven 3.0 DX 11
3.6 fps (1%)
Unigine Heaven 2.1 - Heaven 2.1 high
min: 2.4 avg: 2.8 median: 2.8 (1%) max: 3.4 fps
5.7 fps (1%)
5.3 fps (1%)
Windows 7 Experience Index - Win7 Gaming graphics
5.6 Points (71%)
Windows 7 Experience Index - Win7 Graphics
min: 4.5 avg: 4.9 median: 4.9 (61%) max: 5.2 Points
Cinebench R10 Cinebench R10 Shading (32bit) + Intel HD Graphics (Bay Trail) Cinebench R10 - Cinebench R10 Shading (32bit)
min: 898 avg: 2014 median: 1991.5 (1%) max: 2889 Points
Cinebench R10 Shading (32bit) + Intel HD Graphics (Cherry Trail)
min: 1192 avg: 2009 median: 1973 (1%) max: 2551 Points
Cinebench R10 Shading (32bit) + Intel HD Graphics 2000
min: 1169 avg: 2298 median: 2298 (2%) max: 3427 Points
Cinebench R11.5 Cinebench R11.5 OpenGL 64 Bit + Intel HD Graphics (Bay Trail) Cinebench R11.5 - Cinebench R11.5 OpenGL 64 Bit
min: 0.37 avg: 6.2 median: 6.4 (2%) max: 7.69 fps
Cinebench R11.5 OpenGL 64 Bit + Intel HD Graphics (Cherry Trail)
min: 4.01 avg: 8.8 median: 8.4 (3%) max: 11.71 fps
Cinebench R11.5 OpenGL 64 Bit + Intel HD Graphics 2000
min: 2.69 avg: 5.1 median: 5.9 (2%) max: 6.68 fps
Cinebench R15 + Intel HD Graphics (Bay Trail) Cinebench R15 - Cinebench R15 OpenGL 64 Bit
min: 2.88 avg: 5 median: 5.5 (0%) max: 6.55 fps
Cinebench R15 OpenGL 64 Bit + Intel HD Graphics (Cherry Trail)
min: 6.64 avg: 10.3 median: 9.7 (1%) max: 15.52 fps
Cinebench R15 OpenGL Ref. Match 64 Bit + Intel HD Graphics (Bay Trail) Cinebench R15 - Cinebench R15 OpenGL Ref. Match 64 Bit
min: 63 avg: 96.1 median: 97.8 (98%) max: 97.8 %
Cinebench R15 OpenGL Ref. Match 64 Bit + Intel HD Graphics (Cherry Trail)
min: 98 avg: 98 median: 98 (98%) max: 98.6 %
GFXBench - GFXBench Car Chase Offscreen
min: 6.3 avg: 7.3 median: 7 (1%) max: 9 fps
GFXBench 3.1 - GFXBench Manhattan ES 3.1 Offscreen
5.2 fps (0%)
min: 9.2 avg: 10.8 median: 11 (0%) max: 13 fps
GFXBench 3.0 - GFXBench 3.0 Manhattan Offscreen
min: 6 avg: 9.7 median: 8.8 (1%) max: 16 fps
min: 8.4 avg: 13.8 median: 13.5 (1%) max: 18 fps
GFXBench (DX / GLBenchmark) 2.7 + Intel HD Graphics (Bay Trail) GFXBench (DX / GLBenchmark) 2.7 - GFXBench T-Rex HD Offscreen C24Z16
min: 6 avg: 15.7 median: 16 (0%) max: 20.2 fps
GFXBench T-Rex HD Offscreen C24Z16 + Intel HD Graphics (Cherry Trail) min: 22 avg: 30.5 median: 32 (0%) max: 38.5 fps
Basemark ES 2.0 - Basemark ES 2.0
min: 45.08 avg: 49.1 median: 49.1 (81%) max: 53.1 fps
Basemark X 1.0 - Basemark X 1.0 Off-Screen
10.1 fps (48%)
Basemark X 1.1 - Basemark X 1.1 High Quality
min: 3008 avg: 6663 median: 8456 (19%) max: 8524 Points
Basemark X 1.1 - Basemark X 1.1 Medium Quality
min: 4802 avg: 12880 median: 14509 (32%) max: 17701 Points
NenaMark2 - NenaMark2 Score
min: 59 avg: 59.4 median: 59.4 (88%) max: 59.7 fps
LuxMark v2.0 64Bit - LuxMark v2.0 Room GPU
min: 25 avg: 28.5 median: 27 (0%) max: 35 Samples/s
min: 48 avg: 58.7 median: 59 (0%) max: 69 Samples/s
LuxMark v2.0 64Bit - LuxMark v2.0 Sala GPU
min: 26 avg: 29 median: 29 (0%) max: 34 Samples/s
min: 69 avg: 87.7 median: 89 (0%) max: 105 Samples/s
ComputeMark v2.1 - ComputeMark v2.1 Result
min: 160 avg: 172.8 median: 174 (0%) max: 192 Points
277 Points (0%)
PassMark PerformanceTest Mobile V1 - PerformanceTest Mobile V1 2D Graphics Tests
min: 3822 avg: 4036 median: 3866 (4%) max: 4588 Points
PassMark PerformanceTest Mobile V1 - PerformanceTest Mobile V1 3D Graphics Tests
min: 1058 avg: 1251 median: 1228 (2%) max: 1488 Points
Smartbench 2012 - Smartbench 2012 Gaming Index
min: 2679 avg: 3414 median: 3385 (74%) max: 4274 Points
Average Benchmarks Intel HD Graphics (Bay Trail) → 100% n=4 Average Benchmarks Intel HD Graphics (Cherry Trail) → 144% n=4 Average Benchmarks Intel HD Graphics 2000 → 131% n=4
- Range of benchmark values for this graphics card
- Average benchmark values for this graphics card
* Smaller numbers mean a higher performance
1 This benchmark is not used for the average calculation
Game Benchmarks The following benchmarks stem from our benchmarks of review laptops. The performance depends on the used graphics memory, clock rate, processor, system settings, drivers, and operating systems. So the results don't have to be representative for all laptops with this GPU. For detailed information on the benchmark results, click on the fps number.
100%
HD Graphics (Bay Trail):
26.7 [X] Intel NUC Kit DN2820FYKH Intel Celeron N2820 2.2GHz
HD Graphics (Bay Trail)
min:
23 fps
fps
80%
HD Graphics (Cherry Trail):
21.4 fps
100%
HD Graphics (Bay Trail):
23.4 [X] Intel NUC Kit DN2820FYKH Intel Celeron N2820 2.2GHz
HD Graphics (Bay Trail)
min:
21 fps
fps
100%
HD Graphics (Bay Trail):
6 [X] Intel NUC Kit DN2820FYKH Intel Celeron N2820 2.2GHz
HD Graphics (Bay Trail)
fps
100%
HD Graphics (Bay Trail):
12.6 [X] Intel NUC Kit DN2820FYKH Intel Celeron N2820 2.2GHz
HD Graphics (Bay Trail)
min:
7 fps, max:
15 fps
fps
123%
HD Graphics (Cherry Trail):
15.5 fps
HD Graphics (Cherry Trail):
22.6 [X] Chuwi Hi12 Intel Atom x5-Z8300 1.4GHz
HD Graphics (Cherry Trail)
min:
21 fps, max:
27 fps
fps
HD Graphics (Cherry Trail):
11.5 fps
HD Graphics (Cherry Trail):
7 fps
HD Graphics (Cherry Trail):
8.8 fps
HD Graphics (Cherry Trail):
4.8 fps
HD Graphics (Bay Trail):
0 (!) [X] Intel NUC Kit DN2820FYKH Intel Celeron N2820 2.2GHz
HD Graphics (Bay Trail)
fps
HD Graphics (Cherry Trail):
8.1 fps
HD Graphics (Cherry Trail):
3.9 fps
100%
HD Graphics (Bay Trail):
12.1 [X] Intel NUC Kit DN2820FYKH Intel Celeron N2820 2.2GHz
HD Graphics (Bay Trail)
min:
5 fps, max:
18 fps
fps
124%
HD Graphics (Cherry Trail):
13.9 [X] Chuwi Hi12 Intel Atom x5-Z8300 1.4GHz
HD Graphics (Cherry Trail)
min:
7 fps, max:
19 fps
16.8 ~ 15 fps
100%
HD Graphics (Bay Trail):
10.8 [X] Intel NUC Kit DN2820FYKH Intel Celeron N2820 2.2GHz
HD Graphics (Bay Trail)
min:
10 fps, max:
12 fps
fps
140%
HD Graphics (Cherry Trail):
15.1 fps
HD Graphics (Cherry Trail):
9.8 fps
100%
HD Graphics (Bay Trail):
24.7 [X] Intel NUC Kit DN2820FYKH Intel Celeron N2820 2.2GHz
HD Graphics (Bay Trail)
min:
22.2 fps
fps
81%
HD Graphics (Cherry Trail):
20 [X] Chuwi Hi12 Intel Atom x5-Z8300 1.4GHz
HD Graphics (Cherry Trail)
min:
18 fps
fps
100%
HD Graphics (Bay Trail):
9.7 [X] Intel NUC Kit DN2820FYKH Intel Celeron N2820 2.2GHz
HD Graphics (Bay Trail)
min:
8.8 fps
fps
157%
HD Graphics (Cherry Trail):
15.2 [X] Chuwi Hi12 Intel Atom x5-Z8300 1.4GHz
HD Graphics (Cherry Trail)
min:
13 fps
fps
100%
HD Graphics (Bay Trail):
5.5 [X] Intel NUC Kit DN2820FYKH Intel Celeron N2820 2.2GHz
HD Graphics (Bay Trail)
min:
-1.4 fps
fps
131%
HD Graphics (Cherry Trail):
7.2 [X] Chuwi Hi12 Intel Atom x5-Z8300 1.4GHz
HD Graphics (Cherry Trail)
min:
6 fps
fps
100%
HD Graphics (Bay Trail):
5.4 [X] Intel NUC Kit DN2820FYKH Intel Celeron N2820 2.2GHz
HD Graphics (Bay Trail)
min:
-3 fps
fps
100%
HD Graphics (Bay Trail):
22 [X] Intel NUC Kit DN2820FYKH Intel Celeron N2820 2.2GHz
HD Graphics (Bay Trail)
min:
16 fps, max:
33 fps
24.2 ~ 23 fps
87%
HD Graphics (Cherry Trail):
20.1 fps
100%
HD Graphics (Bay Trail):
0 (!) [X] Intel NUC Kit DN2820FYKH Intel Celeron N2820 2.2GHz
HD Graphics (Bay Trail)
12.5 ~ 6 fps
208%
HD Graphics (Cherry Trail):
12.5 fps
HD Graphics (Cherry Trail):
10.8 (!) [X] Microsoft Surface 3 Intel Atom x7-Z8700 1.6GHz
HD Graphics (Cherry Trail)
fps
100%
HD Graphics (Bay Trail):
7.3 fps
100%
HD Graphics (Bay Trail):
5.1 fps
100%
HD Graphics (Bay Trail):
3.2 fps
100%
HD Graphics (Bay Trail):
1.7 fps
100%
HD Graphics (Bay Trail):
8.1 fps
100%
HD Graphics (Bay Trail):
4.7 fps
100%
HD Graphics (Bay Trail):
7 fps
136%
HD Graphics (Cherry Trail):
9.5 fps
100%
HD Graphics (Bay Trail):
4.6 fps
124%
HD Graphics (Cherry Trail):
5.7 fps
100%
HD Graphics (Bay Trail):
5.6 fps
100%
HD Graphics (Bay Trail):
3.8 fps
100%
HD Graphics (Bay Trail):
4.3 fps
100%
HD Graphics (Bay Trail):
2.4 fps
100%
HD Graphics (Bay Trail):
9.6 11.5 ~ 11 fps
147%
HD Graphics (Cherry Trail):
16.2 fps
100%
HD Graphics (Bay Trail):
4.3 fps
142%
HD Graphics (Cherry Trail):
6.1 fps
100%
HD Graphics (Bay Trail):
12 14 ~ 13 fps
123%
HD Graphics (Cherry Trail):
16 fps
100%
HD Graphics (Bay Trail):
12 fps
100%
HD Graphics (Cherry Trail):
12 fps
100%
HD Graphics (Bay Trail):
5.2 fps
100%
HD Graphics (Bay Trail):
3.6 fps
100%
HD Graphics (Bay Trail):
3.7 fps
100%
HD Graphics (Bay Trail):
2.5 fps
100%
HD Graphics (Bay Trail):
9.1 fps
100%
HD Graphics (Bay Trail):
5.1 fps
100%
HD Graphics (Bay Trail):
8.5 fps
100%
HD Graphics (Bay Trail):
6.1 fps
100%
HD Graphics (Bay Trail):
12.4 fps
126%
HD Graphics (Cherry Trail):
15.6 fps
100%
HD Graphics (Bay Trail):
8.5 fps
100%
HD Graphics (Bay Trail):
53.7 56 ~ 55 fps
100%
HD Graphics (Bay Trail):
6.6 7 ~ 7 fps
HD Graphics (Cherry Trail):
5.5 10 ~ 8 fps
100%
HD Graphics (Bay Trail):
8.4 fps
100%
HD Graphics (Bay Trail):
5.9 fps
100%
HD Graphics (Bay Trail):
31.6 41.8 ~ 37 fps
68%
HD Graphics (Cherry Trail):
22 27.3 ~ 25 fps
100%
HD Graphics (Bay Trail):
12.5 12.5 ~ 13 fps
100%
HD Graphics (Cherry Trail):
12.5 13.5 ~ 13 fps
100%
HD Graphics (Bay Trail):
8.3 fps
100%
HD Graphics (Bay Trail):
4.6 fps
100%
HD Graphics (Bay Trail):
11.1 fps
100%
HD Graphics (Bay Trail):
9.6 fps
100%
HD Graphics (Bay Trail):
25.2 fps
100%
HD Graphics (Bay Trail):
9.2 fps
100%
HD Graphics (Bay Trail):
3.1 [X] Medion Akoya S6213T MD98716 Intel Pentium N3530 2.2GHz
HD Graphics (Bay Trail)
5.1 ~ 4 fps
100%
HD Graphics (Bay Trail):
3.3 fps
100%
HD Graphics (Bay Trail):
8.7 fps
100%
HD Graphics (Bay Trail):
5.8 fps
100%
HD Graphics (Bay Trail):
12.8 fps
100%
HD Graphics (Bay Trail):
6 fps
100%
HD Graphics (Bay Trail):
7.3 fps
182%
HD Graphics (Cherry Trail):
13.3 fps
100%
HD Graphics (Bay Trail):
14 fps
100%
HD Graphics (Bay Trail):
8 fps
100%
HD Graphics (Bay Trail):
12 fps
100%
HD Graphics (Bay Trail):
12.6 18.7 19.9 29.8 33.6 60 [X] Medion Akoya P2211T MD98602 Intel Celeron N2910 1.6GHz
HD Graphics (Bay Trail)
~ 29 fps
100%
HD Graphics (Bay Trail):
10.5 19.5 33 [X] Medion Akoya P2211T MD98602 Intel Celeron N2910 1.6GHz
HD Graphics (Bay Trail)
~ 21 fps
100%
HD Graphics (Bay Trail):
7.8 12.8 22 [X] Medion Akoya P2211T MD98602 Intel Celeron N2910 1.6GHz
HD Graphics (Bay Trail)
~ 14 fps
100%
HD Graphics (Bay Trail):
7.7 fps
100%
HD Graphics (Bay Trail):
6.3 fps
100%
HD Graphics (Bay Trail):
10.2 fps
100%
HD Graphics (Bay Trail):
6.1 fps
100%
HD Graphics (Bay Trail):
11 fps
100%
HD Graphics (Bay Trail):
7.8 fps
HD Graphics (Cherry Trail):
58 fps
HD Graphics (Cherry Trail):
47 fps
100%
HD Graphics (Bay Trail):
18.2 [X] Medion Akoya P2211T MD98602 Intel Celeron N2910 1.6GHz
HD Graphics (Bay Trail)
20.8 28.4 31.9 [X] Asus Transformer Book T200TA PL Intel Atom Z3775 1.5GHz
HD Graphics (Bay Trail)
~ 25 fps
119%
HD Graphics (Cherry Trail):
29.7 fps
100%
HD Graphics (Bay Trail):
9.5 [X] Medion Akoya P2211T MD98602 Intel Celeron N2910 1.6GHz
HD Graphics (Bay Trail)
10.4 13.7 19.4 [X] Asus Transformer Book T200TA PL Intel Atom Z3775 1.5GHz
HD Graphics (Bay Trail)
~ 13 fps
127%
HD Graphics (Cherry Trail):
16.5 fps
100%
HD Graphics (Bay Trail):
4.4 [X] Medion Akoya E6239T Intel Pentium N3510 2GHz
HD Graphics (Bay Trail)
fps
100%
HD Graphics (Bay Trail):
14.1 16.2 17.9 20.4 [X] Medion Akoya E6239T Intel Pentium N3510 2GHz
HD Graphics (Bay Trail)
23.2 ~ 18 fps
133%
HD Graphics (Cherry Trail):
24 fps
100%
HD Graphics (Bay Trail):
12.5 12.6 [X] Medion Akoya E6239T Intel Pentium N3510 2GHz
HD Graphics (Bay Trail)
~ 13 fps
104%
HD Graphics (Cherry Trail):
13.5 fps
100%
HD Graphics (Bay Trail):
5 fps
158%
HD Graphics (Cherry Trail):
16 18 18.9 [X] Medion Akoya E2215T Intel Atom x5-Z8350 1.4GHz
HD Graphics (Cherry Trail)
19.8 20.1 20.5 ~ 19 fps
150%
HD Graphics (Cherry Trail):
6.4 7.9 [X] Medion Akoya E2215T Intel Atom x5-Z8350 1.4GHz
HD Graphics (Cherry Trail)
9.3 9.8 10 10 ~ 9 fps
140%
HD Graphics (Cherry Trail):
5.6 5.7 [X] Medion Akoya E2215T Intel Atom x5-Z8350 1.4GHz
HD Graphics (Cherry Trail)
6.7 7.6 7.9 8.4 ~ 7 fps
100%
HD Graphics (Bay Trail):
1.2 fps
167%
HD Graphics (Cherry Trail):
2.4 2.6 ~ 2 fps
100%
HD Graphics (Bay Trail):
39 56.2 69 [X] Baytrail Reference Tablet Intel Atom Z3770 1.5GHz
HD Graphics (Bay Trail)
~ 55 fps
100%
HD Graphics (Bay Trail):
12.3 12.8 14 [X] Baytrail Reference Tablet Intel Atom Z3770 1.5GHz
HD Graphics (Bay Trail)
min:
8 fps
~ 13 fps
160%
HD Graphics (Cherry Trail):
7 8.3 9 ~ 8 fps
100%
HD Graphics (Bay Trail):
0.3 fps
1333%
HD Graphics (Cherry Trail):
3.7 3.8 ~ 4 fps
100%
HD Graphics (Bay Trail):
15.1 23.6 ~ 19 fps
100%
HD Graphics (Bay Trail):
5.2 9.7 ~ 7 fps
HD Graphics (Cherry Trail):
34 fps
100%
HD Graphics (Bay Trail):
10.3 fps
100%
HD Graphics (Bay Trail):
6.2 fps
100%
HD Graphics (Bay Trail):
10.1 fps
100%
HD Graphics (Bay Trail):
6 fps
100%
HD Graphics (Bay Trail):
12.4 fps
100%
HD Graphics (Bay Trail):
7.3 fps
100%
HD Graphics (Bay Trail):
12.5 14.3 ~ 13 fps
117%
HD Graphics (Cherry Trail):
15.2 fps
100%
HD Graphics (Bay Trail):
9.8 11.2 ~ 11 fps
105%
HD Graphics (Cherry Trail):
11.6 fps
HD Graphics (Cherry Trail):
0 (!) [X] Microsoft Surface 3 Intel Atom x7-Z8700 1.6GHz
HD Graphics (Cherry Trail)
fps
HD Graphics (Cherry Trail):
0 (!) [X] Microsoft Surface 3 Intel Atom x7-Z8700 1.6GHz
HD Graphics (Cherry Trail)
fps
100%
HD Graphics (Bay Trail):
42 fps
100%
HD Graphics (Bay Trail):
26.1 [X] Intel NUC Kit DN2820FYKH Intel Celeron N2820 2.2GHz
HD Graphics (Bay Trail)
min:
16 fps, max:
38 fps
46.6 ~ 36 fps
100%
HD Graphics (Bay Trail):
20 [X] Intel NUC Kit DN2820FYKH Intel Celeron N2820 2.2GHz
HD Graphics (Bay Trail)
min:
13 fps, max:
29 fps
23.9 ~ 22 fps
HD Graphics (Cherry Trail):
20.3 fps
HD Graphics (Cherry Trail):
11.4 fps
100%
HD Graphics (Bay Trail):
12.9 13.2 ~ 13 fps
100%
HD Graphics (Bay Trail):
7.5 8.1 ~ 8 fps
100%
HD Graphics (Bay Trail):
28 fps
100%
HD Graphics (Bay Trail):
9.2 10.7 14.8 15.6 16.5 [X] Medion Akoya P2214T MD 99430 Intel Celeron N2940 1.8GHz
HD Graphics (Bay Trail)
18.4 19.3 [X] Intel NUC Kit DN2820FYKH Intel Celeron N2820 2.2GHz
HD Graphics (Bay Trail)
min:
14 fps, max:
23 fps
~ 15 fps
187%
HD Graphics (Cherry Trail):
24.3 [X] Chuwi Hi12 Intel Atom x5-Z8300 1.4GHz
HD Graphics (Cherry Trail)
min:
20 fps, max:
29 fps
31.9 ~ 28 fps
161%
HD Graphics 2000:
24.1 fps
100%
HD Graphics (Bay Trail):
6 9.5 [X] Medion Akoya P2214T MD 99430 Intel Celeron N2940 1.8GHz
HD Graphics (Bay Trail)
10.3 11.4 12 ~ 10 fps
180%
HD Graphics (Cherry Trail):
16 [X] Chuwi Hi12 Intel Atom x5-Z8300 1.4GHz
HD Graphics (Cherry Trail)
min:
13 fps, max:
19 fps
19 ~ 18 fps
100%
HD Graphics (Bay Trail):
7.9 [X] Medion Akoya P2214T MD 99430 Intel Celeron N2940 1.8GHz
HD Graphics (Bay Trail)
9.6 ~ 9 fps
100%
HD Graphics (Bay Trail):
5 [X] Medion Akoya P2214T MD 99430 Intel Celeron N2940 1.8GHz
HD Graphics (Bay Trail)
5.9 ~ 5 fps
100%
HD Graphics (Bay Trail):
8.5 12.4 ~ 10 fps
119%
HD Graphics 2000:
11.9 fps
100%
HD Graphics (Bay Trail):
8.1 fps
100%
HD Graphics (Bay Trail):
5.8 fps
100%
HD Graphics (Bay Trail):
2.3 fps
118%
HD Graphics 2000:
18.9 21.5 ~ 20 fps
114%
HD Graphics 2000:
8 fps
200%
HD Graphics (Cherry Trail):
8 fps
100%
HD Graphics (Bay Trail):
1.1 fps
100%
HD Graphics (Bay Trail):
11 11.8 ~ 11 fps
155%
HD Graphics (Cherry Trail):
15.5 18.9 ~ 17 fps
127%
HD Graphics 2000:
14 fps
100%
HD Graphics (Bay Trail):
10 fps
80%
HD Graphics (Cherry Trail):
7.2 8.5 ~ 8 fps
100%
HD Graphics (Bay Trail):
8 fps
100%
HD Graphics (Bay Trail):
4.8 fps
HD Graphics 2000:
117 [X] Desktop Intel Core i5-2400 3.1GHz
HD Graphics 2000
fps
HD Graphics 2000:
56 [X] Desktop Intel Core i5-2400 3.1GHz
HD Graphics 2000
fps
HD Graphics 2000:
37 [X] Desktop Intel Core i5-2400 3.1GHz
HD Graphics 2000
fps
HD Graphics 2000:
21 [X] Desktop Intel Core i5-2400 3.1GHz
HD Graphics 2000
fps
HD Graphics 2000:
37 [X] Desktop Intel Core i5-2400 3.1GHz
HD Graphics 2000
fps
HD Graphics 2000:
19 [X] Desktop Intel Core i5-2400 3.1GHz
HD Graphics 2000
fps
100%
HD Graphics (Bay Trail):
19.7 fps
130%
HD Graphics (Cherry Trail):
25.6 fps
127%
HD Graphics 2000:
23.3 26 [X] Desktop Intel Core i5-2400 3.1GHz
HD Graphics 2000
~ 25 fps
HD Graphics (Cherry Trail):
12 fps
100%
HD Graphics (Bay Trail):
24.1 36.9 ~ 31 fps
91%
HD Graphics (Cherry Trail):
28.1 fps
171%
HD Graphics 2000:
53 [X] Desktop Intel Core i5-2400 3.1GHz
HD Graphics 2000
min:
39 fps
fps
100%
HD Graphics (Bay Trail):
12.9 13.3 ~ 13 fps
96%
HD Graphics (Cherry Trail):
12.5 fps
165%
HD Graphics 2000:
21.4 [X] Desktop Intel Core i5-2400 3.1GHz
HD Graphics 2000
min:
18 fps
fps
HD Graphics 2000:
13.3 [X] Desktop Intel Core i5-2400 3.1GHz
HD Graphics 2000
min:
12.5 fps
fps
HD Graphics 2000:
9 [X] Desktop Intel Core i5-2400 3.1GHz
HD Graphics 2000
fps
HD Graphics 2000:
18 [X] Desktop Intel Core i5-2400 3.1GHz
HD Graphics 2000
fps
HD Graphics 2000:
43.2 [X] Desktop Intel Core i5-2400 3.1GHz
HD Graphics 2000
fps
HD Graphics 2000:
26 [X] no model Intel Core i5-2400 3.1GHz
HD Graphics 2000
fps
HD Graphics 2000:
17 [X] no model Intel Core i5-2400 3.1GHz
HD Graphics 2000
fps
HD Graphics 2000:
68 [X] no model Intel Core i5-2400 3.1GHz
HD Graphics 2000
71 [X] Desktop Intel Core i5-2400 3.1GHz
HD Graphics 2000
~ 70 fps
HD Graphics 2000:
34 [X] no model Intel Core i5-2400 3.1GHz
HD Graphics 2000
40 [X] Desktop Intel Core i5-2400 3.1GHz
HD Graphics 2000
~ 37 fps
HD Graphics 2000:
19 [X] no model Intel Core i5-2400 3.1GHz
HD Graphics 2000
22 [X] Desktop Intel Core i5-2400 3.1GHz
HD Graphics 2000
~ 21 fps
100%
HD Graphics (Bay Trail):
9.3 fps
201%
HD Graphics (Cherry Trail):
18.7 fps
100%
HD Graphics (Bay Trail):
5 10.5 [X] Asus Transformer Book T200TA PL Intel Atom Z3775 1.5GHz
HD Graphics (Bay Trail)
~ 8 fps
100%
HD Graphics 2000:
-1 [X] no model Intel Core i5-2400 3.1GHz
HD Graphics 2000
16.9 [X] no model Intel Core i5-2400 3.1GHz
HD Graphics 2000
~ 8 fps
100%
HD Graphics (Bay Trail):
5.6 [X] Asus Transformer Book T200TA PL Intel Atom Z3775 1.5GHz
HD Graphics (Bay Trail)
fps
100%
HD Graphics (Bay Trail):
3.7 [X] Asus Transformer Book T200TA PL Intel Atom Z3775 1.5GHz
HD Graphics (Bay Trail)
fps
100%
HD Graphics (Bay Trail):
32 48 49 53.3 ~ 46 fps
139%
HD Graphics (Cherry Trail):
63.2 64 ~ 64 fps
135%
HD Graphics 2000:
62 [X] no model Intel Core i5-2400 3.1GHz
HD Graphics 2000
fps
100%
HD Graphics (Bay Trail):
6 9 9 ~ 8 fps
225%
HD Graphics (Cherry Trail):
18 18.8 ~ 18 fps
150%
HD Graphics 2000:
12 [X] no model Intel Core i5-2400 3.1GHz
HD Graphics 2000
fps
100%
HD Graphics (Bay Trail):
3 fps
467%
HD Graphics (Cherry Trail):
14 fps
300%
HD Graphics 2000:
9 [X] no model Intel Core i5-2400 3.1GHz
HD Graphics 2000
fps
HD Graphics (Cherry Trail):
7 fps
HD Graphics 2000:
5 [X] no model Intel Core i5-2400 3.1GHz
HD Graphics 2000
fps
100%
HD Graphics (Bay Trail):
12 [X] Asus Transformer Book T200TA PL Intel Atom Z3775 1.5GHz
HD Graphics (Bay Trail)
fps
225%
HD Graphics 2000:
27 [X] no model Intel Core i5-2400 3.1GHz
HD Graphics 2000
fps
100%
HD Graphics (Bay Trail):
9 [X] Asus Transformer Book T200TA PL Intel Atom Z3775 1.5GHz
HD Graphics (Bay Trail)
fps
122%
HD Graphics 2000:
11 [X] no model Intel Core i5-2400 3.1GHz
HD Graphics 2000
fps
HD Graphics 2000:
26.4 [X] Desktop Intel Core i5-2400 3.1GHz
HD Graphics 2000
min:
7.14 fps, max:
56 fps
fps
HD Graphics 2000:
10.4 [X] Desktop Intel Core i5-2400 3.1GHz
HD Graphics 2000
min:
1.6 fps, max:
24 fps
fps
100%
HD Graphics (Bay Trail):
12.8 fps
172%
HD Graphics 2000:
21.2 23 [X] no model Intel Core i5-2400 3.1GHz
HD Graphics 2000
~ 22 fps
100%
HD Graphics (Bay Trail):
9 fps
144%
HD Graphics 2000:
12 [X] no model Intel Core i5-2400 3.1GHz
HD Graphics 2000
13.5 ~ 13 fps
HD Graphics 2000:
50 [X] no model Intel Core i5-2400 3.1GHz
HD Graphics 2000
fps
HD Graphics 2000:
14 [X] no model Intel Core i5-2400 3.1GHz
HD Graphics 2000
fps
142%
HD Graphics 2000:
26 48 [X] no model Intel Core i5-2400 3.1GHz
HD Graphics 2000
~ 37 fps
130%
HD Graphics 2000:
11 [X] no model Intel Core i5-2400 3.1GHz
HD Graphics 2000
15.5 ~ 13 fps
258%
HD Graphics 2000:
62 [X] no model Intel Core i5-2400 3.1GHz
HD Graphics 2000
fps
HD Graphics 2000:
12.7 [X] no model Intel Core i5-2400 3.1GHz
HD Graphics 2000
fps
HD Graphics 2000:
6.1 [X] no model Intel Core i5-2400 3.1GHz
HD Graphics 2000
fps
HD Graphics 2000:
30 [X] no model Intel Core i5-2400 3.1GHz
HD Graphics 2000
fps
HD Graphics 2000:
12 [X] no model Intel Core i5-2400 3.1GHz
HD Graphics 2000
fps
HD Graphics 2000:
27.1 [X] no model Intel Core i5-2400 3.1GHz
HD Graphics 2000
fps
HD Graphics 2000:
17.9 [X] no model Intel Core i5-2400 3.1GHz
HD Graphics 2000
fps
HD Graphics 2000:
12.7 [X] no model Intel Core i5-2400 3.1GHz
HD Graphics 2000
fps
HD Graphics 2000:
32 [X] no model Intel Core i5-2400 3.1GHz
HD Graphics 2000
fps
HD Graphics 2000:
5 [X] no model Intel Core i5-2400 3.1GHz
HD Graphics 2000
fps
HD Graphics 2000:
107 [X] no model Intel Core i5-2400 3.1GHz
HD Graphics 2000
fps
HD Graphics 2000:
24 [X] no model Intel Core i5-2400 3.1GHz
HD Graphics 2000
fps
HD Graphics 2000:
13 [X] no model Intel Core i5-2400 3.1GHz
HD Graphics 2000
fps
HD Graphics 2000:
73 [X] no model Intel Core i5-2400 3.1GHz
HD Graphics 2000
fps
HD Graphics 2000:
20 [X] no model Intel Core i5-2400 3.1GHz
HD Graphics 2000
fps
HD Graphics 2000:
-1 [X] no model Intel Core i5-2400 3.1GHz
HD Graphics 2000
fps
HD Graphics 2000:
31 [X] no model Intel Core i5-2400 3.1GHz
HD Graphics 2000
fps
HD Graphics 2000:
27.9 49 [X] no model Intel Core i5-2400 3.1GHz
HD Graphics 2000
~ 38 fps
HD Graphics 2000:
13 [X] no model Intel Core i5-2400 3.1GHz
HD Graphics 2000
13 ~ 13 fps
HD Graphics 2000:
5.2 [X] no model Intel Core i5-2400 3.1GHz
HD Graphics 2000
fps
HD Graphics 2000:
30 [X] no model Intel Core i5-2400 3.1GHz
HD Graphics 2000
fps
HD Graphics 2000:
4 [X] no model Intel Core i5-2400 3.1GHz
HD Graphics 2000
fps
100%
HD Graphics (Bay Trail):
42.9 69.8 69.8 71.6 72 72.7 75.1 75.5 76 [X] Medion Akoya E1232T-MD99410 Intel Celeron N2807 1.6GHz
HD Graphics (Bay Trail)
76.7 77.1 80.9 83.1 83.9 84.3 [X] Captiva PAD 10.1 Windows Intel Atom Z3735D 1.3GHz
HD Graphics (Bay Trail)
84.8 [X] ODYS Winpad V10 Intel Atom Z3735F 1.3GHz
HD Graphics (Bay Trail)
85.6 [X] cmx WinTek 101-1016 Intel Atom Z3735F 1.3GHz
HD Graphics (Bay Trail)
86.9 90.2 ~ 77 fps
216%
HD Graphics 2000:
166 [X] no model Intel Core i5-2400 3.1GHz
HD Graphics 2000
fps
100%
HD Graphics (Bay Trail):
10.3 14 [X] Medion Akoya E1232T-MD99410 Intel Celeron N2807 1.6GHz
HD Graphics (Bay Trail)
17.7 18 18.1 18.1 18.7 18.8 [X] Captiva PAD 10.1 Windows Intel Atom Z3735D 1.3GHz
HD Graphics (Bay Trail)
19.3 19.4 19.4 19.8 19.8 20.5 20.5 [X] cmx WinTek 101-1016 Intel Atom Z3735F 1.3GHz
HD Graphics (Bay Trail)
20.6 21 [X] ODYS Winpad V10 Intel Atom Z3735F 1.3GHz
HD Graphics (Bay Trail)
21.5 23.6 ~ 19 fps
207%
HD Graphics 2000:
39.3 [X] no model Intel Core i5-2400 3.1GHz
HD Graphics 2000
fps
100%
HD Graphics (Bay Trail):
6.4 [X] Captiva PAD 10.1 Windows Intel Atom Z3735D 1.3GHz
HD Graphics (Bay Trail)
7.7 ~ 7 fps
196%
HD Graphics 2000:
13.7 [X] no model Intel Core i5-2400 3.1GHz
HD Graphics 2000
fps
HD Graphics 2000:
74 [X] no model Intel Core i5-2400 3.1GHz
HD Graphics 2000
fps
HD Graphics 2000:
27 [X] no model Intel Core i5-2400 3.1GHz
HD Graphics 2000
fps
HD Graphics 2000:
11 [X] no model Intel Core i5-2400 3.1GHz
HD Graphics 2000
fps
HD Graphics 2000:
27 [X] no model Intel Core i5-2400 3.1GHz
HD Graphics 2000
fps
HD Graphics 2000:
16 [X] no model Intel Core i5-2400 3.1GHz
HD Graphics 2000
fps
100%
HD Graphics (Bay Trail):
18.9 19 ~ 19 fps
163%
HD Graphics 2000:
25 [X] no model Intel Core i5-2400 3.1GHz
HD Graphics 2000
37 [X] Desktop Intel Core i5-2400 3.1GHz
HD Graphics 2000
~ 31 fps
100%
HD Graphics (Bay Trail):
7.6 8.7 ~ 8 fps
175%
HD Graphics 2000:
13.8 [X] no model Intel Core i5-2400 3.1GHz
HD Graphics 2000
14.7 [X] Desktop Intel Core i5-2400 3.1GHz
HD Graphics 2000
~ 14 fps
HD Graphics 2000:
33.3 [X] Desktop Intel Core i5-2400 3.1GHz
HD Graphics 2000
fps
HD Graphics 2000:
13.7 [X] Desktop Intel Core i5-2400 3.1GHz
HD Graphics 2000
fps
HD Graphics 2000:
78 [X] no model Intel Core i5-2400 3.1GHz
HD Graphics 2000
fps
HD Graphics 2000:
21 [X] no model Intel Core i5-2400 3.1GHz
HD Graphics 2000
fps
HD Graphics 2000:
10 [X] no model Intel Core i5-2400 3.1GHz
HD Graphics 2000
fps
HD Graphics 2000:
4 [X] no model Intel Core i5-2400 3.1GHz
HD Graphics 2000
fps
HD Graphics 2000:
100.6 [X] no model Intel Core i5-2400 3.1GHz
HD Graphics 2000
fps
HD Graphics 2000:
44 [X] no model Intel Core i5-2400 3.1GHz
HD Graphics 2000
fps
100%
HD Graphics (Bay Trail):
33 33 35 38 [X] MSI S100 Intel Atom Z3740D 1.3GHz
HD Graphics (Bay Trail)
44 46.2 47 48 49 49 [X] Intel NUC Kit DN2820FYKH Intel Celeron N2820 2.2GHz
HD Graphics (Bay Trail)
min:
39 fps, max:
59 fps
50 [X] Baytrail Reference Tablet Intel Atom Z3770 1.5GHz
HD Graphics (Bay Trail)
min:
36 fps
52 ~ 44 fps
107%
HD Graphics (Cherry Trail):
44 50.9 [X] Chuwi Hi12 Intel Atom x5-Z8300 1.4GHz
HD Graphics (Cherry Trail)
min:
40 fps, max:
60 fps
~ 47 fps
327%
HD Graphics 2000:
144 [X] no model Intel Core i5-2400 3.1GHz
HD Graphics 2000
fps
100%
HD Graphics (Bay Trail):
9.6 [X] Intel NUC Kit DN2820FYKH Intel Celeron N2820 2.2GHz
HD Graphics (Bay Trail)
min:
3 fps, max:
13 fps
11.5 [X] Baytrail Reference Tablet Intel Atom Z3770 1.5GHz
HD Graphics (Bay Trail)
min:
8 fps
20 22 23 25.3 26 26 28 [X] MSI S100 Intel Atom Z3740D 1.3GHz
HD Graphics (Bay Trail)
34 ~ 23 fps
80%
HD Graphics (Cherry Trail):
18.3 [X] Chuwi Hi12 Intel Atom x5-Z8300 1.4GHz
HD Graphics (Cherry Trail)
min:
13 fps, max:
29 fps
fps
157%
HD Graphics 2000:
36 [X] no model Intel Core i5-2400 3.1GHz
HD Graphics 2000
fps
100%
HD Graphics (Bay Trail):
12 12 13.5 ~ 13 fps
69%
HD Graphics 2000:
9 [X] no model Intel Core i5-2400 3.1GHz
HD Graphics 2000
fps
100%
HD Graphics (Bay Trail):
5.6 7 ~ 6 fps
HD Graphics 2000:
210 [X] no model Intel Core i5-2400 3.1GHz
HD Graphics 2000
fps
HD Graphics 2000:
70 [X] no model Intel Core i5-2400 3.1GHz
HD Graphics 2000
fps
HD Graphics 2000:
52 [X] no model Intel Core i5-2400 3.1GHz
HD Graphics 2000
fps
HD Graphics 2000:
44.1 [X] no model Intel Core i5-2400 3.1GHz
HD Graphics 2000
fps
100%
HD Graphics (Bay Trail):
190 [X] Baytrail Reference Tablet Intel Atom Z3770 1.5GHz
HD Graphics (Bay Trail)
fps
128%
HD Graphics 2000:
243 [X] no model Intel Core i5-2400 3.1GHz
HD Graphics 2000
fps
Average Gaming Intel HD Graphics (Bay Trail) → 100% Average Gaming 30-70 fps → 100%
Average Gaming Intel HD Graphics (Cherry Trail) → 165% Average Gaming 30-70 fps → 123%
Average Gaming Intel HD Graphics 2000 → 165% Average Gaming 30-70 fps → 176%
For more games that might be playable and a list of all games and graphics cards visit our Gaming List
v1.26
log 24. 05:28:58
#0 checking url part for id 4922 +0s ... 0s
#1 checking url part for id 6197 +0s ... 0s
#2 checking url part for id 1958 +0s ... 0s
#3 not redirecting to Ajax server +0s ... 0s
#4 did not recreate cache, as it is less than 5 days old! Created at Mon, 22 Apr 2024 05:40:21 +0200 +0.001s ... 0.001s
#5 composed specs +0.252s ... 0.253s
#6 did output specs +0s ... 0.253s
#7 start showIntegratedCPUs +0s ... 0.253s
#8 getting avg benchmarks for device 4922 +0.095s ... 0.348s
#9 got single benchmarks 4922 +0.389s ... 0.737s
#10 getting avg benchmarks for device 6197 +0.019s ... 0.756s
#11 got single benchmarks 6197 +0.102s ... 0.858s
#12 getting avg benchmarks for device 1958 +0.002s ... 0.86s
#13 got single benchmarks 1958 +0.047s ... 0.907s
#14 got avg benchmarks for devices +0s ... 0.907s
#15 min, max, avg, median took s +0.61s ... 1.516s
#16 before gaming benchmark output +0s ... 1.516s
#17 Got 649 rows for game benchmarks. +0.115s ... 1.632s
#18 composed SQL query for gamebenchmarks +0s ... 1.632s
#19 got data and put it in $dataArray +0.076s ... 1.708s
#20 benchmarks composed for output. +0.256s ... 1.963s
#21 calculated avg scores. +0s ... 1.963s
#22 return log +0.003s ... 1.967s
Please share our article, every link counts!
Redaktion, 2017-09- 8 (Update: 2023-07- 1)
 Deutsch
 English
 Español
 Français
 Italiano
 Nederlands
 Polski
 Português
 Русский
 Türkçe
 Svenska
 Chinese
 Magyar