Intel HD Graphics (Bay Trail) vs Intel HD Graphics 400 (Braswell) vs Intel HD Graphics (Ivy Bridge)
Intel HD Graphics (Bay Trail) ► remove from comparison
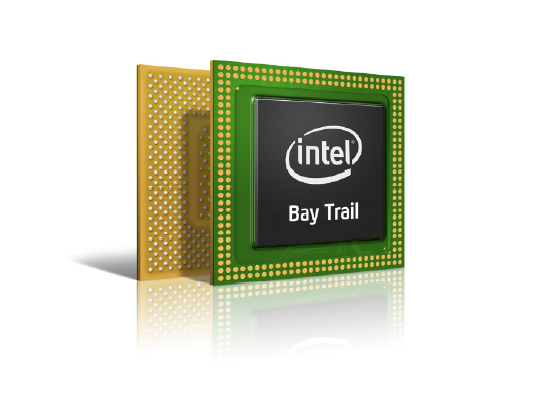
The Intel HD Graphics (Bay Trail) is a low-end integrated Bay Trail graphics card found in certain Atom models (Z3770 ), nettops (J2850 ) and notebook SoCs (N3510 ). It supports DirectX 11 and is based on the Ivy Bridge GPU. Clock rates and shader cores, however, are considerably lower.
Compared to Ivy Bridge, which offers either 6 or 16 Execution Units, the HD Graphics (Bay Trail) comes with only 4 EUs. The core clock is significantly lower as well. Depending on the specific model, the maximum Turbo Boost is 896 MHz or less and the memory controller can support DDR3(L), DDR3L-RS or LPDDR3 in single- or dual-channel operation.
The fastest notebook models equipped with this GPU nearly match the performance of the HD Graphics (Sandy Bridge) and the AMD Radeon HD 6310 . Therefore, older and less demanding Windows games like World of Warcraft or Half-Life 2 can be played fluently in very low settings. Performance is not sufficient for most modern titles.
Compared to competing ARM SoCs, Bay Trail outperforms the Adreno 320 (which can be found in different Qualcomm SoCs like the Snapdragon 600 ) and offers a performance similar to the Tegra 4 GPU. That is enough power to run even the most demanding Android games smoothly in very high resolutions as of 2013.
The integrated video decoder supports all popular codecs such as MPEG2, H.264, VC1, VP8 and MVC and is suitable for resolutions up to 4K up to 100 Mbit/s. The user can connect up to two displays via HDMI 1.4 (max. 1920 x 1080) or DisplayPort 1.2 (max. 2560 x 1600). Another new feature is the support for Wireless Display and Quick Sync, Intel's fast and power efficient H-264 hardware encoder. Some of these features are not available on all models.
Depending on the model, the power consumption of the entire SoC is somewhere between 2 and 10 W. The most efficient versions are therefore suitable for passively cooled tablets, whereas faster variants are used in larger subnotebooks with active cooling.
Intel HD Graphics 400 (Braswell) ► remove from comparison
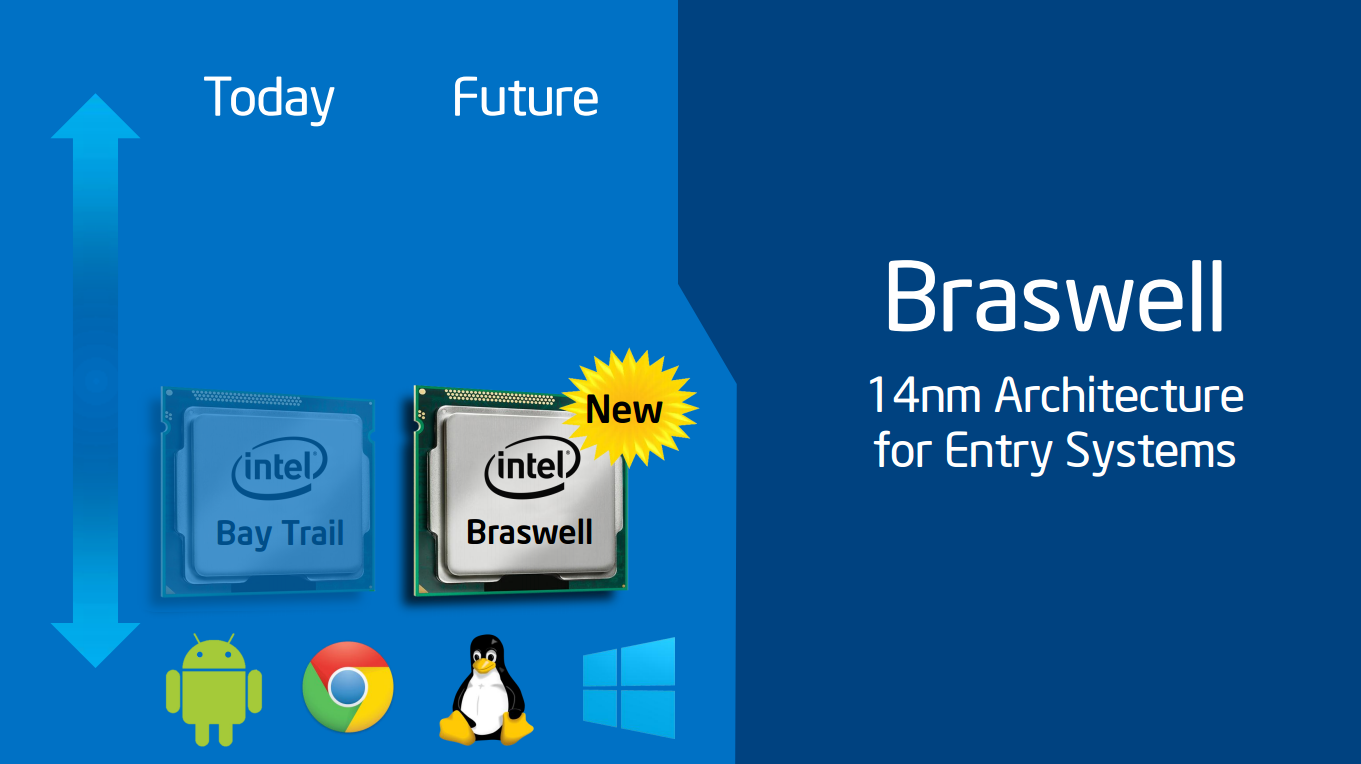
The Intel HD Graphics 400 (Braswell) is an integrated graphics card in the low end SoCs of the Braswell series (2016 Celeron models). It is based on the same architecture as the integrated GPU of the Broadwell graphics cards (e.g. HD Graphics 5300 ), but offers less shader cores and slower clock speeds.
It is a rename from the Intel HD Graphics (Braswell) card that included the faster 16 EU model in the Pentium SoCs. See the Intel HD Graphics Braswell graphics card page for benchmarks .
The performance depends on the processor (different boost speed for the GPU) and the used memory.
Gaming performance ist still only suited for older or less demanding games. Often also the processor is limited gaming performance (e.g. in the dual-core N3000).
The SoC also integrates a video decoding engine that should be able to handle 4K H.265 videos.
Intel HD Graphics (Ivy Bridge) ► remove from comparison
The Intel HD Graphics (Ivy Bridge) is an integrated graphics card in the mobile Ivy Bridge codenamed processors (Celeron and Pentium). It is the successor the the Intel HD Graphics 2000 in the Sandy Bridge CPUs and performs between the old HD 2000 and 3000 GPU .
Compared to the faster HD Graphics 4000 , the HD Graphics features less Execution Units (6 versus 16) and only one texture sampler. Therefore, the performance is clearly worse and only suited for low demanding gaming. Intel states a 10 to 15% higher performance compared to the old Sandy Bridge based HD Graphics 2000 (see our benchmarks below), which is similar to AMDs low-end GPUs like the integrated Radeon HD 8210 . Therefore, only casual games with low requirements are playable.
A speciality of the Ivy Bridge GPUs is that 4x MSAA is supported in hardware now. However, 2x is only supported through software. The algorithm to support 2x is going through the 4x pipeline with a software algorithm, so performance is similar to 4x MSAA.
The integrated video decoder called Multi Format Codec Engine (MFX) was also improved and should allow even simultaneus 4K video decoding. DXVAChecker lists MPEG2, VC1, WMV9, and H264 as supported codecs. QuickSync for fast transcoding of videos was also optimized for higher performance and better image quality.
Another new feature is the support for up to 3 independent displays (maybe only with a DisplayPort) as AMD offers with theirs Eyefinity support (up to 6 displays).
Due to the 22nm 3D Tri-Gate production process, the power consumption should be relatively low (the development was focused on performance per Watt).
Intel HD Graphics (Bay Trail) Intel HD Graphics 400 (Braswell) Intel HD Graphics (Ivy Bridge) HD Graphics Series Codename Bay Trail Braswell Ivy Bridge GT1 Architecture Gen. 7 Ivy Bridge Gen. 8 Gen. 7 Ivy Bridge Pipelines 4 - unified 12 - unified 6 - unified Core Speed 311 - 896 (Boost) MHz 320 - 640 (Boost) MHz 350 - 1100 (Boost) MHz Memory Bus Width 32/64/128 Bit 64/128 Bit 64/128 Bit Shared Memory yes yes yes API DirectX 11, Shader 5.0, OpenGL 4.0, ES 3.0 DirectX 11.2, Shader 5.0 DirectX 11.0, Shader 5.0 technology 22 nm 14 nm 22 nm Date of Announcement 11.09.2013 01.04.2016 01.10.2012
CPU in HD Graphics (Bay Trail) GPU Base Speed GPU Boost / Turbo Intel Pentium N3540 4 x 2160 MHz, 7.5 W 313 MHz 896 MHz Intel Pentium J2900 4 x 2410 MHz, 10 W 688 MHz 896 MHz Intel Pentium N3530 4 x 2160 MHz, 7.5 W 313 MHz 896 MHz » show 43 more Intel Pentium J2850 4 x 2400 MHz, 10 W 688 MHz 792 MHz Intel Pentium N3520 4 x 2167 MHz, 7.5 W 313 MHz 854 MHz Intel Celeron J1900 4 x 2000 MHz, 10 W 688 MHz 854 MHz Intel Atom Z3795 4 x 1590 MHz, <4 W 311 MHz 778 MHz Intel Atom Z3785 4 x 1490 MHz, <4 W 313 MHz 833 MHz Intel Atom Z3775 4 x 1460 MHz, <4 W 311 MHz 778 MHz Intel Atom Z3775D 4 x 1490 MHz, <4 W 311 MHz 792 MHz Intel Atom Z3770 4 x 1460 MHz, <4 W 311 MHz 667 MHz Intel Atom Z3770D 4 x 1500 MHz, 4 W 313 MHz 688 MHz Intel Celeron N2940 4 x 1830 MHz, 7.5 W 313 MHz 854 MHz Intel Celeron N2930 4 x 1830 MHz, 7.5 W 313 MHz 854 MHz Intel Celeron J1850 4 x 2000 MHz, 10 W 688 MHz 792 MHz Intel Pentium N3510 4 x 2000 MHz, 7.5 W 313 MHz 750 MHz Intel Celeron N2920 4 x 1860 MHz, 7.5 W 313 MHz 854 MHz Intel Atom E3845 4 x 1910 MHz, 10 W 542 MHz 792 MHz Intel Atom Z3736F 4 x 1330 MHz, 4 W 313 MHz 646 MHz Intel Atom Z3736G 4 x 1330 MHz, <4 W 313 MHz 646 MHz Intel Atom Z3745 4 x 1330 MHz, <4 W 311 MHz 778 MHz Intel Atom Z3745D 4 x 1330 MHz, <4 W 311 MHz 792 MHz Intel Atom Z3740 4 x 1330 MHz, <4 W 311 MHz 667 MHz Intel Atom Z3740D 4 x 1330 MHz, <4 W 313 MHz 688 MHz Intel Atom Z3735D 4 x 1330 MHz, <4 W 311 MHz 646 MHz Intel Atom Z3735E 4 x 1330 MHz, <4 W 311 MHz 646 MHz Intel Atom Z3735F 4 x 1330 MHz, <4 W 311 MHz 646 MHz Intel Atom Z3735G 4 x 1330 MHz, <4 W 311 MHz 646 MHz Intel Celeron J1800 2 x 2410 MHz, 10 W 688 MHz 792 MHz Intel Celeron N2840 2 x 2160 MHz, 7.5 W 313 MHz 792 MHz Intel Celeron J1750 2 x 2410 MHz, 10 W 688 MHz 750 MHz Intel Celeron N2910 4 x 1600 MHz, 7.5 W 313 MHz 756 MHz Intel Celeron N2830 2 x 2160 MHz, 7.5 W 313 MHz 750 MHz Intel Celeron N2820 2 x 2170 MHz, 7.5 W 313 MHz 756 MHz Intel Celeron N2815 2 x 1860 MHz, 7.5 W 313 MHz 756 MHz Intel Celeron N2810 2 x 2000 MHz, 7.5 W 313 MHz 756 MHz Intel Atom Z3680 2 x 1330 MHz, 4 W 311 MHz 667 MHz Intel Atom Z3680D 2 x 1330 MHz, 4 W 313 MHz 688 MHz Intel Celeron N2808 2 x 1580 MHz, 4.3 W 313 MHz 792 MHz Intel Celeron N2807 2 x 1580 MHz, 4.3 W 313 MHz 750 MHz Intel Celeron N2806 2 x 1580 MHz, 4.5 W 313 MHz 756 MHz Intel Atom E3827 2 x 1750 MHz, 8 W 542 MHz 792 MHz Intel Atom E3826 2 x 1460 MHz, 7 W 533 MHz 667 MHz Intel Celeron N2805 2 x 1460 MHz, 4.3 W 313 MHz 667 MHz Intel Atom E3825 2 x 1330 MHz, 6 W ? MHz 533 MHz Intel Atom E3815 1 x 1460 MHz, 5 W ? MHz 400 MHz min. - max. 311 - ? MHz 400 - 896 MHz
CPU in HD Graphics 400 (Braswell) GPU Base Speed GPU Boost / Turbo Intel Atom x5-Z8550 4 x 1440 MHz 200 MHz 600 MHz Intel Celeron N3060 2 x 1600 MHz, 6 W 320 MHz 700 MHz min. - max. 200 - ? MHz 400 - 896 MHz
CPU in HD Graphics (Ivy Bridge) GPU Base Speed GPU Boost / Turbo Intel Pentium 2030M 2 x 2500 MHz, 35 W 650 MHz 1100 MHz Intel Pentium 2020M 2 x 2400 MHz, 35 W 650 MHz 1100 MHz Intel Celeron 1020E 2 x 2200 MHz, 35 W 650 MHz 1000 MHz » show 12 more Intel Celeron 1020M 2 x 2100 MHz, 35 W 650 MHz 1000 MHz Intel Pentium 2127U 2 x 1900 MHz, 17 W 350 MHz 1100 MHz Intel Celeron 1005M 2 x 1900 MHz, 35 W 650 MHz 1000 MHz Intel Pentium 2117U 2 x 1800 MHz, 17 W 350 MHz 1000 MHz Intel Celeron 1000M 2 x 1800 MHz, 35 W 650 MHz 1000 MHz Intel Celeron 1037U 2 x 1800 MHz, 17 W 350 MHz 1000 MHz Intel Celeron 1017U 2 x 1600 MHz, 17 W 350 MHz 1000 MHz Intel Celeron 1007U 2 x 1500 MHz, 17 W 350 MHz 1000 MHz Intel Celeron 1047UE 2 x 1400 MHz, 17 W 350 MHz 900 MHz Intel Pentium 2129Y 2 x 1100 MHz, 10 W 350 MHz 850 MHz Intel Celeron 1019Y 2 x 1000 MHz, 10 W 350 MHz 800 MHz Intel Celeron 927UE 1 x 1500 MHz, 17 W 350 MHz 900 MHz min. - max. 200 - ? MHz 400 - 1100 MHz
Benchmarks Performance Rating - 3DMark 11 + Fire Strike + Time Spy - HD Graphics (Bay Trail)
0.1 pt (0%)
Intel HD Graphics (Bay Trail)
...
max:
Performance Rating - 3DMark 11 + Fire Strike + Time Spy - HD Graphics 400 (Braswell)
0.1 pt (0%)
Intel HD Graphics 400 (Braswell)
...
max:
Performance Rating - 3DMark 11 + Fire Strike + Time Spy - HD Graphics (Ivy Bridge)
0.1 pt (0%)
...
Intel HD Graphics (Ivy Bridge)
...
max:
3DMark - 3DMark Ice Storm Unlimited Graphics
min: 11835 avg: 14513 median: 14748.5 (2%) max: 17613 Points
min: 17968 avg: 20459 median: 20277 (2%) max: 23161 Points
3DMark - 3DMark Ice Storm Extreme Graphics
min: 4751 avg: 7342 median: 7498 (1%) max: 9234 Points
14334 Points (2%)
3DMark - 3DMark Cloud Gate Score
min: 354 avg: 1182 median: 1188 (1%) max: 1703 Points
min: 1350 avg: 1553 median: 1457 (2%) max: 2087 Points
min: 1478 avg: 1898 median: 1906.5 (2%) max: 2207 Points
3DMark - 3DMark Cloud Gate Graphics
min: 362 avg: 1230 median: 1228.5 (0%) max: 1670 Points
min: 1519 avg: 1865 median: 1841 (0%) max: 2455 Points
min: 2116 avg: 2283 median: 2286 (1%) max: 2470 Points
3DMark - 3DMark Fire Strike Standard Score
min: 83 avg: 185 median: 147 (0%) max: 495 Points
min: 176 avg: 188 median: 188 (0%) max: 200 Points
min: 208 avg: 253.6 median: 254.5 (0%) max: 275 Points
3DMark - 3DMark Fire Strike Standard Graphics
min: 90 avg: 149.1 median: 149 (0%) max: 200 Points
min: 202 avg: 218 median: 218 (0%) max: 234 Points
min: 248 avg: 286.2 median: 285.5 (0%) max: 305 Points
3DMark - 3DMark Ice Storm Graphics
min: 5056 avg: 15391 median: 16047 (2%) max: 21351 Points
min: 13689 avg: 18517 median: 18516.5 (2%) max: 23344 Points
min: 22834 avg: 24734 median: 24209.5 (3%) max: 29149 Points
3DMark - 3DMark Sling Shot (ES 3.0) Unlimited
min: 1502 avg: 1926 median: 1925.5 (8%) max: 2349 Points
3DMark - 3DMark Sling Shot (ES 3.0) Unlimited Graphics
min: 1452 avg: 2046 median: 2046 (4%) max: 2640 Points
3DMark - 3DMark Sling Shot Extreme (ES 3.1) Unlimited
1180 Points (6%)
3DMark - 3DMark Sling Shot Extreme (ES 3.1) Unlimited Graphics
977 Points (3%)
3DMark 11 - 3DM11 Performance Score
min: 143 avg: 222.6 median: 216 (0%) max: 280 Points
min: 289 avg: 386.1 median: 397 (1%) max: 478 Points
min: 258 avg: 363.3 median: 370.5 (1%) max: 413 Points
3DMark 11 - 3DM11 Performance GPU
min: 122 avg: 192.1 median: 186.5 (0%) max: 237 Points
min: 247 avg: 341.1 median: 349 (0%) max: 418 Points
min: 218 avg: 310.6 median: 315 (0%) max: 352 Points
3DMark Vantage + Intel HD Graphics (Bay Trail) 3DMark Vantage - 3DM Vant. Perf. total
min: 507 avg: 666 median: 637 (0%) max: 846 Points
3DM Vant. Perf. total + Intel HD Graphics (Ivy Bridge) min: 930 avg: 1465 median: 1491 (0%) max: 1691 Points
3DM Vant. Perf. GPU no PhysX + Intel HD Graphics (Bay Trail) 3DMark Vantage - 3DM Vant. Perf. GPU no PhysX
min: 395 avg: 512 median: 503 (0%) max: 667 Points
3DM Vant. Perf. GPU no PhysX + Intel HD Graphics (Ivy Bridge)
min: 728 avg: 1186 median: 1213 (1%) max: 1360 Points
3DMark 2001SE - 3DMark 2001 - Standard
7727 Points (8%)
min: 8075 avg: 9212 median: 9212 (10%) max: 10349 Points
3DMark 03 - 3DMark 03 - Standard
min: 4226 avg: 4997 median: 5220 (3%) max: 5323 Points
min: 5909 avg: 7584 median: 7434 (4%) max: 10124 Points
3DMark 05 - 3DMark 05 - Standard
min: 2666 avg: 3195 median: 3331 (4%) max: 3445 Points
min: 3839 avg: 5085 median: 5186 (6%) max: 6252 Points
3DMark 06 3DMark 06 - Score Unknown Settings + Intel HD Graphics (Bay Trail)
2108 Points (3%)
3DMark 06 - Standard 1280x1024 + Intel HD Graphics (Bay Trail)
min: 814 avg: 1785 median: 1866 (2%) max: 2151 Points
3DMark 06 - Standard 1280x1024 + Intel HD Graphics 400 (Braswell)
2474 Points (3%)
3DMark 06 - Standard 1280x1024 + Intel HD Graphics (Ivy Bridge)
min: 2186 avg: 2949 median: 2930 (4%) max: 3573 Points
3DMark 06 - Standard 1280x800 + Intel HD Graphics (Bay Trail)
2087 Points (3%)
Unigine Heaven 3.0 - Unigine Heaven 3.0 DX 11
3.6 fps (1%)
Unigine Heaven 2.1 - Heaven 2.1 high
min: 2.4 avg: 2.8 median: 2.8 (1%) max: 3.4 fps
SPECviewperf 11 + Intel HD Graphics (Ivy Bridge) SPECviewperf 11 - specvp11 snx-01
min: 0.75 avg: 0.8 median: 0.8 (0%) max: 0.87 fps
specvp11 tcvis-02 + Intel HD Graphics (Ivy Bridge) SPECviewperf 11 - specvp11 tcvis-02
min: 1.31 avg: 1.5 median: 1.5 (1%) max: 1.66 fps
specvp11 sw-02 + Intel HD Graphics (Ivy Bridge) SPECviewperf 11 - specvp11 sw-02
min: 4.68 avg: 5.3 median: 5.3 (4%) max: 5.88 fps
specvp11 proe-05 + Intel HD Graphics (Ivy Bridge) SPECviewperf 11 - specvp11 proe-05
min: 0.91 avg: 1.1 median: 1.1 (1%) max: 1.19 fps
specvp11 maya-03 + Intel HD Graphics (Ivy Bridge) SPECviewperf 11 - specvp11 maya-03
min: 8.71 avg: 8.8 median: 8.8 (7%) max: 8.93 fps
specvp11 lightwave-01 + Intel HD Graphics (Ivy Bridge) SPECviewperf 11 - specvp11 lightwave-01
min: 7.83 avg: 8.9 median: 8.9 (10%) max: 10.03 fps
specvp11 ensight-04 + Intel HD Graphics (Ivy Bridge) SPECviewperf 11 - specvp11 ensight-04
min: 1.27 avg: 1.4 median: 1.4 (1%) max: 1.51 fps
specvp11 catia-03 + Intel HD Graphics (Ivy Bridge) SPECviewperf 11 - specvp11 catia-03
0 fps (0%)
Windows 7 Experience Index - Win7 Gaming graphics
6.2 Points (78%)
Windows 7 Experience Index - Win7 Graphics
min: 4.6 avg: 4.7 median: 4.7 (59%) max: 4.7 Points
Cinebench R10 Cinebench R10 Shading (32bit) + Intel HD Graphics (Bay Trail) Cinebench R10 - Cinebench R10 Shading (32bit)
min: 898 avg: 2014 median: 1991.5 (1%) max: 2889 Points
Cinebench R10 Shading (32bit) + Intel HD Graphics 400 (Braswell)
min: 1627 avg: 2057 median: 2052.5 (1%) max: 2510 Points
Cinebench R10 Shading (32bit) + Intel HD Graphics (Ivy Bridge)
min: 2410 avg: 3337 median: 3382 (2%) max: 4037 Points
Cinebench R11.5 Cinebench R11.5 OpenGL 64 Bit + Intel HD Graphics (Bay Trail) Cinebench R11.5 - Cinebench R11.5 OpenGL 64 Bit
min: 0.37 avg: 6.2 median: 6.4 (2%) max: 7.69 fps
Cinebench R11.5 OpenGL 64 Bit + Intel HD Graphics 400 (Braswell)
min: 9.97 avg: 10.1 median: 10 (3%) max: 10.12 fps
Cinebench R11.5 OpenGL 64 Bit + Intel HD Graphics (Ivy Bridge)
min: 6.62 avg: 9.1 median: 9.2 (3%) max: 11.32 fps
Cinebench R15 + Intel HD Graphics (Bay Trail) Cinebench R15 - Cinebench R15 OpenGL 64 Bit
min: 2.88 avg: 5 median: 5.5 (0%) max: 6.55 fps
Cinebench R15 OpenGL 64 Bit + Intel HD Graphics 400 (Braswell)
min: 8.48 avg: 11 median: 11.3 (1%) max: 13.98 fps
Cinebench R15 OpenGL Ref. Match 64 Bit + Intel HD Graphics (Bay Trail) Cinebench R15 - Cinebench R15 OpenGL Ref. Match 64 Bit
min: 63 avg: 96.1 median: 97.8 (98%) max: 97.8 %
Cinebench R15 OpenGL Ref. Match 64 Bit + Intel HD Graphics 400 (Braswell)
98 % (98%)
GFXBench - GFXBench 5.0 Aztec Ruins High Tier Offscreen
3.3 fps (1%)
GFXBench - GFXBench 5.0 Aztec Ruins Normal Tier Offscreen
9.3 fps (1%)
GFXBench 3.1 - GFXBench Manhattan ES 3.1 Offscreen
5.2 fps (0%)
min: 7.2 avg: 10.6 median: 10.6 (0%) max: 14 fps
GFXBench 3.0 - GFXBench 3.0 Manhattan Offscreen
min: 6 avg: 9.7 median: 8.8 (1%) max: 16 fps
min: 14 avg: 16 median: 16 (1%) max: 18 fps
GFXBench (DX / GLBenchmark) 2.7 + Intel HD Graphics (Bay Trail) GFXBench (DX / GLBenchmark) 2.7 - GFXBench T-Rex HD Offscreen C24Z16
min: 6 avg: 15.7 median: 16 (0%) max: 20.2 fps
GFXBench T-Rex HD Offscreen C24Z16 + Intel HD Graphics 400 (Braswell) min: 27 avg: 29 median: 29 (0%) max: 31 fps
GFXBench T-Rex HD Offscreen C24Z16 + Intel HD Graphics (Ivy Bridge) 27 fps (0%)
Basemark ES 2.0 - Basemark ES 2.0
min: 45.08 avg: 49.1 median: 49.1 (81%) max: 53.1 fps
Basemark X 1.0 - Basemark X 1.0 Off-Screen
10.1 fps (48%)
Basemark X 1.1 - Basemark X 1.1 High Quality
min: 3008 avg: 6663 median: 8456 (19%) max: 8524 Points
Basemark X 1.1 - Basemark X 1.1 Medium Quality
min: 4802 avg: 12880 median: 14509 (32%) max: 17701 Points
NenaMark2 - NenaMark2 Score
min: 59 avg: 59.4 median: 59.4 (88%) max: 59.7 fps
LuxMark v2.0 64Bit - LuxMark v2.0 Room GPU
min: 25 avg: 28.5 median: 27 (0%) max: 35 Samples/s
min: 27 avg: 38.3 median: 44 (0%) max: 44 Samples/s
LuxMark v2.0 64Bit - LuxMark v2.0 Sala GPU
min: 26 avg: 29 median: 29 (0%) max: 34 Samples/s
44 Samples/s (0%)
ComputeMark v2.1 - ComputeMark v2.1 Result
min: 160 avg: 172.8 median: 174 (0%) max: 192 Points
min: 190 avg: 266.4 median: 275 (0%) max: 290 Points
PassMark PerformanceTest Mobile V1 - PerformanceTest Mobile V1 2D Graphics Tests
min: 3822 avg: 4036 median: 3866 (4%) max: 4588 Points
PassMark PerformanceTest Mobile V1 - PerformanceTest Mobile V1 3D Graphics Tests
min: 1058 avg: 1251 median: 1228 (2%) max: 1488 Points
Smartbench 2012 - Smartbench 2012 Gaming Index
min: 2679 avg: 3414 median: 3385 (74%) max: 4274 Points
Average Benchmarks Intel HD Graphics (Bay Trail) → 100% n=11 Average Benchmarks Intel HD Graphics 400 (Braswell) → 146% n=11 Average Benchmarks Intel HD Graphics (Ivy Bridge) → 168% n=11
- Range of benchmark values for this graphics card
- Average benchmark values for this graphics card
* Smaller numbers mean a higher performance
1 This benchmark is not used for the average calculation
Game Benchmarks The following benchmarks stem from our benchmarks of review laptops. The performance depends on the used graphics memory, clock rate, processor, system settings, drivers, and operating systems. So the results don't have to be representative for all laptops with this GPU. For detailed information on the benchmark results, click on the fps number.
HD Graphics 400 (Braswell):
14.1 fps
100%
HD Graphics (Bay Trail):
26.7 [X] Intel NUC Kit DN2820FYKH Intel Celeron N2820 2.2GHz
HD Graphics (Bay Trail)
min:
23 fps
fps
69%
HD Graphics 400 (Braswell):
18.5 fps
100%
HD Graphics (Bay Trail):
23.4 [X] Intel NUC Kit DN2820FYKH Intel Celeron N2820 2.2GHz
HD Graphics (Bay Trail)
min:
21 fps
fps
68%
HD Graphics 400 (Braswell):
16 fps
100%
HD Graphics (Bay Trail):
6 [X] Intel NUC Kit DN2820FYKH Intel Celeron N2820 2.2GHz
HD Graphics (Bay Trail)
fps
100%
HD Graphics (Bay Trail):
12.6 [X] Intel NUC Kit DN2820FYKH Intel Celeron N2820 2.2GHz
HD Graphics (Bay Trail)
min:
7 fps, max:
15 fps
fps
101%
HD Graphics 400 (Braswell):
12.7 fps
HD Graphics 400 (Braswell):
6.8 fps
HD Graphics 400 (Braswell):
10.7 fps
HD Graphics 400 (Braswell):
20.9 fps
HD Graphics 400 (Braswell):
5.8 fps
HD Graphics 400 (Braswell):
9.7 fps
HD Graphics 400 (Braswell):
15 15.1 ~ 15 fps
HD Graphics 400 (Braswell):
9.5 9.7 ~ 10 fps
HD Graphics 400 (Braswell):
5.3 fps
HD Graphics 400 (Braswell):
7.3 fps
HD Graphics 400 (Braswell):
3.2 fps
HD Graphics (Bay Trail):
0 (!) [X] Intel NUC Kit DN2820FYKH Intel Celeron N2820 2.2GHz
HD Graphics (Bay Trail)
fps
HD Graphics 400 (Braswell):
36.5 fps
HD Graphics 400 (Braswell):
14.2 fps
HD Graphics 400 (Braswell):
9 fps
100%
HD Graphics (Bay Trail):
12.1 [X] Intel NUC Kit DN2820FYKH Intel Celeron N2820 2.2GHz
HD Graphics (Bay Trail)
min:
5 fps, max:
18 fps
fps
107%
HD Graphics 400 (Braswell):
13 fps
HD Graphics 400 (Braswell):
8 fps
100%
HD Graphics (Bay Trail):
10.8 [X] Intel NUC Kit DN2820FYKH Intel Celeron N2820 2.2GHz
HD Graphics (Bay Trail)
min:
10 fps, max:
12 fps
fps
123%
HD Graphics 400 (Braswell):
13.3 fps
100%
HD Graphics (Bay Trail):
24.7 [X] Intel NUC Kit DN2820FYKH Intel Celeron N2820 2.2GHz
HD Graphics (Bay Trail)
min:
22.2 fps
fps
86%
HD Graphics 400 (Braswell):
21.3 fps
100%
HD Graphics (Bay Trail):
9.7 [X] Intel NUC Kit DN2820FYKH Intel Celeron N2820 2.2GHz
HD Graphics (Bay Trail)
min:
8.8 fps
fps
118%
HD Graphics 400 (Braswell):
11.4 fps
100%
HD Graphics (Bay Trail):
5.5 [X] Intel NUC Kit DN2820FYKH Intel Celeron N2820 2.2GHz
HD Graphics (Bay Trail)
min:
-1.4 fps
fps
100%
HD Graphics (Bay Trail):
5.4 [X] Intel NUC Kit DN2820FYKH Intel Celeron N2820 2.2GHz
HD Graphics (Bay Trail)
min:
-3 fps
fps
HD Graphics 400 (Braswell):
8.5 fps
HD Graphics 400 (Braswell):
5.6 fps
100%
HD Graphics (Bay Trail):
22 [X] Intel NUC Kit DN2820FYKH Intel Celeron N2820 2.2GHz
HD Graphics (Bay Trail)
min:
16 fps, max:
33 fps
24.2 ~ 23 fps
174%
HD Graphics 400 (Braswell):
40.1 fps
100%
HD Graphics (Bay Trail):
0 (!) [X] Intel NUC Kit DN2820FYKH Intel Celeron N2820 2.2GHz
HD Graphics (Bay Trail)
12.5 ~ 6 fps
195%
HD Graphics 400 (Braswell):
11.7 fps
HD Graphics 400 (Braswell):
14.3 fps
100%
HD Graphics (Bay Trail):
7.3 fps
100%
HD Graphics (Bay Trail):
5.1 fps
100%
HD Graphics (Bay Trail):
3.2 fps
100%
HD Graphics (Bay Trail):
1.7 fps
100%
HD Graphics (Bay Trail):
8.1 fps
100%
HD Graphics (Bay Trail):
4.7 fps
100%
HD Graphics (Bay Trail):
7 fps
77%
HD Graphics 400 (Braswell):
5.4 fps
100%
HD Graphics (Bay Trail):
4.6 fps
63%
HD Graphics 400 (Braswell):
2.9 fps
100%
HD Graphics (Bay Trail):
5.6 fps
100%
HD Graphics (Bay Trail):
3.8 fps
100%
HD Graphics (Bay Trail):
4.3 fps
100%
HD Graphics (Bay Trail):
2.4 fps
100%
HD Graphics (Bay Trail):
9.6 11.5 ~ 11 fps
100%
HD Graphics (Bay Trail):
4.3 fps
100%
HD Graphics (Bay Trail):
12 14 ~ 13 fps
208%
HD Graphics 400 (Braswell):
27 fps
100%
HD Graphics (Bay Trail):
12 fps
133%
HD Graphics 400 (Braswell):
16 fps
100%
HD Graphics (Bay Trail):
5.2 fps
100%
HD Graphics (Bay Trail):
3.6 fps
100%
HD Graphics (Bay Trail):
3.7 fps
100%
HD Graphics (Bay Trail):
2.5 fps
100%
HD Graphics (Bay Trail):
9.1 fps
132%
HD Graphics 400 (Braswell):
11.5 11.9 ~ 12 fps
100%
HD Graphics (Bay Trail):
5.1 fps
137%
HD Graphics 400 (Braswell):
7 fps
100%
HD Graphics (Bay Trail):
8.5 fps
100%
HD Graphics (Bay Trail):
6.1 fps
100%
HD Graphics (Bay Trail):
12.4 fps
100%
HD Graphics (Bay Trail):
8.5 fps
100%
HD Graphics (Bay Trail):
53.7 56 ~ 55 fps
67%
HD Graphics 400 (Braswell):
37 fps
100%
HD Graphics (Bay Trail):
6.6 7 ~ 7 fps
109%
HD Graphics 400 (Braswell):
7.6 fps
100%
HD Graphics (Bay Trail):
8.4 fps
77%
HD Graphics 400 (Braswell):
6.5 fps
100%
HD Graphics (Bay Trail):
5.9 fps
81%
HD Graphics 400 (Braswell):
4.8 fps
100%
HD Graphics (Bay Trail):
31.6 41.8 ~ 37 fps
78%
HD Graphics 400 (Braswell):
28.9 fps
100%
HD Graphics (Bay Trail):
12.5 12.5 ~ 13 fps
96%
HD Graphics 400 (Braswell):
12.5 fps
100%
HD Graphics (Bay Trail):
8.3 fps
100%
HD Graphics (Bay Trail):
4.6 fps
100%
HD Graphics (Bay Trail):
11.1 fps
100%
HD Graphics (Bay Trail):
9.6 fps
100%
HD Graphics (Bay Trail):
25.2 fps
137%
HD Graphics (Ivy Bridge):
34.5 fps
100%
HD Graphics (Bay Trail):
9.2 fps
155%
HD Graphics (Ivy Bridge):
14.3 fps
HD Graphics (Ivy Bridge):
8.6 fps
100%
HD Graphics (Bay Trail):
3.1 [X] Medion Akoya S6213T MD98716 Intel Pentium N3530 2.2GHz
HD Graphics (Bay Trail)
5.1 ~ 4 fps
148%
HD Graphics (Ivy Bridge):
5.9 fps
100%
HD Graphics (Bay Trail):
3.3 fps
109%
HD Graphics (Ivy Bridge):
3.6 fps
100%
HD Graphics (Bay Trail):
8.7 fps
100%
HD Graphics (Bay Trail):
5.8 fps
100%
HD Graphics (Bay Trail):
12.8 fps
92%
HD Graphics 400 (Braswell):
11.8 fps
117%
HD Graphics (Ivy Bridge):
15 fps
100%
HD Graphics (Bay Trail):
6 fps
127%
HD Graphics (Ivy Bridge):
7.6 fps
100%
HD Graphics (Bay Trail):
7.3 fps
222%
HD Graphics 400 (Braswell):
16.2 fps
HD Graphics 400 (Braswell):
12.3 fps
HD Graphics 400 (Braswell):
7.9 fps
100%
HD Graphics (Bay Trail):
14 fps
100%
HD Graphics (Bay Trail):
8 fps
HD Graphics 400 (Braswell):
30 fps
100%
HD Graphics (Bay Trail):
12 fps
233%
HD Graphics 400 (Braswell):
28 fps
167%
HD Graphics (Ivy Bridge):
20 fps
HD Graphics 400 (Braswell):
17 fps
HD Graphics (Ivy Bridge):
14 fps
100%
HD Graphics (Bay Trail):
12.6 18.7 19.9 29.8 33.6 60 [X] Medion Akoya P2211T MD98602 Intel Celeron N2910 1.6GHz
HD Graphics (Bay Trail)
~ 29 fps
100%
HD Graphics (Bay Trail):
10.5 19.5 33 [X] Medion Akoya P2211T MD98602 Intel Celeron N2910 1.6GHz
HD Graphics (Bay Trail)
~ 21 fps
259%
HD Graphics (Ivy Bridge):
54.4 fps
100%
HD Graphics (Bay Trail):
7.8 12.8 22 [X] Medion Akoya P2211T MD98602 Intel Celeron N2910 1.6GHz
HD Graphics (Bay Trail)
~ 14 fps
229%
HD Graphics (Ivy Bridge):
32 fps
100%
HD Graphics (Bay Trail):
7.7 fps
100%
HD Graphics (Bay Trail):
6.3 fps
100%
HD Graphics (Bay Trail):
10.2 fps
100%
HD Graphics (Bay Trail):
6.1 fps
100%
HD Graphics (Bay Trail):
11 fps
100%
HD Graphics (Bay Trail):
7.8 fps
HD Graphics 400 (Braswell):
30 fps
HD Graphics 400 (Braswell):
30 fps
100%
HD Graphics (Bay Trail):
18.2 [X] Medion Akoya P2211T MD98602 Intel Celeron N2910 1.6GHz
HD Graphics (Bay Trail)
20.8 28.4 31.9 [X] Asus Transformer Book T200TA PL Intel Atom Z3775 1.5GHz
HD Graphics (Bay Trail)
~ 25 fps
96%
HD Graphics (Ivy Bridge):
18.4 30.5 ~ 24 fps
100%
HD Graphics (Bay Trail):
9.5 [X] Medion Akoya P2211T MD98602 Intel Celeron N2910 1.6GHz
HD Graphics (Bay Trail)
10.4 13.7 19.4 [X] Asus Transformer Book T200TA PL Intel Atom Z3775 1.5GHz
HD Graphics (Bay Trail)
~ 13 fps
123%
HD Graphics (Ivy Bridge):
8.2 24.5 ~ 16 fps
100%
HD Graphics (Bay Trail):
4.4 [X] Medion Akoya E6239T Intel Pentium N3510 2GHz
HD Graphics (Bay Trail)
fps
100%
HD Graphics (Bay Trail):
14.1 16.2 17.9 20.4 [X] Medion Akoya E6239T Intel Pentium N3510 2GHz
HD Graphics (Bay Trail)
23.2 ~ 18 fps
111%
HD Graphics 400 (Braswell):
19.9 fps
153%
HD Graphics (Ivy Bridge):
27.5 fps
100%
HD Graphics (Bay Trail):
12.5 12.6 [X] Medion Akoya E6239T Intel Pentium N3510 2GHz
HD Graphics (Bay Trail)
~ 13 fps
96%
HD Graphics 400 (Braswell):
12.5 fps
99%
HD Graphics (Ivy Bridge):
12.8 fps
HD Graphics (Ivy Bridge):
12.5 fps
100%
HD Graphics (Bay Trail):
5 fps
210%
HD Graphics (Ivy Bridge):
10.5 fps
HD Graphics (Ivy Bridge):
8.1 fps
HD Graphics (Ivy Bridge):
4.4 fps
142%
HD Graphics (Ivy Bridge):
16 16.4 19.1 ~ 17 fps
150%
HD Graphics (Ivy Bridge):
8.6 8.9 9 ~ 9 fps
125%
HD Graphics 400 (Braswell):
6.2 fps
154%
HD Graphics (Ivy Bridge):
7.7 fps
100%
HD Graphics (Bay Trail):
1.2 fps
150%
HD Graphics 400 (Braswell):
1.8 fps
100%
HD Graphics (Bay Trail):
39 56.2 69 [X] Baytrail Reference Tablet Intel Atom Z3770 1.5GHz
HD Graphics (Bay Trail)
~ 55 fps
175%
HD Graphics (Ivy Bridge):
80.8 112 [X] Medion Akoya E7221-MD98297 Intel Pentium 2020M 2.4GHz
HD Graphics (Ivy Bridge)
~ 96 fps
100%
HD Graphics (Bay Trail):
12.3 12.8 14 [X] Baytrail Reference Tablet Intel Atom Z3770 1.5GHz
HD Graphics (Bay Trail)
min:
8 fps
~ 13 fps
169%
HD Graphics (Ivy Bridge):
19.3 24 [X] Medion Akoya E7221-MD98297 Intel Pentium 2020M 2.4GHz
HD Graphics (Ivy Bridge)
~ 22 fps
HD Graphics (Ivy Bridge):
10.8 15 [X] Medion Akoya E7221-MD98297 Intel Pentium 2020M 2.4GHz
HD Graphics (Ivy Bridge)
~ 13 fps
HD Graphics (Ivy Bridge):
4 [X] Medion Akoya E7221-MD98297 Intel Pentium 2020M 2.4GHz
HD Graphics (Ivy Bridge)
fps
177%
HD Graphics 400 (Braswell):
24.8 fps
146%
HD Graphics 400 (Braswell):
10.2 (!) fps
140%
HD Graphics (Ivy Bridge):
5.1 7.4 7.6 8 [X] Medion Akoya E7221-MD98297 Intel Pentium 2020M 2.4GHz
HD Graphics (Ivy Bridge)
~ 7 fps
100%
HD Graphics (Bay Trail):
0.3 fps
100%
HD Graphics (Bay Trail):
15.1 23.6 ~ 19 fps
111%
HD Graphics 400 (Braswell):
21.1 fps
221%
HD Graphics (Ivy Bridge):
42 [X] Medion Akoya E7221-MD98297 Intel Pentium 2020M 2.4GHz
HD Graphics (Ivy Bridge)
fps
100%
HD Graphics (Bay Trail):
5.2 9.7 ~ 7 fps
154%
HD Graphics 400 (Braswell):
10.8 fps
243%
HD Graphics (Ivy Bridge):
17 [X] Medion Akoya E7221-MD98297 Intel Pentium 2020M 2.4GHz
HD Graphics (Ivy Bridge)
fps
HD Graphics 400 (Braswell):
8.7 fps
HD Graphics (Ivy Bridge):
12 [X] Medion Akoya E7221-MD98297 Intel Pentium 2020M 2.4GHz
HD Graphics (Ivy Bridge)
fps
HD Graphics (Ivy Bridge):
6 [X] Medion Akoya E7221-MD98297 Intel Pentium 2020M 2.4GHz
HD Graphics (Ivy Bridge)
fps
100%
HD Graphics (Bay Trail):
10.3 fps
100%
HD Graphics (Bay Trail):
6.2 fps
100%
HD Graphics (Bay Trail):
10.1 fps
129%
HD Graphics (Ivy Bridge):
13 [X] Medion Akoya E7221-MD98297 Intel Pentium 2020M 2.4GHz
HD Graphics (Ivy Bridge)
fps
100%
HD Graphics (Bay Trail):
6 fps
183%
HD Graphics (Ivy Bridge):
11 [X] Medion Akoya E7221-MD98297 Intel Pentium 2020M 2.4GHz
HD Graphics (Ivy Bridge)
fps
HD Graphics (Ivy Bridge):
4 [X] Medion Akoya E7221-MD98297 Intel Pentium 2020M 2.4GHz
HD Graphics (Ivy Bridge)
fps
100%
HD Graphics (Bay Trail):
12.4 fps
100%
HD Graphics (Bay Trail):
7.3 fps
100%
HD Graphics (Bay Trail):
12.5 14.3 ~ 13 fps
146%
HD Graphics (Ivy Bridge):
18 19 ~ 19 fps
100%
HD Graphics (Bay Trail):
9.8 11.2 ~ 11 fps
136%
HD Graphics (Ivy Bridge):
14 15.2 ~ 15 fps
HD Graphics (Ivy Bridge):
18.3 52 69.7 90 [X] Medion Akoya E7221-MD98297 Intel Pentium 2020M 2.4GHz
HD Graphics (Ivy Bridge)
~ 58 fps
HD Graphics (Ivy Bridge):
13.2 32.8 42.7 54 [X] Medion Akoya E7221-MD98297 Intel Pentium 2020M 2.4GHz
HD Graphics (Ivy Bridge)
~ 36 fps
HD Graphics (Ivy Bridge):
8.6 20.9 23 29 [X] Medion Akoya E7221-MD98297 Intel Pentium 2020M 2.4GHz
HD Graphics (Ivy Bridge)
~ 20 fps
HD Graphics (Ivy Bridge):
13 [X] Medion Akoya E7221-MD98297 Intel Pentium 2020M 2.4GHz
HD Graphics (Ivy Bridge)
fps
HD Graphics (Ivy Bridge):
20 25 [X] Medion Akoya E7221-MD98297 Intel Pentium 2020M 2.4GHz
HD Graphics (Ivy Bridge)
~ 23 fps
HD Graphics (Ivy Bridge):
18 20 [X] Medion Akoya E7221-MD98297 Intel Pentium 2020M 2.4GHz
HD Graphics (Ivy Bridge)
~ 19 fps
HD Graphics (Ivy Bridge):
16 [X] Medion Akoya E7221-MD98297 Intel Pentium 2020M 2.4GHz
HD Graphics (Ivy Bridge)
16 ~ 16 fps
HD Graphics (Ivy Bridge):
12 [X] Medion Akoya E7221-MD98297 Intel Pentium 2020M 2.4GHz
HD Graphics (Ivy Bridge)
fps
100%
HD Graphics (Bay Trail):
42 fps
HD Graphics (Ivy Bridge):
30 [X] Medion Akoya E7221-MD98297 Intel Pentium 2020M 2.4GHz
HD Graphics (Ivy Bridge)
fps
HD Graphics (Ivy Bridge):
8 [X] Medion Akoya E7221-MD98297 Intel Pentium 2020M 2.4GHz
HD Graphics (Ivy Bridge)
fps
HD Graphics (Ivy Bridge):
5 [X] Medion Akoya E7221-MD98297 Intel Pentium 2020M 2.4GHz
HD Graphics (Ivy Bridge)
fps
100%
HD Graphics (Bay Trail):
26.1 [X] Intel NUC Kit DN2820FYKH Intel Celeron N2820 2.2GHz
HD Graphics (Bay Trail)
min:
16 fps, max:
38 fps
46.6 ~ 36 fps
29%
HD Graphics 400 (Braswell):
10.5 fps
100%
HD Graphics (Bay Trail):
20 [X] Intel NUC Kit DN2820FYKH Intel Celeron N2820 2.2GHz
HD Graphics (Bay Trail)
min:
13 fps, max:
29 fps
23.9 ~ 22 fps
168%
HD Graphics (Ivy Bridge):
37 [X] Medion Akoya E7221-MD98297 Intel Pentium 2020M 2.4GHz
HD Graphics (Ivy Bridge)
fps
HD Graphics (Ivy Bridge):
20 [X] Medion Akoya E7221-MD98297 Intel Pentium 2020M 2.4GHz
HD Graphics (Ivy Bridge)
fps
HD Graphics (Ivy Bridge):
11 [X] Medion Akoya E7221-MD98297 Intel Pentium 2020M 2.4GHz
HD Graphics (Ivy Bridge)
fps
100%
HD Graphics (Bay Trail):
12.9 13.2 ~ 13 fps
100%
HD Graphics (Bay Trail):
7.5 8.1 ~ 8 fps
100%
HD Graphics (Bay Trail):
28 fps
129%
HD Graphics (Ivy Bridge):
33.3 [X] Wortmann Terra Mobile 1512 Intel Celeron 1037U 1.8GHz
HD Graphics (Ivy Bridge)
38 ~ 36 fps
HD Graphics (Ivy Bridge):
13.2 [X] Wortmann Terra Mobile 1512 Intel Celeron 1037U 1.8GHz
HD Graphics (Ivy Bridge)
13.5 ~ 13 fps
100%
HD Graphics (Bay Trail):
9.2 10.7 14.8 15.6 16.5 [X] Medion Akoya P2214T MD 99430 Intel Celeron N2940 1.8GHz
HD Graphics (Bay Trail)
18.4 19.3 [X] Intel NUC Kit DN2820FYKH Intel Celeron N2820 2.2GHz
HD Graphics (Bay Trail)
min:
14 fps, max:
23 fps
~ 15 fps
122%
HD Graphics 400 (Braswell):
18.3 fps
195%
HD Graphics (Ivy Bridge):
29.2 fps
100%
HD Graphics (Bay Trail):
6 9.5 [X] Medion Akoya P2214T MD 99430 Intel Celeron N2940 1.8GHz
HD Graphics (Bay Trail)
10.3 11.4 12 ~ 10 fps
175%
HD Graphics (Ivy Bridge):
17.5 fps
100%
HD Graphics (Bay Trail):
7.9 [X] Medion Akoya P2214T MD 99430 Intel Celeron N2940 1.8GHz
HD Graphics (Bay Trail)
9.6 ~ 9 fps
162%
HD Graphics (Ivy Bridge):
14.6 fps
100%
HD Graphics (Bay Trail):
5 [X] Medion Akoya P2214T MD 99430 Intel Celeron N2940 1.8GHz
HD Graphics (Bay Trail)
5.9 ~ 5 fps
100%
HD Graphics (Bay Trail):
8.5 12.4 ~ 10 fps
100%
HD Graphics (Bay Trail):
8.1 fps
100%
HD Graphics (Bay Trail):
5.8 fps
100%
HD Graphics (Bay Trail):
2.3 fps
163%
HD Graphics 400 (Braswell):
27.7 fps
153%
HD Graphics (Ivy Bridge):
11.1 23.1 26 26.5 27.6 27.8 28.4 28.5 [X] Wortmann Terra Mobile 1512 Intel Celeron 1037U 1.8GHz
HD Graphics (Ivy Bridge)
37.1 [X] Lenovo B590 (59-362559) Intel Pentium 2020M 2.4GHz
HD Graphics (Ivy Bridge)
~ 26 fps
171%
HD Graphics (Ivy Bridge):
5.5 11.2 11.4 11.5 [X] Wortmann Terra Mobile 1512 Intel Celeron 1037U 1.8GHz
HD Graphics (Ivy Bridge)
11.7 11.9 13 15.4 16.8 [X] Lenovo B590 (59-362559) Intel Pentium 2020M 2.4GHz
HD Graphics (Ivy Bridge)
~ 12 fps
100%
HD Graphics (Bay Trail):
1.1 fps
100%
HD Graphics (Bay Trail):
11 11.8 ~ 11 fps
180%
HD Graphics 400 (Braswell):
19.8 fps
145%
HD Graphics (Ivy Bridge):
12.7 16.9 17.4 18.3 [X] Wortmann Terra Mobile 1512 Intel Celeron 1037U 1.8GHz
HD Graphics (Ivy Bridge)
~ 16 fps
100%
HD Graphics (Bay Trail):
10 fps
95%
HD Graphics 400 (Braswell):
9.5 fps
90%
HD Graphics (Ivy Bridge):
7.3 9.4 9.6 [X] Wortmann Terra Mobile 1512 Intel Celeron 1037U 1.8GHz
HD Graphics (Ivy Bridge)
~ 9 fps
HD Graphics (Ivy Bridge):
4.6 fps
100%
HD Graphics (Bay Trail):
8 fps
100%
HD Graphics (Bay Trail):
4.8 fps
HD Graphics (Ivy Bridge):
55.8 [X] Lenovo B590 (59-362559) Intel Pentium 2020M 2.4GHz
HD Graphics (Ivy Bridge)
fps
HD Graphics (Ivy Bridge):
21.2 [X] Lenovo B590 (59-362559) Intel Pentium 2020M 2.4GHz
HD Graphics (Ivy Bridge)
fps
100%
HD Graphics (Bay Trail):
19.7 fps
93%
HD Graphics 400 (Braswell):
18.4 fps
129%
HD Graphics (Ivy Bridge):
25.4 fps
HD Graphics 400 (Braswell):
11.3 fps
HD Graphics (Ivy Bridge):
11.4 fps
100%
HD Graphics (Bay Trail):
24.1 36.9 ~ 31 fps
95%
HD Graphics 400 (Braswell):
29.4 fps
134%
HD Graphics (Ivy Bridge):
41.4 fps
100%
HD Graphics (Bay Trail):
12.9 13.3 ~ 13 fps
110%
HD Graphics 400 (Braswell):
14.3 fps
127%
HD Graphics (Ivy Bridge):
16.5 fps
HD Graphics 400 (Braswell):
12.5 fps
100%
HD Graphics (Bay Trail):
9.3 fps
100%
HD Graphics (Bay Trail):
5 10.5 [X] Asus Transformer Book T200TA PL Intel Atom Z3775 1.5GHz
HD Graphics (Bay Trail)
~ 8 fps
100%
HD Graphics (Bay Trail):
5.6 [X] Asus Transformer Book T200TA PL Intel Atom Z3775 1.5GHz
HD Graphics (Bay Trail)
fps
100%
HD Graphics (Bay Trail):
3.7 [X] Asus Transformer Book T200TA PL Intel Atom Z3775 1.5GHz
HD Graphics (Bay Trail)
fps
100%
HD Graphics (Bay Trail):
32 48 49 53.3 ~ 46 fps
75%
HD Graphics 400 (Braswell):
34.5 fps
100%
HD Graphics (Bay Trail):
6 9 9 ~ 8 fps
110%
HD Graphics 400 (Braswell):
8.8 fps
100%
HD Graphics (Bay Trail):
3 fps
187%
HD Graphics 400 (Braswell):
5.6 fps
100%
HD Graphics (Bay Trail):
12 [X] Asus Transformer Book T200TA PL Intel Atom Z3775 1.5GHz
HD Graphics (Bay Trail)
fps
100%
HD Graphics (Bay Trail):
9 [X] Asus Transformer Book T200TA PL Intel Atom Z3775 1.5GHz
HD Graphics (Bay Trail)
fps
100%
HD Graphics (Bay Trail):
12.8 fps
100%
HD Graphics (Bay Trail):
9 fps
100%
HD Graphics (Bay Trail):
42.9 69.8 69.8 71.6 72 72.7 75.1 75.5 76 [X] Medion Akoya E1232T-MD99410 Intel Celeron N2807 1.6GHz
HD Graphics (Bay Trail)
76.7 77.1 80.9 83.1 83.9 84.3 [X] Captiva PAD 10.1 Windows Intel Atom Z3735D 1.3GHz
HD Graphics (Bay Trail)
84.8 [X] ODYS Winpad V10 Intel Atom Z3735F 1.3GHz
HD Graphics (Bay Trail)
85.6 [X] cmx WinTek 101-1016 Intel Atom Z3735F 1.3GHz
HD Graphics (Bay Trail)
86.9 90.2 ~ 77 fps
96%
HD Graphics 400 (Braswell):
60 88.5 [X] Medion Akoya E2228T-MD61250 Intel Atom x5-Z8350 1.4GHz
HD Graphics 400 (Braswell)
~ 74 fps
117%
HD Graphics (Ivy Bridge):
90 fps
100%
HD Graphics (Bay Trail):
10.3 14 [X] Medion Akoya E1232T-MD99410 Intel Celeron N2807 1.6GHz
HD Graphics (Bay Trail)
17.7 18 18.1 18.1 18.7 18.8 [X] Captiva PAD 10.1 Windows Intel Atom Z3735D 1.3GHz
HD Graphics (Bay Trail)
19.3 19.4 19.4 19.8 19.8 20.5 20.5 [X] cmx WinTek 101-1016 Intel Atom Z3735F 1.3GHz
HD Graphics (Bay Trail)
20.6 21 [X] ODYS Winpad V10 Intel Atom Z3735F 1.3GHz
HD Graphics (Bay Trail)
21.5 23.6 ~ 19 fps
126%
HD Graphics 400 (Braswell):
22.6 [X] Medion Akoya E2228T-MD61250 Intel Atom x5-Z8350 1.4GHz
HD Graphics 400 (Braswell)
25.2 ~ 24 fps
109%
HD Graphics (Ivy Bridge):
20.7 fps
100%
HD Graphics (Bay Trail):
6.4 [X] Captiva PAD 10.1 Windows Intel Atom Z3735D 1.3GHz
HD Graphics (Bay Trail)
7.7 ~ 7 fps
141%
HD Graphics 400 (Braswell):
9.9 [X] Medion Akoya E2228T-MD61250 Intel Atom x5-Z8350 1.4GHz
HD Graphics 400 (Braswell)
fps
100%
HD Graphics (Bay Trail):
18.9 19 ~ 19 fps
100%
HD Graphics (Bay Trail):
7.6 8.7 ~ 8 fps
100%
HD Graphics (Bay Trail):
33 33 35 38 [X] MSI S100 Intel Atom Z3740D 1.3GHz
HD Graphics (Bay Trail)
44 46.2 47 48 49 49 [X] Intel NUC Kit DN2820FYKH Intel Celeron N2820 2.2GHz
HD Graphics (Bay Trail)
min:
39 fps, max:
59 fps
50 [X] Baytrail Reference Tablet Intel Atom Z3770 1.5GHz
HD Graphics (Bay Trail)
min:
36 fps
52 ~ 44 fps
178%
HD Graphics (Ivy Bridge):
78.3 fps
100%
HD Graphics (Bay Trail):
9.6 [X] Intel NUC Kit DN2820FYKH Intel Celeron N2820 2.2GHz
HD Graphics (Bay Trail)
min:
3 fps, max:
13 fps
11.5 [X] Baytrail Reference Tablet Intel Atom Z3770 1.5GHz
HD Graphics (Bay Trail)
min:
8 fps
20 22 23 25.3 26 26 28 [X] MSI S100 Intel Atom Z3740D 1.3GHz
HD Graphics (Bay Trail)
34 ~ 23 fps
123%
HD Graphics (Ivy Bridge):
28.3 fps
100%
HD Graphics (Bay Trail):
12 12 13.5 ~ 13 fps
100%
HD Graphics (Bay Trail):
5.6 7 ~ 6 fps
100%
HD Graphics (Bay Trail):
190 [X] Baytrail Reference Tablet Intel Atom Z3770 1.5GHz
HD Graphics (Bay Trail)
fps
Average Gaming Intel HD Graphics (Bay Trail) → 100% Average Gaming 30-70 fps → 100%
Average Gaming Intel HD Graphics 400 (Braswell) → 122% Average Gaming 30-70 fps → 106%
Average Gaming Intel HD Graphics (Ivy Bridge) → 154% Average Gaming 30-70 fps → 182%
For more games that might be playable and a list of all games and graphics cards visit our Gaming List
v1.26
log 25. 19:27:19
#0 checking url part for id 4922 +0s ... 0s
#1 checking url part for id 7349 +0s ... 0s
#2 checking url part for id 3563 +0s ... 0s
#3 not redirecting to Ajax server +0s ... 0s
#4 did not recreate cache, as it is less than 5 days old! Created at Thu, 25 Apr 2024 05:40:10 +0200 +0.001s ... 0.001s
#5 composed specs +0.182s ... 0.183s
#6 did output specs +0s ... 0.183s
#7 start showIntegratedCPUs +0s ... 0.183s
#8 getting avg benchmarks for device 4922 +0.071s ... 0.254s
#9 got single benchmarks 4922 +0.274s ... 0.528s
#10 getting avg benchmarks for device 7349 +0.012s ... 0.54s
#11 got single benchmarks 7349 +0.085s ... 0.625s
#12 getting avg benchmarks for device 3563 +0.015s ... 0.64s
#13 got single benchmarks 3563 +0.046s ... 0.685s
#14 got avg benchmarks for devices +0s ... 0.685s
#15 No cached benchmark found, getting uncached values +0.414s ... 1.099s
#16 min, max, avg, median took s +0.078s ... 1.177s
#17 before gaming benchmark output +0s ... 1.177s
#18 Got 645 rows for game benchmarks. +0.107s ... 1.284s
#19 composed SQL query for gamebenchmarks +0s ... 1.284s
#20 got data and put it in $dataArray +0.061s ... 1.346s
#21 benchmarks composed for output. +0.205s ... 1.551s
#22 calculated avg scores. +0s ... 1.551s
#23 return log +0.004s ... 1.555s
Please share our article, every link counts!
Redaktion, 2017-09- 8 (Update: 2023-07- 1)
 Deutsch
 English
 Español
 Français
 Italiano
 Nederlands
 Polski
 Português
 Русский
 Türkçe
 Svenska
 Chinese
 Magyar