Intel HD Graphics (Bay Trail) vs Intel HD Graphics 2500 vs Intel HD Graphics 5500
Intel HD Graphics (Bay Trail) ► remove from comparison
The Intel HD Graphics (Bay Trail) is a low-end integrated Bay Trail graphics card found in certain Atom models (Z3770 ), nettops (J2850 ) and notebook SoCs (N3510 ). It supports DirectX 11 and is based on the Ivy Bridge GPU. Clock rates and shader cores, however, are considerably lower.
Compared to Ivy Bridge, which offers either 6 or 16 Execution Units, the HD Graphics (Bay Trail) comes with only 4 EUs. The core clock is significantly lower as well. Depending on the specific model, the maximum Turbo Boost is 896 MHz or less and the memory controller can support DDR3(L), DDR3L-RS or LPDDR3 in single- or dual-channel operation.
The fastest notebook models equipped with this GPU nearly match the performance of the HD Graphics (Sandy Bridge) and the AMD Radeon HD 6310 . Therefore, older and less demanding Windows games like World of Warcraft or Half-Life 2 can be played fluently in very low settings. Performance is not sufficient for most modern titles.
Compared to competing ARM SoCs, Bay Trail outperforms the Adreno 320 (which can be found in different Qualcomm SoCs like the Snapdragon 600 ) and offers a performance similar to the Tegra 4 GPU. That is enough power to run even the most demanding Android games smoothly in very high resolutions as of 2013.
The integrated video decoder supports all popular codecs such as MPEG2, H.264, VC1, VP8 and MVC and is suitable for resolutions up to 4K up to 100 Mbit/s. The user can connect up to two displays via HDMI 1.4 (max. 1920 x 1080) or DisplayPort 1.2 (max. 2560 x 1600). Another new feature is the support for Wireless Display and Quick Sync, Intel's fast and power efficient H-264 hardware encoder. Some of these features are not available on all models.
Depending on the model, the power consumption of the entire SoC is somewhere between 2 and 10 W. The most efficient versions are therefore suitable for passively cooled tablets, whereas faster variants are used in larger subnotebooks with active cooling.
Intel HD Graphics 2500 ► remove from comparison
The Intel HD Graphics 2500 (or Ivy Bridge GT1) is an integrated graphics card in the Ivy Bridge codenamed desktop processors. It is the successor the the Intel HD Graphics 2000 in the Sandy Bridge CPUs and performs between the old HD 2000 and 3000 GPU (see benchmarks below). Usually it is used in the cheaper desktop Ivy bridge CPUs. The mobile version is simply called Intel HD Graphics and integrated in the Pentium and Celeron line.
Compared to the faster HD Graphics 4000 , the 2500 one features less Execution Units (6 versus 16) and only one texture sampler. Therefore, the performance is clearly worse and only suited for low demanding gaming. Intel states a 10 to 15% higher performance compared to the old Sandy Bridge based HD Graphics 2000. Therefore, only older casual games with low requirements are playable with the HD 2500.
A speciality of the Ivy Bridge GPUs is that 4x MSAA is supported in hardware now. However, 2x is only supported through software. The algorithm to support 2x is going through the 4x pipeline with a software algorithm, so performance is similar to 4x MSAA.
The integrated video decoder called Multi Format Codec Engine (MFX) was also improved and should allow even simultaneus 4K video decoding. DXVAChecker lists MPEG2, VC1, WMV9, and H264 as supported codecs. QuickSync for fast transcoding of videos was also optimized for higher performance and better image quality.
Another new feature is the support for up to 3 independent displays as AMD offers with theirs Eyefinity support (up to 6 displays).
Due to the 22nm 3D Tri-Gate production process, the power consumption is relatively low (the development was focused on performance per Watt).
Intel HD Graphics 5500 ► remove from comparison
The Intel HD Graphics 5500 (GT2) is an integrated Broadwell graphics card revealed in Q1 2015. It can be found in several ULV SoCs (15 W TDP) such as the Core i5-5200U or i7-5600U . While Core i5 and Core i7 chips feature 24 EUs, the Core i3 version offers just 23 EUs. Depending on the specific CPU, the maximum GPU frequency varies between 850 and 950 MHz.
Architecture and Features
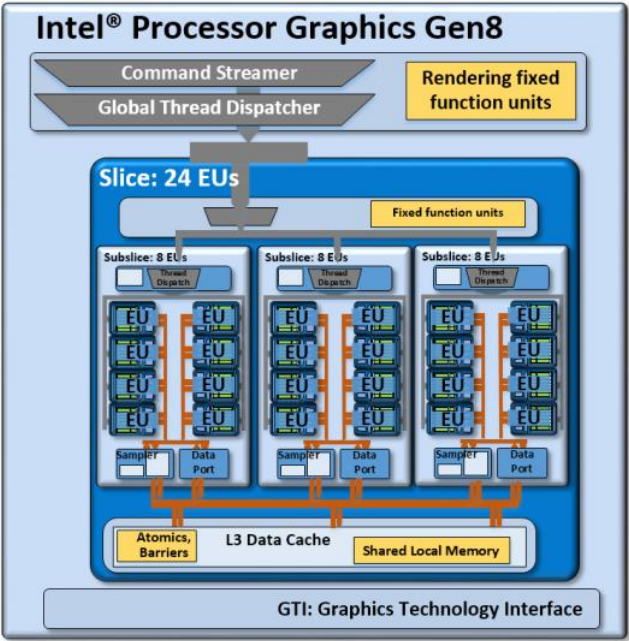
Broadwell features a GPU based on the Intel Gen8 architecture, which has been optimized in various aspects compared to the previous Gen7.5 (Haswell). Inter alia, the shader arrays called "subslice" have been reorganized and now offer 8 Execution Units (EUs) each. Three subslices form a "slice" for a total of 24 EUs. Combined with other improvements such as larger L1 caches and an optimized frontend, the integrated GPU has become faster and more efficient than its predecessor.
The HD Graphics 5500 represents the mid-range version of the Broadwell GPU family and consists of one slice with 24 EUs. Beyond that, there is also a low-end variant (GT1, 12 EUs) as well as higher-end models (GT3/GT3e + eDRAM, 48 EUs).
All Broadwell GPUs support OpenCL 2.0 and DirectX 12 (FL 11_1) . The video engine can now decode H.265 using both fixed function hardware as well as available GPU shaders. Up to three displays can be connected via DP 1.2/eDP 1.3 (max. 3840 x 2160 @ 60 Hz) or HDMI 1.4a (max. 3840 x 2160 @ 24 Hz). HDMI 2.0, however, is not supported.
Performance
Depending on the specific CPU, the maximum GPU frequency varies between 850 and 950 MHz. Due to the low TDP, however, the average clock in 3D applications will be somewhat lower.
Equipped with fast dual-channel memory, the HD Graphics 5500 outperforms the HD Graphics 4400 (Haswell, 20 EUs) by 20 - 25 percent and also beats the HD Graphics 5000 (Haswell, 40 EUs). However, even a low-end dedicated GeForce 820M ist about 10 - 30 percent faster than the HD 5500. Games as of 2014/2015 will usually run fluently only at (very) low settings.
Power Consumption
Utilizing a new 14 nm process, the Broadwell ULV chips are specified at just 15 W TDP and therefore suited for thin ultrabooks. The TDP is flexible and can be further reduced (7.5 or 10 W), which has a significant impact on performance.
Intel HD Graphics (Bay Trail) Intel HD Graphics 2500 Intel HD Graphics 5500 HD Graphics Series Codename Bay Trail Ivy Bridge GT1 Broadwell GT2 Architecture Gen. 7 Ivy Bridge Gen. 7 Ivy Bridge Gen. 8 Broadwell Pipelines 4 - unified 6 - unified 24 - unified Core Speed 311 - 896 (Boost) MHz 650 - 1150 (Boost) MHz 300 - 950 (Boost) MHz Memory Bus Width 32/64/128 Bit 64/128 Bit 64/128 Bit Shared Memory yes yes yes API DirectX 11, Shader 5.0, OpenGL 4.0, ES 3.0 DirectX 11.0, Shader 5.0 DirectX 12 (FL 11_1), OpenGL 4.3 technology 22 nm 22 nm 14 nm Date of Announcement 11.09.2013 01.04.2012 05.01.2015 Notebook Size large Transistors 1.3 Billion Features Quick Sync
CPU in HD Graphics (Bay Trail) GPU Base Speed GPU Boost / Turbo Intel Pentium N3540 4 x 2160 MHz, 7.5 W 313 MHz 896 MHz Intel Pentium J2900 4 x 2410 MHz, 10 W 688 MHz 896 MHz Intel Pentium N3530 4 x 2160 MHz, 7.5 W 313 MHz 896 MHz » show 43 more Intel Pentium J2850 4 x 2400 MHz, 10 W 688 MHz 792 MHz Intel Pentium N3520 4 x 2167 MHz, 7.5 W 313 MHz 854 MHz Intel Celeron J1900 4 x 2000 MHz, 10 W 688 MHz 854 MHz Intel Atom Z3795 4 x 1590 MHz, <4 W 311 MHz 778 MHz Intel Atom Z3785 4 x 1490 MHz, <4 W 313 MHz 833 MHz Intel Atom Z3775 4 x 1460 MHz, <4 W 311 MHz 778 MHz Intel Atom Z3775D 4 x 1490 MHz, <4 W 311 MHz 792 MHz Intel Atom Z3770 4 x 1460 MHz, <4 W 311 MHz 667 MHz Intel Atom Z3770D 4 x 1500 MHz, 4 W 313 MHz 688 MHz Intel Celeron N2940 4 x 1830 MHz, 7.5 W 313 MHz 854 MHz Intel Celeron N2930 4 x 1830 MHz, 7.5 W 313 MHz 854 MHz Intel Celeron J1850 4 x 2000 MHz, 10 W 688 MHz 792 MHz Intel Pentium N3510 4 x 2000 MHz, 7.5 W 313 MHz 750 MHz Intel Celeron N2920 4 x 1860 MHz, 7.5 W 313 MHz 854 MHz Intel Atom E3845 4 x 1910 MHz, 10 W 542 MHz 792 MHz Intel Atom Z3736F 4 x 1330 MHz, 4 W 313 MHz 646 MHz Intel Atom Z3736G 4 x 1330 MHz, <4 W 313 MHz 646 MHz Intel Atom Z3745 4 x 1330 MHz, <4 W 311 MHz 778 MHz Intel Atom Z3745D 4 x 1330 MHz, <4 W 311 MHz 792 MHz Intel Atom Z3740 4 x 1330 MHz, <4 W 311 MHz 667 MHz Intel Atom Z3740D 4 x 1330 MHz, <4 W 313 MHz 688 MHz Intel Atom Z3735D 4 x 1330 MHz, <4 W 311 MHz 646 MHz Intel Atom Z3735E 4 x 1330 MHz, <4 W 311 MHz 646 MHz Intel Atom Z3735F 4 x 1330 MHz, <4 W 311 MHz 646 MHz Intel Atom Z3735G 4 x 1330 MHz, <4 W 311 MHz 646 MHz Intel Celeron J1800 2 x 2410 MHz, 10 W 688 MHz 792 MHz Intel Celeron N2840 2 x 2160 MHz, 7.5 W 313 MHz 792 MHz Intel Celeron J1750 2 x 2410 MHz, 10 W 688 MHz 750 MHz Intel Celeron N2910 4 x 1600 MHz, 7.5 W 313 MHz 756 MHz Intel Celeron N2830 2 x 2160 MHz, 7.5 W 313 MHz 750 MHz Intel Celeron N2820 2 x 2170 MHz, 7.5 W 313 MHz 756 MHz Intel Celeron N2815 2 x 1860 MHz, 7.5 W 313 MHz 756 MHz Intel Celeron N2810 2 x 2000 MHz, 7.5 W 313 MHz 756 MHz Intel Atom Z3680 2 x 1330 MHz, 4 W 311 MHz 667 MHz Intel Atom Z3680D 2 x 1330 MHz, 4 W 313 MHz 688 MHz Intel Celeron N2808 2 x 1580 MHz, 4.3 W 313 MHz 792 MHz Intel Celeron N2807 2 x 1580 MHz, 4.3 W 313 MHz 750 MHz Intel Celeron N2806 2 x 1580 MHz, 4.5 W 313 MHz 756 MHz Intel Atom E3827 2 x 1750 MHz, 8 W 542 MHz 792 MHz Intel Atom E3826 2 x 1460 MHz, 7 W 533 MHz 667 MHz Intel Celeron N2805 2 x 1460 MHz, 4.3 W 313 MHz 667 MHz Intel Atom E3825 2 x 1330 MHz, 6 W ? MHz 533 MHz Intel Atom E3815 1 x 1460 MHz, 5 W ? MHz 400 MHz min. - max. 311 - ? MHz 400 - 896 MHz
CPU in HD Graphics 2500 GPU Base Speed GPU Boost / Turbo Intel Core i5-3550 4 x 3300 MHz, 77 W 650 MHz 1150 MHz Intel Core i5-3470 4 x 3200 MHz, 77 W 650 MHz 1100 MHz Intel Core i3-3220 2 x 3300 MHz, 55 W 650 MHz 1050 MHz min. - max. 311 - ? MHz 400 - 1150 MHz
CPU in HD Graphics 5500 GPU Base Speed GPU Boost / Turbo Intel Core i7-5600U 2 x 2600 MHz, 15 W 300 MHz 950 MHz Intel Core i7-5500U 2 x 2400 MHz, 15 W 300 MHz 950 MHz Intel Core i5-5300U 2 x 2300 MHz, 15 W 300 MHz 900 MHz » show 5 more Intel Core i5-5200U 2 x 2200 MHz, 15 W 300 MHz 900 MHz Intel Core i3-5020U 2 x 2200 MHz, 15 W 300 MHz 900 MHz Intel Core i3-5010U 2 x 2100 MHz, 15 W 300 MHz 900 MHz Intel Core i3-5015U 2 x 2100 MHz, 15 W 300 MHz 850 MHz Intel Core i3-5005U 2 x 2000 MHz, 15 W 300 MHz 850 MHz min. - max. 300 - ? MHz 400 - 1150 MHz
Benchmarks Performance Rating - 3DMark 11 + Fire Strike + Time Spy - HD Graphics (Bay Trail)
0.1 pt (0%)
Intel HD Graphics (Bay Trail)
...
max:
Performance Rating - 3DMark 11 + Fire Strike + Time Spy - HD Graphics 2500
0.1 pt (0%)
...
...
max:
Performance Rating - 3DMark 11 + Fire Strike + Time Spy - HD Graphics 5500
0.3 pt (1%)
...
...
max:
3DMark - 3DMark Time Spy Score
289 Points (1%)
3DMark - 3DMark Time Spy Graphics
255 Points (1%)
3DMark - 3DMark Ice Storm Unlimited Graphics
min: 11835 avg: 14513 median: 14748.5 (2%) max: 17613 Points
min: 43391 avg: 58343 median: 58776 (7%) max: 68877 Points
3DMark - 3DMark Ice Storm Extreme Graphics
min: 4751 avg: 7342 median: 7498 (1%) max: 9234 Points
min: 27084 avg: 33172 median: 31022.5 (4%) max: 40670 Points
3DMark - 3DMark Cloud Gate Score
min: 354 avg: 1182 median: 1188 (1%) max: 1703 Points
min: 1906 avg: 2659 median: 2817 (3%) max: 3095 Points
min: 3351 avg: 4777 median: 4790.5 (5%) max: 6106 Points
3DMark - 3DMark Cloud Gate Graphics
min: 362 avg: 1230 median: 1228.5 (0%) max: 1670 Points
min: 2301 avg: 2584 median: 2604.5 (1%) max: 2825 Points
min: 4571 avg: 5864 median: 5544 (1%) max: 7789 Points
3DMark - 3DMark Fire Strike Standard Score
min: 83 avg: 185 median: 147 (0%) max: 495 Points
min: 257 avg: 293.3 median: 294.5 (1%) max: 327 Points
min: 500 avg: 648 median: 634.5 (1%) max: 868 Points
3DMark - 3DMark Fire Strike Standard Graphics
min: 90 avg: 149.1 median: 149 (0%) max: 200 Points
min: 289 avg: 319.5 median: 318 (0%) max: 353 Points
min: 535 avg: 694 median: 663 (1%) max: 927 Points
3DMark - 3DMark Ice Storm Graphics
min: 5056 avg: 15391 median: 16047 (2%) max: 21351 Points
min: 21978 avg: 23693 median: 24058 (3%) max: 24676 Points
min: 33288 avg: 50089 median: 48637 (6%) max: 70409 Points
3DMark 11 - 3DM11 Performance Score
min: 143 avg: 222.6 median: 216 (0%) max: 280 Points
min: 374 avg: 419 median: 430 (1%) max: 449 Points
min: 758 avg: 1088 median: 1079.5 (1%) max: 1434 Points
3DMark 11 - 3DM11 Performance GPU
min: 122 avg: 192.1 median: 186.5 (0%) max: 237 Points
min: 321 avg: 349 median: 350.5 (0%) max: 374 Points
min: 667 avg: 979 median: 979 (1%) max: 1265 Points
3DMark Vantage + Intel HD Graphics (Bay Trail) 3DMark Vantage - 3DM Vant. Perf. total
min: 507 avg: 666 median: 637 (0%) max: 846 Points
3DM Vant. Perf. total + Intel HD Graphics 2500
min: 1375 avg: 1849 median: 1930.5 (1%) max: 2068 Points
3DM Vant. Perf. total + Intel HD Graphics 5500
min: 3574 avg: 4501 median: 4798 (1%) max: 5124 Points
3DM Vant. Perf. GPU no PhysX + Intel HD Graphics (Bay Trail) 3DMark Vantage - 3DM Vant. Perf. GPU no PhysX
min: 395 avg: 512 median: 503 (0%) max: 667 Points
3DM Vant. Perf. GPU no PhysX + Intel HD Graphics 2500
min: 1115 avg: 1369 median: 1400.5 (1%) max: 1561 Points
3DM Vant. Perf. GPU no PhysX + Intel HD Graphics 5500
min: 3057 avg: 3804 median: 3987 (2%) max: 4351 Points
3DMark 2001SE - 3DMark 2001 - Standard
7727 Points (8%)
20814 Points (22%)
Model CPU GPU RAM Value Intel Core i5-3470, Intel DZ77GA-70K Desktop, DDR3-1600 3470 HD Graphics 2500 1100 MHz8 GB 20814
3DMark 03 - 3DMark 03 - Standard
min: 4226 avg: 4997 median: 5220 (3%) max: 5323 Points
10138 Points (5%)
Model CPU GPU RAM Value Intel Core i5-3470, Intel DZ77GA-70K Desktop, DDR3-1600 3470 HD Graphics 2500 1100 MHz8 GB 10138
3DMark 05 - 3DMark 05 - Standard
min: 2666 avg: 3195 median: 3331 (4%) max: 3445 Points
min: 6341 avg: 6627 median: 6627 (7%) max: 6913 Points
Model CPU GPU RAM Value Intel Core i3-3220, Intel DZ77GA-70K Desktop, DDR3-1600 3220 HD Graphics 2500 1050 MHz8 GB 6341 Intel Core i5-3470, Intel DZ77GA-70K Desktop, DDR3-1600 3470 HD Graphics 2500 1100 MHz8 GB 6913
3DMark 06 3DMark 06 - Score Unknown Settings + Intel HD Graphics (Bay Trail)
2108 Points (3%)
3DMark 06 - Standard 1280x1024 + Intel HD Graphics (Bay Trail)
min: 814 avg: 1785 median: 1866 (2%) max: 2151 Points
3DMark 06 - Standard 1280x1024 + Intel HD Graphics 2500
min: 3300 avg: 3933 median: 3816 (5%) max: 4442 Points
3DMark 06 - Standard 1280x1024 + Intel HD Graphics 5500
min: 5458 avg: 6875 median: 6998 (9%) max: 7950 Points
3DMark 06 - Standard 1280x800 + Intel HD Graphics (Bay Trail)
2087 Points (3%)
3DMark 06 - Standard 1280x800 + Intel HD Graphics 5500
7725 Points (10%)
Unigine Heaven 3.0 - Unigine Heaven 3.0 DX 11
3.6 fps (1%)
9.3 fps (3%)
Unigine Heaven 3.0 - Unigine Heaven 3.0 OpenGL
9.8 fps (4%)
Unigine Heaven 2.1 - Heaven 2.1 high
min: 2.4 avg: 2.8 median: 2.8 (1%) max: 3.4 fps
min: 12.4 avg: 15.5 median: 15.7 (3%) max: 17.9 fps
SPECviewperf 11 + Intel HD Graphics 2500 SPECviewperf 11 - specvp11 snx-01
1.6 fps (1%)
Model CPU GPU RAM Value Intel Core i5-3470, Intel DZ77GA-70K Desktop, DDR3-1600 3470 HD Graphics 2500 1100 MHz8 GB 1.61
specvp11 snx-01 + Intel HD Graphics 5500
min: 1.89 avg: 2.1 median: 2 (1%) max: 2.29 fps
specvp11 tcvis-02 + Intel HD Graphics 2500 SPECviewperf 11 - specvp11 tcvis-02
2.7 fps (2%)
Model CPU GPU RAM Value Intel Core i5-3470, Intel DZ77GA-70K Desktop, DDR3-1600 3470 HD Graphics 2500 1100 MHz8 GB 2.66
specvp11 tcvis-02 + Intel HD Graphics 5500
min: 2.42 avg: 2.6 median: 2.6 (1%) max: 2.9 fps
specvp11 sw-02 + Intel HD Graphics 2500 SPECviewperf 11 - specvp11 sw-02
6.8 fps (5%)
Model CPU GPU RAM Value Intel Core i5-3470, Intel DZ77GA-70K Desktop, DDR3-1600 3470 HD Graphics 2500 1100 MHz8 GB 6.76
specvp11 sw-02 + Intel HD Graphics 5500
min: 11.6 avg: 13 median: 12.5 (9%) max: 14.7 fps
specvp11 proe-05 + Intel HD Graphics 2500 SPECviewperf 11 - specvp11 proe-05
1.9 fps (2%)
Model CPU GPU RAM Value Intel Core i5-3470, Intel DZ77GA-70K Desktop, DDR3-1600 3470 HD Graphics 2500 1100 MHz8 GB 1.86
specvp11 proe-05 + Intel HD Graphics 5500
min: 2.14 avg: 2.3 median: 2.3 (3%) max: 2.53 fps
specvp11 maya-03 + Intel HD Graphics 2500 SPECviewperf 11 - specvp11 maya-03
12.9 fps (10%)
Model CPU GPU RAM Value Intel Core i5-3470, Intel DZ77GA-70K Desktop, DDR3-1600 3470 HD Graphics 2500 1100 MHz8 GB 12.91
specvp11 maya-03 + Intel HD Graphics 5500
min: 8.07 avg: 13.6 median: 14.7 (11%) max: 18.15 fps
specvp11 lightwave-01 + Intel HD Graphics 2500 SPECviewperf 11 - specvp11 lightwave-01
15.6 fps (17%)
Model CPU GPU RAM Value Intel Core i5-3470, Intel DZ77GA-70K Desktop, DDR3-1600 3470 HD Graphics 2500 1100 MHz8 GB 15.59
specvp11 lightwave-01 + Intel HD Graphics 5500
min: 14.7 avg: 18.4 median: 18.6 (20%) max: 21.44 fps
specvp11 ensight-04 + Intel HD Graphics 2500 SPECviewperf 11 - specvp11 ensight-04
2.4 fps (1%)
Model CPU GPU RAM Value Intel Core i5-3470, Intel DZ77GA-70K Desktop, DDR3-1600 3470 HD Graphics 2500 1100 MHz8 GB 2.4
specvp11 ensight-04 + Intel HD Graphics 5500
min: 1.67 avg: 2.5 median: 2.6 (1%) max: 2.88 fps
specvp11 catia-03 + Intel HD Graphics 2500 SPECviewperf 11 - specvp11 catia-03
0 fps (0%)
Model CPU GPU RAM Value Intel Core i5-3470, Intel DZ77GA-70K Desktop, DDR3-1600 3470 HD Graphics 2500 1100 MHz8 GB 0
SPECviewperf 12 + Intel HD Graphics 5500 SPECviewperf 12 - specvp12 sw-03
min: 2.12 avg: 9.9 median: 12.3 (3%) max: 15.6 fps
specvp12 snx-02 + Intel HD Graphics 5500 SPECviewperf 12 - specvp12 snx-02
min: 1.37 avg: 2.3 median: 2.4 (0%) max: 2.7 fps
specvp12 showcase-01 + Intel HD Graphics 5500 SPECviewperf 12 - specvp12 showcase-01
min: 2.63 avg: 7 median: 4.2 (1%) max: 14.14 fps
specvp12 mediacal-01 + Intel HD Graphics 5500 SPECviewperf 12 - specvp12 mediacal-01
min: 0.95 avg: 1.4 median: 1 (0%) max: 2.36 fps
specvp12 maya-04 + Intel HD Graphics 5500 SPECviewperf 12 - specvp12 maya-04
min: 2.49 avg: 6.3 median: 2.6 (1%) max: 12.31 fps
specvp12 energy-01 + Intel HD Graphics 5500 SPECviewperf 12 - specvp12 energy-01
min: 0.06 avg: 6.9 median: 0.1 (0%) max: 17.35 fps
specvp12 creo-01 + Intel HD Graphics 5500 SPECviewperf 12 - specvp12 creo-01
min: 2.49 avg: 5.7 median: 6.5 (3%) max: 8.99 fps
specvp12 catia-04 + Intel HD Graphics 5500 SPECviewperf 12 - specvp12 catia-04
min: 6.86 avg: 7.7 median: 7.1 (1%) max: 9.69 fps
Cinebench R10 Cinebench R10 Shading (32bit) + Intel HD Graphics (Bay Trail) Cinebench R10 - Cinebench R10 Shading (32bit)
min: 898 avg: 2014 median: 1991.5 (1%) max: 2889 Points
Cinebench R10 Shading (32bit) + Intel HD Graphics 2500
min: 3409 avg: 5543 median: 6037 (4%) max: 6687 Points
Cinebench R10 Shading (32bit) + Intel HD Graphics 5500
min: 3045 avg: 5408 median: 5270.5 (4%) max: 8571 Points
Cinebench R11.5 Cinebench R11.5 OpenGL 64 Bit + Intel HD Graphics (Bay Trail) Cinebench R11.5 - Cinebench R11.5 OpenGL 64 Bit
min: 0.37 avg: 6.2 median: 6.4 (2%) max: 7.69 fps
Cinebench R11.5 OpenGL 64 Bit + Intel HD Graphics 2500
min: 9.09 avg: 10.6 median: 10.8 (4%) max: 11.98 fps
Cinebench R11.5 OpenGL 64 Bit + Intel HD Graphics 5500
min: 13.54 avg: 21.2 median: 20.3 (7%) max: 35.03 fps
Cinebench R15 + Intel HD Graphics (Bay Trail) Cinebench R15 - Cinebench R15 OpenGL 64 Bit
min: 2.88 avg: 5 median: 5.5 (0%) max: 6.55 fps
Cinebench R15 OpenGL 64 Bit + Intel HD Graphics 5500
min: 16.42 avg: 26.3 median: 25.4 (1%) max: 35.04 fps
Cinebench R15 OpenGL Ref. Match 64 Bit + Intel HD Graphics (Bay Trail) Cinebench R15 - Cinebench R15 OpenGL Ref. Match 64 Bit
min: 63 avg: 96.1 median: 97.8 (98%) max: 97.8 %
Cinebench R15 OpenGL Ref. Match 64 Bit + Intel HD Graphics 5500
min: 98 avg: 98 median: 98 (98%) max: 99.6 %
GFXBench 3.1 - GFXBench Manhattan ES 3.1 Offscreen
5.2 fps (0%)
GFXBench 3.0 - GFXBench 3.0 Manhattan Offscreen
min: 6 avg: 9.7 median: 8.8 (1%) max: 16 fps
min: 26.9 avg: 32.4 median: 30.6 (2%) max: 44.6 fps
GFXBench (DX / GLBenchmark) 2.7 + Intel HD Graphics (Bay Trail) GFXBench (DX / GLBenchmark) 2.7 - GFXBench T-Rex HD Offscreen C24Z16
min: 6 avg: 15.7 median: 16 (0%) max: 20.2 fps
GFXBench T-Rex HD Offscreen C24Z16 + Intel HD Graphics 5500
min: 60.9 avg: 70.9 median: 70.9 (1%) max: 87.6 fps
Basemark ES 2.0 - Basemark ES 2.0
min: 45.08 avg: 49.1 median: 49.1 (81%) max: 53.1 fps
Basemark X 1.0 - Basemark X 1.0 Off-Screen
10.1 fps (48%)
Basemark X 1.1 - Basemark X 1.1 High Quality
min: 3008 avg: 6663 median: 8456 (19%) max: 8524 Points
Basemark X 1.1 - Basemark X 1.1 Medium Quality
min: 4802 avg: 12880 median: 14509 (32%) max: 17701 Points
Basemark GPU 1.2 - Basemark GPU 1.2 Vulkan Official Medium Offscreen 1080
105 fps (1%)
NenaMark2 - NenaMark2 Score
min: 59 avg: 59.4 median: 59.4 (88%) max: 59.7 fps
LuxMark v2.0 64Bit - LuxMark v2.0 Room GPU
min: 25 avg: 28.5 median: 27 (0%) max: 35 Samples/s
min: 30 avg: 31 median: 31 (0%) max: 32 Samples/s
min: 128 avg: 166.7 median: 149 (1%) max: 306 Samples/s
LuxMark v2.0 64Bit - LuxMark v2.0 Sala GPU
min: 26 avg: 29 median: 29 (0%) max: 34 Samples/s
min: 47 avg: 50 median: 50 (0%) max: 53 Samples/s
min: 134 avg: 311.5 median: 328 (1%) max: 409 Samples/s
ComputeMark v2.1 - ComputeMark v2.1 Result
min: 160 avg: 172.8 median: 174 (0%) max: 192 Points
min: 282 avg: 287.3 median: 286 (0%) max: 294 Points
min: 643 avg: 689 median: 695 (1%) max: 734 Points
PassMark PerformanceTest Mobile V1 - PerformanceTest Mobile V1 2D Graphics Tests
min: 3822 avg: 4036 median: 3866 (4%) max: 4588 Points
PassMark PerformanceTest Mobile V1 - PerformanceTest Mobile V1 3D Graphics Tests
min: 1058 avg: 1251 median: 1228 (2%) max: 1488 Points
Smartbench 2012 - Smartbench 2012 Gaming Index
min: 2679 avg: 3414 median: 3385 (74%) max: 4274 Points
Power Consumption - Furmark Stress Test Power Consumption - external Monitor *
min: 27.2 avg: 27.8 median: 27.8 (4%) max: 28.3 Watt
Power Consumption - The Witcher 3 Power Consumption - external Monitor *
26.5 Watt (4%)
Emissions Witcher 3 Fan Noise + Intel HD Graphics 5500 Emissions - Witcher 3 Fan Noise
37.5 dB(A) (60%)
Clock Speed - GPU Clock Witcher 3 ultra
898 MHz (35%)
Clock Speed - GPU Clock Speed Furmark
749 MHz (30%)
Average Benchmarks Intel HD Graphics (Bay Trail) → 100% n=15 Average Benchmarks Intel HD Graphics 2500 → 207% n=15 Average Benchmarks Intel HD Graphics 5500 → 510% n=15
- Range of benchmark values for this graphics card
- Average benchmark values for this graphics card
* Smaller numbers mean a higher performance
1 This benchmark is not used for the average calculation
Game Benchmarks The following benchmarks stem from our benchmarks of review laptops. The performance depends on the used graphics memory, clock rate, processor, system settings, drivers, and operating systems. So the results don't have to be representative for all laptops with this GPU. For detailed information on the benchmark results, click on the fps number.
HD Graphics 5500:
9.4 [X] Asus F555LF-XO029H Intel Core i5-5200U 2.2GHz
HD Graphics 5500
fps
HD Graphics 5500:
12.8 [X] Asus F555LF-XO029H Intel Core i5-5200U 2.2GHz
HD Graphics 5500
fps
HD Graphics 5500:
29.3 fps
HD Graphics 5500:
6.1 [X] Asus F555LF-XO029H Intel Core i5-5200U 2.2GHz
HD Graphics 5500
fps
HD Graphics 5500:
10.1 [X] Asus F555LF-XO029H Intel Core i5-5200U 2.2GHz
HD Graphics 5500
fps
HD Graphics 5500:
41.4 [X] Asus F555LF-XO029H Intel Core i5-5200U 2.2GHz
HD Graphics 5500
fps
HD Graphics 5500:
13.9 [X] Asus F555LF-XO029H Intel Core i5-5200U 2.2GHz
HD Graphics 5500
fps
HD Graphics 5500:
12.1 [X] Asus F555LF-XO029H Intel Core i5-5200U 2.2GHz
HD Graphics 5500
fps
HD Graphics 5500:
21.4 21.5 [X] Asus F555LF-XO029H Intel Core i5-5200U 2.2GHz
HD Graphics 5500
~ 21 fps
HD Graphics 5500:
15.5 [X] Asus F555LF-XO029H Intel Core i5-5200U 2.2GHz
HD Graphics 5500
min:
13 fps, max:
17 fps
18.3 ~ 17 fps
HD Graphics 5500:
14.9 [X] Asus F555LF-XO029H Intel Core i5-5200U 2.2GHz
HD Graphics 5500
fps
HD Graphics 5500:
15 [X] Asus F555LF-XO029H Intel Core i5-5200U 2.2GHz
HD Graphics 5500
fps
HD Graphics 5500:
29.5 [X] Asus F555LF-XO029H Intel Core i5-5200U 2.2GHz
HD Graphics 5500
fps
HD Graphics 5500:
6 [X] Asus F555LF-XO029H Intel Core i5-5200U 2.2GHz
HD Graphics 5500
fps
HD Graphics 5500:
9 [X] Asus F555LF-XO029H Intel Core i5-5200U 2.2GHz
HD Graphics 5500
fps
HD Graphics 5500:
5 [X] Asus F555LF-XO029H Intel Core i5-5200U 2.2GHz
HD Graphics 5500
fps
HD Graphics 5500:
19.8 [X] Asus F555LF-XO029H Intel Core i5-5200U 2.2GHz
HD Graphics 5500
fps
HD Graphics 5500:
11.1 [X] Asus F555LF-XO029H Intel Core i5-5200U 2.2GHz
HD Graphics 5500
fps
HD Graphics 5500:
20 [X] Asus F555LF-XO029H Intel Core i5-5200U 2.2GHz
HD Graphics 5500
fps
HD Graphics 5500:
17.1 [X] Asus F555LF-XO029H Intel Core i5-5200U 2.2GHz
HD Graphics 5500
fps
HD Graphics 5500:
44.6 [X] Asus F555LF-XO029H Intel Core i5-5200U 2.2GHz
HD Graphics 5500
fps
HD Graphics 5500:
12.2 [X] Asus F555LF-XO029H Intel Core i5-5200U 2.2GHz
HD Graphics 5500
fps
HD Graphics 5500:
9.5 [X] Asus F555LF-XO029H Intel Core i5-5200U 2.2GHz
HD Graphics 5500
fps
HD Graphics 5500:
13.4 [X] Asus F555LF-XO029H Intel Core i5-5200U 2.2GHz
HD Graphics 5500
fps
HD Graphics 5500:
0 (!) [X] Asus F555LF-XO029H Intel Core i5-5200U 2.2GHz
HD Graphics 5500
fps
HD Graphics 5500:
7 [X] Asus F555LF-XO029H Intel Core i5-5200U 2.2GHz
HD Graphics 5500
fps
HD Graphics 5500:
42.9 (!) [X] Asus F555LF-XO029H Intel Core i5-5200U 2.2GHz
HD Graphics 5500
fps
HD Graphics 5500:
10 [X] Asus F555LF-XO029H Intel Core i5-5200U 2.2GHz
HD Graphics 5500
fps
HD Graphics 5500:
0 (!) [X] HP 250 G5 i3-5005U MX500 Intel Core i3-5005U 2GHz
HD Graphics 5500
fps
HD Graphics 5500:
19 [X] Asus F555LF-XO029H Intel Core i5-5200U 2.2GHz
HD Graphics 5500
fps
HD Graphics 5500:
8.9 [X] Asus F555LF-XO029H Intel Core i5-5200U 2.2GHz
HD Graphics 5500
fps
HD Graphics 5500:
14.3 [X] Asus F555LF-XO029H Intel Core i5-5200U 2.2GHz
HD Graphics 5500
fps
HD Graphics 5500:
11 [X] Asus F555LF-XO029H Intel Core i5-5200U 2.2GHz
HD Graphics 5500
fps
HD Graphics 5500:
131.8 [X] Asus F555LF-XO029H Intel Core i5-5200U 2.2GHz
HD Graphics 5500
fps
HD Graphics 5500:
14.8 [X] Asus F555LF-XO029H Intel Core i5-5200U 2.2GHz
HD Graphics 5500
fps
HD Graphics 5500:
14 [X] HP 250 G5 i3-5005U MX500 Intel Core i3-5005U 2GHz
HD Graphics 5500
17.1 18 [X] Asus F555LF-XO029H Intel Core i5-5200U 2.2GHz
HD Graphics 5500
~ 16 fps
HD Graphics 5500:
9.3 [X] HP 250 G5 i3-5005U MX500 Intel Core i3-5005U 2GHz
HD Graphics 5500
11.8 ~ 11 fps
HD Graphics 5500:
8.2 [X] HP 250 G5 i3-5005U MX500 Intel Core i3-5005U 2GHz
HD Graphics 5500
10.5 ~ 9 fps
HD Graphics 5500:
12.1 [X] Asus F555LF-XO029H Intel Core i5-5200U 2.2GHz
HD Graphics 5500
fps
HD Graphics 5500:
6.9 [X] HP 250 G5 i3-5005U MX500 1.3
Intel Core i3-5005U 2GHz
HD Graphics 5500
16.1 [X] Asus F555LF-XO029H Intel Core i5-5200U 2.2GHz
HD Graphics 5500
~ 12 fps
HD Graphics 5500:
72.6 [X] Asus F555LF-XO029H Intel Core i5-5200U 2.2GHz
HD Graphics 5500
fps
HD Graphics 5500:
15.5 [X] Asus F555LF-XO029H Intel Core i5-5200U 2.2GHz
HD Graphics 5500
fps
HD Graphics 5500:
23.6 [X] Asus F555LF-XO029H Intel Core i5-5200U 2.2GHz
HD Graphics 5500
fps
HD Graphics 5500:
6 [X] Asus F555LF-XO029H Intel Core i5-5200U 2.2GHz
HD Graphics 5500
fps
HD Graphics 5500:
11.2 [X] Asus F555LF-XO029H Intel Core i5-5200U 2.2GHz
HD Graphics 5500
fps
HD Graphics 5500:
9.8 [X] Asus F555LF-XO029H Intel Core i5-5200U 2.2GHz
HD Graphics 5500
fps
HD Graphics 5500:
14 [X] Asus F555LF-XO029H Intel Core i5-5200U 2.2GHz
HD Graphics 5500
fps
HD Graphics 5500:
56.1 [X] Asus F555LF-XO029H Intel Core i5-5200U 2.2GHz
HD Graphics 5500
fps
HD Graphics 5500:
10.9 [X] Asus F555LF-XO029H Intel Core i5-5200U 2.2GHz
HD Graphics 5500
fps
HD Graphics 5500:
23 [X] Asus F555LF-XO029H Intel Core i5-5200U 2.2GHz
HD Graphics 5500
fps
100%
HD Graphics (Bay Trail):
26.7 [X] Intel NUC Kit DN2820FYKH Intel Celeron N2820 2.2GHz
HD Graphics (Bay Trail)
min:
23 fps
fps
255%
HD Graphics 5500:
68 fps
100%
HD Graphics (Bay Trail):
23.4 [X] Intel NUC Kit DN2820FYKH Intel Celeron N2820 2.2GHz
HD Graphics (Bay Trail)
min:
21 fps
fps
269%
HD Graphics 5500:
63 fps
HD Graphics 5500:
36.4 (!) [X] Intel NUC5i3RYK Intel Core i3-5010U 2.1GHz
HD Graphics 5500
min:
31 fps
fps
HD Graphics 5500:
14 (!) [X] Intel NUC5i3RYK Intel Core i3-5010U 2.1GHz
HD Graphics 5500
min:
13 fps
fps
100%
HD Graphics (Bay Trail):
6 [X] Intel NUC Kit DN2820FYKH Intel Celeron N2820 2.2GHz
HD Graphics (Bay Trail)
fps
570%
HD Graphics 5500:
34.2 fps
100%
HD Graphics (Bay Trail):
12.6 [X] Intel NUC Kit DN2820FYKH Intel Celeron N2820 2.2GHz
HD Graphics (Bay Trail)
min:
7 fps, max:
15 fps
fps
506%
HD Graphics 5500:
63.7 fps
HD Graphics 5500:
21.7 [X] Asus F555LF-XO029H Intel Core i5-5200U 2.2GHz
HD Graphics 5500
fps
HD Graphics 5500:
11.2 [X] Asus F555LF-XO029H Intel Core i5-5200U 2.2GHz
HD Graphics 5500
fps
HD Graphics 5500:
25 [X] Asus F555LF-XO029H Intel Core i5-5200U 2.2GHz
HD Graphics 5500
fps
HD Graphics 5500:
30.8 [X] Asus F555LF-XO029H Intel Core i5-5200U 2.2GHz
HD Graphics 5500
fps
HD Graphics 5500:
21.6 [X] Asus F555LF-XO029H Intel Core i5-5200U 2.2GHz
HD Graphics 5500
fps
HD Graphics 5500:
60.7 fps
HD Graphics 5500:
20.7 [X] Asus F555LF-XO029H Intel Core i5-5200U 2.2GHz
HD Graphics 5500
fps
HD Graphics 5500:
13.3 [X] Asus F555LF-XO029H Intel Core i5-5200U 2.2GHz
HD Graphics 5500
fps
HD Graphics 5500:
21.5 fps
HD Graphics 5500:
12.6 fps
HD Graphics 5500:
31.6 fps
HD Graphics 5500:
0 (!) [X] Intel NUC5i3RYK Intel Core i3-5010U 2.1GHz
HD Graphics 5500
18.4 [X] Asus F555LF-XO029H Intel Core i5-5200U 2.2GHz
HD Graphics 5500
~ 9 fps
HD Graphics 5500:
14.7 [X] Asus F555LF-XO029H Intel Core i5-5200U 2.2GHz
HD Graphics 5500
fps
HD Graphics 5500:
11.4 fps
HD Graphics 5500:
24.6 27 ~ 26 fps
HD Graphics 5500:
16.3 fps
HD Graphics 5500:
14.4 fps
HD Graphics 5500:
16.4 [X] Intel NUC Kit NUC5i3RYH Intel Core i3-5010U 2.1GHz
HD Graphics 5500
min:
9 fps
fps
HD Graphics 5500:
9.7 [X] Intel NUC Kit NUC5i3RYH Intel Core i3-5010U 2.1GHz
HD Graphics 5500
min:
6 fps
fps
HD Graphics 5500:
0 (!) [X] Intel NUC Kit NUC5i3RYH Intel Core i3-5010U 2.1GHz
HD Graphics 5500
fps
HD Graphics (Bay Trail):
0 (!) [X] Intel NUC Kit DN2820FYKH Intel Celeron N2820 2.2GHz
HD Graphics (Bay Trail)
fps
HD Graphics 5500:
25.1 [X] Intel NUC Kit NUC5i3RYH Intel Core i3-5010U 2.1GHz
HD Graphics 5500
min:
22 fps
fps
HD Graphics 5500:
15.1 [X] Intel NUC Kit NUC5i3RYH Intel Core i3-5010U 2.1GHz
HD Graphics 5500
min:
13 fps
fps
HD Graphics 5500:
7.3 [X] Intel NUC Kit NUC5i3RYH Intel Core i3-5010U 2.1GHz
HD Graphics 5500
min:
5 fps
fps
HD Graphics 5500:
8.3 [X] Intel NUC Kit NUC5i3RYH Intel Core i3-5010U 2.1GHz
HD Graphics 5500
min:
7 fps
fps
HD Graphics 5500:
5 [X] Intel NUC Kit NUC5i3RYH Intel Core i3-5010U 2.1GHz
HD Graphics 5500
min:
1 fps
fps
HD Graphics 5500:
2.8 [X] Intel NUC Kit NUC5i3RYH Intel Core i3-5010U 2.1GHz
HD Graphics 5500
min:
1 fps
fps
HD Graphics 5500:
42.4 55.9 [X] Intel NUC Kit NUC5i3RYH Intel Core i3-5010U 2.1GHz
HD Graphics 5500
min:
50 fps
~ 49 fps
HD Graphics 5500:
33.8 35.7 [X] Intel NUC Kit NUC5i3RYH Intel Core i3-5010U 2.1GHz
HD Graphics 5500
min:
31 fps
~ 35 fps
HD Graphics 5500:
17.2 18.1 [X] Intel NUC Kit NUC5i3RYH Intel Core i3-5010U 2.1GHz
HD Graphics 5500
min:
7 fps
~ 18 fps
100%
HD Graphics (Bay Trail):
12.1 [X] Intel NUC Kit DN2820FYKH Intel Celeron N2820 2.2GHz
HD Graphics (Bay Trail)
min:
5 fps, max:
18 fps
fps
405%
HD Graphics 5500:
48.6 49.6 [X] Intel NUC5i3RYK 0.5.0.0
Intel Core i3-5010U 2.1GHz
HD Graphics 5500
min:
28 fps, max:
66 fps
~ 49 fps
HD Graphics 5500:
17.9 fps
HD Graphics 5500:
13 13.2 [X] Intel NUC5i3RYK 0.5.0.0
Intel Core i3-5010U 2.1GHz
HD Graphics 5500
min:
8 fps, max:
22 fps
~ 13 fps
100%
HD Graphics (Bay Trail):
10.8 [X] Intel NUC Kit DN2820FYKH Intel Celeron N2820 2.2GHz
HD Graphics (Bay Trail)
min:
10 fps, max:
12 fps
fps
306%
HD Graphics 5500:
27.8 33.5 37.1 [X] Intel NUC Kit NUC5i3RYH Intel Core i3-5010U 2.1GHz
HD Graphics 5500
min:
33 fps
~ 33 fps
HD Graphics 5500:
18.9 21.1 25.4 [X] Intel NUC Kit NUC5i3RYH Intel Core i3-5010U 2.1GHz
HD Graphics 5500
min:
23 fps
~ 22 fps
HD Graphics 5500:
8.7 9.4 [X] Intel NUC Kit NUC5i3RYH Intel Core i3-5010U 2.1GHz
HD Graphics 5500
min:
8 fps
~ 9 fps
HD Graphics 5500:
16.2 18 [X] Intel NUC Kit NUC5i3RYH Intel Core i3-5010U 2.1GHz
HD Graphics 5500
min:
15 fps
~ 17 fps
HD Graphics 5500:
7.9 8.3 [X] Intel NUC Kit NUC5i3RYH Intel Core i3-5010U 2.1GHz
HD Graphics 5500
min:
7 fps
~ 8 fps
HD Graphics 5500:
7.4 [X] Intel NUC Kit NUC5i3RYH Intel Core i3-5010U 2.1GHz
HD Graphics 5500
min:
6 fps
fps
100%
HD Graphics (Bay Trail):
24.7 [X] Intel NUC Kit DN2820FYKH Intel Celeron N2820 2.2GHz
HD Graphics (Bay Trail)
min:
22.2 fps
fps
255%
HD Graphics 5500:
52 [X] HP 250 G5 i3-5005U MX500 Intel Core i3-5005U 2GHz
HD Graphics 5500
min:
47 fps, max:
-1 fps
74 ~ 63 fps
100%
HD Graphics (Bay Trail):
9.7 [X] Intel NUC Kit DN2820FYKH Intel Celeron N2820 2.2GHz
HD Graphics (Bay Trail)
min:
8.8 fps
fps
351%
HD Graphics 5500:
29.9 [X] HP 250 G5 i3-5005U MX500 Intel Core i3-5005U 2GHz
HD Graphics 5500
min:
27.3 fps, max:
-1 fps
37.6 ~ 34 fps
100%
HD Graphics (Bay Trail):
5.5 [X] Intel NUC Kit DN2820FYKH Intel Celeron N2820 2.2GHz
HD Graphics (Bay Trail)
min:
-1.4 fps
fps
255%
HD Graphics 5500:
13 [X] HP 250 G5 i3-5005U MX500 Intel Core i3-5005U 2GHz
HD Graphics 5500
min:
12.3 fps, max:
-1 fps
15.7 ~ 14 fps
100%
HD Graphics (Bay Trail):
5.4 [X] Intel NUC Kit DN2820FYKH Intel Celeron N2820 2.2GHz
HD Graphics (Bay Trail)
min:
-3 fps
fps
241%
HD Graphics 5500:
11.9 [X] HP 250 G5 i3-5005U MX500 Intel Core i3-5005U 2GHz
HD Graphics 5500
min:
11.3 fps, max:
-1 fps
13.4 13.9 ~ 13 fps
HD Graphics 5500:
11 [X] Intel NUC Kit NUC5i3RYH Intel Core i3-5010U 2.1GHz
HD Graphics 5500
min:
8 fps
12 ~ 12 fps
HD Graphics 5500:
9 [X] Intel NUC Kit NUC5i3RYH Intel Core i3-5010U 2.1GHz
HD Graphics 5500
min:
7 fps
10 ~ 10 fps
HD Graphics 5500:
11.4 [X] Intel NUC Kit NUC5i3RYH 1.07
Intel Core i3-5010U 2.1GHz
HD Graphics 5500
min:
7 fps, max:
16 fps
13.6 ~ 13 fps
100%
HD Graphics (Bay Trail):
22 [X] Intel NUC Kit DN2820FYKH Intel Celeron N2820 2.2GHz
HD Graphics (Bay Trail)
min:
16 fps, max:
33 fps
24.2 ~ 23 fps
326%
HD Graphics 5500:
58.1 63.8 66.1 69.6 80.4 [X] Intel NUC Kit NUC5i3RYH Intel Core i3-5010U 2.1GHz
HD Graphics 5500
min:
67 fps
88 99 ~ 75 fps
100%
HD Graphics (Bay Trail):
0 (!) [X] Intel NUC Kit DN2820FYKH Intel Celeron N2820 2.2GHz
HD Graphics (Bay Trail)
12.5 ~ 6 fps
HD Graphics 5500:
12.5 [X] Intel NUC Kit NUC5i3RYH Intel Core i3-5010U 2.1GHz
HD Graphics 5500
min:
12 fps
12.5 12.5 12.5 12.5 ~ 13 fps
HD Graphics 5500:
12.5 [X] Intel NUC Kit NUC5i3RYH Intel Core i3-5010U 2.1GHz
HD Graphics 5500
min:
12 fps
12.5 12.5 12.5 ~ 13 fps
HD Graphics 5500:
23.1 [X] Asus Zenbook UX303LA-RO340H Intel Core i5-5200U 2.2GHz
HD Graphics 5500
fps
HD Graphics 5500:
19.1 [X] Asus Zenbook UX303LA-RO340H Intel Core i5-5200U 2.2GHz
HD Graphics 5500
fps
HD Graphics 5500:
5.5 [X] Asus Zenbook UX303LA-RO340H Intel Core i5-5200U 2.2GHz
HD Graphics 5500
fps
HD Graphics 5500:
2.8 [X] Asus Zenbook UX303LA-RO340H Intel Core i5-5200U 2.2GHz
HD Graphics 5500
fps
100%
HD Graphics (Bay Trail):
7.3 fps
370%
HD Graphics 5500:
19.7 21.9 27.7 37.9 [X] Intel NUC Kit NUC5i3RYH Intel Core i3-5010U 2.1GHz
HD Graphics 5500
min:
32 fps, max:
46 fps
~ 27 fps
100%
HD Graphics (Bay Trail):
5.1 fps
373%
HD Graphics 5500:
13.7 19.7 25 [X] Intel NUC Kit NUC5i3RYH Intel Core i3-5010U 2.1GHz
HD Graphics 5500
min:
21 fps, max:
32 fps
~ 19 fps
HD Graphics 5500:
5.5 8.1 9.1 [X] Intel NUC Kit NUC5i3RYH Intel Core i3-5010U 2.1GHz
HD Graphics 5500
min:
7 fps, max:
12 fps
~ 8 fps
HD Graphics 5500:
2.9 4.9 ~ 4 fps
100%
HD Graphics (Bay Trail):
3.2 fps
100%
HD Graphics (Bay Trail):
1.7 fps
HD Graphics 5500:
6 6.9 ~ 6 fps
100%
HD Graphics (Bay Trail):
8.1 fps
100%
HD Graphics (Bay Trail):
4.7 fps
HD Graphics 5500:
2.8 3.1 ~ 3 fps
100%
HD Graphics (Bay Trail):
7 fps
357%
HD Graphics 5500:
22.5 [X] Asus Zenbook UX303LA-RO340H Intel Core i5-5200U 2.2GHz
HD Graphics 5500
23.4 [X] Intel NUC Kit NUC5i3RYH Intel Core i3-5010U 2.1GHz
HD Graphics 5500
min:
18 fps
28 ~ 25 fps
100%
HD Graphics (Bay Trail):
4.6 fps
370%
HD Graphics 5500:
15.3 [X] Asus Zenbook UX303LA-RO340H Intel Core i5-5200U 2.2GHz
HD Graphics 5500
16 [X] Intel NUC Kit NUC5i3RYH Intel Core i3-5010U 2.1GHz
HD Graphics 5500
min:
12.4 fps
18.6 ~ 17 fps
HD Graphics 5500:
5.7 [X] Intel NUC Kit NUC5i3RYH Intel Core i3-5010U 2.1GHz
HD Graphics 5500
min:
4.4 fps
6.6 9 [X] Asus Zenbook UX303LA-RO340H Intel Core i5-5200U 2.2GHz
HD Graphics 5500
~ 7 fps
HD Graphics 5500:
3.9 5.5 [X] Asus Zenbook UX303LA-RO340H Intel Core i5-5200U 2.2GHz
HD Graphics 5500
~ 5 fps
100%
HD Graphics (Bay Trail):
5.6 fps
100%
HD Graphics (Bay Trail):
3.8 fps
100%
HD Graphics (Bay Trail):
4.3 fps
186%
HD Graphics 5500:
8.2 8.6 ~ 8 fps
100%
HD Graphics (Bay Trail):
2.4 fps
250%
HD Graphics 5500:
5.9 6.2 ~ 6 fps
HD Graphics 5500:
3 3.1 ~ 3 fps
100%
HD Graphics (Bay Trail):
9.6 11.5 ~ 11 fps
100%
HD Graphics (Bay Trail):
4.3 fps
100%
HD Graphics (Bay Trail):
12 14 ~ 13 fps
362%
HD Graphics 5500:
38 39 42 47 [X] Dell Latitude E7450 Intel Core i5-5300U 2.3GHz
HD Graphics 5500
51 54 56 ~ 47 fps
100%
HD Graphics (Bay Trail):
12 fps
258%
HD Graphics 5500:
25 27 28 32 [X] Dell Latitude E7450 Intel Core i5-5300U 2.3GHz
HD Graphics 5500
33 33 37 ~ 31 fps
HD Graphics 5500:
14 18 18 22 [X] Dell Latitude E7450 Intel Core i5-5300U 2.3GHz
HD Graphics 5500
22 23 23 ~ 20 fps
HD Graphics 5500:
12 12 12 13 [X] Dell Latitude E7450 Intel Core i5-5300U 2.3GHz
HD Graphics 5500
13 13 13 ~ 13 fps
100%
HD Graphics (Bay Trail):
5.2 fps
308%
HD Graphics 5500:
14.4 17.7 ~ 16 fps
100%
HD Graphics (Bay Trail):
3.6 fps
333%
HD Graphics 5500:
10.3 13 ~ 12 fps
100%
HD Graphics (Bay Trail):
3.7 fps
100%
HD Graphics (Bay Trail):
2.5 fps
HD Graphics 5500:
4 4.2 ~ 4 fps
HD Graphics 5500:
3.3 3.8 ~ 4 fps
100%
HD Graphics (Bay Trail):
9.1 fps
341%
HD Graphics 5500:
26.6 29.7 [X] Dell Latitude E7450 Intel Core i5-5300U 2.3GHz
HD Graphics 5500
33.1 35.6 ~ 31 fps
100%
HD Graphics (Bay Trail):
5.1 fps
412%
HD Graphics 5500:
18.3 21.5 [X] Dell Latitude E7450 Intel Core i5-5300U 2.3GHz
HD Graphics 5500
22 23.1 ~ 21 fps
HD Graphics 5500:
9.8 11.2 [X] Dell Latitude E7450 Intel Core i5-5300U 2.3GHz
HD Graphics 5500
12.3 ~ 11 fps
HD Graphics 5500:
8 8.3 [X] Dell Latitude E7450 Intel Core i5-5300U 2.3GHz
HD Graphics 5500
8.8 ~ 8 fps
100%
HD Graphics (Bay Trail):
8.5 fps
224%
HD Graphics 5500:
16.2 17.6 18.8 [X] Dell Latitude E7450 Intel Core i5-5300U 2.3GHz
HD Graphics 5500
21.9 22 ~ 19 fps
100%
HD Graphics (Bay Trail):
6.1 fps
213%
HD Graphics 5500:
11.4 11.6 12.5 [X] Dell Latitude E7450 Intel Core i5-5300U 2.3GHz
HD Graphics 5500
15 15.8 ~ 13 fps
HD Graphics 5500:
6.1 6.3 6.8 [X] Dell Latitude E7450 Intel Core i5-5300U 2.3GHz
HD Graphics 5500
8 8.3 ~ 7 fps
HD Graphics 5500:
3.9 4.9 5.9 [X] Dell Latitude E7450 Intel Core i5-5300U 2.3GHz
HD Graphics 5500
~ 5 fps
100%
HD Graphics (Bay Trail):
12.4 fps
100%
HD Graphics (Bay Trail):
8.5 fps
100%
HD Graphics (Bay Trail):
53.7 56 ~ 55 fps
273%
HD Graphics 5500:
124 129.4 172.2 [X] Dell Latitude E7450 Intel Core i5-5300U 2.3GHz
HD Graphics 5500
173.3 ~ 150 fps
100%
HD Graphics (Bay Trail):
6.6 7 ~ 7 fps
529%
HD Graphics 5500:
31.7 32.1 40.9 [X] Dell Latitude E7450 Intel Core i5-5300U 2.3GHz
HD Graphics 5500
41.4 ~ 37 fps
HD Graphics 5500:
15.8 16.2 18.7 [X] Dell Latitude E7450 Intel Core i5-5300U 2.3GHz
HD Graphics 5500
19.4 ~ 18 fps
HD Graphics 5500:
9.6 10.2 12.9 [X] Dell Latitude E7450 Intel Core i5-5300U 2.3GHz
HD Graphics 5500
~ 11 fps
100%
HD Graphics (Bay Trail):
8.4 fps
298%
HD Graphics 5500:
24.6 [X] Medion Akoya E7416 Intel Core i5-5200U 2.2GHz
HD Graphics 5500
25.5 ~ 25 fps
100%
HD Graphics (Bay Trail):
5.9 fps
254%
HD Graphics 5500:
14.3 [X] Medion Akoya E7416 Intel Core i5-5200U 2.2GHz
HD Graphics 5500
14.8 ~ 15 fps
100%
HD Graphics (Bay Trail):
31.6 41.8 ~ 37 fps
100%
HD Graphics (Bay Trail):
12.5 12.5 ~ 13 fps
100%
HD Graphics (Bay Trail):
8.3 fps
100%
HD Graphics (Bay Trail):
4.6 fps
HD Graphics 5500:
4.4 6.9 ~ 6 fps
100%
HD Graphics (Bay Trail):
11.1 fps
261%
HD Graphics 5500:
26.1 31.3 ~ 29 fps
100%
HD Graphics (Bay Trail):
9.6 fps
271%
HD Graphics 5500:
23.8 28.1 ~ 26 fps
100%
HD Graphics (Bay Trail):
25.2 fps
100%
HD Graphics (Bay Trail):
9.2 fps
100%
HD Graphics (Bay Trail):
3.1 [X] Medion Akoya S6213T MD98716 Intel Pentium N3530 2.2GHz
HD Graphics (Bay Trail)
5.1 ~ 4 fps
375%
HD Graphics 5500:
10.9 11.9 12 12.5 13 13.3 13.4 [X] Lenovo ThinkPad E450 20DCW048PB Intel Core i5-5200U 2.2GHz
HD Graphics 5500
13.5 13.7 14.1 [X] Dell Latitude E7450 Intel Core i5-5300U 2.3GHz
HD Graphics 5500
14.7 [X] Toshiba Portege Z30-B-10Q Intel Core i7-5500U 2.4GHz
HD Graphics 5500
15.7 [X] HP EliteBook Folio 1040 G2 H7W22EA Intel Core i5-5300U 2.3GHz
HD Graphics 5500
16 16.3 16.6 17.1 17.3 17.3 17.4 17.4 [X] Lenovo ThinkPad Yoga 12 20DK002EPB Intel Core i7-5600U 2.6GHz
HD Graphics 5500
20.2 [X] Lenovo ThinkPad T450 20BVG733PB Intel Core i7-5600U 2.6GHz
HD Graphics 5500
20.6 ~ 15 fps
100%
HD Graphics (Bay Trail):
3.3 fps
303%
HD Graphics 5500:
5.7 6.8 8.2 9 9 9 9.1 9.2 9.3 [X] Lenovo ThinkPad E450 20DCW048PB Intel Core i5-5200U 2.2GHz
HD Graphics 5500
9.6 [X] Toshiba Portege Z30-B-10Q Intel Core i7-5500U 2.4GHz
HD Graphics 5500
10 [X] HP EliteBook Folio 1040 G2 H7W22EA Intel Core i5-5300U 2.3GHz
HD Graphics 5500
10.1 [X] Dell Latitude E7450 Intel Core i5-5300U 2.3GHz
HD Graphics 5500
10.7 11 11.3 11.3 11.5 11.8 [X] Lenovo ThinkPad Yoga 12 20DK002EPB Intel Core i7-5600U 2.6GHz
HD Graphics 5500
12.5 [X] Lenovo ThinkPad T450 20BVG733PB Intel Core i7-5600U 2.6GHz
HD Graphics 5500
12.6 ~ 10 fps
HD Graphics 5500:
3.9 4.3 6.3 [X] HP EliteBook Folio 1040 G2 H7W22EA Intel Core i5-5300U 2.3GHz
HD Graphics 5500
6.6 7 7.3 7.3 7.4 7.5 7.7 [X] Toshiba Portege Z30-B-10Q Intel Core i7-5500U 2.4GHz
HD Graphics 5500
8.9 [X] Dell Latitude E7450 Intel Core i5-5300U 2.3GHz
HD Graphics 5500
8.9 9.2 9.2 9.2 9.5 9.8 [X] Lenovo ThinkPad Yoga 12 20DK002EPB Intel Core i7-5600U 2.6GHz
HD Graphics 5500
10.1 10.3 [X] Lenovo ThinkPad T450 20BVG733PB Intel Core i7-5600U 2.6GHz
HD Graphics 5500
~ 8 fps
HD Graphics 5500:
2.4 2.4 2.8 3.2 3.4 3.6 3.6 [X] Toshiba Portege Z30-B-10Q Intel Core i7-5500U 2.4GHz
HD Graphics 5500
4 4.3 4.3 4.3 4.4 [X] Dell Latitude E7450 Intel Core i5-5300U 2.3GHz
HD Graphics 5500
4.6 4.7 [X] Lenovo ThinkPad Yoga 12 20DK002EPB Intel Core i7-5600U 2.6GHz
HD Graphics 5500
~ 4 fps
100%
HD Graphics (Bay Trail):
8.7 fps
231%
HD Graphics 5500:
20.1 fps
100%
HD Graphics (Bay Trail):
5.8 fps
243%
HD Graphics 5500:
14.1 fps
100%
HD Graphics (Bay Trail):
12.8 fps
266%
HD Graphics 5500:
29.7 37.3 [X] Intel NUC Kit NUC5i3RYH Intel Core i3-5010U 2.1GHz
HD Graphics 5500
~ 34 fps
100%
HD Graphics (Bay Trail):
6 fps
217%
HD Graphics 5500:
12.8 14 [X] Intel NUC Kit NUC5i3RYH Intel Core i3-5010U 2.1GHz
HD Graphics 5500
~ 13 fps
HD Graphics 5500:
4.9 6.9 [X] Intel NUC Kit NUC5i3RYH Intel Core i3-5010U 2.1GHz
HD Graphics 5500
~ 6 fps
HD Graphics 5500:
16.8 fps
HD Graphics 5500:
10.7 fps
HD Graphics 5500:
24.8 [X] Medion Akoya E7416 Intel Core i5-5200U 2.2GHz
HD Graphics 5500
fps
100%
HD Graphics (Bay Trail):
7.3 fps
HD Graphics 5500:
3.7 4.3 ~ 4 fps
100%
HD Graphics (Bay Trail):
14 fps
214%
HD Graphics 5500:
30 fps
100%
HD Graphics (Bay Trail):
8 fps
213%
HD Graphics 5500:
17 fps
100%
HD Graphics (Bay Trail):
12 fps
100%
HD Graphics (Bay Trail):
12.6 18.7 19.9 29.8 33.6 60 [X] Medion Akoya P2211T MD98602 Intel Celeron N2910 1.6GHz
HD Graphics (Bay Trail)
~ 29 fps
100%
HD Graphics (Bay Trail):
10.5 19.5 33 [X] Medion Akoya P2211T MD98602 Intel Celeron N2910 1.6GHz
HD Graphics (Bay Trail)
~ 21 fps
329%
HD Graphics 5500:
67 71.4 ~ 69 fps
100%
HD Graphics (Bay Trail):
7.8 12.8 22 [X] Medion Akoya P2211T MD98602 Intel Celeron N2910 1.6GHz
HD Graphics (Bay Trail)
~ 14 fps
400%
HD Graphics 5500:
48.3 63.8 ~ 56 fps
HD Graphics 5500:
37 40.3 ~ 39 fps
100%
HD Graphics (Bay Trail):
7.7 fps
442%
HD Graphics 5500:
26 31.9 35.9 38 39.1 [X] HP EliteBook Folio 1040 G2 H7W22EA Intel Core i5-5300U 2.3GHz
HD Graphics 5500
~ 34 fps
HD Graphics 5500:
19 23.2 26 26.7 27.9 [X] HP EliteBook Folio 1040 G2 H7W22EA Intel Core i5-5300U 2.3GHz
HD Graphics 5500
30 ~ 25 fps
HD Graphics 5500:
16 17.9 20.8 21 [X] HP EliteBook Folio 1040 G2 H7W22EA Intel Core i5-5300U 2.3GHz
HD Graphics 5500
21 22 ~ 20 fps
HD Graphics 5500:
5.5 6 8 10 ~ 7 fps
100%
HD Graphics (Bay Trail):
6.3 fps
279%
HD Graphics 5500:
17.6 fps
HD Graphics 5500:
13.6 fps
100%
HD Graphics (Bay Trail):
10.2 fps
163%
HD Graphics 5500:
16.6 fps
100%
HD Graphics (Bay Trail):
6.1 fps
228%
HD Graphics 5500:
13.9 fps
HD Graphics 5500:
10.8 fps
100%
HD Graphics (Bay Trail):
11 fps
211%
HD Graphics 5500:
23.2 fps
100%
HD Graphics (Bay Trail):
7.8 fps
173%
HD Graphics 5500:
13.5 fps
100%
HD Graphics (Bay Trail):
18.2 [X] Medion Akoya P2211T MD98602 Intel Celeron N2910 1.6GHz
HD Graphics (Bay Trail)
20.8 28.4 31.9 [X] Asus Transformer Book T200TA PL Intel Atom Z3775 1.5GHz
HD Graphics (Bay Trail)
~ 25 fps
256%
HD Graphics 5500:
44.8 54.4 56.3 56.3 58.3 65.6 [X] Dell Latitude E7450 Intel Core i5-5300U 2.3GHz
HD Graphics 5500
74 77.4 [X] Toshiba Portege Z30-B-10Q Intel Core i7-5500U 2.4GHz
HD Graphics 5500
85.2 [X] Lenovo ThinkPad E450 20DCW048PB Intel Core i5-5200U 2.2GHz
HD Graphics 5500
~ 64 fps
100%
HD Graphics (Bay Trail):
9.5 [X] Medion Akoya P2211T MD98602 Intel Celeron N2910 1.6GHz
HD Graphics (Bay Trail)
10.4 13.7 19.4 [X] Asus Transformer Book T200TA PL Intel Atom Z3775 1.5GHz
HD Graphics (Bay Trail)
~ 13 fps
262%
HD Graphics 5500:
27 31.9 31.9 [X] Toshiba Portege Z30-B-10Q Intel Core i7-5500U 2.4GHz
HD Graphics 5500
32.1 33.2 33.7 37.3 [X] Dell Latitude E7450 Intel Core i5-5300U 2.3GHz
HD Graphics 5500
38 [X] Lenovo ThinkPad E450 20DCW048PB Intel Core i5-5200U 2.2GHz
HD Graphics 5500
42 ~ 34 fps
HD Graphics 5500:
13 14.3 14.4 14.8 17.7 [X] Dell Latitude E7450 Intel Core i5-5300U 2.3GHz
HD Graphics 5500
21.9 26.8 [X] Toshiba Portege Z30-B-10Q Intel Core i7-5500U 2.4GHz
HD Graphics 5500
~ 18 fps
100%
HD Graphics (Bay Trail):
4.4 [X] Medion Akoya E6239T Intel Pentium N3510 2GHz
HD Graphics (Bay Trail)
fps
HD Graphics 5500:
7.4 7.8 ~ 8 fps
HD Graphics 5500:
2.8 3 ~ 3 fps
100%
HD Graphics (Bay Trail):
14.1 16.2 17.9 20.4 [X] Medion Akoya E6239T Intel Pentium N3510 2GHz
HD Graphics (Bay Trail)
23.2 ~ 18 fps
100%
HD Graphics (Bay Trail):
12.5 12.6 [X] Medion Akoya E6239T Intel Pentium N3510 2GHz
HD Graphics (Bay Trail)
~ 13 fps
100%
HD Graphics (Bay Trail):
5 fps
221%
HD Graphics 2500:
11.1 fps
147%
HD Graphics 2500:
17.7 fps
133%
HD Graphics 2500:
8 fps
139%
HD Graphics 2500:
7 fps
100%
HD Graphics (Bay Trail):
1.2 fps
417%
HD Graphics 5500:
4.3 4.4 4.6 4.6 4.7 [X] HP EliteBook 850 G2 J7B56EA Intel Core i5-5300U 2.3GHz
HD Graphics 5500
4.7 4.7 5.4 5.6 [X] Lenovo ThinkPad X1 Carbon 2015 Intel Core i7-5500U 2.4GHz
HD Graphics 5500
5.9 6 [X] Lenovo ThinkPad Yoga 12 20DK002EPB Intel Core i7-5600U 2.6GHz
HD Graphics 5500
6.1 9 ~ 5 fps
100%
HD Graphics (Bay Trail):
39 56.2 69 [X] Baytrail Reference Tablet Intel Atom Z3770 1.5GHz
HD Graphics (Bay Trail)
~ 55 fps
264%
HD Graphics 2500:
145 [X] Intel Core i5-3550, Intel DZ77GA-70K Desktop, DDR3-1600 Intel Core i5-3550 3.3GHz
HD Graphics 2500
fps
222%
HD Graphics 5500:
114.6 116.6 127.6 130.1 [X] Dell Latitude E5550 Broadwell Dual-Channel
Intel Core i5-5300U 2.3GHz
HD Graphics 5500
~ 122 fps
100%
HD Graphics (Bay Trail):
12.3 12.8 14 [X] Baytrail Reference Tablet Intel Atom Z3770 1.5GHz
HD Graphics (Bay Trail)
min:
8 fps
~ 13 fps
200%
HD Graphics 2500:
26 [X] Intel Core i5-3550, Intel DZ77GA-70K Desktop, DDR3-1600 Intel Core i5-3550 3.3GHz
HD Graphics 2500
fps
315%
HD Graphics 5500:
36.2 38.9 44.1 [X] Dell Latitude E5550 Broadwell Dual-Channel
Intel Core i5-5300U 2.3GHz
HD Graphics 5500
44.1 ~ 41 fps
HD Graphics 2500:
13.7 [X] Intel Core i5-3550, Intel DZ77GA-70K Desktop, DDR3-1600 Intel Core i5-3550 3.3GHz
HD Graphics 2500
fps
HD Graphics 5500:
20.2 21.3 23.5 [X] Dell Latitude E5550 Broadwell Dual-Channel
Intel Core i5-5300U 2.3GHz
HD Graphics 5500
25.2 ~ 23 fps
HD Graphics 2500:
4.3 [X] Intel Core i5-3550, Intel DZ77GA-70K Desktop, DDR3-1600 Intel Core i5-3550 3.3GHz
HD Graphics 2500
fps
HD Graphics 5500:
7.1 8.3 [X] Dell Latitude E5550 Broadwell Dual-Channel
Intel Core i5-5300U 2.3GHz
HD Graphics 5500
9.1 ~ 8 fps
HD Graphics 2500:
14.8 [X] Intel Core i5-3550, Intel DZ77GA-70K Desktop, DDR3-1600 Intel Core i5-3550 3.3GHz
HD Graphics 2500
fps
HD Graphics 5500:
44.1 [X] Acer Aspire E5-571G-520X Intel Core i5-5200U 2.2GHz
HD Graphics 5500
fps
HD Graphics 2500:
8 [X] Intel Core i5-3550, Intel DZ77GA-70K Desktop, DDR3-1600 Intel Core i5-3550 3.3GHz
HD Graphics 2500
fps
HD Graphics 5500:
23.3 [X] Acer Aspire E5-571G-520X Intel Core i5-5200U 2.2GHz
HD Graphics 5500
fps
HD Graphics 5500:
14.8 [X] Acer Aspire E5-571G-520X Intel Core i5-5200U 2.2GHz
HD Graphics 5500
fps
144%
HD Graphics 2500:
20.1 fps
156%
HD Graphics 2500:
10.9 fps
142%
HD Graphics 2500:
7.1 fps
100%
HD Graphics (Bay Trail):
0.3 fps
HD Graphics 2500:
13.8 [X] Intel Core i5-3550, Intel DZ77GA-70K Desktop, DDR3-1600 Intel Core i5-3550 3.3GHz
HD Graphics 2500
fps
HD Graphics 5500:
1.9 2.8 ~ 2 fps
100%
HD Graphics (Bay Trail):
15.1 23.6 ~ 19 fps
237%
HD Graphics 2500:
43 [X] Intel Core i3-3220, Intel DZ77GA-70K Desktop, DDR3-1600 Intel Core i3-3220 3.3GHz
HD Graphics 2500
46.2 [X] Intel Core i5-3470, Intel DZ77GA-70K Desktop, DDR3-1600 Intel Core i5-3470 3.2GHz
HD Graphics 2500
~ 45 fps
290%
HD Graphics 5500:
55.1 fps
100%
HD Graphics (Bay Trail):
5.2 9.7 ~ 7 fps
269%
HD Graphics 2500:
18.8 [X] Intel Core i5-3470, Intel DZ77GA-70K Desktop, DDR3-1600 Intel Core i5-3470 3.2GHz
HD Graphics 2500
fps
356%
HD Graphics 5500:
24.9 fps
HD Graphics 2500:
13.5 [X] Intel Core i5-3470, Intel DZ77GA-70K Desktop, DDR3-1600 Intel Core i5-3470 3.2GHz
HD Graphics 2500
fps
HD Graphics 5500:
20.7 fps
HD Graphics 2500:
7.3 [X] Intel Core i5-3470, Intel DZ77GA-70K Desktop, DDR3-1600 Intel Core i5-3470 3.2GHz
HD Graphics 2500
fps
HD Graphics 5500:
10.7 fps
100%
HD Graphics (Bay Trail):
10.3 fps
184%
HD Graphics 2500:
18 [X] Intel Core i3-3220, Intel DZ77GA-70K Desktop, DDR3-1600 Intel Core i3-3220 3.3GHz
HD Graphics 2500
20.5 [X] Intel Core i5-3470, Intel DZ77GA-70K Desktop, DDR3-1600 Intel Core i5-3470 3.2GHz
HD Graphics 2500
~ 19 fps
295%
HD Graphics 5500:
30.4 [X] Acer Aspire E5-571G-520X Intel Core i5-5200U 2.2GHz
HD Graphics 5500
fps
100%
HD Graphics (Bay Trail):
6.2 fps
192%
HD Graphics 2500:
11.9 [X] Intel Core i5-3470, Intel DZ77GA-70K Desktop, DDR3-1600 Intel Core i5-3470 3.2GHz
HD Graphics 2500
fps
324%
HD Graphics 5500:
20.1 [X] Acer Aspire E5-571G-520X Intel Core i5-5200U 2.2GHz
HD Graphics 5500
fps
HD Graphics 5500:
10.4 [X] Acer Aspire E5-571G-520X Intel Core i5-5200U 2.2GHz
HD Graphics 5500
fps
HD Graphics 2500:
13.8 [X] Intel Core i5-3470, Intel DZ77GA-70K Desktop, DDR3-1600 Intel Core i5-3470 3.2GHz
HD Graphics 2500
fps
HD Graphics 5500:
15.9 [X] Acer Aspire E5-571G-520X Intel Core i5-5200U 2.2GHz
HD Graphics 5500
fps
HD Graphics 5500:
14.1 [X] Acer Aspire E5-571G-520X Intel Core i5-5200U 2.2GHz
HD Graphics 5500
fps
100%
HD Graphics (Bay Trail):
10.1 fps
188%
HD Graphics 2500:
18.4 [X] Intel Core i3-3220, Intel DZ77GA-70K Desktop, DDR3-1600 Intel Core i3-3220 3.3GHz
HD Graphics 2500
20.1 [X] Intel Core i5-3470, Intel DZ77GA-70K Desktop, DDR3-1600 Intel Core i5-3470 3.2GHz
HD Graphics 2500
min:
15.6 fps, max:
28.3 fps
~ 19 fps
178%
HD Graphics 5500:
18 fps
100%
HD Graphics (Bay Trail):
6 fps
183%
HD Graphics 2500:
10.7 [X] Intel Core i3-3220, Intel DZ77GA-70K Desktop, DDR3-1600 Intel Core i3-3220 3.3GHz
HD Graphics 2500
11.6 [X] Intel Core i5-3470, Intel DZ77GA-70K Desktop, DDR3-1600 Intel Core i5-3470 3.2GHz
HD Graphics 2500
~ 11 fps
215%
HD Graphics 5500:
12.9 fps
HD Graphics 2500:
3.8 [X] Intel Core i5-3470, Intel DZ77GA-70K Desktop, DDR3-1600 Intel Core i5-3470 3.2GHz
HD Graphics 2500
fps
HD Graphics 2500:
1.9 [X] Intel Core i5-3470, Intel DZ77GA-70K Desktop, DDR3-1600 Intel Core i5-3470 3.2GHz
HD Graphics 2500
fps
100%
HD Graphics (Bay Trail):
12.4 fps
145%
HD Graphics 2500:
18 [X] Intel Core i3-3220, Intel DZ77GA-70K Desktop, DDR3-1600 Intel Core i3-3220 3.3GHz
HD Graphics 2500
fps
352%
HD Graphics 5500:
43.7 fps
100%
HD Graphics (Bay Trail):
7.3 fps
429%
HD Graphics 5500:
31.3 fps
HD Graphics 5500:
17.4 fps
HD Graphics 5500:
28.7 [X] Acer Aspire E5-571G-520X Intel Core i5-5200U 2.2GHz
HD Graphics 5500
fps
HD Graphics 5500:
20.4 [X] Acer Aspire E5-571G-520X Intel Core i5-5200U 2.2GHz
HD Graphics 5500
fps
HD Graphics 5500:
16.4 [X] Acer Aspire E5-571G-520X Intel Core i5-5200U 2.2GHz
HD Graphics 5500
fps
100%
HD Graphics (Bay Trail):
12.5 14.3 ~ 13 fps
290%
HD Graphics 5500:
37.7 [X] Acer Aspire E5-771G-71PT Intel Core i7-5500U 2.4GHz
HD Graphics 5500
fps
100%
HD Graphics (Bay Trail):
9.8 11.2 ~ 11 fps
265%
HD Graphics 5500:
29.2 [X] Acer Aspire E5-771G-71PT Intel Core i7-5500U 2.4GHz
HD Graphics 5500
fps
HD Graphics 5500:
26.1 [X] Acer Aspire E5-771G-71PT Intel Core i7-5500U 2.4GHz
HD Graphics 5500
fps
HD Graphics 2500:
29.7 99 [X] Intel Core i3-3220, Intel DZ77GA-70K Desktop, DDR3-1600 Intel Core i3-3220 3.3GHz
HD Graphics 2500
101 [X] Intel Core i5-3470, Intel DZ77GA-70K Desktop, DDR3-1600 Intel Core i5-3470 3.2GHz
HD Graphics 2500
~ 77 fps
HD Graphics 2500:
23.6 51 [X] Intel Core i3-3220, Intel DZ77GA-70K Desktop, DDR3-1600 Intel Core i3-3220 3.3GHz
HD Graphics 2500
52 [X] Intel Core i5-3470, Intel DZ77GA-70K Desktop, DDR3-1600 Intel Core i5-3470 3.2GHz
HD Graphics 2500
60 [X] Intel Core i5-3550, Intel DZ77GA-70K Desktop, DDR3-1600 Intel Core i5-3550 3.3GHz
HD Graphics 2500
~ 47 fps
HD Graphics 2500:
17.2 28 [X] Intel Core i3-3220, Intel DZ77GA-70K Desktop, DDR3-1600 Intel Core i3-3220 3.3GHz
HD Graphics 2500
31.2 [X] Intel Core i5-3470, Intel DZ77GA-70K Desktop, DDR3-1600 Intel Core i5-3470 3.2GHz
HD Graphics 2500
32 [X] Intel Core i5-3550, Intel DZ77GA-70K Desktop, DDR3-1600 Intel Core i5-3550 3.3GHz
HD Graphics 2500
~ 27 fps
HD Graphics 2500:
14.5 [X] Intel Core i5-3470, Intel DZ77GA-70K Desktop, DDR3-1600 Intel Core i5-3470 3.2GHz
HD Graphics 2500
fps
HD Graphics 2500:
37 [X] Intel Core i3-3220, Intel DZ77GA-70K Desktop, DDR3-1600 Intel Core i3-3220 3.3GHz
HD Graphics 2500
min:
27 fps
40 [X] Intel Core i5-3470, Intel DZ77GA-70K Desktop, DDR3-1600 Intel Core i5-3470 3.2GHz
HD Graphics 2500
~ 39 fps
HD Graphics 2500:
21 [X] Intel Core i3-3220, Intel DZ77GA-70K Desktop, DDR3-1600 Intel Core i3-3220 3.3GHz
HD Graphics 2500
26 [X] Intel Core i5-3470, Intel DZ77GA-70K Desktop, DDR3-1600 Intel Core i5-3470 3.2GHz
HD Graphics 2500
~ 24 fps
HD Graphics 2500:
21 [X] Intel Core i3-3220, Intel DZ77GA-70K Desktop, DDR3-1600 Intel Core i3-3220 3.3GHz
HD Graphics 2500
22 [X] Intel Core i5-3470, Intel DZ77GA-70K Desktop, DDR3-1600 Intel Core i5-3470 3.2GHz
HD Graphics 2500
~ 22 fps
HD Graphics 2500:
12 [X] Intel Core i5-3470, Intel DZ77GA-70K Desktop, DDR3-1600 Intel Core i5-3470 3.2GHz
HD Graphics 2500
12 [X] Intel Core i3-3220, Intel DZ77GA-70K Desktop, DDR3-1600 Intel Core i3-3220 3.3GHz
HD Graphics 2500
~ 12 fps
100%
HD Graphics (Bay Trail):
42 fps
HD Graphics 2500:
37 [X] Intel Core i3-3220, Intel DZ77GA-70K Desktop, DDR3-1600 Intel Core i3-3220 3.3GHz
HD Graphics 2500
fps
HD Graphics 5500:
42.6 fps
HD Graphics 2500:
8 [X] Intel Core i3-3220, Intel DZ77GA-70K Desktop, DDR3-1600 Intel Core i3-3220 3.3GHz
HD Graphics 2500
fps
HD Graphics 5500:
14.3 fps
100%
HD Graphics (Bay Trail):
26.1 [X] Intel NUC Kit DN2820FYKH Intel Celeron N2820 2.2GHz
HD Graphics (Bay Trail)
min:
16 fps, max:
38 fps
46.6 ~ 36 fps
222%
HD Graphics 2500:
77 [X] Intel Core i3-3220, Intel DZ77GA-70K Desktop, DDR3-1600 Intel Core i3-3220 3.3GHz
HD Graphics 2500
82 [X] Intel Core i5-3470, Intel DZ77GA-70K Desktop, DDR3-1600 Intel Core i5-3470 3.2GHz
HD Graphics 2500
~ 80 fps
203%
HD Graphics 5500:
61 71 87.2 [X] Dell Latitude E7450 Intel Core i5-5300U 2.3GHz
HD Graphics 5500
~ 73 fps
100%
HD Graphics (Bay Trail):
20 [X] Intel NUC Kit DN2820FYKH Intel Celeron N2820 2.2GHz
HD Graphics (Bay Trail)
min:
13 fps, max:
29 fps
23.9 ~ 22 fps
173%
HD Graphics 2500:
36 [X] Intel Core i3-3220, Intel DZ77GA-70K Desktop, DDR3-1600 Intel Core i3-3220 3.3GHz
HD Graphics 2500
39 [X] Intel Core i5-3470, Intel DZ77GA-70K Desktop, DDR3-1600 Intel Core i5-3470 3.2GHz
HD Graphics 2500
~ 38 fps
241%
HD Graphics 5500:
41 51.3 67.4 [X] Dell Latitude E7450 Intel Core i5-5300U 2.3GHz
HD Graphics 5500
~ 53 fps
HD Graphics 2500:
18 [X] Intel Core i3-3220, Intel DZ77GA-70K Desktop, DDR3-1600 Intel Core i3-3220 3.3GHz
HD Graphics 2500
20.6 [X] Intel Core i5-3470, Intel DZ77GA-70K Desktop, DDR3-1600 Intel Core i5-3470 3.2GHz
HD Graphics 2500
~ 19 fps
HD Graphics 5500:
32.3 36.2 42.9 [X] Dell Latitude E7450 Intel Core i5-5300U 2.3GHz
HD Graphics 5500
~ 37 fps
HD Graphics 2500:
11.7 [X] Intel Core i5-3470, Intel DZ77GA-70K Desktop, DDR3-1600 Intel Core i5-3470 3.2GHz
HD Graphics 2500
fps
HD Graphics 5500:
17.4 19.7 25 [X] Dell Latitude E7450 Intel Core i5-5300U 2.3GHz
HD Graphics 5500
~ 21 fps
100%
HD Graphics (Bay Trail):
12.9 13.2 ~ 13 fps
167%
HD Graphics 2500:
21.7 [X] Intel Core i5-3470, Intel DZ77GA-70K Desktop, DDR3-1600 Intel Core i5-3470 3.2GHz
HD Graphics 2500
fps
100%
HD Graphics (Bay Trail):
7.5 8.1 ~ 8 fps
194%
HD Graphics 2500:
15.5 [X] Intel Core i5-3470, Intel DZ77GA-70K Desktop, DDR3-1600 Intel Core i5-3470 3.2GHz
HD Graphics 2500
fps
HD Graphics 5500:
21 [X] Acer Aspire E5-571G-520X Intel Core i5-5200U 2.2GHz
HD Graphics 5500
fps
100%
HD Graphics (Bay Trail):
28 fps
184%
HD Graphics 5500:
51.4 [X] Acer Aspire E5-771G-71PT Intel Core i7-5500U 2.4GHz
HD Graphics 5500
fps
HD Graphics 5500:
30 [X] Acer Aspire E5-771G-71PT Intel Core i7-5500U 2.4GHz
HD Graphics 5500
fps
HD Graphics 5500:
21.9 [X] Acer Aspire E5-771G-71PT Intel Core i7-5500U 2.4GHz
HD Graphics 5500
fps
100%
HD Graphics (Bay Trail):
9.2 10.7 14.8 15.6 16.5 [X] Medion Akoya P2214T MD 99430 Intel Celeron N2940 1.8GHz
HD Graphics (Bay Trail)
18.4 19.3 [X] Intel NUC Kit DN2820FYKH Intel Celeron N2820 2.2GHz
HD Graphics (Bay Trail)
min:
14 fps, max:
23 fps
~ 15 fps
373%
HD Graphics 5500:
47.1 52.8 54 68.6 [X] Dell Latitude E7450 Intel Core i5-5300U 2.3GHz
HD Graphics 5500
~ 56 fps
100%
HD Graphics (Bay Trail):
6 9.5 [X] Medion Akoya P2214T MD 99430 Intel Celeron N2940 1.8GHz
HD Graphics (Bay Trail)
10.3 11.4 12 ~ 10 fps
360%
HD Graphics 5500:
30.1 34.8 35.6 45.3 [X] Dell Latitude E7450 Intel Core i5-5300U 2.3GHz
HD Graphics 5500
~ 36 fps
100%
HD Graphics (Bay Trail):
7.9 [X] Medion Akoya P2214T MD 99430 Intel Celeron N2940 1.8GHz
HD Graphics (Bay Trail)
9.6 ~ 9 fps
322%
HD Graphics 5500:
24 27.8 28.6 37 [X] Dell Latitude E7450 Intel Core i5-5300U 2.3GHz
HD Graphics 5500
~ 29 fps
100%
HD Graphics (Bay Trail):
5 [X] Medion Akoya P2214T MD 99430 Intel Celeron N2940 1.8GHz
HD Graphics (Bay Trail)
5.9 ~ 5 fps
360%
HD Graphics 5500:
15.2 16.9 17.3 22.3 [X] Dell Latitude E7450 Intel Core i5-5300U 2.3GHz
HD Graphics 5500
~ 18 fps
100%
HD Graphics (Bay Trail):
8.5 12.4 ~ 10 fps
361%
HD Graphics 5500:
36.1 [X] Acer Aspire E5-571G-520X Intel Core i5-5200U 2.2GHz
HD Graphics 5500
fps
100%
HD Graphics (Bay Trail):
8.1 fps
328%
HD Graphics 5500:
26.6 [X] Acer Aspire E5-571G-520X Intel Core i5-5200U 2.2GHz
HD Graphics 5500
fps
100%
HD Graphics (Bay Trail):
5.8 fps
317%
HD Graphics 5500:
18.4 [X] Acer Aspire E5-771G-71PT Intel Core i7-5500U 2.4GHz
HD Graphics 5500
fps
100%
HD Graphics (Bay Trail):
2.3 fps
426%
HD Graphics 5500:
9.8 [X] Acer Aspire E5-771G-71PT Intel Core i7-5500U 2.4GHz
HD Graphics 5500
fps
136%
HD Graphics 2500:
23.2 fps
140%
HD Graphics 2500:
9.8 fps
131%
HD Graphics 2500:
5.2 fps
100%
HD Graphics (Bay Trail):
1.1 fps
100%
HD Graphics (Bay Trail):
11 11.8 ~ 11 fps
100%
HD Graphics (Bay Trail):
10 fps
100%
HD Graphics (Bay Trail):
8 fps
210%
HD Graphics 2500:
16.8 [X] Intel Core i5-3470, Intel DZ77GA-70K Desktop, DDR3-1600 Intel Core i5-3470 3.2GHz
HD Graphics 2500
fps
100%
HD Graphics (Bay Trail):
4.8 fps
229%
HD Graphics 2500:
11 [X] Intel Core i5-3470, Intel DZ77GA-70K Desktop, DDR3-1600 Intel Core i5-3470 3.2GHz
HD Graphics 2500
fps
HD Graphics 5500:
13 [X] Lenovo ThinkPad T450 20BVG733PB Intel Core i7-5600U 2.6GHz
HD Graphics 5500
37 [X] Medion Akoya E7416 Intel Core i5-5200U 2.2GHz
HD Graphics 5500
~ 25 fps
HD Graphics 5500:
10 [X] Lenovo ThinkPad T450 20BVG733PB Intel Core i7-5600U 2.6GHz
HD Graphics 5500
29 [X] Medion Akoya E7416 Intel Core i5-5200U 2.2GHz
HD Graphics 5500
~ 20 fps
HD Graphics 5500:
14 [X] Medion Akoya E7416 Intel Core i5-5200U 2.2GHz
HD Graphics 5500
fps
100%
HD Graphics (Bay Trail):
19.7 fps
226%
HD Graphics 5500:
44.6 fps
HD Graphics 5500:
25.7 fps
HD Graphics 5500:
11.3 fps
100%
HD Graphics (Bay Trail):
24.1 36.9 ~ 31 fps
171%
HD Graphics 5500:
27 78.1 [X] Acer Aspire E5-771G-71PT Intel Core i7-5500U 2.4GHz
HD Graphics 5500
~ 53 fps
100%
HD Graphics (Bay Trail):
12.9 13.3 ~ 13 fps
238%
HD Graphics 5500:
18.9 42.4 [X] Acer Aspire E5-771G-71PT Intel Core i7-5500U 2.4GHz
HD Graphics 5500
~ 31 fps
HD Graphics 5500:
16.7 29.2 [X] Acer Aspire E5-771G-71PT Intel Core i7-5500U 2.4GHz
HD Graphics 5500
~ 23 fps
HD Graphics 5500:
12.9 [X] Acer Aspire E5-771G-71PT Intel Core i7-5500U 2.4GHz
HD Graphics 5500
12.9 ~ 13 fps
HD Graphics 5500:
96.1 [X] Acer Aspire E5-571G-520X Intel Core i5-5200U 2.2GHz
HD Graphics 5500
fps
100%
HD Graphics (Bay Trail):
9.3 fps
100%
HD Graphics (Bay Trail):
5 10.5 [X] Asus Transformer Book T200TA PL Intel Atom Z3775 1.5GHz
HD Graphics (Bay Trail)
~ 8 fps
425%
HD Graphics 5500:
28.7 [X] Lenovo ThinkPad E450 20DCW048PB Intel Core i5-5200U 2.2GHz
HD Graphics 5500
30.6 [X] Toshiba Portege Z30-B-10Q Intel Core i7-5500U 2.4GHz
HD Graphics 5500
30.9 [X] HP EliteBook Folio 1040 G2 H7W22EA Intel Core i5-5300U 2.3GHz
HD Graphics 5500
39 [X] Lenovo ThinkPad Yoga 12 20DK002EPB Intel Core i7-5600U 2.6GHz
HD Graphics 5500
39.3 [X] Lenovo ThinkPad T450 20BVG733PB Intel Core i7-5600U 2.6GHz
HD Graphics 5500
~ 34 fps
100%
HD Graphics (Bay Trail):
5.6 [X] Asus Transformer Book T200TA PL Intel Atom Z3775 1.5GHz
HD Graphics (Bay Trail)
fps
446%
HD Graphics 5500:
21.2 [X] Lenovo ThinkPad E450 20DCW048PB Intel Core i5-5200U 2.2GHz
HD Graphics 5500
22.6 [X] Toshiba Portege Z30-B-10Q Intel Core i7-5500U 2.4GHz
HD Graphics 5500
24.3 [X] HP EliteBook Folio 1040 G2 H7W22EA Intel Core i5-5300U 2.3GHz
HD Graphics 5500
28.9 [X] Lenovo ThinkPad T450 20BVG733PB Intel Core i7-5600U 2.6GHz
HD Graphics 5500
30.4 [X] Lenovo ThinkPad Yoga 12 20DK002EPB Intel Core i7-5600U 2.6GHz
HD Graphics 5500
~ 25 fps
100%
HD Graphics (Bay Trail):
3.7 [X] Asus Transformer Book T200TA PL Intel Atom Z3775 1.5GHz
HD Graphics (Bay Trail)
fps
595%
HD Graphics 5500:
19 [X] Toshiba Portege Z30-B-10Q Intel Core i7-5500U 2.4GHz
HD Graphics 5500
20.5 [X] HP EliteBook Folio 1040 G2 H7W22EA Intel Core i5-5300U 2.3GHz
HD Graphics 5500
24.8 [X] Lenovo ThinkPad Yoga 12 20DK002EPB Intel Core i7-5600U 2.6GHz
HD Graphics 5500
25 [X] Lenovo ThinkPad T450 20BVG733PB Intel Core i7-5600U 2.6GHz
HD Graphics 5500
~ 22 fps
HD Graphics 5500:
11 [X] Toshiba Portege Z30-B-10Q Intel Core i7-5500U 2.4GHz
HD Graphics 5500
14.8 [X] Lenovo ThinkPad Yoga 12 20DK002EPB Intel Core i7-5600U 2.6GHz
HD Graphics 5500
~ 13 fps
100%
HD Graphics (Bay Trail):
32 48 49 53.3 ~ 46 fps
100%
HD Graphics (Bay Trail):
6 9 9 ~ 8 fps
100%
HD Graphics (Bay Trail):
3 fps
100%
HD Graphics (Bay Trail):
12 [X] Asus Transformer Book T200TA PL Intel Atom Z3775 1.5GHz
HD Graphics (Bay Trail)
fps
100%
HD Graphics (Bay Trail):
9 [X] Asus Transformer Book T200TA PL Intel Atom Z3775 1.5GHz
HD Graphics (Bay Trail)
fps
167%
HD Graphics 5500:
15 fps
HD Graphics 5500:
13.3 fps
100%
HD Graphics (Bay Trail):
12.8 fps
869%
HD Graphics 5500:
111.2 [X] Acer Aspire E5-771G-71PT Intel Core i7-5500U 2.4GHz
HD Graphics 5500
fps
100%
HD Graphics (Bay Trail):
9 fps
930%
HD Graphics 5500:
83.7 [X] Acer Aspire E5-771G-71PT Intel Core i7-5500U 2.4GHz
HD Graphics 5500
fps
HD Graphics 5500:
61.3 [X] Acer Aspire E5-771G-71PT Intel Core i7-5500U 2.4GHz
HD Graphics 5500
fps
350%
HD Graphics 5500:
84 [X] Acer Aspire E5-771G-71PT Intel Core i7-5500U 2.4GHz
HD Graphics 5500
fps
HD Graphics 5500:
36 [X] Acer Aspire E5-771G-71PT Intel Core i7-5500U 2.4GHz
HD Graphics 5500
fps
HD Graphics 5500:
16.4 [X] Acer Aspire E5-771G-71PT Intel Core i7-5500U 2.4GHz
HD Graphics 5500
fps
100%
HD Graphics (Bay Trail):
42.9 69.8 69.8 71.6 72 72.7 75.1 75.5 76 [X] Medion Akoya E1232T-MD99410 Intel Celeron N2807 1.6GHz
HD Graphics (Bay Trail)
76.7 77.1 80.9 83.1 83.9 84.3 [X] Captiva PAD 10.1 Windows Intel Atom Z3735D 1.3GHz
HD Graphics (Bay Trail)
84.8 [X] ODYS Winpad V10 Intel Atom Z3735F 1.3GHz
HD Graphics (Bay Trail)
85.6 [X] cmx WinTek 101-1016 Intel Atom Z3735F 1.3GHz
HD Graphics (Bay Trail)
86.9 90.2 ~ 77 fps
100%
HD Graphics (Bay Trail):
10.3 14 [X] Medion Akoya E1232T-MD99410 Intel Celeron N2807 1.6GHz
HD Graphics (Bay Trail)
17.7 18 18.1 18.1 18.7 18.8 [X] Captiva PAD 10.1 Windows Intel Atom Z3735D 1.3GHz
HD Graphics (Bay Trail)
19.3 19.4 19.4 19.8 19.8 20.5 20.5 [X] cmx WinTek 101-1016 Intel Atom Z3735F 1.3GHz
HD Graphics (Bay Trail)
20.6 21 [X] ODYS Winpad V10 Intel Atom Z3735F 1.3GHz
HD Graphics (Bay Trail)
21.5 23.6 ~ 19 fps
414%
HD Graphics 5500:
78.7 [X] Acer Aspire E5-771G-71PT Intel Core i7-5500U 2.4GHz
HD Graphics 5500
fps
100%
HD Graphics (Bay Trail):
6.4 [X] Captiva PAD 10.1 Windows Intel Atom Z3735D 1.3GHz
HD Graphics (Bay Trail)
7.7 ~ 7 fps
481%
HD Graphics 5500:
33.7 [X] Acer Aspire E5-771G-71PT Intel Core i7-5500U 2.4GHz
HD Graphics 5500
fps
HD Graphics 2500:
46 [X] Intel Core i5-3470, Intel DZ77GA-70K Desktop, DDR3-1600 Intel Core i5-3470 3.2GHz
HD Graphics 2500
fps
HD Graphics 2500:
22.2 [X] Intel Core i5-3470, Intel DZ77GA-70K Desktop, DDR3-1600 Intel Core i5-3470 3.2GHz
HD Graphics 2500
fps
HD Graphics 2500:
18.7 [X] Intel Core i5-3470, Intel DZ77GA-70K Desktop, DDR3-1600 Intel Core i5-3470 3.2GHz
HD Graphics 2500
fps
HD Graphics 2500:
7.6 [X] Intel Core i5-3470, Intel DZ77GA-70K Desktop, DDR3-1600 Intel Core i5-3470 3.2GHz
HD Graphics 2500
fps
100%
HD Graphics (Bay Trail):
18.9 19 ~ 19 fps
268%
HD Graphics 2500:
48.8 [X] Intel Core i3-3220, Intel DZ77GA-70K Desktop, DDR3-1600 Intel Core i3-3220 3.3GHz
HD Graphics 2500
52.8 [X] Intel Core i5-3470, Intel DZ77GA-70K Desktop, DDR3-1600 Intel Core i5-3470 3.2GHz
HD Graphics 2500
~ 51 fps
100%
HD Graphics (Bay Trail):
7.6 8.7 ~ 8 fps
263%
HD Graphics 2500:
20.2 [X] Intel Core i3-3220, Intel DZ77GA-70K Desktop, DDR3-1600 Intel Core i3-3220 3.3GHz
HD Graphics 2500
21.6 [X] Intel Core i5-3470, Intel DZ77GA-70K Desktop, DDR3-1600 Intel Core i5-3470 3.2GHz
HD Graphics 2500
~ 21 fps
HD Graphics 2500:
12 [X] Intel Core i5-3470, Intel DZ77GA-70K Desktop, DDR3-1600 Intel Core i5-3470 3.2GHz
HD Graphics 2500
fps
HD Graphics 2500:
3 [X] Intel Core i5-3470, Intel DZ77GA-70K Desktop, DDR3-1600 Intel Core i5-3470 3.2GHz
HD Graphics 2500
fps
100%
HD Graphics (Bay Trail):
33 33 35 38 [X] MSI S100 Intel Atom Z3740D 1.3GHz
HD Graphics (Bay Trail)
44 46.2 47 48 49 49 [X] Intel NUC Kit DN2820FYKH Intel Celeron N2820 2.2GHz
HD Graphics (Bay Trail)
min:
39 fps, max:
59 fps
50 [X] Baytrail Reference Tablet Intel Atom Z3770 1.5GHz
HD Graphics (Bay Trail)
min:
36 fps
52 ~ 44 fps
236%
HD Graphics 2500:
104 [X] Intel Core i3-3220, Intel DZ77GA-70K Desktop, DDR3-1600 Intel Core i3-3220 3.3GHz
HD Graphics 2500
fps
100%
HD Graphics (Bay Trail):
9.6 [X] Intel NUC Kit DN2820FYKH Intel Celeron N2820 2.2GHz
HD Graphics (Bay Trail)
min:
3 fps, max:
13 fps
11.5 [X] Baytrail Reference Tablet Intel Atom Z3770 1.5GHz
HD Graphics (Bay Trail)
min:
8 fps
20 22 23 25.3 26 26 28 [X] MSI S100 Intel Atom Z3740D 1.3GHz
HD Graphics (Bay Trail)
34 ~ 23 fps
126%
HD Graphics 2500:
29 [X] Intel Core i3-3220, Intel DZ77GA-70K Desktop, DDR3-1600 Intel Core i3-3220 3.3GHz
HD Graphics 2500
fps
100%
HD Graphics (Bay Trail):
12 12 13.5 ~ 13 fps
100%
HD Graphics (Bay Trail):
5.6 7 ~ 6 fps
100%
HD Graphics (Bay Trail):
190 [X] Baytrail Reference Tablet Intel Atom Z3770 1.5GHz
HD Graphics (Bay Trail)
fps
Average Gaming Intel HD Graphics (Bay Trail) → 100% Average Gaming 30-70 fps → 100%
Average Gaming Intel HD Graphics 2500 → 188% Average Gaming 30-70 fps → 226%
Average Gaming Intel HD Graphics 5500 → 346% Average Gaming 30-70 fps → 335%
For more games that might be playable and a list of all games and graphics cards visit our Gaming List
v1.26
log 23. 13:38:30
#0 checking url part for id 4922 +0s ... 0s
#1 checking url part for id 2887 +0s ... 0s
#2 checking url part for id 5941 +0s ... 0s
#3 not redirecting to Ajax server +0s ... 0s
#4 did not recreate cache, as it is less than 5 days old! Created at Mon, 22 Apr 2024 05:40:21 +0200 +0.001s ... 0.001s
#5 composed specs +0.17s ... 0.171s
#6 did output specs +0s ... 0.171s
#7 start showIntegratedCPUs +0s ... 0.171s
#8 getting avg benchmarks for device 4922 +0.065s ... 0.236s
#9 got single benchmarks 4922 +0.261s ... 0.497s
#10 getting avg benchmarks for device 2887 +0.013s ... 0.51s
#11 got single benchmarks 2887 +0.016s ... 0.525s
#12 getting avg benchmarks for device 5941 +0.017s ... 0.542s
#13 got single benchmarks 5941 +0.204s ... 0.746s
#14 got avg benchmarks for devices +0s ... 0.746s
#15 No cached benchmark found, getting uncached values +0.468s ... 1.214s
#16 min, max, avg, median took s +0.105s ... 1.319s
#17 before gaming benchmark output +0s ... 1.319s
#18 Got 1575 rows for game benchmarks. +0.138s ... 1.458s
#19 composed SQL query for gamebenchmarks +0s ... 1.458s
#20 got data and put it in $dataArray +0.107s ... 1.564s
#21 benchmarks composed for output. +0.35s ... 1.914s
#22 calculated avg scores. +0s ... 1.914s
#23 return log +0.005s ... 1.919s
Please share our article, every link counts!
Redaktion, 2017-09- 8 (Update: 2023-07- 1)
 Deutsch
 English
 Español
 Français
 Italiano
 Nederlands
 Polski
 Português
 Русский
 Türkçe
 Svenska
 Chinese
 Magyar