Intel HD Graphics 520 vs Intel Iris Pro Graphics P580 vs Intel UHD Graphics 610
Intel HD Graphics 520 ► remove from comparison
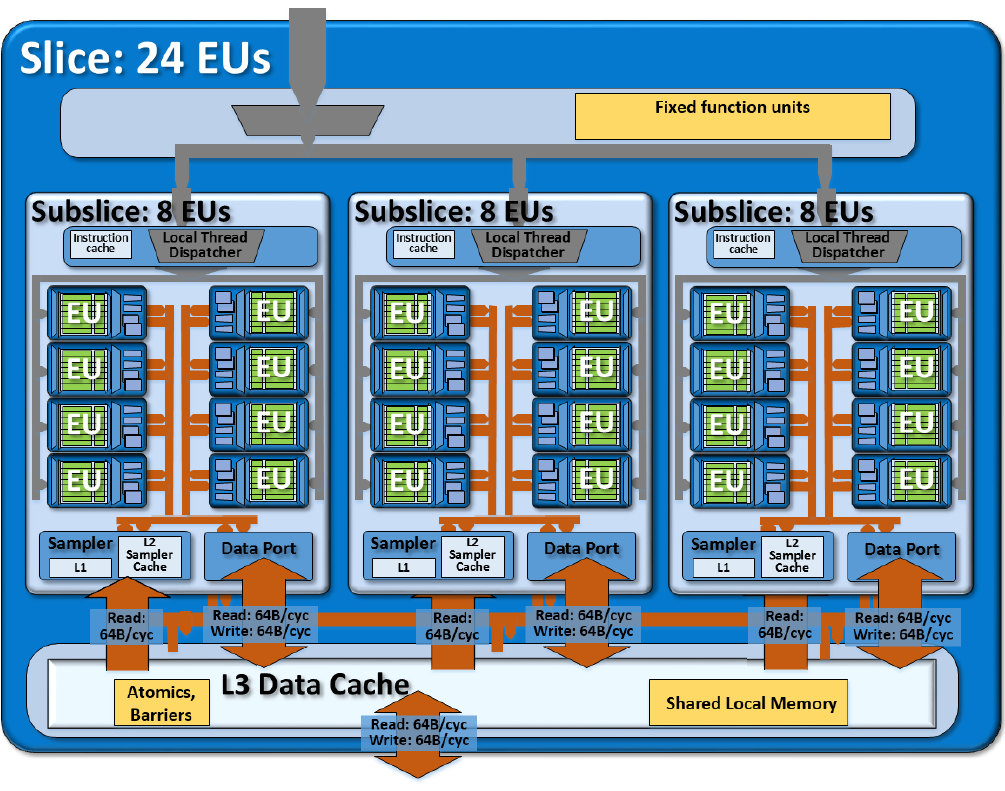
The Intel HD Graphics 520 (GT2) is an integrated graphics unit, which can be found in various ULV (Ultra Low Voltage) processors of the Skylake generation. This "GT2" version of the Skylake GPU offers 24 Execution Units (EUs) clocked at up to 1050 MHz (depending on the CPU model). Due to its lack of dedicated graphics memory or eDRAM cache, the HD 520 has to access the main memory (2x 64bit DDR3L-1600 / DDR4-2133).
Performance
The exact performance of the HD Graphics 520 depends on various factors like L3 cache size, memory configuration (DDR3/DDR4) and maximum clock rate of the specific model. The fastest versions (Core i7-6600U ) should perform similar to a dedicated GeForce 820M and will handle modern games (as of 2015) in low settings.
Features
The revised video engine now decodes H.265/HEVC completely in hardware and thereby much more efficiently than before. Displays can be connected via DP 1.2 / eDP 1.3 (max. 3840 x 2160 @ 60 Hz), whereas HDMI is limited to the older version 1.4a (max. 3840 x 2160 @ 30 Hz). However, HDMI 2.0 can be added using a DisplayPort converter. Up to three displays can be controlled simultaneously.
Power Consumption
The HD Graphics 520 can be found in mobile processors specified at 15 W TDP and is therefore suited for compact laptops and ultrabooks.
Intel Iris Pro Graphics P580 ► remove from comparison
The Intel Iris Pro Graphics P580 (GT4e) is an integrated professional graphics unit of the Skylake generation (top version). As successors of the Iris Graphics 6200 (Broadwell), the Iris P580 can be found in some high-end Xeon quad core CPUs and offers 128 MB of dedicated eDRAM memory. Furthermore, the so-called GT4e-version features 72 Execution Units (EUs). Besides the eDRAM cache, the Iris 580 is able to access the main memory (2x 64bit DDR3L-1600 / DDR4-2133).
Compared to the consumer Iris Pro Graphics 580 , the P580 is only included in the Xeon processors and intended for professional applications (certified drivers?) similar to the Quadro and Fire Pro lines.
Compared to the Iris Graphics 550 (28 W GT3e), the Iris Pro Graphics P580 offers more EUs (72 vs. 48) and a larger eDRAM Cache (128 vs. 64 MB).
Performance
The exact performance of the Iris Graphics P580 depends on memory configuration and CPU model (different clock speeds). However, it should be clearly faster than the old Broadwell Iris Pro 6200 and may compete with a dedicated GeForce 945M . Modern games of 2015/2016 should be playable in medium settings.
Features
The revised video engine now decodes H.265/HEVC completely in hardware and thereby much more efficiently than before. Displays can be connected via DP 1.2 / eDP 1.3 (max. 3840 x 2160 @ 60 Hz), whereas HDMI is limited to the older version 1.4 (max. 3840 x 2160 @ 30 Hz). However, HDMI 2.0 can be added using a DisplayPort converter. Up to three displays can be controlled simultaneously.
Power Consumption
The Iris Graphics P580 can be found in some mobile high-end quad core processors (45 W). Therefore, they are most likely not used in thin and light laptops.
Intel UHD Graphics 610 ► remove from comparison
The Intel UHD Graphics 610 (GT1) is an integrated graphics unit, which can be found in low-end ULV (Ultra Low Voltage) processors of the Whisky-Lake generation. This "GT1" version of the Skylake GPU offers 12 Execution Units (EUs) clocked at up to 950 MHz (depending on the CPU model). Due to its lack of dedicated graphics memory or eDRAM cache, the HD 610 has to access the main memory (2x 64bit DDR3L-1600 / DDR4-2133).
Performance
Depending on various factors like memory configuration, the UHD Graphics 610 should offer a similar performance as the similar Intel HD Graphics 610 and the old Skylake HD Graphics 510 and therefore can only handle non demanding games. E.g. Farming Simulator 17, World of Warships or Dota 2 Reborn can be played on low settings.
Features
The revised video engine now supports H.265/HEVC Main10 profile in hardware with 10 bit colors. Furthermore, Googles VP9 codec can also be hardware decoded. The Pentium chips should already support HDCP 2.2 and therefore Netflix 4K. HDMI 2.0 however is still only supported with an external converter chip (LSPCon).
Power Consumption
The UHD Graphics 610 can be found in mobile processors specified at 15 W TDP and is therefore suited for compact laptops and ultrabooks.
Intel HD Graphics 520 Intel Iris Pro Graphics P580 Intel UHD Graphics 610 Gen. 9 Series Codename Skylake GT2 Skylake GT4e Kaby Lake GT1 Architecture Gen. 9 Skylake Gen. 9 Skylake Gen. 9 Kaby Lake Pipelines 24 - unified 72 - unified 12 - unified Core Speed 300 - 1050 (Boost) MHz 350 - 1100 (Boost) MHz 300 - 950 (Boost) MHz Memory Bus Width 64/128 Bit eDRAM + 64/128 Bit 64/128 Bit Memory Type DDR3/DDR4 eDRAM DDR3/DDR4 Shared Memory yes yes yes API DirectX 12_1, OpenGL 4.4 DirectX 12_1, OpenGL 4.4 DirectX 12_1, OpenGL 4.4 technology 14 nm 14 nm 14 nm Features QuickSync QuickSync QuickSync Date of Announcement 01.09.2015 24.01.2016 01.01.2019 Max. Amount of Memory 128 MB
CPU in HD Graphics 520 GPU Base Speed GPU Boost / Turbo Intel Core i7-6600U 2 x 2600 MHz, 15 W 300 MHz 1050 MHz Intel Core i7-6500U 2 x 2500 MHz, 15 W 300 MHz 1050 MHz Intel Core i5-6300U 2 x 2400 MHz, 15 W 300 MHz 1000 MHz » show 3 more Intel Core i5-6200U 2 x 2300 MHz, 15 W 300 MHz 1000 MHz Intel Core i3-6100U 2 x 2300 MHz, 15 W 300 MHz 1000 MHz Intel Core i3-6006U 2 x 2000 MHz, 15 W 300 MHz 900 MHz min. - max. 300 MHz 900 - 1050 MHz
CPU in Iris Pro Graphics P580 GPU Base Speed GPU Boost / Turbo Intel Xeon E3-1575M v5 4 x 3000 MHz, 45 W 350 MHz 1100 MHz
CPU in UHD Graphics 610 GPU Base Speed GPU Boost / Turbo Intel Core i5-10200H 4 x 2400 MHz, 45 W 350 MHz 1050 MHz Intel Pentium Gold 6405U 2 x 2400 MHz, 15 W 300 MHz 900 MHz Intel Pentium Gold 5405U 2 x 2300 MHz, 15 W 300 MHz 950 MHz Intel Celeron 5205U 2 x 1900 MHz, 15 W 300 MHz 900 MHz min. - max. 300 - 350 MHz 900 - 1100 MHz
Benchmarks Performance Rating - 3DMark 11 + Fire Strike + Time Spy - HD Graphics 520
0.4 pt (1%)
...
...
max:
Performance Rating - 3DMark 11 + Fire Strike + Time Spy - UHD Graphics 610
0.3 pt (1%)
...
...
max:
3DMark - 3DMark Time Spy Score
297 Points (1%)
222 Points (1%)
3DMark - 3DMark Time Spy Graphics
263 Points (1%)
194 Points (1%)
3DMark - 3DMark Ice Storm Unlimited Graphics
min: 50874 avg: 70431 median: 73656 (8%) max: 88058 Points
min: 41521 avg: 42713 median: 42712.5 (5%) max: 43904 Points
3DMark - 3DMark Ice Storm Extreme Graphics
min: 27001 avg: 38067 median: 39969 (5%) max: 49514 Points
20443 Points (3%)
3DMark - 3DMark Cloud Gate Score
min: 3915 avg: 5379 median: 5357.5 (6%) max: 6737 Points
min: 4244 avg: 4334 median: 4333.5 (5%) max: 4423 Points
3DMark - 3DMark Cloud Gate Graphics
min: 4724 avg: 6747 median: 6700.5 (2%) max: 8842 Points
min: 5139 avg: 5277 median: 5276.5 (1%) max: 5414 Points
3DMark - 3DMark Fire Strike Standard Score
min: 536 avg: 748 median: 752 (1%) max: 961 Points
min: 597 avg: 616 median: 616 (1%) max: 635 Points
3DMark - 3DMark Fire Strike Standard Graphics
min: 564 avg: 800 median: 803.5 (1%) max: 1056 Points
min: 634 avg: 664 median: 663.5 (1%) max: 693 Points
3DMark - 3DMark Ice Storm Graphics
min: 633 avg: 56112 median: 56183 (7%) max: 82961 Points
min: 33154 avg: 36325 median: 36325 (4%) max: 39496 Points
3DMark - 3DMark Night Raid
2629 Points (2%)
3DMark - 3DMark Night Raid Graphics Score
2850 Points (1%)
3DMark 11 - 3DM11 Performance Score
min: 1135 avg: 1433 median: 1435.5 (2%) max: 1700 Points
min: 1026 avg: 1046 median: 1045.5 (1%) max: 1065 Points
3DMark 11 - 3DM11 Performance GPU
min: 1060 avg: 1296 median: 1293.5 (1%) max: 1520 Points
min: 915 avg: 923 median: 922.5 (1%) max: 930 Points
3DMark Vantage + Intel HD Graphics 520 3DMark Vantage - 3DM Vant. Perf. total
min: 4381 avg: 5299 median: 5722 (2%) max: 5884 Points
3DM Vant. Perf. total + Intel UHD Graphics 610
3996 Points (1%)
3DM Vant. Perf. GPU no PhysX + Intel HD Graphics 520 3DMark Vantage - 3DM Vant. Perf. GPU no PhysX
min: 3680 avg: 4547 median: 4966 (3%) max: 5052 Points
3DM Vant. Perf. GPU no PhysX + Intel UHD Graphics 610
3375 Points (2%)
3DMark 2001SE - 3DMark 2001 - Standard
min: 20229 avg: 23729 median: 23728.5 (25%) max: 27228 Points
3DMark 03 - 3DMark 03 - Standard
min: 14683 avg: 17873 median: 18240 (10%) max: 20522 Points
3DMark 05 - 3DMark 05 - Standard
min: 9082 avg: 11565 median: 10910 (12%) max: 15357 Points
12054 Points (13%)
3DMark 06 3DMark 06 - Standard 1280x1024 + Intel HD Graphics 520
min: 5463 avg: 8344 median: 8656 (11%) max: 9977 Points
3DMark 06 - Standard 1280x1024 + Intel UHD Graphics 610
min: 6026 avg: 6902 median: 6902 (9%) max: 7778 Points
3DMark 06 - Standard 1280x720 + Intel HD Graphics 520
6847 Points (9%)
Unigine Valley 1.0 - Unigine Valley 1.0 DX
min: 3 avg: 3.4 median: 3.4 (1%) max: 3.7 fps
Unigine Heaven 3.0 - Unigine Heaven 3.0 DX 11
10.2 fps (3%)
SPECviewperf 11 + Intel HD Graphics 520 SPECviewperf 11 - specvp11 snx-01
min: 2.06 avg: 2.3 median: 2.3 (1%) max: 2.58 fps
specvp11 tcvis-02 + Intel HD Graphics 520 SPECviewperf 11 - specvp11 tcvis-02
min: 2.32 avg: 2.9 median: 2.9 (2%) max: 3.45 fps
specvp11 sw-02 + Intel HD Graphics 520 SPECviewperf 11 - specvp11 sw-02
min: 13.26 avg: 15.9 median: 15.7 (12%) max: 18.81 fps
specvp11 proe-05 + Intel HD Graphics 520 SPECviewperf 11 - specvp11 proe-05
min: 1.99 avg: 2.4 median: 2.4 (3%) max: 2.81 fps
specvp11 maya-03 + Intel HD Graphics 520 SPECviewperf 11 - specvp11 maya-03
min: 10.4 avg: 17.4 median: 17.1 (13%) max: 23.97 fps
specvp11 lightwave-01 + Intel HD Graphics 520 SPECviewperf 11 - specvp11 lightwave-01
min: 15.49 avg: 19.4 median: 19.8 (21%) max: 23.36 fps
specvp11 ensight-04 + Intel HD Graphics 520 SPECviewperf 11 - specvp11 ensight-04
min: 2.39 avg: 2.9 median: 2.9 (1%) max: 3.3 fps
SPECviewperf 12 + Intel HD Graphics 520 SPECviewperf 12 - specvp12 sw-03
22.6 fps (6%)
specvp12 snx-02 + Intel HD Graphics 520 SPECviewperf 12 - specvp12 snx-02
3 fps (0%)
specvp12 showcase-01 + Intel HD Graphics 520 SPECviewperf 12 - specvp12 showcase-01
6.1 fps (1%)
specvp12 mediacal-01 + Intel HD Graphics 520 SPECviewperf 12 - specvp12 mediacal-01
1.7 fps (0%)
specvp12 maya-04 + Intel HD Graphics 520 SPECviewperf 12 - specvp12 maya-04
10.9 fps (3%)
specvp12 energy-01 + Intel HD Graphics 520 SPECviewperf 12 - specvp12 energy-01
0.1 fps (0%)
specvp12 creo-01 + Intel HD Graphics 520 SPECviewperf 12 - specvp12 creo-01
10.2 fps (4%)
specvp12 catia-04 + Intel HD Graphics 520 SPECviewperf 12 - specvp12 catia-04
11.6 fps (2%)
Cinebench R10 Cinebench R10 Shading (32bit) + Intel HD Graphics 520 Cinebench R10 - Cinebench R10 Shading (32bit)
min: 4559 avg: 7464 median: 7578 (5%) max: 9184 Points
Cinebench R10 Shading (32bit) + Intel UHD Graphics 610
min: 4516 avg: 5210 median: 5209.5 (4%) max: 5903 Points
Cinebench R11.5 Cinebench R11.5 OpenGL 64 Bit + Intel HD Graphics 520 Cinebench R11.5 - Cinebench R11.5 OpenGL 64 Bit
min: 7.25 avg: 29.5 median: 30.1 (10%) max: 41.82 fps
Cinebench R11.5 OpenGL 64 Bit + Intel UHD Graphics 610
17.3 fps (6%)
Cinebench R15 + Intel HD Graphics 520 Cinebench R15 - Cinebench R15 OpenGL 64 Bit
min: 23.59 avg: 36.7 median: 37 (2%) max: 45.76 fps
Cinebench R15 OpenGL 64 Bit + Intel UHD Graphics 610
min: 27.5 avg: 28.4 median: 28.4 (2%) max: 29.24 fps
Cinebench R15 OpenGL Ref. Match 64 Bit + Intel HD Graphics 520 Cinebench R15 - Cinebench R15 OpenGL Ref. Match 64 Bit
min: 97.7 avg: 97.8 median: 97.8 (98%) max: 97.9 %
Cinebench R15 OpenGL Ref. Match 64 Bit + Intel UHD Graphics 610
97.8 % (98%)
GFXBench - GFXBench 5.0 Aztec Ruins High Tier Offscreen
5.4 fps (1%)
GFXBench - GFXBench 5.0 Aztec Ruins Normal Tier Offscreen
15.3 fps (1%)
GFXBench - GFXBench Car Chase Offscreen
min: 16 avg: 18.5 median: 18.5 (2%) max: 21 fps
16.7 fps (2%)
GFXBench 3.1 - GFXBench Manhattan ES 3.1 Offscreen
min: 23.6 avg: 26.4 median: 26.4 (1%) max: 29.2 fps
23.1 fps (0%)
GFXBench 3.0 - GFXBench 3.0 Manhattan Offscreen
min: 33.8 avg: 42.1 median: 39.4 (2%) max: 55.6 fps
33.1 fps (2%)
GFXBench (DX / GLBenchmark) 2.7 + Intel HD Graphics 520 GFXBench (DX / GLBenchmark) 2.7 - GFXBench T-Rex HD Offscreen C24Z16
min: 76.8 avg: 92.2 median: 87.2 (1%) max: 117.7 fps
GFXBench T-Rex HD Offscreen C24Z16 + Intel UHD Graphics 610
71.9 fps (1%)
Basemark GPU 1.2 - Basemark GPU 1.2 Vulkan Official Medium Offscreen 1080
25.5 fps (0%)
LuxMark v2.0 64Bit - LuxMark v2.0 Room GPU
min: 132 avg: 187.5 median: 197 (1%) max: 224 Samples/s
min: 144 avg: 157 median: 157 (1%) max: 170 Samples/s
LuxMark v2.0 64Bit - LuxMark v2.0 Sala GPU
min: 418 avg: 473.8 median: 474 (1%) max: 529 Samples/s
min: 295 avg: 304.5 median: 304.5 (1%) max: 314 Samples/s
ComputeMark v2.1 - ComputeMark v2.1 Result
min: 777 avg: 839 median: 852 (1%) max: 895 Points
min: 480 avg: 481.5 median: 481.5 (1%) max: 483 Points
Power Consumption - Furmark Stress Test Power Consumption - external Monitor *
min: 18 avg: 23.1 median: 23.1 (3%) max: 28.2 Watt
Power Consumption - Witcher 3 Power Consumption *
25.6 Watt (6%)
Clock Speed - GPU Clock Speed Furmark
948 MHz (38%)
Average Benchmarks Intel HD Graphics 520 → 0% n= Average Benchmarks Intel UHD Graphics 610 → 0% n=
- Range of benchmark values for this graphics card
- Average benchmark values for this graphics card
* Smaller numbers mean a higher performance
1 This benchmark is not used for the average calculation
Game Benchmarks The following benchmarks stem from our benchmarks of review laptops. The performance depends on the used graphics memory, clock rate, processor, system settings, drivers, and operating systems. So the results don't have to be representative for all laptops with this GPU. For detailed information on the benchmark results, click on the fps number.
UHD Graphics 610:
19.7 [X] Nofflink M500-5405U 874931
Intel Pentium Gold 5405U 2.3GHz
UHD Graphics 610
min:
4 fps, P1:
11 fps, max:
23 fps
fps
UHD Graphics 610:
7.9 [X] Nofflink M500-5405U 874931
Intel Pentium Gold 5405U 2.3GHz
UHD Graphics 610
min:
2 fps, P1:
5 fps, max:
9 fps
fps
UHD Graphics 610:
6.3 [X] Nofflink M500-5405U 874931
Intel Pentium Gold 5405U 2.3GHz
UHD Graphics 610
min:
3 fps, P1:
4 fps, max:
7 fps
fps
UHD Graphics 610:
17.6 fps
UHD Graphics 610:
15.5 fps
UHD Graphics 610:
0 (!) fps
UHD Graphics 610:
30.4 fps
UHD Graphics 610:
21.9 fps
UHD Graphics 610:
16.6 fps
UHD Graphics 610:
16.9 fps
UHD Graphics 610:
10.4 fps
UHD Graphics 610:
7 8 ~ 8 fps
UHD Graphics 610:
18.3 [X] Nofflink M500-5405U 1.47.22.14 D3D12
Intel Pentium Gold 5405U 2.3GHz
UHD Graphics 610
min:
5 fps, P1:
6.15 fps, max:
195.1 fps
fps
UHD Graphics 610:
7.7 [X] Nofflink M500-5405U 1.47.22.14 D3D12
Intel Pentium Gold 5405U 2.3GHz
UHD Graphics 610
min:
5 fps, P1:
5 fps, max:
169.3 fps
fps
UHD Graphics 610:
10 [X] Nofflink M500-5405U 1.47.22.14 D3D12
Intel Pentium Gold 5405U 2.3GHz
UHD Graphics 610
min:
5 fps, P1:
5 fps, max:
151.2 fps
fps
UHD Graphics 610:
13.6 [X] Nofflink M500-5405U 1.47.22.14 D3D12
Intel Pentium Gold 5405U 2.3GHz
UHD Graphics 610
min:
5 fps, P1:
5 fps, max:
158.2 fps
fps
UHD Graphics 610:
7 8 ~ 8 fps
100%
HD Graphics 520:
18.8 fps
53%
UHD Graphics 610:
9.6 10.9 ~ 10 fps
100%
HD Graphics 520:
12.6 fps
71%
UHD Graphics 610:
7.5 10.5 ~ 9 fps
UHD Graphics 610:
6.9 7.3 ~ 7 fps
100%
HD Graphics 520:
10.3 fps
100%
HD Graphics 520:
5 fps
100%
HD Graphics 520:
7 fps
110%
UHD Graphics 610:
7.7 fps
100%
HD Graphics 520:
25.8 fps
92%
UHD Graphics 610:
23.8 (!) [X] Lenovo V340-17IWL 81RG001YGE Intel Pentium Gold 5405U 2.3GHz
UHD Graphics 610
min:
7 fps, max:
36 fps
fps
100%
HD Graphics 520:
7.1 fps
100%
HD Graphics 520:
14.6 fps
100%
HD Graphics 520:
4.9 fps
100%
HD Graphics 520:
10.8 fps
100%
HD Graphics 520:
6.2 fps
100%
HD Graphics 520:
20.9 fps
100%
HD Graphics 520:
14.2 fps
100%
HD Graphics 520:
8 fps
100%
HD Graphics 520:
5 fps
100%
HD Graphics 520:
9.7 fps
100%
HD Graphics 520:
10.1 fps
100%
HD Graphics 520:
5.2 fps
100%
HD Graphics 520:
9 fps
100%
HD Graphics 520:
4.6 fps
100%
HD Graphics 520:
15 fps
93%
UHD Graphics 610:
14 fps
100%
HD Graphics 520:
7 fps
100%
HD Graphics 520:
10 [X] Asus ASUSPRO P541UA-GQ1532 Intel Core i3-6006U 2GHz
HD Graphics 520
fps
100%
HD Graphics 520:
23 [X] Asus ASUSPRO P541UA-GQ1532 Intel Core i3-6006U 2GHz
HD Graphics 520
fps
100%
HD Graphics 520:
12.4 [X] Asus ASUSPRO P541UA-GQ1532 Intel Core i3-6006U 2GHz
HD Graphics 520
fps
100%
HD Graphics 520:
51 [X] Asus ASUSPRO P541UA-GQ1532 Intel Core i3-6006U 2GHz
HD Graphics 520
fps
100%
HD Graphics 520:
48 [X] Asus ASUSPRO P541UA-GQ1532 Intel Core i3-6006U 2GHz
HD Graphics 520
fps
100%
HD Graphics 520:
33.7 [X] Asus ASUSPRO P541UA-GQ1532 Intel Core i3-6006U 2GHz
HD Graphics 520
fps
100%
HD Graphics 520:
48.5 [X] Asus ASUSPRO P541UA-GQ1532 Intel Core i3-6006U 2GHz
HD Graphics 520
fps
42%
UHD Graphics 610:
20.3 fps
100%
HD Graphics 520:
20 [X] Asus ASUSPRO P541UA-GQ1532 Intel Core i3-6006U 2GHz
HD Graphics 520
fps
100%
HD Graphics 520:
18.6 fps
100%
HD Graphics 520:
6.5 fps
100%
HD Graphics 520:
6.6 fps
100%
HD Graphics 520:
2.9 fps
100%
HD Graphics 520:
7.4 fps
100%
HD Graphics 520:
23.2 [X] Asus ASUSPRO P541UA-GQ1532 Intel Core i3-6006U 2GHz
HD Graphics 520
fps
100%
HD Graphics 520:
5.6 fps
100%
HD Graphics 520:
3.1 fps
100%
HD Graphics 520:
33.1 fps
100%
HD Graphics 520:
23.9 fps
100%
HD Graphics 520:
8.5 fps
100%
HD Graphics 520:
12 fps
100%
HD Graphics 520:
30.1 fps
100%
HD Graphics 520:
15.7 fps
100%
HD Graphics 520:
7.3 fps
100%
HD Graphics 520:
6.5 fps
100%
HD Graphics 520:
27.9 fps
100%
HD Graphics 520:
10 fps
100%
HD Graphics 520:
7.6 [X] Microsoft Surface Pro 4, Core i5, 256GB Intel Core i5-6300U 2.4GHz
HD Graphics 520
min:
4 fps, max:
10 fps
8.2 ~ 8 fps
100%
HD Graphics 520:
6.1 fps
100%
HD Graphics 520:
60.8 62.3 [X] Microsoft Surface Pro 4, Core i5, 256GB Intel Core i5-6300U 2.4GHz
HD Graphics 520
~ 62 fps
100%
HD Graphics 520:
50 fps
100%
HD Graphics 520:
6 8.8 ~ 7 fps
100%
HD Graphics 520:
27.4 fps
100%
HD Graphics 520:
13.7 fps
71%
UHD Graphics 610:
24.8 fps
100%
HD Graphics 520:
24.8 25 ~ 25 fps
71%
UHD Graphics 610:
17.7 fps
100%
HD Graphics 520:
21.3 fps
100%
HD Graphics 520:
17.3 fps
100%
HD Graphics 520:
9.9 fps
100%
HD Graphics 520:
15.2 fps
100%
HD Graphics 520:
13.5 fps
100%
HD Graphics 520:
11.5 [X] no model Intel Core i5-6200U 2.3GHz
HD Graphics 520
20.4 ~ 16 fps
100%
HD Graphics 520:
12.8 [X] no model Intel Core i5-6200U 2.3GHz
HD Graphics 520
14.5 ~ 14 fps
100%
HD Graphics 520:
11.4 fps
100%
HD Graphics 520:
5 fps
100%
HD Graphics 520:
3.7 fps
100%
HD Graphics 520:
15 15 ~ 15 fps
100%
HD Graphics 520:
7 7 ~ 7 fps
100%
HD Graphics 520:
6 fps
100%
HD Graphics 520:
4 fps
100%
HD Graphics 520:
14.9 16.2 [X] no model Intel Core i5-6200U 2.3GHz
HD Graphics 520
16.3 ~ 16 fps
100%
HD Graphics 520:
5.2 6 [X] no model Intel Core i5-6200U 2.3GHz
HD Graphics 520
~ 6 fps
100%
HD Graphics 520:
2.9 fps
100%
HD Graphics 520:
9.3 fps
76%
UHD Graphics 610:
24.2 fps
76%
UHD Graphics 610:
15.1 fps
100%
HD Graphics 520:
11.6 fps
100%
HD Graphics 520:
9.1 fps
100%
HD Graphics 520:
16.7 fps
100%
HD Graphics 520:
6.2 fps
100%
HD Graphics 520:
3.8 fps
100%
HD Graphics 520:
20.9 [X] Medion Akoya E6422 Intel Core i3-6100U 2.3GHz
HD Graphics 520
26 29.9 34.3 ~ 28 fps
100%
HD Graphics 520:
12.3 [X] Medion Akoya E6422 Intel Core i3-6100U 2.3GHz
HD Graphics 520
15 16.1 18.4 ~ 15 fps
100%
HD Graphics 520:
13.2 13.6 18.8 [X] HP ProBook 430 G3 P5T00ES Dual-Channel
Intel Core i5-6200U 2.3GHz
HD Graphics 520
~ 15 fps
100%
HD Graphics 520:
8.6 9.1 11.4 [X] HP ProBook 430 G3 P5T00ES Dual-Channel
Intel Core i5-6200U 2.3GHz
HD Graphics 520
~ 10 fps
100%
HD Graphics 520:
17.2 22 [X] HP ProBook 430 G3 P5T00ES Dual-Channel
Intel Core i5-6200U 2.3GHz
HD Graphics 520
~ 20 fps
100%
HD Graphics 520:
9.7 12 [X] HP ProBook 430 G3 P5T00ES Dual-Channel
Intel Core i5-6200U 2.3GHz
HD Graphics 520
~ 11 fps
100%
HD Graphics 520:
8.2 32.2 ~ 20 fps
100%
HD Graphics 520:
5.3 16.2 ~ 11 fps
100%
HD Graphics 520:
6.4 fps
100%
HD Graphics 520:
25 29 36.9 37.1 [X] Medion Akoya E6422 Intel Core i3-6100U 2.3GHz
HD Graphics 520
44 48.8 62.5 63.5 [X] HP ProBook 430 G3 P5T00ES Dual-Channel
Intel Core i5-6200U 2.3GHz
HD Graphics 520
65.8 [X] Medion Akoya E6422 Dual-Channel
Intel Core i3-6100U 2.3GHz
HD Graphics 520
~ 46 fps
100%
HD Graphics 520:
22 (!) 24 [X] Medion Akoya E6422 Intel Core i3-6100U 2.3GHz
HD Graphics 520
25 31.4 34.4 [X] Medion Akoya E6422 Dual-Channel
Intel Core i3-6100U 2.3GHz
HD Graphics 520
39.4 39.7 [X] HP ProBook 430 G3 P5T00ES Dual-Channel
Intel Core i5-6200U 2.3GHz
HD Graphics 520
~ 31 fps
100%
HD Graphics 520:
13.4 [X] Medion Akoya E6422 Intel Core i3-6100U 2.3GHz
HD Graphics 520
20.9 [X] Medion Akoya E6422 Dual-Channel
Intel Core i3-6100U 2.3GHz
HD Graphics 520
21.8 [X] HP ProBook 430 G3 P5T00ES Dual-Channel
Intel Core i5-6200U 2.3GHz
HD Graphics 520
~ 19 fps
100%
HD Graphics 520:
45.2 69.2 [X] HP ProBook 430 G3 P5T00ES Dual-Channel
Intel Core i5-6200U 2.3GHz
HD Graphics 520
71 80 ~ 66 fps
100%
HD Graphics 520:
32.1 45.3 46.1 47 [X] HP ProBook 430 G3 P5T00ES Dual-Channel
Intel Core i5-6200U 2.3GHz
HD Graphics 520
~ 43 fps
100%
HD Graphics 520:
15.9 22 [X] HP ProBook 430 G3 P5T00ES Dual-Channel
Intel Core i5-6200U 2.3GHz
HD Graphics 520
22.3 ~ 20 fps
100%
HD Graphics 520:
11.8 15.9 [X] HP ProBook 430 G3 P5T00ES Dual-Channel
Intel Core i5-6200U 2.3GHz
HD Graphics 520
16.1 ~ 15 fps
100%
HD Graphics 520:
28.6 29.8 43.3 43.7 45 [X] HP ProBook 430 G3 P5T00ES Dual-Channel
Intel Core i5-6200U 2.3GHz
HD Graphics 520
45.4 ~ 39 fps
100%
HD Graphics 520:
18.3 25.9 27.2 28.2 [X] HP ProBook 430 G3 P5T00ES Dual-Channel
Intel Core i5-6200U 2.3GHz
HD Graphics 520
28.3 29.7 30 [X] HP Envy 13-d004ng Intel Core i7-6500U 2.5GHz
HD Graphics 520
~ 27 fps
100%
HD Graphics 520:
9.6 11.2 [X] HP Envy 13-d004ng Intel Core i7-6500U 2.5GHz
HD Graphics 520
11.3 11.5 16.2 ~ 12 fps
100%
HD Graphics 520:
9.3 fps
100%
HD Graphics 520:
20.5 20.6 [X] no model Intel Core i5-6200U 2.3GHz
HD Graphics 520
~ 21 fps
100%
HD Graphics 520:
8.7 [X] no model Intel Core i5-6200U 2.3GHz
HD Graphics 520
10 ~ 9 fps
100%
HD Graphics 520:
48.3 fps
100%
HD Graphics 520:
25.8 fps
100%
HD Graphics 520:
22.4 fps
49%
UHD Graphics 610:
9.7 11.6 ~ 11 fps
83%
UHD Graphics 610:
9.2 11.3 [X] Nofflink M500-5405U Intel Pentium Gold 5405U 2.3GHz
UHD Graphics 610
min:
1.234 fps, P0.1:
2.27 fps, P1:
5.1 fps, max:
60.3 fps
~ 10 fps
110%
UHD Graphics 610:
7.7 [X] Nofflink M500-5405U Intel Pentium Gold 5405U 2.3GHz
UHD Graphics 610
min:
6.08 fps, P0.1:
6.31 fps, P1:
7.15 fps, max:
8.32 fps
fps
100%
HD Graphics 520:
3.8 fps
110%
UHD Graphics 610:
4.2 [X] Nofflink M500-5405U Intel Pentium Gold 5405U 2.3GHz
UHD Graphics 610
min:
3.82 fps, P0.1:
3.85 fps, P1:
4.05 fps, max:
4.39 fps
fps
100%
HD Graphics 520:
13 13.3 18.5 19.2 [X] Medion Akoya E6422 Intel Core i3-6100U 2.3GHz
HD Graphics 520
19.9 20 20.1 21 23.6 25 [X] Medion Akoya E6422 Dual-Channel
Intel Core i3-6100U 2.3GHz
HD Graphics 520
25 25.7 [X] HP ProBook 430 G3 P5T00ES Dual-Channel
Intel Core i5-6200U 2.3GHz
HD Graphics 520
26.6 26.7 ~ 21 fps
100%
HD Graphics 520:
12.5 12.5 [X] HP ProBook 430 G3 P5T00ES Dual-Channel
Intel Core i5-6200U 2.3GHz
HD Graphics 520
12.5 12.5 [X] Medion Akoya E6422 Dual-Channel
Intel Core i3-6100U 2.3GHz
HD Graphics 520
12.5 [X] Medion Akoya E6422 Intel Core i3-6100U 2.3GHz
HD Graphics 520
12.5 12.5 12.5 12.5 12.7 13 15 ~ 13 fps
100%
HD Graphics 520:
12.5 12.5 [X] HP ProBook 430 G3 P5T00ES Dual-Channel
Intel Core i5-6200U 2.3GHz
HD Graphics 520
12.5 12.5 [X] Medion Akoya E6422 Dual-Channel
Intel Core i3-6100U 2.3GHz
HD Graphics 520
12.5 [X] Medion Akoya E6422 Intel Core i3-6100U 2.3GHz
HD Graphics 520
12.5 12.5 ~ 13 fps
100%
HD Graphics 520:
34 35 ~ 35 fps
66%
UHD Graphics 610:
17.9 28.5 [X] Nofflink M500-5405U Intel Pentium Gold 5405U 2.3GHz
UHD Graphics 610
min:
9.02 fps, P1:
18.2 fps, max:
49.6 fps
~ 23 fps
75%
UHD Graphics 610:
16.7 25.4 [X] Nofflink M500-5405U Intel Pentium Gold 5405U 2.3GHz
UHD Graphics 610
min:
11 fps, P1:
15.2 fps, max:
41.5 fps
~ 21 fps
100%
HD Graphics 520:
6.9 7 ~ 7 fps
85%
UHD Graphics 610:
6 [X] Nofflink M500-5405U Intel Pentium Gold 5405U 2.3GHz
UHD Graphics 610
min:
0.798 fps, P1:
4.46 fps, max:
19.1 fps
fps
100%
HD Graphics 520:
30.6 36.2 42 47.7 [X] HP ProBook 430 G3 P5T00ES Dual-Channel
Intel Core i5-6200U 2.3GHz
HD Graphics 520
50.1 ~ 41 fps
100%
HD Graphics 520:
21.7 26 27.9 33.4 33.5 [X] HP ProBook 430 G3 P5T00ES Dual-Channel
Intel Core i5-6200U 2.3GHz
HD Graphics 520
~ 29 fps
100%
HD Graphics 520:
7.3 8 10.1 10.3 11.9 [X] HP ProBook 430 G3 P5T00ES Dual-Channel
Intel Core i5-6200U 2.3GHz
HD Graphics 520
~ 10 fps
100%
HD Graphics 520:
3.9 5.4 6.2 [X] HP ProBook 430 G3 P5T00ES Dual-Channel
Intel Core i5-6200U 2.3GHz
HD Graphics 520
~ 5 fps
100%
HD Graphics 520:
11.1 fps
100%
HD Graphics 520:
8 fps
100%
HD Graphics 520:
17.2 28.6 [X] HP ProBook 430 G3 P5T00ES Dual-Channel
Intel Core i5-6200U 2.3GHz
HD Graphics 520
~ 23 fps
100%
HD Graphics 520:
11.7 18.9 [X] HP ProBook 430 G3 P5T00ES Dual-Channel
Intel Core i5-6200U 2.3GHz
HD Graphics 520
~ 15 fps
100%
HD Graphics 520:
4.5 fps
100%
HD Graphics 520:
2.1 fps
100%
HD Graphics 520:
48 61 [X] HP ProBook 430 G3 P5T00ES Dual-Channel
Intel Core i5-6200U 2.3GHz
HD Graphics 520
~ 55 fps
100%
HD Graphics 520:
31 51 [X] HP ProBook 430 G3 P5T00ES Dual-Channel
Intel Core i5-6200U 2.3GHz
HD Graphics 520
~ 41 fps
100%
HD Graphics 520:
16 32 [X] HP ProBook 430 G3 P5T00ES Dual-Channel
Intel Core i5-6200U 2.3GHz
HD Graphics 520
~ 24 fps
100%
HD Graphics 520:
12.5 16 [X] HP ProBook 430 G3 P5T00ES Dual-Channel
Intel Core i5-6200U 2.3GHz
HD Graphics 520
~ 14 fps
100%
HD Graphics 520:
32.8 45.7 [X] HP ProBook 430 G3 P5T00ES Dual-Channel
Intel Core i5-6200U 2.3GHz
HD Graphics 520
~ 39 fps
100%
HD Graphics 520:
20.7 27.5 [X] HP ProBook 430 G3 P5T00ES Dual-Channel
Intel Core i5-6200U 2.3GHz
HD Graphics 520
~ 24 fps
100%
HD Graphics 520:
28.8 [X] no model Intel Core i5-6200U 2.3GHz
HD Graphics 520
29.8 ~ 29 fps
100%
HD Graphics 520:
18.2 [X] no model Intel Core i5-6200U 2.3GHz
HD Graphics 520
19 ~ 19 fps
100%
HD Graphics 520:
9.7 [X] no model Intel Core i5-6200U 2.3GHz
HD Graphics 520
10 ~ 10 fps
100%
HD Graphics 520:
35.6 fps
100%
HD Graphics 520:
21.3 fps
100%
HD Graphics 520:
140.4 162 164.8 176.8 [X] HP ProBook 430 G3 P5T00ES Dual-Channel
Intel Core i5-6200U 2.3GHz
HD Graphics 520
182.6 ~ 165 fps
100%
HD Graphics 520:
33 40.5 46.7 49.4 [X] HP ProBook 430 G3 P5T00ES Dual-Channel
Intel Core i5-6200U 2.3GHz
HD Graphics 520
54.2 ~ 45 fps
100%
HD Graphics 520:
15.1 16.6 21.8 25.3 [X] HP ProBook 430 G3 P5T00ES Dual-Channel
Intel Core i5-6200U 2.3GHz
HD Graphics 520
26.5 ~ 21 fps
100%
HD Graphics 520:
7.7 11.3 15.6 17.1 [X] HP ProBook 430 G3 P5T00ES Dual-Channel
Intel Core i5-6200U 2.3GHz
HD Graphics 520
~ 13 fps
100%
HD Graphics 520:
24.6 fps
100%
HD Graphics 520:
16.5 fps
100%
HD Graphics 520:
5.1 fps
100%
HD Graphics 520:
73.4 74 [X] Dell Vostro 3568 PL Intel Core i3-6100U 2.3GHz
HD Graphics 520
75 [X] Lenovo E31-80 PL Intel Core i5-6200U 2.3GHz
HD Graphics 520
78.1 92.2 [X] Fujitsu Lifebook E746 VFY:E7460M85ABPL Intel Core i5-6200U 2.3GHz
HD Graphics 520
105.1 [X] HP ProBook 430 G3 P5T00ES Dual-Channel
Intel Core i5-6200U 2.3GHz
HD Graphics 520
114.2 [X] Asus B8430UA-FA0203E Intel Core i5-6200U 2.3GHz
HD Graphics 520
121.6 [X] Toshiba Tecra Z50-C-114 Intel Core i5-6200U 2.3GHz
HD Graphics 520
121.8 [X] Lenovo ThinkPad T460 20FNV402PB Intel Core i5-6200U 2.3GHz
HD Graphics 520
135.1 [X] Dell Latitude E7470 N001LE747014EMEA Intel Core i5-6300U 2.4GHz
HD Graphics 520
151.2 [X] Asus ASUSPRO P2530UA-DM0046E Intel Core i7-6500U 2.5GHz
HD Graphics 520
~ 104 fps
100%
HD Graphics 520:
28.4 [X] Dell Vostro 3568 PL Intel Core i3-6100U 2.3GHz
HD Graphics 520
28.7 30 [X] Lenovo E31-80 PL Intel Core i5-6200U 2.3GHz
HD Graphics 520
30.5 37.1 [X] Fujitsu Lifebook E746 VFY:E7460M85ABPL Intel Core i5-6200U 2.3GHz
HD Graphics 520
41 [X] Asus B8430UA-FA0203E Intel Core i5-6200U 2.3GHz
HD Graphics 520
42.3 [X] Toshiba Tecra Z50-C-114 Intel Core i5-6200U 2.3GHz
HD Graphics 520
43.7 [X] HP ProBook 430 G3 P5T00ES Dual-Channel
Intel Core i5-6200U 2.3GHz
HD Graphics 520
45.4 [X] Lenovo ThinkPad T460 20FNV402PB Intel Core i5-6200U 2.3GHz
HD Graphics 520
47.3 [X] Dell Latitude E7470 N001LE747014EMEA Intel Core i5-6300U 2.4GHz
HD Graphics 520
55 [X] Asus ASUSPRO P2530UA-DM0046E Intel Core i7-6500U 2.5GHz
HD Graphics 520
~ 39 fps
100%
HD Graphics 520:
14 16.5 [X] Lenovo E31-80 PL Intel Core i5-6200U 2.3GHz
HD Graphics 520
16.9 19.8 [X] Fujitsu Lifebook E746 VFY:E7460M85ABPL Intel Core i5-6200U 2.3GHz
HD Graphics 520
20.4 [X] Asus B8430UA-FA0203E Intel Core i5-6200U 2.3GHz
HD Graphics 520
21.8 [X] HP ProBook 430 G3 P5T00ES Dual-Channel
Intel Core i5-6200U 2.3GHz
HD Graphics 520
22.6 [X] Toshiba Tecra Z50-C-114 Intel Core i5-6200U 2.3GHz
HD Graphics 520
23 [X] Lenovo ThinkPad T460 20FNV402PB Intel Core i5-6200U 2.3GHz
HD Graphics 520
24.3 [X] Dell Latitude E7470 N001LE747014EMEA Intel Core i5-6300U 2.4GHz
HD Graphics 520
25.6 [X] Asus ASUSPRO P2530UA-DM0046E Intel Core i7-6500U 2.5GHz
HD Graphics 520
~ 20 fps
100%
HD Graphics 520:
12.5 12.5 [X] HP ProBook 430 G3 P5T00ES Dual-Channel
Intel Core i5-6200U 2.3GHz
HD Graphics 520
12.5 12.6 [X] Dell Latitude E7470 N001LE747014EMEA Intel Core i5-6300U 2.4GHz
HD Graphics 520
~ 13 fps
100%
HD Graphics 520:
17 25.4 26.6 [X] Dell Latitude 3470 N2P7L347014EMEA Intel Core i5-6200U 2.3GHz
HD Graphics 520
30.2 [X] HP ProBook 650 G2 T8X61EA Intel Core i5-6200U 2.3GHz
HD Graphics 520
33.1 [X] HP EliteBook 820 G3 T8X20EA Intel Core i5-6200U 2.3GHz
HD Graphics 520
35.1 [X] HP EliteBook 840 G3 T8X41EA Intel Core i7-6600U 2.6GHz
HD Graphics 520
41.6 [X] Toshiba Portege Z30-C-125 Intel Core i7-6500U 2.5GHz
HD Graphics 520
43.5 [X] HP ProBook 640 G2 T8T61EA Intel Core i5-6200U 2.3GHz
HD Graphics 520
43.6 [X] Lenovo ThinkPad T560 20FH001APB Intel Core i7-6600U 2.6GHz
HD Graphics 520
47.4 [X] Fujitsu LifeBook S936 PL Intel Core i7-6600U 2.6GHz
HD Graphics 520
50.4 [X] Lenovo ThinkPad T460s 20FA003FPB Intel Core i7-6600U 2.6GHz
HD Graphics 520
53.6 [X] Toshiba Tecra Z40-C-11F Intel Core i7-6600U 2.6GHz
HD Graphics 520
53.6 [X] HP EliteBook 850 G3 T9G19EA Intel Core i5-6200U 2.3GHz
HD Graphics 520
56.7 [X] Fujitsu LifeBook A556 PL Intel Core i5-6200U 2.3GHz
HD Graphics 520
61.1 [X] Fujitsu LifeBook E736 E7360M27BBPL Intel Core i7-6600U 2.6GHz
HD Graphics 520
62.8 [X] Dell Latitude 12 E7270 PL Intel Core i7-6600U 2.6GHz
HD Graphics 520
~ 43 fps
100%
HD Graphics 520:
14 18.6 20.5 [X] Dell Latitude 3470 N2P7L347014EMEA Intel Core i5-6200U 2.3GHz
HD Graphics 520
22.8 [X] HP ProBook 650 G2 T8X61EA Intel Core i5-6200U 2.3GHz
HD Graphics 520
25.4 [X] HP EliteBook 820 G3 T8X20EA Intel Core i5-6200U 2.3GHz
HD Graphics 520
26.6 [X] HP EliteBook 840 G3 T8X41EA Intel Core i7-6600U 2.6GHz
HD Graphics 520
30 [X] Toshiba Portege Z30-C-125 Intel Core i7-6500U 2.5GHz
HD Graphics 520
30.9 [X] Lenovo ThinkPad T560 20FH001APB Intel Core i7-6600U 2.6GHz
HD Graphics 520
33.2 [X] HP ProBook 640 G2 T8T61EA Intel Core i5-6200U 2.3GHz
HD Graphics 520
35.1 [X] Fujitsu LifeBook S936 PL Intel Core i7-6600U 2.6GHz
HD Graphics 520
37.8 [X] Lenovo ThinkPad T460s 20FA003FPB Intel Core i7-6600U 2.6GHz
HD Graphics 520
40.2 [X] HP EliteBook 850 G3 T9G19EA Intel Core i5-6200U 2.3GHz
HD Graphics 520
40.8 [X] Toshiba Tecra Z40-C-11F Intel Core i7-6600U 2.6GHz
HD Graphics 520
41.1 [X] Fujitsu LifeBook A556 PL Intel Core i5-6200U 2.3GHz
HD Graphics 520
44.3 [X] Fujitsu LifeBook E736 E7360M27BBPL Intel Core i7-6600U 2.6GHz
HD Graphics 520
45.1 [X] Dell Latitude 12 E7270 PL Intel Core i7-6600U 2.6GHz
HD Graphics 520
~ 32 fps
100%
HD Graphics 520:
10 17.6 [X] Dell Latitude 3470 N2P7L347014EMEA Intel Core i5-6200U 2.3GHz
HD Graphics 520
19.7 [X] HP ProBook 650 G2 T8X61EA Intel Core i5-6200U 2.3GHz
HD Graphics 520
21.4 [X] HP EliteBook 820 G3 T8X20EA Intel Core i5-6200U 2.3GHz
HD Graphics 520
22.5 [X] HP EliteBook 840 G3 T8X41EA Intel Core i7-6600U 2.6GHz
HD Graphics 520
25 [X] Toshiba Portege Z30-C-125 Intel Core i7-6500U 2.5GHz
HD Graphics 520
25.5 [X] Lenovo ThinkPad T560 20FH001APB Intel Core i7-6600U 2.6GHz
HD Graphics 520
27.2 [X] HP ProBook 640 G2 T8T61EA Intel Core i5-6200U 2.3GHz
HD Graphics 520
28.6 [X] Fujitsu LifeBook S936 PL Intel Core i7-6600U 2.6GHz
HD Graphics 520
30.8 [X] Lenovo ThinkPad T460s 20FA003FPB Intel Core i7-6600U 2.6GHz
HD Graphics 520
32.2 [X] HP EliteBook 850 G3 T9G19EA Intel Core i5-6200U 2.3GHz
HD Graphics 520
32.2 [X] Fujitsu LifeBook A556 PL Intel Core i5-6200U 2.3GHz
HD Graphics 520
32.7 [X] Toshiba Tecra Z40-C-11F Intel Core i7-6600U 2.6GHz
HD Graphics 520
34.4 [X] Fujitsu LifeBook E736 E7360M27BBPL Intel Core i7-6600U 2.6GHz
HD Graphics 520
34.8 [X] Dell Latitude 12 E7270 PL Intel Core i7-6600U 2.6GHz
HD Graphics 520
~ 26 fps
100%
HD Graphics 520:
4 4.1 [X] Toshiba Portege Z30-C-125 Intel Core i7-6500U 2.5GHz
HD Graphics 520
4.2 [X] HP ProBook 640 G2 T8T61EA Intel Core i5-6200U 2.3GHz
HD Graphics 520
4.5 [X] HP EliteBook 850 G3 T9G19EA Intel Core i5-6200U 2.3GHz
HD Graphics 520
4.7 [X] Dell Latitude 12 E7270 PL Intel Core i7-6600U 2.6GHz
HD Graphics 520
4.7 [X] Toshiba Tecra Z40-C-11F Intel Core i7-6600U 2.6GHz
HD Graphics 520
4.7 [X] Fujitsu LifeBook S936 PL Intel Core i7-6600U 2.6GHz
HD Graphics 520
5 [X] Fujitsu LifeBook E736 E7360M27BBPL Intel Core i7-6600U 2.6GHz
HD Graphics 520
7 [X] HP ProBook 650 G2 T8X61EA Intel Core i5-6200U 2.3GHz
HD Graphics 520
7.8 [X] HP EliteBook 840 G3 T8X41EA Intel Core i7-6600U 2.6GHz
HD Graphics 520
8 [X] Lenovo ThinkPad T560 20FH001APB Intel Core i7-6600U 2.6GHz
HD Graphics 520
9.1 [X] Lenovo ThinkPad T460s 20FA003FPB Intel Core i7-6600U 2.6GHz
HD Graphics 520
~ 6 fps
100%
HD Graphics 520:
6.2 6.5 [X] no model Intel Core i5-6200U 2.3GHz
HD Graphics 520
~ 6 fps
100%
HD Graphics 520:
25 [X] HP ProBook 430 G3 P4N86EA Intel Core i5-6200U 2.3GHz
HD Graphics 520
28.9 29.1 29.4 29.7 30 30 30.2 31.1 [X] Dell Latitude 3470 N2P7L347014EMEA Intel Core i5-6200U 2.3GHz
HD Graphics 520
31.3 32.3 32.5 32.7 33.1 33.5 33.9 [X] HP ProBook 440 G3 PL Intel Core i5-6200U 2.3GHz
HD Graphics 520
33.9 [X] Dell Vostro 3568 PL Intel Core i3-6100U 2.3GHz
HD Graphics 520
34.9 [X] HP ProBook 650 G2 T8X61EA Intel Core i5-6200U 2.3GHz
HD Graphics 520
35.3 35.4 35.4 35.6 35.6 [X] Lenovo E31-80 PL Intel Core i5-6200U 2.3GHz
HD Graphics 520
35.7 [X] Toshiba Portege Z30-C-125 Intel Core i7-6500U 2.5GHz
HD Graphics 520
35.9 36.2 36.4 [X] HP EliteBook 820 G3 T8X20EA Intel Core i5-6200U 2.3GHz
HD Graphics 520
36.4 36.4 36.5 37 37 [X] Tuxedo InfinityBook 13 v2 Intel Core i7-6500U 2.5GHz
HD Graphics 520
37.3 [X] Lenovo ThinkPad T560 20FH001APB Intel Core i7-6600U 2.6GHz
HD Graphics 520
37.4 37.5 37.7 38 38.2 38.3 38.7 [X] HP 17-x066ng Intel Core i3-6006U @2GHz
HD Graphics 520
40 [X] HP EliteBook 840 G3 T8X41EA Intel Core i7-6600U 2.6GHz
HD Graphics 520
40.9 42 42.2 42.6 42.8 43 [X] Asus B8430UA-FA0203E Intel Core i5-6200U 2.3GHz
HD Graphics 520
43 43.4 43.7 44 44 44.1 44.6 [X] Fujitsu Lifebook E746 VFY:E7460M85ABPL Intel Core i5-6200U 2.3GHz
HD Graphics 520
45.2 46.3 46.3 46.8 46.8 47.3 47.6 47.6 48 48.3 48.3 48.4 [X] Lenovo ThinkPad T460 20FNV402PB Intel Core i5-6200U 2.3GHz
HD Graphics 520
48.4 [X] Toshiba Tecra Z50-C-114 Intel Core i5-6200U 2.3GHz
HD Graphics 520
49.5 49.8 49.9 50 [X] Lenovo B51-80 80LM0027PB Intel Core i5-6200U 2.3GHz
HD Graphics 520
50 [X] Fujitsu LifeBook S936 PL Intel Core i7-6600U 2.6GHz
HD Graphics 520
50.5 50.9 51 51.4 51.4 51.5 51.8 52.5 [X] Toshiba Tecra Z40-C-11F Intel Core i7-6600U 2.6GHz
HD Graphics 520
54.4 54.4 54.7 54.7 [X] HP ProBook 640 G2 T8T61EA Intel Core i5-6200U 2.3GHz
HD Graphics 520
54.8 55 [X] Asus ASUSPRO P2530UA-DM0046E Intel Core i7-6500U 2.5GHz
HD Graphics 520
55.7 57.2 57.3 57.5 [X] HP EliteBook 850 G3 T9G19EA Intel Core i5-6200U 2.3GHz
HD Graphics 520
57.7 [X] Lenovo ThinkPad T460s 20FA003FPB Intel Core i7-6600U 2.6GHz
HD Graphics 520
57.7 [X] Dell Latitude E7470 N001LE747014EMEA Intel Core i5-6300U 2.4GHz
HD Graphics 520
57.9 57.9 58.1 58.5 [X] Fujitsu LifeBook E736 E7360M27BBPL Intel Core i7-6600U 2.6GHz
HD Graphics 520
59.8 60.5 60.5 [X] Fujitsu LifeBook A556 PL Intel Core i5-6200U 2.3GHz
HD Graphics 520
61 [X] Dell Latitude 12 E7270 PL Intel Core i7-6600U 2.6GHz
HD Graphics 520
~ 44 fps
100%
HD Graphics 520:
17.4 17.4 17.7 17.7 17.8 18 [X] Dell Latitude 3470 N2P7L347014EMEA Intel Core i5-6200U 2.3GHz
HD Graphics 520
18.9 [X] HP ProBook 430 G3 P4N86EA Intel Core i5-6200U 2.3GHz
HD Graphics 520
19.2 [X] HP ProBook 440 G3 PL Intel Core i5-6200U 2.3GHz
HD Graphics 520
19.4 19.4 19.5 19.7 19.7 [X] Dell Vostro 3568 PL Intel Core i3-6100U 2.3GHz
HD Graphics 520
19.7 20.1 20.2 20.3 [X] HP ProBook 650 G2 T8X61EA Intel Core i5-6200U 2.3GHz
HD Graphics 520
20.3 20.4 [X] Lenovo E31-80 PL Intel Core i5-6200U 2.3GHz
HD Graphics 520
20.5 [X] Toshiba Portege Z30-C-125 Intel Core i7-6500U 2.5GHz
HD Graphics 520
20.5 20.6 20.6 20.8 [X] HP EliteBook 820 G3 T8X20EA Intel Core i5-6200U 2.3GHz
HD Graphics 520
20.8 21.1 21.1 21.1 21.2 [X] Lenovo ThinkPad T560 20FH001APB Intel Core i7-6600U 2.6GHz
HD Graphics 520
21.2 21.4 21.5 21.7 21.7 21.8 [X] Tuxedo InfinityBook 13 v2 Intel Core i7-6500U 2.5GHz
HD Graphics 520
22 22.3 [X] HP EliteBook 840 G3 T8X41EA Intel Core i7-6600U 2.6GHz
HD Graphics 520
22.3 22.5 [X] HP 17-x066ng Intel Core i3-6006U @2GHz
HD Graphics 520
22.6 23 23 23.6 23.7 24.3 24.3 [X] Fujitsu Lifebook E746 VFY:E7460M85ABPL Intel Core i5-6200U 2.3GHz
HD Graphics 520
24.3 24.3 24.5 24.7 24.9 24.9 25 25.4 [X] Asus B8430UA-FA0203E Intel Core i5-6200U 2.3GHz
HD Graphics 520
25.7 25.8 25.9 26 26.1 26.3 [X] Lenovo ThinkPad T460 20FNV402PB Intel Core i5-6200U 2.3GHz
HD Graphics 520
26.3 [X] Toshiba Tecra Z50-C-114 Intel Core i5-6200U 2.3GHz
HD Graphics 520
26.6 26.7 [X] Lenovo B51-80 80LM0027PB Intel Core i5-6200U 2.3GHz
HD Graphics 520
26.8 26.9 27.1 27.3 27.5 [X] Fujitsu LifeBook S936 PL Intel Core i7-6600U 2.6GHz
HD Graphics 520
27.6 27.7 27.9 28.2 28.2 28.3 28.3 [X] HP ProBook 640 G2 T8T61EA Intel Core i5-6200U 2.3GHz
HD Graphics 520
28.3 28.6 28.7 [X] Asus ASUSPRO P2530UA-DM0046E Intel Core i7-6500U 2.5GHz
HD Graphics 520
28.7 29 29.2 [X] Toshiba Tecra Z40-C-11F Intel Core i7-6600U 2.6GHz
HD Graphics 520
29.2 29.3 29.6 29.8 29.8 30 30 30 [X] HP EliteBook 850 G3 T9G19EA Intel Core i5-6200U 2.3GHz
HD Graphics 520
30 [X] Fujitsu LifeBook A556 PL Intel Core i5-6200U 2.3GHz
HD Graphics 520
30 [X] Fujitsu LifeBook E736 E7360M27BBPL Intel Core i7-6600U 2.6GHz
HD Graphics 520
30.7 [X] Dell Latitude 12 E7270 PL Intel Core i7-6600U 2.6GHz
HD Graphics 520
30.8 [X] Lenovo ThinkPad T460s 20FA003FPB Intel Core i7-6600U 2.6GHz
HD Graphics 520
30.8 31.1 31.5 32 [X] Dell Latitude E7470 N001LE747014EMEA Intel Core i5-6300U 2.4GHz
HD Graphics 520
32.2 ~ 25 fps
100%
HD Graphics 520:
14.5 14.5 14.5 14.6 14.7 14.9 [X] Dell Latitude 3470 N2P7L347014EMEA Intel Core i5-6200U 2.3GHz
HD Graphics 520
15.3 [X] HP ProBook 430 G3 P4N86EA Intel Core i5-6200U 2.3GHz
HD Graphics 520
15.5 15.5 [X] HP ProBook 440 G3 PL Intel Core i5-6200U 2.3GHz
HD Graphics 520
15.9 15.9 16 16.3 [X] HP ProBook 650 G2 T8X61EA Intel Core i5-6200U 2.3GHz
HD Graphics 520
16.3 16.3 16.5 [X] Lenovo E31-80 PL Intel Core i5-6200U 2.3GHz
HD Graphics 520
16.6 16.7 16.7 16.8 16.8 16.9 17 [X] Toshiba Portege Z30-C-125 Intel Core i7-6500U 2.5GHz
HD Graphics 520
17.1 17.2 17.2 17.2 17.3 [X] HP EliteBook 820 G3 T8X20EA Intel Core i5-6200U 2.3GHz
HD Graphics 520
17.5 [X] Lenovo ThinkPad T560 20FH001APB Intel Core i7-6600U 2.6GHz
HD Graphics 520
17.8 17.9 17.9 18 [X] Tuxedo InfinityBook 13 v2 Intel Core i7-6500U 2.5GHz
HD Graphics 520
18 [X] HP 17-x066ng Intel Core i3-6006U @2GHz
HD Graphics 520
18.2 18.3 18.4 18.5 18.5 18.6 [X] HP EliteBook 840 G3 T8X41EA Intel Core i7-6600U 2.6GHz
HD Graphics 520
18.9 18.9 19 19.7 19.8 19.9 [X] Fujitsu Lifebook E746 VFY:E7460M85ABPL Intel Core i5-6200U 2.3GHz
HD Graphics 520
20 20.2 20.2 20.5 20.7 21.1 21.5 21.5 [X] Asus B8430UA-FA0203E Intel Core i5-6200U 2.3GHz
HD Graphics 520
21.5 21.5 21.8 [X] Lenovo ThinkPad T460 20FNV402PB Intel Core i5-6200U 2.3GHz
HD Graphics 520
21.9 21.9 [X] Toshiba Tecra Z50-C-114 Intel Core i5-6200U 2.3GHz
HD Graphics 520
22 [X] Lenovo B51-80 80LM0027PB Intel Core i5-6200U 2.3GHz
HD Graphics 520
22.2 22.2 22.2 22.5 22.5 22.7 22.8 22.9 23.2 [X] Fujitsu LifeBook S936 PL Intel Core i7-6600U 2.6GHz
HD Graphics 520
23.4 23.7 23.8 24 24.1 24.1 [X] HP ProBook 640 G2 T8T61EA Intel Core i5-6200U 2.3GHz
HD Graphics 520
24.2 24.5 24.5 [X] Asus ASUSPRO P2530UA-DM0046E Intel Core i7-6500U 2.5GHz
HD Graphics 520
24.5 [X] Toshiba Tecra Z40-C-11F Intel Core i7-6600U 2.6GHz
HD Graphics 520
24.5 24.7 24.7 24.8 24.9 25.3 [X] Fujitsu LifeBook A556 PL Intel Core i5-6200U 2.3GHz
HD Graphics 520
25.5 [X] Lenovo ThinkPad T460s 20FA003FPB Intel Core i7-6600U 2.6GHz
HD Graphics 520
25.5 25.6 [X] HP EliteBook 850 G3 T9G19EA Intel Core i5-6200U 2.3GHz
HD Graphics 520
25.6 [X] Fujitsu LifeBook E736 E7360M27BBPL Intel Core i7-6600U 2.6GHz
HD Graphics 520
26.2 27 [X] Dell Latitude 12 E7270 PL Intel Core i7-6600U 2.6GHz
HD Graphics 520
27.2 [X] Dell Latitude E7470 N001LE747014EMEA Intel Core i5-6300U 2.4GHz
HD Graphics 520
27.5 27.7 ~ 20 fps
100%
HD Graphics 520:
4.4 4.5 4.7 4.8 5 5.1 5.1 5.1 5.2 [X] HP ProBook 650 G2 T8X61EA Intel Core i5-6200U 2.3GHz
HD Graphics 520
5.3 [X] Lenovo ThinkPad T560 20FH001APB Intel Core i7-6600U 2.6GHz
HD Graphics 520
5.3 [X] Toshiba Portege Z30-C-125 Intel Core i7-6500U 2.5GHz
HD Graphics 520
5.3 5.4 5.4 5.4 5.4 [X] Tuxedo InfinityBook 13 v2 Intel Core i7-6500U 2.5GHz
HD Graphics 520
5.5 5.5 [X] HP EliteBook 840 G3 T8X41EA Intel Core i7-6600U 2.6GHz
HD Graphics 520
5.5 5.5 5.8 [X] HP 17-x066ng Intel Core i3-6006U @2GHz
HD Graphics 520
5.8 5.9 5.9 6 [X] Fujitsu Lifebook E746 VFY:E7460M85ABPL Intel Core i5-6200U 2.3GHz
HD Graphics 520
6 6.1 6.2 6.3 [X] HP ProBook 440 G3 PL Intel Core i5-6200U 2.3GHz
HD Graphics 520
6.3 6.3 6.3 6.4 6.4 6.4 6.4 [X] Lenovo ThinkPad T460 20FNV402PB Intel Core i5-6200U 2.3GHz
HD Graphics 520
6.5 6.5 [X] Toshiba Tecra Z50-C-114 Intel Core i5-6200U 2.3GHz
HD Graphics 520
6.6 6.6 6.6 6.7 6.9 6.9 6.9 6.9 7 7.1 [X] HP ProBook 640 G2 T8T61EA Intel Core i5-6200U 2.3GHz
HD Graphics 520
7.1 [X] Toshiba Tecra Z40-C-11F Intel Core i7-6600U 2.6GHz
HD Graphics 520
7.1 7.1 7.2 7.2 7.3 7.3 [X] HP EliteBook 850 G3 T9G19EA Intel Core i5-6200U 2.3GHz
HD Graphics 520
7.3 7.4 7.4 [X] Lenovo ThinkPad T460s 20FA003FPB Intel Core i7-6600U 2.6GHz
HD Graphics 520
7.5 7.6 7.6 [X] Dell Latitude E7470 N001LE747014EMEA Intel Core i5-6300U 2.4GHz
HD Graphics 520
7.6 7.6 [X] Fujitsu LifeBook S936 PL Intel Core i7-6600U 2.6GHz
HD Graphics 520
8 [X] Dell Latitude 12 E7270 PL Intel Core i7-6600U 2.6GHz
HD Graphics 520
8.1 [X] Fujitsu LifeBook E736 E7360M27BBPL Intel Core i7-6600U 2.6GHz
HD Graphics 520
8.2 ~ 6 fps
100%
HD Graphics 520:
39.3 48.3 49.2 49.4 [X] Medion Akoya E6422 Intel Core i3-6100U 2.3GHz
HD Graphics 520
49.7 50.1 50.7 [X] HP ProBook 430 G3 P4N86EA Intel Core i5-6200U 2.3GHz
HD Graphics 520
52 52.1 [X] Dell Vostro 3568 PL Intel Core i3-6100U 2.3GHz
HD Graphics 520
52.2 55 [X] Lenovo E31-80 PL Intel Core i5-6200U 2.3GHz
HD Graphics 520
56.8 56.9 57 62 62.3 [X] Asus B8430UA-FA0203E Intel Core i5-6200U 2.3GHz
HD Graphics 520
65 [X] Lenovo ThinkPad T460 20FNV402PB Intel Core i5-6200U 2.3GHz
HD Graphics 520
66.3 [X] Fujitsu Lifebook E746 VFY:E7460M85ABPL Intel Core i5-6200U 2.3GHz
HD Graphics 520
67.1 67.3 67.9 67.9 [X] Toshiba Tecra Z50-C-114 Intel Core i5-6200U 2.3GHz
HD Graphics 520
68 68 68.3 70.1 [X] Medion Akoya E6422 Dual-Channel
Intel Core i3-6100U 2.3GHz
HD Graphics 520
71.6 71.6 [X] Lenovo B51-80 80LM0027PB Intel Core i5-6200U 2.3GHz
HD Graphics 520
71.8 72.2 74.2 [X] HP ProBook 430 G3 P5T00ES Dual-Channel
Intel Core i5-6200U 2.3GHz
HD Graphics 520
74.9 75.7 [X] Asus ASUSPRO P2530UA-DM0046E Intel Core i7-6500U 2.5GHz
HD Graphics 520
76.4 78.1 78.1 78.9 79.5 82 83.1 84.1 85.7 [X] Dell Latitude E7470 N001LE747014EMEA Intel Core i5-6300U 2.4GHz
HD Graphics 520
~ 66 fps
100%
HD Graphics 520:
21.1 25.2 25.5 25.9 [X] HP ProBook 430 G3 P4N86EA Intel Core i5-6200U 2.3GHz
HD Graphics 520
26 [X] Medion Akoya E6422 Intel Core i3-6100U 2.3GHz
HD Graphics 520
26.2 26.6 26.6 26.8 26.9 [X] Dell Vostro 3568 PL Intel Core i3-6100U 2.3GHz
HD Graphics 520
28 28.1 28.1 [X] Lenovo E31-80 PL Intel Core i5-6200U 2.3GHz
HD Graphics 520
29.8 31.1 [X] Asus B8430UA-FA0203E Intel Core i5-6200U 2.3GHz
HD Graphics 520
32 32.6 [X] Toshiba Tecra Z50-C-114 Intel Core i5-6200U 2.3GHz
HD Graphics 520
33.3 33.7 [X] Fujitsu Lifebook E746 VFY:E7460M85ABPL Intel Core i5-6200U 2.3GHz
HD Graphics 520
33.8 34.3 [X] Lenovo ThinkPad T460 20FNV402PB Intel Core i5-6200U 2.3GHz
HD Graphics 520
34.6 34.9 35.1 35.3 35.9 [X] Medion Akoya E6422 Dual-Channel
Intel Core i3-6100U 2.3GHz
HD Graphics 520
36.6 36.8 [X] Lenovo B51-80 80LM0027PB Intel Core i5-6200U 2.3GHz
HD Graphics 520
38.1 38.2 [X] Asus ASUSPRO P2530UA-DM0046E Intel Core i7-6500U 2.5GHz
HD Graphics 520
38.3 38.4 38.8 39.4 [X] HP ProBook 430 G3 P5T00ES Dual-Channel
Intel Core i5-6200U 2.3GHz
HD Graphics 520
39.8 39.9 40.8 41 41.1 41.7 42.7 43.6 [X] HP Envy 13-d004ng Intel Core i7-6500U 2.5GHz
HD Graphics 520
43.7 [X] Dell Latitude E7470 N001LE747014EMEA Intel Core i5-6300U 2.4GHz
HD Graphics 520
~ 34 fps
100%
HD Graphics 520:
13.3 14.5 [X] Medion Akoya E6422 Intel Core i3-6100U 2.3GHz
HD Graphics 520
14.9 [X] HP ProBook 430 G3 P4N86EA Intel Core i5-6200U 2.3GHz
HD Graphics 520
15.1 15.1 15.3 15.3 16.2 [X] Lenovo E31-80 PL Intel Core i5-6200U 2.3GHz
HD Graphics 520
16.6 16.8 18.3 18.6 19.1 20.3 20.5 [X] Fujitsu Lifebook E746 VFY:E7460M85ABPL Intel Core i5-6200U 2.3GHz
HD Graphics 520
21 [X] Asus B8430UA-FA0203E Intel Core i5-6200U 2.3GHz
HD Graphics 520
21.3 21.5 21.7 22.4 [X] Toshiba Tecra Z50-C-114 Intel Core i5-6200U 2.3GHz
HD Graphics 520
22.7 [X] Medion Akoya E6422 Dual-Channel
Intel Core i3-6100U 2.3GHz
HD Graphics 520
23 [X] Lenovo B51-80 80LM0027PB Intel Core i5-6200U 2.3GHz
HD Graphics 520
23.1 [X] Lenovo ThinkPad T460 20FNV402PB Intel Core i5-6200U 2.3GHz
HD Graphics 520
23.4 23.5 23.7 23.8 23.8 23.9 24.1 24.3 24.4 24.5 [X] HP ProBook 430 G3 P5T00ES Dual-Channel
Intel Core i5-6200U 2.3GHz
HD Graphics 520
25.1 25.1 25.2 25.6 [X] Asus ASUSPRO P2530UA-DM0046E Intel Core i7-6500U 2.5GHz
HD Graphics 520
25.7 26.1 26.7 [X] HP Envy 13-d004ng Intel Core i7-6500U 2.5GHz
HD Graphics 520
27.9 28.3 [X] Dell Latitude E7470 N001LE747014EMEA Intel Core i5-6300U 2.4GHz
HD Graphics 520
~ 21 fps
100%
HD Graphics 520:
7.4 7.4 [X] Medion Akoya E6422 Intel Core i3-6100U 2.3GHz
HD Graphics 520
7.5 7.6 8.8 8.9 9.5 9.6 9.7 [X] Fujitsu Lifebook E746 VFY:E7460M85ABPL Intel Core i5-6200U 2.3GHz
HD Graphics 520
10.1 10.4 10.5 [X] Lenovo B51-80 80LM0027PB Intel Core i5-6200U 2.3GHz
HD Graphics 520
10.5 [X] Lenovo ThinkPad T460 20FNV402PB Intel Core i5-6200U 2.3GHz
HD Graphics 520
10.5 [X] Toshiba Tecra Z50-C-114 Intel Core i5-6200U 2.3GHz
HD Graphics 520
10.7 [X] Medion Akoya E6422 Dual-Channel
Intel Core i3-6100U 2.3GHz
HD Graphics 520
10.8 [X] HP ProBook 430 G3 P5T00ES Dual-Channel
Intel Core i5-6200U 2.3GHz
HD Graphics 520
10.8 10.9 10.9 11.1 11.1 11.2 11.2 11.2 11.4 11.6 11.6 [X] Asus ASUSPRO P2530UA-DM0046E Intel Core i7-6500U 2.5GHz
HD Graphics 520
12.2 12.3 [X] Dell Latitude E7470 N001LE747014EMEA Intel Core i5-6300U 2.4GHz
HD Graphics 520
12.6 ~ 10 fps
100%
HD Graphics 520:
20.4 21.6 [X] no model Intel Core i5-6200U 2.3GHz
HD Graphics 520
~ 21 fps
100%
HD Graphics 520:
13.5 16.5 [X] no model Intel Core i5-6200U 2.3GHz
HD Graphics 520
~ 15 fps
100%
HD Graphics 520:
11.1 [X] no model Intel Core i5-6200U 2.3GHz
HD Graphics 520
fps
100%
HD Graphics 520:
45.8 fps
100%
HD Graphics 520:
15.3 fps
100%
HD Graphics 520:
6.5 fps
100%
HD Graphics 520:
71 115.1 [X] HP ProBook 430 G3 P5T00ES Dual-Channel
Intel Core i5-6200U 2.3GHz
HD Graphics 520
156.3 ~ 114 fps
51%
UHD Graphics 610:
57.9 fps
100%
HD Graphics 520:
45.3 76.9 [X] HP ProBook 430 G3 P5T00ES Dual-Channel
Intel Core i5-6200U 2.3GHz
HD Graphics 520
101 ~ 74 fps
57%
UHD Graphics 610:
42.1 fps
100%
HD Graphics 520:
30.8 56.4 [X] HP ProBook 430 G3 P5T00ES Dual-Channel
Intel Core i5-6200U 2.3GHz
HD Graphics 520
60.9 ~ 49 fps
100%
HD Graphics 520:
16.7 29.9 [X] HP ProBook 430 G3 P5T00ES Dual-Channel
Intel Core i5-6200U 2.3GHz
HD Graphics 520
31.2 ~ 26 fps
100%
HD Graphics 520:
68.2 94.2 [X] HP ProBook 430 G3 P5T00ES Dual-Channel
Intel Core i5-6200U 2.3GHz
HD Graphics 520
~ 81 fps
48%
UHD Graphics 610:
38.9 fps
100%
HD Graphics 520:
45.1 60.6 [X] HP ProBook 430 G3 P5T00ES Dual-Channel
Intel Core i5-6200U 2.3GHz
HD Graphics 520
~ 53 fps
49%
UHD Graphics 610:
26.2 fps
100%
HD Graphics 520:
36.1 50.5 [X] HP ProBook 430 G3 P5T00ES Dual-Channel
Intel Core i5-6200U 2.3GHz
HD Graphics 520
~ 43 fps
100%
HD Graphics 520:
21.5 30 [X] HP ProBook 430 G3 P5T00ES Dual-Channel
Intel Core i5-6200U 2.3GHz
HD Graphics 520
~ 26 fps
100%
HD Graphics 520:
74 fps
100%
HD Graphics 520:
34.4 fps
100%
HD Graphics 520:
20.5 fps
100%
HD Graphics 520:
9.5 fps
100%
HD Graphics 520:
36.3 fps
100%
HD Graphics 520:
20.1 fps
100%
HD Graphics 520:
12.3 fps
100%
HD Graphics 520:
6.1 fps
100%
HD Graphics 520:
55.4 fps
100%
HD Graphics 520:
32.7 fps
100%
HD Graphics 520:
13.2 fps
100%
HD Graphics 520:
31.9 [X] HP ProBook 440 G3 PL Intel Core i5-6200U 2.3GHz
HD Graphics 520
32.8 [X] Dell Latitude 3470 N2P7L347014EMEA Intel Core i5-6200U 2.3GHz
HD Graphics 520
36.3 [X] HP ProBook 650 G2 T8X61EA Intel Core i5-6200U 2.3GHz
HD Graphics 520
38.1 [X] Lenovo ThinkPad T560 20FH001APB Intel Core i7-6600U 2.6GHz
HD Graphics 520
40.9 [X] Fujitsu LifeBook S936 PL Intel Core i7-6600U 2.6GHz
HD Graphics 520
42.5 [X] Lenovo ThinkPad T460s 20FA003FPB Intel Core i7-6600U 2.6GHz
HD Graphics 520
42.7 [X] HP EliteBook 820 G3 T8X20EA Intel Core i5-6200U 2.3GHz
HD Graphics 520
43.7 [X] HP EliteBook 850 G3 T9G19EA Intel Core i5-6200U 2.3GHz
HD Graphics 520
44.4 [X] HP EliteBook 840 G3 T8X41EA Intel Core i7-6600U 2.6GHz
HD Graphics 520
44.4 [X] Toshiba Tecra Z40-C-11F Intel Core i7-6600U 2.6GHz
HD Graphics 520
45.6 [X] Fujitsu LifeBook A556 PL Intel Core i5-6200U 2.3GHz
HD Graphics 520
47 [X] Toshiba Portege Z30-C-125 Intel Core i7-6500U 2.5GHz
HD Graphics 520
47.1 [X] HP ProBook 640 G2 T8T61EA Intel Core i5-6200U 2.3GHz
HD Graphics 520
47.4 [X] Fujitsu LifeBook E736 E7360M27BBPL Intel Core i7-6600U 2.6GHz
HD Graphics 520
48.6 [X] Dell Latitude 12 E7270 PL Intel Core i7-6600U 2.6GHz
HD Graphics 520
~ 42 fps
100%
HD Graphics 520:
24.5 [X] HP ProBook 440 G3 PL Intel Core i5-6200U 2.3GHz
HD Graphics 520
25.4 [X] Dell Latitude 3470 N2P7L347014EMEA Intel Core i5-6200U 2.3GHz
HD Graphics 520
29 [X] Lenovo ThinkPad T560 20FH001APB Intel Core i7-6600U 2.6GHz
HD Graphics 520
29.6 [X] HP ProBook 650 G2 T8X61EA Intel Core i5-6200U 2.3GHz
HD Graphics 520
31 [X] Lenovo ThinkPad T460s 20FA003FPB Intel Core i7-6600U 2.6GHz
HD Graphics 520
32.4 [X] Fujitsu LifeBook S936 PL Intel Core i7-6600U 2.6GHz
HD Graphics 520
33 [X] HP EliteBook 820 G3 T8X20EA Intel Core i5-6200U 2.3GHz
HD Graphics 520
33.8 [X] HP EliteBook 850 G3 T9G19EA Intel Core i5-6200U 2.3GHz
HD Graphics 520
35.1 [X] HP EliteBook 840 G3 T8X41EA Intel Core i7-6600U 2.6GHz
HD Graphics 520
35.6 [X] HP ProBook 640 G2 T8T61EA Intel Core i5-6200U 2.3GHz
HD Graphics 520
35.7 [X] Toshiba Tecra Z40-C-11F Intel Core i7-6600U 2.6GHz
HD Graphics 520
37.4 [X] Dell Latitude 12 E7270 PL Intel Core i7-6600U 2.6GHz
HD Graphics 520
37.7 [X] Fujitsu LifeBook E736 E7360M27BBPL Intel Core i7-6600U 2.6GHz
HD Graphics 520
38.3 [X] Fujitsu LifeBook A556 PL Intel Core i5-6200U 2.3GHz
HD Graphics 520
38.8 [X] Toshiba Portege Z30-C-125 Intel Core i7-6500U 2.5GHz
HD Graphics 520
~ 33 fps
100%
HD Graphics 520:
20.5 [X] HP ProBook 440 G3 PL Intel Core i5-6200U 2.3GHz
HD Graphics 520
21.5 [X] Dell Latitude 3470 N2P7L347014EMEA Intel Core i5-6200U 2.3GHz
HD Graphics 520
23.9 [X] Lenovo ThinkPad T560 20FH001APB Intel Core i7-6600U 2.6GHz
HD Graphics 520
25.3 [X] HP ProBook 650 G2 T8X61EA Intel Core i5-6200U 2.3GHz
HD Graphics 520
26.3 [X] Lenovo ThinkPad T460s 20FA003FPB Intel Core i7-6600U 2.6GHz
HD Graphics 520
26.9 [X] HP EliteBook 820 G3 T8X20EA Intel Core i5-6200U 2.3GHz
HD Graphics 520
28.1 [X] HP EliteBook 840 G3 T8X41EA Intel Core i7-6600U 2.6GHz
HD Graphics 520
28.1 [X] Fujitsu LifeBook S936 PL Intel Core i7-6600U 2.6GHz
HD Graphics 520
29.4 [X] HP EliteBook 850 G3 T9G19EA Intel Core i5-6200U 2.3GHz
HD Graphics 520
30 [X] Toshiba Portege Z30-C-125 Intel Core i7-6500U 2.5GHz
HD Graphics 520
30.9 [X] Toshiba Tecra Z40-C-11F Intel Core i7-6600U 2.6GHz
HD Graphics 520
31.2 [X] Dell Latitude 12 E7270 PL Intel Core i7-6600U 2.6GHz
HD Graphics 520
31.3 [X] HP ProBook 640 G2 T8T61EA Intel Core i5-6200U 2.3GHz
HD Graphics 520
32 [X] Fujitsu LifeBook A556 PL Intel Core i5-6200U 2.3GHz
HD Graphics 520
33.4 [X] Fujitsu LifeBook E736 E7360M27BBPL Intel Core i7-6600U 2.6GHz
HD Graphics 520
~ 28 fps
100%
HD Graphics 520:
12.2 [X] HP ProBook 440 G3 PL Intel Core i5-6200U 2.3GHz
HD Graphics 520
14.5 [X] HP ProBook 650 G2 T8X61EA Intel Core i5-6200U 2.3GHz
HD Graphics 520
14.8 [X] Lenovo ThinkPad T560 20FH001APB Intel Core i7-6600U 2.6GHz
HD Graphics 520
16.2 [X] HP EliteBook 840 G3 T8X41EA Intel Core i7-6600U 2.6GHz
HD Graphics 520
17.2 [X] Fujitsu LifeBook S936 PL Intel Core i7-6600U 2.6GHz
HD Graphics 520
17.7 [X] Toshiba Portege Z30-C-125 Intel Core i7-6500U 2.5GHz
HD Graphics 520
18.7 [X] HP EliteBook 850 G3 T9G19EA Intel Core i5-6200U 2.3GHz
HD Graphics 520
18.8 [X] Toshiba Tecra Z40-C-11F Intel Core i7-6600U 2.6GHz
HD Graphics 520
19.3 [X] HP ProBook 640 G2 T8T61EA Intel Core i5-6200U 2.3GHz
HD Graphics 520
19.6 [X] Dell Latitude 12 E7270 PL Intel Core i7-6600U 2.6GHz
HD Graphics 520
20.4 [X] Fujitsu LifeBook E736 E7360M27BBPL Intel Core i7-6600U 2.6GHz
HD Graphics 520
~ 17 fps
100%
HD Graphics 520:
49 fps
100%
HD Graphics 520:
32 fps
100%
HD Graphics 520:
21 fps
100%
HD Graphics 520:
31.3 fps
100%
HD Graphics 520:
19.7 fps
100%
HD Graphics 520:
9.7 fps
100%
HD Graphics 520:
94 [X] HP ProBook 430 G3 P5T00ES Dual-Channel
Intel Core i5-6200U 2.3GHz
HD Graphics 520
fps
100%
HD Graphics 520:
94 [X] HP ProBook 430 G3 P5T00ES Dual-Channel
Intel Core i5-6200U 2.3GHz
HD Graphics 520
fps
100%
HD Graphics 520:
25.2 [X] HP ProBook 430 G3 P5T00ES Dual-Channel
Intel Core i5-6200U 2.3GHz
HD Graphics 520
fps
100%
HD Graphics 520:
11.6 [X] HP ProBook 430 G3 P5T00ES Dual-Channel
Intel Core i5-6200U 2.3GHz
HD Graphics 520
fps
Average Gaming Intel HD Graphics 520 → 100% Average Gaming 30-70 fps → 100%
Average Gaming Intel UHD Graphics 610 → 71% Average Gaming 30-70 fps → 52%
For more games that might be playable and a list of all games and graphics cards visit our Gaming List
v1.26
log 25. 03:39:35
#0 checking url part for id 6451 +0s ... 0s
#1 checking url part for id 7172 +0s ... 0s
#2 checking url part for id 10401 +0s ... 0s
#3 not redirecting to Ajax server +0s ... 0s
#4 did not recreate cache, as it is less than 5 days old! Created at Mon, 22 Apr 2024 05:40:21 +0200 +0.001s ... 0.001s
#5 composed specs +0.125s ... 0.126s
#6 did output specs +0s ... 0.126s
#7 start showIntegratedCPUs +0s ... 0.126s
#8 getting avg benchmarks for device 6451 +0.057s ... 0.183s
#9 got single benchmarks 6451 +0.406s ... 0.589s
#10 getting avg benchmarks for device 7172 +0.002s ... 0.59s
#11 got single benchmarks 7172 +0.007s ... 0.597s
#12 getting avg benchmarks for device 10401 +0.017s ... 0.614s
#13 got single benchmarks 10401 +0.015s ... 0.629s
#14 got avg benchmarks for devices +0s ... 0.629s
#15 min, max, avg, median took s +0.455s ... 1.084s
#16 before gaming benchmark output +0s ... 1.085s
#17 Got 1353 rows for game benchmarks. +0.122s ... 1.207s
#18 composed SQL query for gamebenchmarks +0s ... 1.207s
#19 got data and put it in $dataArray +0.08s ... 1.287s
#20 benchmarks composed for output. +0.239s ... 1.526s
#21 calculated avg scores. +0s ... 1.526s
#22 return log +0.004s ... 1.53s
Please share our article, every link counts!
Redaktion, 2017-09- 8 (Update: 2023-07- 1)
 Deutsch
 English
 Español
 Français
 Italiano
 Nederlands
 Polski
 Português
 Русский
 Türkçe
 Svenska
 Chinese
 Magyar