Intel HD Graphics 510 vs Intel UHD Graphics 600 vs Intel Iris Pro Graphics 580
Intel HD Graphics 510 ► remove from comparison
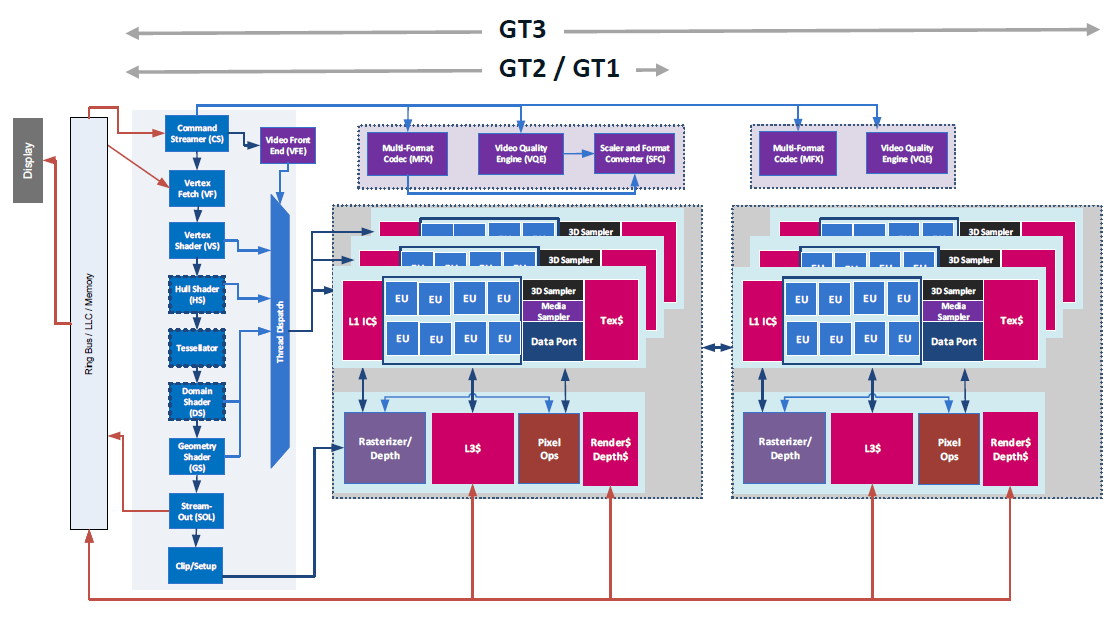
The Intel HD Graphics 510 (GT1) is an integrated graphics unit, which can be found in low-end ULV (Ultra Low Voltage) processors of the Skylake generation. This "GT1" version of the Skylake GPU offers 12 Execution Units (EUs) clocked at up to 950 MHz (depending on the CPU model). Due to its lack of dedicated graphics memory or eDRAM cache, the HD 510 has to access the main memory (2x 64bit DDR3L-1600 / DDR4-2133).
Performance
Depending on various factors like memory configuration, the HD Graphics 510 should perform sligthly below the older HD Graphics 4400 and will handle modern games (as of 2015) only in lowest settings (if it does at all).
Features
The revised video engine now decodes H.265/HEVC completely in hardware and thereby much more efficiently than before. Displays can be connected via DP 1.2 / eDP 1.3 (max. 3840 x 2160 @ 60 Hz), whereas HDMI is limited to the older version 1.4a (max. 3840 x 2160 @ 30 Hz). However, HDMI 2.0 can be added using a DisplayPort converter. Up to three displays can be controlled simultaneously.
Power Consumption
The HD Graphics 510 can be found in mobile processors specified at 15 W TDP and is therefore suited for compact laptops and ultrabooks.
Intel UHD Graphics 600 ► remove from comparison
The Intel UHD Graphics 600 is an integrated processor graphics unit from the Gemini Lake generation (e. g. Pentium N4100 ), which was announced late 2017. The GPU can convince with low consumption figures, but the performance is only in the low-end segment and is rarely sufficient for modern games. Being the lowest configuration of the Gemini Lake GPU, the UHD Graphics 600 is equipped with 12 of the 18 Execution Units (EUs) running at up to 700 MHz. The technical specifications of the GPU are based on Intel's Gen9 architecture, which is also used for the more expensive Skylake series and also in the predecessor HD Graphics 505.
Due to its lack of dedicated graphics memory or eDRAM cache, the UHD 605 has to access the main memory via processor (2x 64bit DDR4/LPDDR4-2400).
Performance
The UHD Graphics 600 offers a similar performance as the Intel HD Graphics 500 in the Apollo Lake SoCs (same Gen 9 architecture). Therefore, the GPU is only suited for some very low demanding games like Dirt Rally or Sims 4.
Features
The video engine decodes H.265/HEVC (8b and 10b) and VP9 completely in hardware. Up to three displays can be connected via DP 1.2a/eDP 1.3 or HDMI 2.0a (including HDCP 2.2).
Power Consumption
The TDP of the whole Pentium N4100 chip is 6 Watts by default, so the GPU is primarily used for (often passively cooled) netbooks or thin notebooks. The TDP can also be reduced to 4.8 Watts, but this will obviously affect the performance.
Intel Iris Pro Graphics 580 ► remove from comparison
The Intel Iris Pro Graphics 580 (GT4e) is an integrated graphics unit of the Skylake generation (top version). As successors of the Iris Graphics 6200 (Broadwell), the Iris 580 can be found in some high-end quad core CPUs and offers 128 MB of dedicated eDRAM memory. Furthermore, the so-called GT4e-version features 72 Execution Units (EUs). Besides the eDRAM cache, the Iris 580 is able to access the main memory (2x 64bit DDR3L-1600 / DDR4-2133).
Compared to the Iris Graphics 550 (28 W GT3e), the Iris Pro Graphics 580 offers more EUs (72 vs. 48) and a larger eDRAM Cache (128 vs. 64 MB).
Performance
The exact performance of the Iris Graphics 580 depends on memory configuration and CPU model (different clock speeds). However, it should be clearly faster than the old Broadwell Iris Pro 6200 and may compete with a dedicated GeForce 945M . Modern games of 2015/2016 should be playable in medium settings.
Features
The revised video engine now decodes H.265/HEVC completely in hardware and thereby much more efficiently than before. Displays can be connected via DP 1.2 / eDP 1.3 (max. 3840 x 2160 @ 60 Hz), whereas HDMI is limited to the older version 1.4 (max. 3840 x 2160 @ 30 Hz). However, HDMI 2.0 can be added using a DisplayPort converter. Up to three displays can be controlled simultaneously.
Power Consumption
The Iris Graphics 580 can be found in some mobile high-end quad core processors (45 W). Therefore, they are most likely not used in thin and light laptops.
Intel HD Graphics 510 Intel UHD Graphics 600 Intel Iris Pro Graphics 580 Gen. 9 Series Codename Skylake GT1 Gemini Lake Skylake GT4e Architecture Gen. 9 Skylake Gen. 9 Gemini Lake Gen. 9 Skylake Pipelines 12 - unified 12 - unified 72 - unified Core Speed 300 - 950 (Boost) MHz 300 - 700 (Boost) MHz 350 - 1050 (Boost) MHz Memory Bus Width 64/128 Bit 64/128 Bit eDRAM + 64/128 Bit Memory Type DDR3/DDR4 DDR4 / LPDDR4 eDRAM Shared Memory yes yes yes API DirectX 12_1, OpenGL 4.4 DirectX 12_1, OpenGL 4.4 DirectX 12_1, OpenGL 4.4 technology 14 nm 14 nm 14 nm Features QuickSync QuickSync QuickSync Date of Announcement 01.09.2015 11.12.2017 24.01.2016 Max. Amount of Memory 128 MB
CPU in HD Graphics 510 GPU Base Speed GPU Boost / Turbo Intel Core i5-6198DU 2 x 2300 MHz, 15 W 300 MHz 1000 MHz Intel Pentium 4405U 2 x 2100 MHz, 15 W 300 MHz 950 MHz min. - max. 300 MHz 950 - 1000 MHz
CPU in UHD Graphics 600 GPU Base Speed GPU Boost / Turbo Intel Celeron J4125 4 x 2000 MHz, 10 W 250 MHz 750 MHz Intel Celeron J4105 4 x 1500 MHz, 10 W 250 MHz 750 MHz Intel Celeron J4005 2 x 2000 MHz, 10 W 250 MHz 700 MHz » show 6 more Intel Celeron N4120 4 x 1100 MHz, 6 W 200 MHz 700 MHz Intel Celeron J4115 4 x 1800 MHz, 10 W 250 MHz 750 MHz Intel Celeron N4100 4 x 1100 MHz, 6 W 200 MHz 700 MHz Intel Celeron J4025 2 x 2000 MHz, 10 W 250 MHz 700 MHz Intel Celeron N4020 2 x 1100 MHz, 6 W 200 MHz 650 MHz Intel Celeron N4000 2 x 1100 MHz, 6 W 200 MHz 650 MHz min. - max. 200 - 300 MHz 650 - 1000 MHz
CPU in Iris Pro Graphics 580 GPU Base Speed GPU Boost / Turbo Intel Core i7-6970HQ 4 x 2800 MHz, 45 W 350 MHz 1050 MHz Intel Core i7-6870HQ 4 x 2700 MHz, 45 W 350 MHz 1000 MHz Intel Core i7-6770HQ 4 x 2600 MHz, 45 W 350 MHz 950 MHz Intel Core i5-6350HQ 4 x 2300 MHz, 45 W 350 MHz 900 MHz min. - max. 200 - 350 MHz 650 - 1050 MHz
Benchmarks Performance Rating - 3DMark 11 + Fire Strike + Time Spy - HD Graphics 510
0.3 pt (1%)
...
...
max:
Performance Rating - 3DMark 11 + Fire Strike + Time Spy - UHD Graphics 600
0.2 pt (1%)
...
...
max:
Performance Rating - 3DMark 11 + Fire Strike + Time Spy - Iris Pro Graphics 580
0.9 pt (3%)
...
Intel Iris Pro Graphics 580
...
max:
3DMark - 3DMark Time Spy Score
min: 97 avg: 123 median: 125 (0%) max: 143 Points
3DMark - 3DMark Time Spy Graphics
min: 85 avg: 107.5 median: 109 (0%) max: 124 Points
3DMark - 3DMark Ice Storm Unlimited Graphics
43274 Points (5%)
min: 17048 avg: 27966 median: 30149 (3%) max: 43067 Points
184880 Points (21%)
3DMark - 3DMark Ice Storm Extreme Graphics
26846 Points (3%)
min: 8277 avg: 13725 median: 14480 (2%) max: 19919 Points
98218 Points (13%)
3DMark - 3DMark Cloud Gate Score
4721 Points (5%)
min: 1932 avg: 2983 median: 3124 (3%) max: 4616 Points
11346 Points (12%)
3DMark - 3DMark Cloud Gate Graphics
5664 Points (1%)
min: 2346 avg: 3365 median: 3435.5 (1%) max: 4958 Points
14594 Points (4%)
3DMark - 3DMark Fire Strike Standard Score
570 Points (1%)
min: 277 avg: 395.9 median: 401.5 (1%) max: 619 Points
1836 Points (3%)
3DMark - 3DMark Fire Strike Standard Graphics
621 Points (1%)
min: 307 avg: 421.2 median: 433 (0%) max: 637 Points
1903 Points (2%)
3DMark - 3DMark Ice Storm Graphics
62653 Points (8%)
min: 14412 avg: 23582 median: 24012 (3%) max: 35101 Points
149585 Points (18%)
3DMark - 3DMark Sling Shot (ES 3.0) Unlimited
2272 Points (10%)
3DMark - 3DMark Sling Shot (ES 3.0) Unlimited Graphics
2776 Points (6%)
3DMark - 3DMark Night Raid
1774 Points (2%)
3DMark - 3DMark Night Raid Graphics Score
1917 Points (1%)
3DMark 11 - 3DM11 Performance Score
985 Points (1%)
min: 472 avg: 624 median: 647.5 (1%) max: 985 Points
3510 Points (5%)
3DMark 11 - 3DM11 Performance GPU
847 Points (1%)
min: 410 avg: 558 median: 578 (0%) max: 854 Points
3220 Points (3%)
3DMark Vantage + Intel HD Graphics 510 3DMark Vantage - 3DM Vant. Perf. total
3798 Points (1%)
3DM Vant. Perf. total + Intel UHD Graphics 600
min: 1856 avg: 2189 median: 2189 (1%) max: 2522 Points
3DM Vant. Perf. GPU no PhysX + Intel HD Graphics 510 3DMark Vantage - 3DM Vant. Perf. GPU no PhysX
3125 Points (2%)
3DM Vant. Perf. GPU no PhysX + Intel UHD Graphics 600
min: 1603 avg: 1836 median: 1836 (1%) max: 2069 Points
3DMark 05 - 3DMark 05 - Standard
min: 6084 avg: 6352 median: 6351.5 (7%) max: 6619 Points
3DMark 06 3DMark 06 - Standard 1280x1024 + Intel HD Graphics 510
7253 Points (9%)
Model CPU GPU RAM Value 3DMark 06 - Standard 1280x1024 Asus Vivobook F556UQ-XO626D (3DMark 06 - Standard 1280x1024) 6198DU HD Graphics 510 100 MHz8 GB 7253
3DMark 06 - Standard 1280x1024 + Intel UHD Graphics 600
min: 3052 avg: 3884 median: 3960 (5%) max: 4713 Points
Unigine Valley 1.0 - Unigine Valley 1.0 DX
1.1 fps (0%)
Unigine Heaven 3.0 - Unigine Heaven 3.0 DX 11
9.3 fps (3%)
Unigine Heaven 3.0 - Unigine Heaven 3.0 OpenGL
10.8 fps (5%)
Unigine Heaven 2.1 - Heaven 2.1 high
13.5 fps (3%)
Cinebench R10 Cinebench R10 Shading (32bit) + Intel HD Graphics 510 Cinebench R10 - Cinebench R10 Shading (32bit)
7348 Points (5%)
Cinebench R10 Shading (32bit) + Intel UHD Graphics 600
min: 3002 avg: 3471 median: 3504 (2%) max: 3825 Points
Cinebench R10 Shading (32bit) + Intel Iris Pro Graphics 580
11355 Points (8%)
Cinebench R11.5 Cinebench R11.5 OpenGL 64 Bit + Intel HD Graphics 510 Cinebench R11.5 - Cinebench R11.5 OpenGL 64 Bit
17.2 fps (6%)
Cinebench R11.5 OpenGL 64 Bit + Intel UHD Graphics 600
min: 7.51 avg: 10.2 median: 10.8 (4%) max: 12.17 fps
Cinebench R11.5 OpenGL 64 Bit + Intel Iris Pro Graphics 580
63 fps (22%)
Cinebench R15 + Intel HD Graphics 510 Cinebench R15 - Cinebench R15 OpenGL 64 Bit
28 fps (2%)
Cinebench R15 OpenGL 64 Bit + Intel UHD Graphics 600
min: 6.47 avg: 15.3 median: 16.4 (1%) max: 20.26 fps
Cinebench R15 OpenGL 64 Bit + Intel Iris Pro Graphics 580
min: 85.1 avg: 85.6 median: 85.6 (5%) max: 86 fps
Cinebench R15 OpenGL Ref. Match 64 Bit + Intel UHD Graphics 600 Cinebench R15 - Cinebench R15 OpenGL Ref. Match 64 Bit
97.8 % (98%)
Cinebench R15 OpenGL Ref. Match 64 Bit + Intel Iris Pro Graphics 580
min: 97.8 avg: 97.9 median: 97.8 (98%) max: 98 %
GFXBench - GFXBench 5.0 Aztec Ruins High Tier Offscreen
min: 3.4 avg: 3.7 median: 3.7 (1%) max: 3.9 fps
GFXBench - GFXBench 5.0 Aztec Ruins Normal Tier Offscreen
min: 9 avg: 10 median: 9.9 (1%) max: 11 fps
GFXBench - GFXBench Car Chase Offscreen
35.9 fps (4%)
min: 5.4 avg: 7.7 median: 8.1 (1%) max: 9.2 fps
GFXBench 3.1 - GFXBench Manhattan ES 3.1 Offscreen
51.7 fps (1%)
min: 13.4 avg: 14.5 median: 15 (0%) max: 15 fps
GFXBench 3.0 - GFXBench 3.0 Manhattan Offscreen
64.6 fps (4%)
min: 18.2 avg: 19.4 median: 19 (1%) max: 21 fps
GFXBench (DX / GLBenchmark) 2.7 + Intel HD Graphics 510 GFXBench (DX / GLBenchmark) 2.7 - GFXBench T-Rex HD Offscreen C24Z16
121.9 fps (1%)
GFXBench T-Rex HD Offscreen C24Z16 + Intel UHD Graphics 600 min: 33.3 avg: 37.2 median: 37.2 (0%) max: 41 fps
Basemark GPU 1.2 - Basemark GPU 1.2 Vulkan Official Medium Offscreen 1080
min: 15.5 avg: 15.8 median: 15.8 (0%) max: 16 fps
Basemark GPU 1.2 - Basemark GPU 1.2 Vulkan Official High Offscreen 2160
1.3 fps (0%)
LuxMark v2.0 64Bit - LuxMark v2.0 Room GPU
167 Samples/s (1%)
min: 70 avg: 78.3 median: 76 (0%) max: 89 Samples/s
362 Samples/s (2%)
LuxMark v2.0 64Bit - LuxMark v2.0 Sala GPU
302 Samples/s (1%)
min: 122 avg: 135.3 median: 129 (0%) max: 155 Samples/s
875 Samples/s (2%)
ComputeMark v2.1 - ComputeMark v2.1 Result
500 Points (1%)
min: 337 avg: 357.5 median: 358 (0%) max: 377 Points
2308 Points (2%)
Power Consumption - Furmark Stress Test Power Consumption - external Monitor *
min: 8.15 avg: 10.2 median: 10 (1%) max: 12.6 Watt
Power Consumption - Witcher 3 Power Consumption *
14.7 Watt (3%)
Clock Speed - GPU Clock Speed Furmark
min: 500 avg: 519 median: 519 (21%) max: 538 MHz
Average Benchmarks Intel HD Graphics 510 → 100% n=15 Average Benchmarks Intel UHD Graphics 600 → 59% n=15 Average Benchmarks Intel Iris Pro Graphics 580 → 313% n=15
- Range of benchmark values for this graphics card
- Average benchmark values for this graphics card
* Smaller numbers mean a higher performance
1 This benchmark is not used for the average calculation
Game Benchmarks The following benchmarks stem from our benchmarks of review laptops. The performance depends on the used graphics memory, clock rate, processor, system settings, drivers, and operating systems. So the results don't have to be representative for all laptops with this GPU. For detailed information on the benchmark results, click on the fps number.
UHD Graphics 600:
31.9 fps
UHD Graphics 600:
12.8 fps
UHD Graphics 600:
11.3 fps
UHD Graphics 600:
28.9 fps
UHD Graphics 600:
14.9 fps
UHD Graphics 600:
11.3 [X] BMAX MaxBook Y11 H1M6 Intel Celeron N4100 1.1GHz
UHD Graphics 600
min:
3.96 fps, P0.1:
4.94 fps, P1:
8.44 fps, max:
91 fps
fps
UHD Graphics 600:
5.7 9 ~ 7 fps
UHD Graphics 600:
42.5 fps
UHD Graphics 600:
29.8 fps
UHD Graphics 600:
19.2 fps
UHD Graphics 600:
0 (!) [X] Chuwi LapBook SE Intel Celeron N4100 1.1GHz
UHD Graphics 600
2 ~ 1 fps
UHD Graphics 600:
17.7 fps
UHD Graphics 600:
0 (!) [X] Chuwi LapBook SE Intel Celeron N4100 1.1GHz
UHD Graphics 600
4 5.1 ~ 3 fps
UHD Graphics 600:
8 9.5 [X] 1.47.22.14 D3D12
Intel Celeron N4100 1.1GHz
UHD Graphics 600
min:
5 fps, P1:
5 fps, max:
98.6 fps
~ 9 fps
UHD Graphics 600:
6.1 [X] 1.47.22.14 D3D12
Intel Celeron N4100 1.1GHz
UHD Graphics 600
min:
5 fps, P1:
5 fps, max:
60.1 fps
fps
UHD Graphics 600:
5.8 [X] 1.47.22.14 D3D12
Intel Celeron N4100 1.1GHz
UHD Graphics 600
min:
5 fps, P1:
5 fps, max:
100 fps
fps
UHD Graphics 600:
3.6 [X] 1.47.22.14 D3D12
Intel Celeron N4100 1.1GHz
UHD Graphics 600
min:
5 fps, P1:
5 fps, max:
74.6 fps
fps
UHD Graphics 600:
4.6 4.8 ~ 5 fps
UHD Graphics 600:
2.9 3.6 4 4.1 4.5 [X] 1.3
Intel Celeron N4100 1.1GHz
UHD Graphics 600
4.8 5.2 [X] 1.3
Intel Celeron J4125 2GHz
UHD Graphics 600
5.3 5.5 [X] Intel NUC7CJYSAMN 1.3
Intel Celeron J4025 2GHz
UHD Graphics 600
~ 4 fps
UHD Graphics 600:
2.1 [X] 1.3
Intel Celeron J4125 2GHz
UHD Graphics 600
2.2 [X] 1.3
Intel Celeron N4100 1.1GHz
UHD Graphics 600
2.3 2.4 [X] Intel NUC7CJYSAMN 1.3
Intel Celeron J4025 2GHz
UHD Graphics 600
~ 2 fps
UHD Graphics 600:
1.5 [X] 1.3
Intel Celeron J4125 2GHz
UHD Graphics 600
1.6 [X] 1.3
Intel Celeron N4100 1.1GHz
UHD Graphics 600
1.6 ~ 2 fps
UHD Graphics 600:
1.1 [X] 1.3
Intel Celeron N4100 1.1GHz
UHD Graphics 600
fps
UHD Graphics 600:
35.3 fps
UHD Graphics 600:
28.7 fps
100%
HD Graphics 510:
18.3 [X] Asus Vivobook F556UQ-XO626D Intel Core i5-6198DU 2.3GHz
HD Graphics 510
fps
100%
HD Graphics 510:
19.9 [X] Asus Vivobook F556UQ-XO626D Intel Core i5-6198DU 2.3GHz
HD Graphics 510
fps
100%
HD Graphics 510:
15.4 [X] Asus Vivobook F556UQ-XO626D Intel Core i5-6198DU 2.3GHz
HD Graphics 510
fps
100%
HD Graphics 510:
70.6 [X] Asus Vivobook F556UQ-XO626D Intel Core i5-6198DU 2.3GHz
HD Graphics 510
fps
100%
HD Graphics 510:
41.3 [X] Asus Vivobook F556UQ-XO626D Intel Core i5-6198DU 2.3GHz
HD Graphics 510
fps
100%
HD Graphics 510:
24.5 [X] Asus Vivobook F556UQ-XO626D Intel Core i5-6198DU 2.3GHz
HD Graphics 510
fps
100%
HD Graphics 510:
9.4 [X] Asus Vivobook F556UQ-XO626D Intel Core i5-6198DU 2.3GHz
HD Graphics 510
fps
Iris Pro Graphics 580:
60.5 fps
Iris Pro Graphics 580:
53.3 fps
Iris Pro Graphics 580:
42.9 fps
Iris Pro Graphics 580:
23.1 fps
Iris Pro Graphics 580:
0 (!) fps
100%
HD Graphics 510:
13.4 [X] Asus Vivobook F556UQ-XO626D Intel Core i5-6198DU 2.3GHz
HD Graphics 510
fps
100%
HD Graphics 510:
7.7 [X] Asus Vivobook F556UQ-XO626D Intel Core i5-6198DU 2.3GHz
HD Graphics 510
fps
100%
HD Graphics 510:
11.1 [X] Asus Vivobook F556UQ-XO626D Intel Core i5-6198DU 2.3GHz
HD Graphics 510
fps
272%
Iris Pro Graphics 580:
30.2 fps
100%
HD Graphics 510:
7 [X] Asus Vivobook F556UQ-XO626D Intel Core i5-6198DU 2.3GHz
HD Graphics 510
fps
260%
Iris Pro Graphics 580:
18.2 fps
Iris Pro Graphics 580:
12.2 fps
Iris Pro Graphics 580:
8.9 fps
100%
HD Graphics 510:
25 [X] Asus Vivobook F556UQ-XO626D Intel Core i5-6198DU 2.3GHz
HD Graphics 510
fps
68%
UHD Graphics 600:
17.1 fps
100%
HD Graphics 510:
15.9 [X] Asus Vivobook F556UQ-XO626D Intel Core i5-6198DU 2.3GHz
HD Graphics 510
fps
68%
UHD Graphics 600:
10.8 fps
Iris Pro Graphics 580:
0 (!) fps
100%
HD Graphics 510:
19.9 [X] Asus Vivobook F556UQ-XO626D Intel Core i5-6198DU 2.3GHz
HD Graphics 510
fps
100%
HD Graphics 510:
11 [X] Asus Vivobook F556UQ-XO626D Intel Core i5-6198DU 2.3GHz
HD Graphics 510
fps
100%
HD Graphics 510:
48.7 [X] Asus Vivobook F556UQ-XO626D Intel Core i5-6198DU 2.3GHz
HD Graphics 510
fps
41%
UHD Graphics 600:
20 fps
100%
HD Graphics 510:
29.2 [X] Asus Vivobook F556UQ-XO626D Intel Core i5-6198DU 2.3GHz
HD Graphics 510
fps
45%
UHD Graphics 600:
13.1 fps
100%
HD Graphics 510:
38.9 [X] Asus Vivobook F556UQ-XO626D Intel Core i5-6198DU 2.3GHz
HD Graphics 510
fps
154%
Iris Pro Graphics 580:
59.9 fps
100%
HD Graphics 510:
25.2 [X] Asus Vivobook F556UQ-XO626D Intel Core i5-6198DU 2.3GHz
HD Graphics 510
fps
233%
Iris Pro Graphics 580:
58.6 fps
Iris Pro Graphics 580:
23 fps
Iris Pro Graphics 580:
14.9 fps
100%
HD Graphics 510:
66.2 [X] Asus Vivobook F556UQ-XO626D Intel Core i5-6198DU 2.3GHz
HD Graphics 510
fps
90%
Iris Pro Graphics 580:
59.8 fps
100%
HD Graphics 510:
41.8 [X] Asus Vivobook F556UQ-XO626D Intel Core i5-6198DU 2.3GHz
HD Graphics 510
fps
89%
Iris Pro Graphics 580:
37.2 fps
UHD Graphics 600:
5.5 5.5 5.8 5.9 [X] Chuwi Hi10 X Intel Celeron N4100 1.1GHz
UHD Graphics 600
min:
3.3 fps, max:
-1 fps
6 6.1 6.5 6.8 [X] GMK NucBox K1 Intel Celeron J4125 2GHz
UHD Graphics 600
min:
5.7 fps, max:
-1 fps
6.8 [X] GMK NucBox 3 Intel Celeron J4125 2GHz
UHD Graphics 600
min:
5.2 fps, max:
-1 fps
7.3 [X] Intel Celeron N4100 1.1GHz
UHD Graphics 600
min:
6.1 fps, max:
-1 fps
7.7 7.9 8 8.1 [X] Intel Celeron J4125 2GHz
UHD Graphics 600
min:
6.8 fps, max:
-1 fps
8.2 [X] Teclast F7 Air Intel Celeron N4120 1.1GHz
UHD Graphics 600
min:
6.7 fps, max:
-1 fps
8.6 8.8 8.8 [X] Intel NUC7CJYSAMN Intel Celeron J4025 2GHz
UHD Graphics 600
min:
4.1 fps, max:
-1 fps
~ 7 fps
Iris Pro Graphics 580:
15.3 fps
UHD Graphics 600:
5.2 5.4 5.5 5.7 5.7 [X] Chuwi Hi10 X Intel Celeron N4100 1.1GHz
UHD Graphics 600
min:
2.7 fps, max:
-1 fps
5.8 5.9 6.1 [X] GMK NucBox K1 Intel Celeron J4125 2GHz
UHD Graphics 600
min:
5.1 fps, max:
-1 fps
6.3 [X] GMK NucBox 3 Intel Celeron J4125 2GHz
UHD Graphics 600
min:
4.4 fps, max:
-1 fps
6.9 [X] Intel Celeron N4100 1.1GHz
UHD Graphics 600
min:
5.5 fps, max:
-1 fps
7.1 7.2 7.4 7.4 [X] Teclast F7 Air Intel Celeron N4120 1.1GHz
UHD Graphics 600
min:
5.9 fps, max:
-1 fps
7.4 [X] Intel Celeron J4125 2GHz
UHD Graphics 600
min:
6.3 fps, max:
-1 fps
7.7 7.8 [X] Intel NUC7CJYSAMN Intel Celeron J4025 2GHz
UHD Graphics 600
min:
4.9 fps, max:
-1 fps
8 ~ 7 fps
Iris Pro Graphics 580:
14 fps
Iris Pro Graphics 580:
0 (!) fps
100%
HD Graphics 510:
110.4 [X] Asus Vivobook F556UQ-XO626D Intel Core i5-6198DU 2.3GHz
HD Graphics 510
fps
39%
UHD Graphics 600:
43.3 fps
100%
HD Graphics 510:
19.3 [X] Asus Vivobook F556UQ-XO626D Intel Core i5-6198DU 2.3GHz
HD Graphics 510
fps
65%
UHD Graphics 600:
12.5 fps
UHD Graphics 600:
12.5 fps
100%
HD Graphics 510:
30.9 [X] Asus Vivobook F556UQ-XO626D Intel Core i5-6198DU 2.3GHz
HD Graphics 510
fps
45%
UHD Graphics 600:
12.6 16 ~ 14 fps
100%
HD Graphics 510:
26.8 [X] Asus Vivobook F556UQ-XO626D Intel Core i5-6198DU 2.3GHz
HD Graphics 510
fps
43%
UHD Graphics 600:
11.6 fps
100%
HD Graphics 510:
31.5 [X] Asus Vivobook F556UQ-XO626D Intel Core i5-6198DU 2.3GHz
HD Graphics 510
fps
100%
HD Graphics 510:
22.2 [X] Asus Vivobook F556UQ-XO626D Intel Core i5-6198DU 2.3GHz
HD Graphics 510
fps
100%
HD Graphics 510:
72 [X] Asus Vivobook F556UQ-XO626D Intel Core i5-6198DU 2.3GHz
HD Graphics 510
fps
100%
HD Graphics 510:
47 [X] Asus Vivobook F556UQ-XO626D Intel Core i5-6198DU 2.3GHz
HD Graphics 510
fps
100%
HD Graphics 510:
173.7 [X] Asus Vivobook F556UQ-XO626D Intel Core i5-6198DU 2.3GHz
HD Graphics 510
fps
45%
UHD Graphics 600:
77.8 fps
100%
HD Graphics 510:
32.2 [X] Asus Vivobook F556UQ-XO626D Intel Core i5-6198DU 2.3GHz
HD Graphics 510
fps
55%
UHD Graphics 600:
17.7 fps
UHD Graphics 600:
10.2 fps
100%
HD Graphics 510:
135.5 [X] Asus Vivobook F556UQ-XO626D Intel Core i5-6198DU 2.3GHz
HD Graphics 510
fps
49%
UHD Graphics 600:
66.8 fps
100%
HD Graphics 510:
32.8 [X] Asus Vivobook F556UQ-XO626D Intel Core i5-6198DU 2.3GHz
HD Graphics 510
fps
55%
UHD Graphics 600:
18 fps
UHD Graphics 600:
12.5 fps
Iris Pro Graphics 580:
43.8 fps
Iris Pro Graphics 580:
30.1 fps
Iris Pro Graphics 580:
25 fps
Iris Pro Graphics 580:
12.4 fps
100%
HD Graphics 510:
33.4 [X] Asus Vivobook F556UQ-XO626D Intel Core i5-6198DU 2.3GHz
HD Graphics 510
fps
100%
HD Graphics 510:
22.5 [X] Asus Vivobook F556UQ-XO626D Intel Core i5-6198DU 2.3GHz
HD Graphics 510
fps
100%
HD Graphics 510:
15.9 [X] Asus Vivobook F556UQ-XO626D Intel Core i5-6198DU 2.3GHz
HD Graphics 510
fps
Iris Pro Graphics 580:
63.7 fps
Iris Pro Graphics 580:
50.8 fps
Iris Pro Graphics 580:
28.5 fps
Iris Pro Graphics 580:
14.3 fps
100%
HD Graphics 510:
39 [X] Asus Vivobook F556UQ-XO626D Intel Core i5-6198DU 2.3GHz
HD Graphics 510
fps
260%
Iris Pro Graphics 580:
101.3 fps
100%
HD Graphics 510:
20.1 [X] Asus Vivobook F556UQ-XO626D Intel Core i5-6198DU 2.3GHz
HD Graphics 510
fps
288%
Iris Pro Graphics 580:
57.9 fps
100%
HD Graphics 510:
17.7 [X] Asus Vivobook F556UQ-XO626D Intel Core i5-6198DU 2.3GHz
HD Graphics 510
fps
288%
Iris Pro Graphics 580:
51 fps
Iris Pro Graphics 580:
14.9 fps
UHD Graphics 600:
78.8 fps
Iris Pro Graphics 580:
380.6 fps
UHD Graphics 600:
16.3 fps
Iris Pro Graphics 580:
127.1 fps
Iris Pro Graphics 580:
73.6 fps
Iris Pro Graphics 580:
36.2 fps
100%
HD Graphics 510:
52.7 [X] Asus Vivobook F556UQ-XO626D Intel Core i5-6198DU 2.3GHz
HD Graphics 510
fps
63%
UHD Graphics 600:
33 33.9 ~ 33 fps
100%
HD Graphics 510:
23.9 [X] Asus Vivobook F556UQ-XO626D Intel Core i5-6198DU 2.3GHz
HD Graphics 510
fps
100%
HD Graphics 510:
16.2 [X] Asus Vivobook F556UQ-XO626D Intel Core i5-6198DU 2.3GHz
HD Graphics 510
fps
Iris Pro Graphics 580:
115.8 fps
Iris Pro Graphics 580:
38.7 fps
Iris Pro Graphics 580:
16.7 fps
Iris Pro Graphics 580:
107.2 fps
Iris Pro Graphics 580:
81.2 fps
Iris Pro Graphics 580:
37.3 fps
Iris Pro Graphics 580:
8.8 fps
UHD Graphics 600:
24.6 fps
UHD Graphics 600:
15.8 fps
UHD Graphics 600:
18.5 fps
UHD Graphics 600:
12.2 fps
UHD Graphics 600:
19.2 fps
UHD Graphics 600:
12.9 fps
UHD Graphics 600:
61.6 fps
UHD Graphics 600:
14.9 fps
UHD Graphics 600:
10.6 fps
UHD Graphics 600:
25.1 fps
UHD Graphics 600:
12.3 fps
UHD Graphics 600:
43.9 fps
Average Gaming Intel HD Graphics 510 → 100% Average Gaming 30-70 fps → 100%
Average Gaming Intel UHD Graphics 600 → 54% Average Gaming 30-70 fps → 50%
Average Gaming Intel Iris Pro Graphics 580 → 215% Average Gaming 30-70 fps → 202%
Intel Iris Pro Graphics 580 low med. high ultra QHD 4K Overwatch 60.5 53.3 42.9 23.1 Doom Rise of the Tomb Raider 30.2 18.2 12.2 8.9 Fallout 4 Metal Gear Solid V 59.9 58.6 23 14.9 Dota 2 Reborn 59.8 37.2 15.3 14 Batman: Arkham Knight Thief 43.8 30.1 25 12.4 Metro: Last Light 63.7 50.8 28.5 14.3 BioShock Infinite 101.3 57.9 51 14.9 StarCraft II: Heart of the Swarm 380.6 127.1 73.6 36.2 Guild Wars 2 115.8 38.7 16.7 Sleeping Dogs 107.2 81.2 37.3 8.8 < 30 fps < 60 fps < 120 fps ≥ 120 fps 4 5 1 1 6 1 1 5 4 1 9 1
For more games that might be playable and a list of all games and graphics cards visit our Gaming List
v1.26
log 23. 23:43:19
#0 checking url part for id 6475 +0s ... 0s
#1 checking url part for id 8272 +0s ... 0s
#2 checking url part for id 7236 +0s ... 0s
#3 not redirecting to Ajax server +0s ... 0s
#4 did not recreate cache, as it is less than 5 days old! Created at Mon, 22 Apr 2024 05:40:21 +0200 +0.001s ... 0.001s
#5 composed specs +0.132s ... 0.133s
#6 did output specs +0s ... 0.133s
#7 start showIntegratedCPUs +0s ... 0.133s
#8 getting avg benchmarks for device 6475 +0.054s ... 0.187s
#9 got single benchmarks 6475 +0.015s ... 0.202s
#10 getting avg benchmarks for device 8272 +0.014s ... 0.216s
#11 got single benchmarks 8272 +0.133s ... 0.349s
#12 getting avg benchmarks for device 7236 +0.016s ... 0.365s
#13 got single benchmarks 7236 +0.008s ... 0.373s
#14 got avg benchmarks for devices +0s ... 0.373s
#15 min, max, avg, median took s +0.325s ... 0.698s
#16 before gaming benchmark output +0s ... 0.698s
#17 Got 351 rows for game benchmarks. +0.03s ... 0.728s
#18 composed SQL query for gamebenchmarks +0s ... 0.728s
#19 got data and put it in $dataArray +0.041s ... 0.769s
#20 benchmarks composed for output. +0.142s ... 0.911s
#21 calculated avg scores. +0s ... 0.911s
#22 return log +0.003s ... 0.914s
Please share our article, every link counts!
Redaktion, 2017-09- 8 (Update: 2023-07- 1)
 Deutsch
 English
 Español
 Français
 Italiano
 Nederlands
 Polski
 Português
 Русский
 Türkçe
 Svenska
 Chinese
 Magyar