Intel HD Graphics 510 vs Intel HD Graphics 500 vs Intel UHD Graphics 605
Intel HD Graphics 510 ► remove from comparison
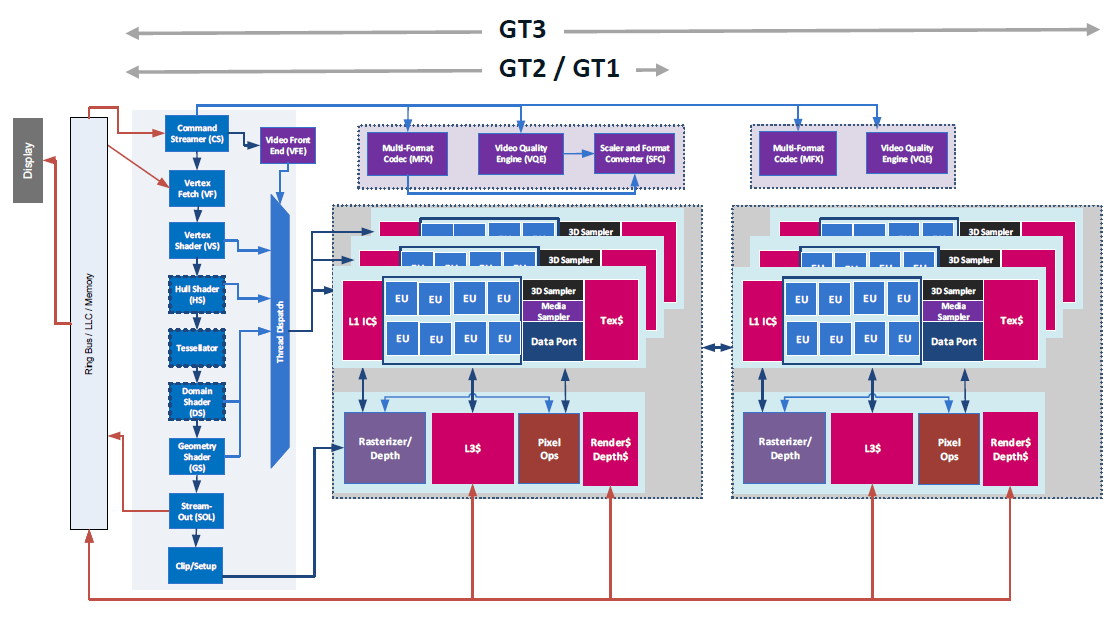
The Intel HD Graphics 510 (GT1) is an integrated graphics unit, which can be found in low-end ULV (Ultra Low Voltage) processors of the Skylake generation. This "GT1" version of the Skylake GPU offers 12 Execution Units (EUs) clocked at up to 950 MHz (depending on the CPU model). Due to its lack of dedicated graphics memory or eDRAM cache, the HD 510 has to access the main memory (2x 64bit DDR3L-1600 / DDR4-2133).
Performance
Depending on various factors like memory configuration, the HD Graphics 510 should perform sligthly below the older HD Graphics 4400 and will handle modern games (as of 2015) only in lowest settings (if it does at all).
Features
The revised video engine now decodes H.265/HEVC completely in hardware and thereby much more efficiently than before. Displays can be connected via DP 1.2 / eDP 1.3 (max. 3840 x 2160 @ 60 Hz), whereas HDMI is limited to the older version 1.4a (max. 3840 x 2160 @ 30 Hz). However, HDMI 2.0 can be added using a DisplayPort converter. Up to three displays can be controlled simultaneously.
Power Consumption
The HD Graphics 510 can be found in mobile processors specified at 15 W TDP and is therefore suited for compact laptops and ultrabooks.
Intel HD Graphics 500 ► remove from comparison
The Intel HD Graphics 500 is an integrated processor graphics unit from the Apollo Lake generation (e. g. Celeron N3450 and Celeron N3350), which was announced mid 2016. The GPU can convince with low consumption figures, but the performance is only in the low-end segment and is rarely sufficient for modern games. Being a partial configuration of the Apollo Lake GPU, the HD Graphics 505 is equipped with just 12 Execution Units (EUs) (HD Graphics 505: 18 EUs) running at up to 650-700 MHz depending on the model. The technical specifications of the GPU are based on Intel's Gen9 architecture, which is also used for the more expensive Skylake series.
Due to its lack of dedicated graphics memory or eDRAM cache, the HD 505 has to access the main memory via processor (2x 64bit DDR3L-/LPDDR3-1866, LPDDR4-2400).
Performance
The HD Graphics 505 should be slightly slower than the older Broadwell GPU HD Graphics (Broadwell) , so modern games (as of 2016) will rarely run smoothly even at the lowest settings.
Features
The revised video engine now decodes H.265/HEVC completely in hardware and thereby much more efficiently than before. Up to three displays can be connected via DP/eDP or HDMI (4K probably only at 30 Hz via HDMI 1.4).
Power Consumption
The TDP of the whole Pentium N4200 chip is 6 Watts by default, so the GPU is primarily used for (often passively cooled) netbooks or thin notebooks. The TDP can also be reduced to 4 Watts, but this will obviously affect the performance.
Intel UHD Graphics 605 ► remove from comparison
The Intel UHD Graphics 605 is an integrated processor graphics unit from the Gemini Lake generation (e. g. Pentium Silver N5000), which was announced late 2017. The GPU can convince with low consumption figures, but the performance is only in the low-end segment and is rarely sufficient for modern games. Being the maximum configuration of the Gemini Lake GPU, the UHD Graphics 605 is equipped with 18 Execution Units (EUs) running at up to 750 MHz. The technical specifications of the GPU are based on Intel's Gen9 architecture, which is also used for the more expensive Skylake series and also in the predecessor HD Graphics 505.
Due to its lack of dedicated graphics memory or eDRAM cache, the UHD 605 has to access the main memory via processor (2x 64bit DDR4/LPDDR4-2400).
Performance
The UHD Graphics 605 offers a similar performance as the Intel HD Graphics 505 in the Apollo Lake SoCs (same Gen 9 architecture). Therefore, the GPU is only suited for some very low demanding games like Dirt Rally or Sims 4.
Features
The video engine decodes H.265/HEVC (8b and 10b) and VP9 completely in hardware. Up to three displays can be connected via DP 1.2a/eDP 1.3 or HDMI 2.0a (including HDCP 2.2).
Power Consumption
The TDP of the whole Pentium Silver N5000 chip is 6 Watts by default, so the GPU is primarily used for (often passively cooled) netbooks or thin notebooks. The TDP can also be reduced to 4.9 Watts, but this will obviously affect the performance.
Intel HD Graphics 510 Intel HD Graphics 500 Intel UHD Graphics 605 Gen. 9 Series Codename Skylake GT1 Apollo Lake Gemini Lake Architecture Gen. 9 Skylake Gen. 9 Apollo Lake Gen. 9 Apollo Lake Pipelines 12 - unified 12 - unified 18 - unified Core Speed 300 - 950 (Boost) MHz 300 - 700 (Boost) MHz 300 - 750 (Boost) MHz Memory Bus Width 64/128 Bit 64/128 Bit 64/128 Bit Memory Type DDR3/DDR4 DDR4 / LPDDR4 Shared Memory yes yes yes API DirectX 12_1, OpenGL 4.4 DirectX 12_1, OpenGL 4.4 DirectX 12_1, OpenGL 4.4 technology 14 nm 14 nm 14 nm Features QuickSync QuickSync QuickSync Date of Announcement 01.09.2015 01.09.2016 11.12.2017 Link to Manufacturer Page ark.intel.com
Benchmarks Performance Rating - 3DMark 11 + Fire Strike + Time Spy - HD Graphics 510
0.3 pt (1%)
...
...
max:
Performance Rating - 3DMark 11 + Fire Strike + Time Spy - HD Graphics 500
0.2 pt (0%)
...
...
max:
Performance Rating - 3DMark 11 + Fire Strike + Time Spy - UHD Graphics 605
0.2 pt (1%)
...
...
max:
3DMark - 3DMark Time Spy Score
129 Points (0%)
3DMark - 3DMark Time Spy Graphics
113 Points (0%)
3DMark - 3DMark Ice Storm Unlimited Graphics
43274 Points (5%)
min: 19294 avg: 24491 median: 24609 (3%) max: 29579 Points
min: 32770 avg: 43574 median: 45008 (5%) max: 55453 Points
3DMark - 3DMark Ice Storm Extreme Graphics
26846 Points (3%)
min: 12299 avg: 15195 median: 15085 (2%) max: 18200 Points
min: 13350 avg: 16118 median: 16553.5 (2%) max: 18016 Points
3DMark - 3DMark Cloud Gate Score
4721 Points (5%)
min: 1932 avg: 2140 median: 2116 (2%) max: 2306 Points
min: 2670 avg: 3247 median: 3154 (3%) max: 4294 Points
3DMark - 3DMark Cloud Gate Graphics
5664 Points (1%)
min: 2578 avg: 3030 median: 3007 (1%) max: 3693 Points
min: 2874 avg: 3518 median: 3359.5 (1%) max: 4485 Points
3DMark - 3DMark Fire Strike Standard Score
570 Points (1%)
min: 271 avg: 321.5 median: 307 (1%) max: 401 Points
min: 376 avg: 450.1 median: 419 (1%) max: 620 Points
3DMark - 3DMark Fire Strike Standard Graphics
621 Points (1%)
min: 293 avg: 355.9 median: 362.5 (0%) max: 444 Points
min: 411 avg: 473.4 median: 454 (1%) max: 576 Points
3DMark - 3DMark Ice Storm Graphics
62653 Points (8%)
min: 20140 avg: 26074 median: 23761 (3%) max: 34320 Points
min: 20859 avg: 25930 median: 26031 (3%) max: 30797 Points
3DMark - 3DMark Sling Shot (ES 3.0) Unlimited
2870 Points (12%)
3DMark - 3DMark Sling Shot (ES 3.0) Unlimited Graphics
2805 Points (6%)
3DMark - 3DMark Sling Shot Extreme (ES 3.1) Unlimited
1628 Points (8%)
3DMark - 3DMark Sling Shot Extreme (ES 3.1) Unlimited Graphics
1450 Points (4%)
3DMark - 3DMark Wild Life Unlimited
882 Points (0%)
3DMark - 3DMark Wild Life Extreme Unlimited
281 Points (0%)
3DMark - 3DMark Night Raid
min: 1614 avg: 1751 median: 1619 (2%) max: 2019 Points
3DMark - 3DMark Night Raid Graphics Score
min: 1849 avg: 2059 median: 1893 (1%) max: 2434 Points
3DMark 11 - 3DM11 Performance Score
985 Points (1%)
min: 414 avg: 533 median: 530 (1%) max: 655 Points
min: 655 avg: 795 median: 748 (1%) max: 1009 Points
3DMark 11 - 3DM11 Performance GPU
847 Points (1%)
min: 368 avg: 478.6 median: 482 (0%) max: 584 Points
min: 588 avg: 701 median: 648 (1%) max: 902 Points
3DMark Vantage + Intel HD Graphics 510 3DMark Vantage - 3DM Vant. Perf. total
3798 Points (1%)
3DM Vant. Perf. total + Intel UHD Graphics 605
2162 Points (1%)
3DM Vant. Perf. GPU no PhysX + Intel HD Graphics 510 3DMark Vantage - 3DM Vant. Perf. GPU no PhysX
3125 Points (2%)
3DM Vant. Perf. GPU no PhysX + Intel UHD Graphics 605
1785 Points (1%)
3DMark 03 - 3DMark 03 - Standard
8388 Points (4%)
3DMark 05 - 3DMark 05 - Standard
5802 Points (6%)
3DMark 06 3DMark 06 - Standard 1280x1024 + Intel HD Graphics 510
7253 Points (9%)
Model CPU GPU RAM Value 3DMark 06 - Standard 1280x1024 Asus Vivobook F556UQ-XO626D (3DMark 06 - Standard 1280x1024) 6198DU HD Graphics 510 100 MHz8 GB 7253
3DMark 06 - Standard 1280x1024 + Intel HD Graphics 500
min: 3393 avg: 3551 median: 3506 (5%) max: 3753 Points
3DMark 06 - Standard 1280x1024 + Intel UHD Graphics 605
min: 2882 avg: 4208 median: 4171 (5%) max: 5570 Points
Unigine Valley 1.0 - Unigine Valley 1.0 DX
1.7 fps (1%)
Unigine Heaven 3.0 - Unigine Heaven 3.0 DX 11
9.3 fps (3%)
6.5 fps (2%)
Unigine Heaven 3.0 - Unigine Heaven 3.0 OpenGL
10.8 fps (5%)
7.2 fps (3%)
Unigine Heaven 2.1 - Heaven 2.1 high
13.5 fps (3%)
9 fps (2%)
Cinebench R10 Cinebench R10 Shading (32bit) + Intel HD Graphics 510 Cinebench R10 - Cinebench R10 Shading (32bit)
7348 Points (5%)
Cinebench R10 Shading (32bit) + Intel HD Graphics 500
min: 2791 avg: 2888 median: 2894 (2%) max: 3031 Points
Cinebench R10 Shading (32bit) + Intel UHD Graphics 605
min: 3505 avg: 3812 median: 3773 (3%) max: 4366 Points
Cinebench R11.5 Cinebench R11.5 OpenGL 64 Bit + Intel HD Graphics 510 Cinebench R11.5 - Cinebench R11.5 OpenGL 64 Bit
17.2 fps (6%)
Cinebench R11.5 OpenGL 64 Bit + Intel HD Graphics 500
min: 7.05 avg: 8.2 median: 8.1 (3%) max: 9.61 fps
Cinebench R11.5 OpenGL 64 Bit + Intel UHD Graphics 605
min: 15.24 avg: 17.9 median: 17.9 (6%) max: 20.5 fps
Cinebench R15 + Intel HD Graphics 510 Cinebench R15 - Cinebench R15 OpenGL 64 Bit
28 fps (2%)
Cinebench R15 OpenGL 64 Bit + Intel HD Graphics 500
min: 10.15 avg: 12.9 median: 13 (1%) max: 15.74 fps
Cinebench R15 OpenGL 64 Bit + Intel UHD Graphics 605
min: 13.37 avg: 18.2 median: 18.1 (1%) max: 25.6 fps
Cinebench R15 OpenGL Ref. Match 64 Bit + Intel HD Graphics 500 Cinebench R15 - Cinebench R15 OpenGL Ref. Match 64 Bit
min: 97.7 avg: 97.8 median: 97.8 (98%) max: 98 %
Cinebench R15 OpenGL Ref. Match 64 Bit + Intel UHD Graphics 605
97.8 % (98%)
GFXBench - GFXBench 5.0 Aztec Ruins High Tier Offscreen
3.6 fps (1%)
min: 5.9 avg: 6.4 median: 6.4 (1%) max: 6.8 fps
GFXBench - GFXBench 5.0 Aztec Ruins Normal Tier Offscreen
9.7 fps (1%)
min: 9.9 avg: 12.8 median: 12.8 (1%) max: 15.7 fps
GFXBench - GFXBench Car Chase Offscreen
35.9 fps (4%)
8.4 fps (1%)
min: 7.1 avg: 11 median: 11.3 (1%) max: 14.6 fps
GFXBench 3.1 - GFXBench Manhattan ES 3.1 Offscreen
51.7 fps (1%)
15 fps (0%)
min: 13 avg: 17.6 median: 16.5 (0%) max: 23.3 fps
GFXBench 3.0 - GFXBench 3.0 Manhattan Offscreen
64.6 fps (4%)
20 fps (1%)
min: 16 avg: 23.8 median: 22.1 (1%) max: 33.4 fps
GFXBench (DX / GLBenchmark) 2.7 + Intel HD Graphics 510 GFXBench (DX / GLBenchmark) 2.7 - GFXBench T-Rex HD Offscreen C24Z16
121.9 fps (1%)
GFXBench T-Rex HD Offscreen C24Z16 + Intel HD Graphics 500 42 fps (0%)
GFXBench T-Rex HD Offscreen C24Z16 + Intel UHD Graphics 605 min: 32 avg: 43.1 median: 45.5 (0%) max: 51.9 fps
Basemark GPU 1.2 - Basemark GPU 1.2 Vulkan Official Medium Offscreen 1080
16.3 fps (0%)
23.3 fps (0%)
Basemark GPU 1.2 - Basemark GPU 1.2 Vulkan Official High Offscreen 2160
2 fps (0%)
LuxMark v2.0 64Bit - LuxMark v2.0 Room GPU
167 Samples/s (1%)
49 Samples/s (0%)
min: 67 avg: 93.5 median: 93.5 (0%) max: 120 Samples/s
LuxMark v2.0 64Bit - LuxMark v2.0 Sala GPU
302 Samples/s (1%)
79 Samples/s (0%)
min: 96 avg: 142 median: 142 (0%) max: 188 Samples/s
ComputeMark v2.1 - ComputeMark v2.1 Result
500 Points (1%)
min: 296 avg: 320 median: 324 (0%) max: 336 Points
min: 432 avg: 490.5 median: 490.5 (1%) max: 549 Points
Power Consumption - Furmark Stress Test Power Consumption - external Monitor *
8.9 Watt (1%)
min: 10.3 avg: 11 median: 11 (2%) max: 11.6 Watt
Power Consumption - Witcher 3 Power Consumption *
11.8 Watt (3%)
Power Consumption - Witcher 3 ultra Power Efficiency
0.1 fps per Watt (10%)
Clock Speed - GPU Clock Speed Furmark
450 MHz (18%)
515 MHz (20%)
Average Benchmarks Intel HD Graphics 510 → 100% n=20 Average Benchmarks Intel HD Graphics 500 → 45% n=20 Average Benchmarks Intel UHD Graphics 605 → 62% n=20
- Range of benchmark values for this graphics card
- Average benchmark values for this graphics card
* Smaller numbers mean a higher performance
1 This benchmark is not used for the average calculation
Game Benchmarks The following benchmarks stem from our benchmarks of review laptops. The performance depends on the used graphics memory, clock rate, processor, system settings, drivers, and operating systems. So the results don't have to be representative for all laptops with this GPU. For detailed information on the benchmark results, click on the fps number.
UHD Graphics 605:
31.1 [X] Topjoy Falcon Intel Pentium Silver N5000 1.1GHz
UHD Graphics 605
min:
26 fps, max:
58 fps
fps
UHD Graphics 605:
7 8.2 [X] Topjoy Falcon Intel Pentium Silver N5000 1.1GHz
UHD Graphics 605
min:
6 fps, max:
11 fps
~ 8 fps
UHD Graphics 605:
49.8 [X] Topjoy Falcon Intel Pentium Silver N5000 1.1GHz
UHD Graphics 605
min:
41 fps, max:
60 fps
fps
UHD Graphics 605:
39 [X] Topjoy Falcon Intel Pentium Silver N5000 1.1GHz
UHD Graphics 605
min:
24 fps, max:
50 fps
fps
UHD Graphics 605:
26.6 [X] Topjoy Falcon Intel Pentium Silver N5000 1.1GHz
UHD Graphics 605
min:
18 fps, max:
34 fps
fps
UHD Graphics 605:
24.9 [X] Topjoy Falcon Intel Pentium Silver N5000 1.1GHz
UHD Graphics 605
min:
17 fps, max:
32 fps
fps
UHD Graphics 605:
23.6 [X] Topjoy Falcon Intel Pentium Silver N5000 1.1GHz
UHD Graphics 605
min:
11 fps, max:
33 fps
fps
UHD Graphics 605:
15 [X] Topjoy Falcon Intel Pentium Silver N5000 1.1GHz
UHD Graphics 605
min:
8 fps, max:
22 fps
fps
UHD Graphics 605:
11.7 (!) [X] Topjoy Falcon Intel Pentium Silver N5000 1.1GHz
UHD Graphics 605
min:
9 fps, max:
15 fps
17.6 ~ 15 fps
HD Graphics 500:
0 (!) [X] Jumper EZbook 3 Intel Celeron N3350 1.1GHz
HD Graphics 500
fps
HD Graphics 500:
34.4 (!) [X] Jumper EZbook 3 Intel Celeron N3350 1.1GHz
HD Graphics 500
max:
93 fps
fps
HD Graphics 500:
4.6 (!) [X] Jumper EZbook 3 Intel Celeron N3350 1.1GHz
HD Graphics 500
max:
9 fps
fps
UHD Graphics 605:
5 6.4 7.2 8.6 [X] Intel NUC7PJYHN Intel Pentium Silver J5040 2GHz
UHD Graphics 605
9.1 ~ 7 fps
HD Graphics 500:
3.9 4.7 ~ 4 fps
UHD Graphics 605:
3.5 5.9 6 6.1 [X] Intel NUC7PJYHN Intel Pentium Silver J5040 2GHz
UHD Graphics 605
~ 5 fps
HD Graphics 500:
3.6 4.3 ~ 4 fps
UHD Graphics 605:
3.1 5.3 5.5 5.5 [X] Intel NUC7PJYHN Intel Pentium Silver J5040 2GHz
UHD Graphics 605
~ 5 fps
UHD Graphics 605:
3.4 4.2 4.4 5.2 7.5 [X] Intel NUC7PJYHN 1.3
Intel Pentium Silver J5040 2GHz
UHD Graphics 605
~ 5 fps
UHD Graphics 605:
3.3 [X] Intel NUC7PJYHN 1.3
Intel Pentium Silver J5040 2GHz
UHD Graphics 605
fps
UHD Graphics 605:
38 41.4 ~ 40 fps
UHD Graphics 605:
17 18.4 ~ 18 fps
UHD Graphics 605:
18.8 fps
UHD Graphics 605:
9.9 10 ~ 10 fps
100%
HD Graphics 510:
18.3 [X] Asus Vivobook F556UQ-XO626D Intel Core i5-6198DU 2.3GHz
HD Graphics 510
fps
43%
UHD Graphics 605:
7.9 fps
100%
HD Graphics 510:
19.9 [X] Asus Vivobook F556UQ-XO626D Intel Core i5-6198DU 2.3GHz
HD Graphics 510
fps
100%
HD Graphics 510:
15.4 [X] Asus Vivobook F556UQ-XO626D Intel Core i5-6198DU 2.3GHz
HD Graphics 510
fps
100%
HD Graphics 510:
70.6 [X] Asus Vivobook F556UQ-XO626D Intel Core i5-6198DU 2.3GHz
HD Graphics 510
fps
100%
HD Graphics 510:
41.3 [X] Asus Vivobook F556UQ-XO626D Intel Core i5-6198DU 2.3GHz
HD Graphics 510
fps
100%
HD Graphics 510:
24.5 [X] Asus Vivobook F556UQ-XO626D Intel Core i5-6198DU 2.3GHz
HD Graphics 510
fps
52%
UHD Graphics 605:
12.7 fps
100%
HD Graphics 510:
9.4 [X] Asus Vivobook F556UQ-XO626D Intel Core i5-6198DU 2.3GHz
HD Graphics 510
fps
59%
UHD Graphics 605:
5.5 fps
UHD Graphics 605:
11.4 fps
100%
HD Graphics 510:
13.4 [X] Asus Vivobook F556UQ-XO626D Intel Core i5-6198DU 2.3GHz
HD Graphics 510
fps
32%
UHD Graphics 605:
4.3 fps
100%
HD Graphics 510:
7.7 [X] Asus Vivobook F556UQ-XO626D Intel Core i5-6198DU 2.3GHz
HD Graphics 510
fps
100%
HD Graphics 510:
11.1 [X] Asus Vivobook F556UQ-XO626D Intel Core i5-6198DU 2.3GHz
HD Graphics 510
fps
62%
UHD Graphics 605:
6.9 fps
100%
HD Graphics 510:
7 [X] Asus Vivobook F556UQ-XO626D Intel Core i5-6198DU 2.3GHz
HD Graphics 510
fps
100%
HD Graphics 510:
25 [X] Asus Vivobook F556UQ-XO626D Intel Core i5-6198DU 2.3GHz
HD Graphics 510
fps
62%
HD Graphics 500:
15.5 fps
49%
UHD Graphics 605:
12.3 fps
100%
HD Graphics 510:
15.9 [X] Asus Vivobook F556UQ-XO626D Intel Core i5-6198DU 2.3GHz
HD Graphics 510
fps
100%
HD Graphics 510:
19.9 [X] Asus Vivobook F556UQ-XO626D Intel Core i5-6198DU 2.3GHz
HD Graphics 510
fps
100%
HD Graphics 510:
11 [X] Asus Vivobook F556UQ-XO626D Intel Core i5-6198DU 2.3GHz
HD Graphics 510
fps
100%
HD Graphics 510:
48.7 [X] Asus Vivobook F556UQ-XO626D Intel Core i5-6198DU 2.3GHz
HD Graphics 510
fps
39%
HD Graphics 500:
19.1 fps
49%
UHD Graphics 605:
22.7 24.7 [X] Topjoy Falcon Intel Pentium Silver N5000 1.1GHz
UHD Graphics 605
min:
11 fps, max:
35 fps
~ 24 fps
100%
HD Graphics 510:
29.2 [X] Asus Vivobook F556UQ-XO626D Intel Core i5-6198DU 2.3GHz
HD Graphics 510
fps
49%
UHD Graphics 605:
14.3 fps
100%
HD Graphics 510:
38.9 [X] Asus Vivobook F556UQ-XO626D Intel Core i5-6198DU 2.3GHz
HD Graphics 510
fps
42%
HD Graphics 500:
16.4 fps
56%
UHD Graphics 605:
21.6 fps
100%
HD Graphics 510:
25.2 [X] Asus Vivobook F556UQ-XO626D Intel Core i5-6198DU 2.3GHz
HD Graphics 510
fps
38%
HD Graphics 500:
9.7 fps
63%
UHD Graphics 605:
15.8 fps
100%
HD Graphics 510:
66.2 [X] Asus Vivobook F556UQ-XO626D Intel Core i5-6198DU 2.3GHz
HD Graphics 510
fps
56%
UHD Graphics 605:
32.5 33.7 35 35.9 36.5 49.5 [X] Intel NUC7PJYHN Intel Pentium Silver J5040 2GHz
UHD Graphics 605
min:
42.8 fps, max:
-1 fps
~ 37 fps
100%
HD Graphics 510:
41.8 [X] Asus Vivobook F556UQ-XO626D Intel Core i5-6198DU 2.3GHz
HD Graphics 510
fps
36%
UHD Graphics 605:
11.5 14 14.3 14.3 15.1 18.6 [X] Intel NUC7PJYHN Intel Pentium Silver J5040 2GHz
UHD Graphics 605
min:
13.1 fps, max:
-1 fps
~ 15 fps
UHD Graphics 605:
5.9 6.7 7.4 7.8 10.6 [X] Intel NUC7PJYHN Intel Pentium Silver J5040 2GHz
UHD Graphics 605
min:
8.7 fps, max:
-1 fps
~ 8 fps
UHD Graphics 605:
5.9 6.7 10 [X] Intel NUC7PJYHN Intel Pentium Silver J5040 2GHz
UHD Graphics 605
min:
8.2 fps, max:
-1 fps
~ 8 fps
100%
HD Graphics 510:
110.4 [X] Asus Vivobook F556UQ-XO626D Intel Core i5-6198DU 2.3GHz
HD Graphics 510
fps
26%
HD Graphics 500:
28.5 fps
38%
UHD Graphics 605:
42 fps
100%
HD Graphics 510:
19.3 [X] Asus Vivobook F556UQ-XO626D Intel Core i5-6198DU 2.3GHz
HD Graphics 510
fps
65%
HD Graphics 500:
12.5 fps
65%
UHD Graphics 605:
12.5 fps
100%
HD Graphics 510:
30.9 [X] Asus Vivobook F556UQ-XO626D Intel Core i5-6198DU 2.3GHz
HD Graphics 510
fps
36%
UHD Graphics 605:
9.5 11.6 11.7 [X] Topjoy Falcon Intel Pentium Silver N5000 1.1GHz
UHD Graphics 605
min:
0.501 fps, P1:
5.85 fps, max:
33.2 fps
~ 11 fps
100%
HD Graphics 510:
26.8 [X] Asus Vivobook F556UQ-XO626D Intel Core i5-6198DU 2.3GHz
HD Graphics 510
fps
35%
UHD Graphics 605:
9.3 [X] Topjoy Falcon Intel Pentium Silver N5000 1.1GHz
UHD Graphics 605
min:
0.3784 fps, P1:
4.59 fps, max:
34.4 fps
fps
100%
HD Graphics 510:
31.5 [X] Asus Vivobook F556UQ-XO626D Intel Core i5-6198DU 2.3GHz
HD Graphics 510
fps
35%
UHD Graphics 605:
10.9 fps
100%
HD Graphics 510:
22.2 [X] Asus Vivobook F556UQ-XO626D Intel Core i5-6198DU 2.3GHz
HD Graphics 510
fps
43%
UHD Graphics 605:
9.5 fps
100%
HD Graphics 510:
72 [X] Asus Vivobook F556UQ-XO626D Intel Core i5-6198DU 2.3GHz
HD Graphics 510
fps
31%
HD Graphics 500:
22 fps
43%
UHD Graphics 605:
31 fps
100%
HD Graphics 510:
47 [X] Asus Vivobook F556UQ-XO626D Intel Core i5-6198DU 2.3GHz
HD Graphics 510
fps
34%
HD Graphics 500:
16 fps
43%
UHD Graphics 605:
20 fps
UHD Graphics 605:
17.5 fps
UHD Graphics 605:
13.1 fps
UHD Graphics 605:
14.4 fps
100%
HD Graphics 510:
173.7 [X] Asus Vivobook F556UQ-XO626D Intel Core i5-6198DU 2.3GHz
HD Graphics 510
fps
41%
HD Graphics 500:
71.6 fps
56%
UHD Graphics 605:
96.9 fps
100%
HD Graphics 510:
32.2 [X] Asus Vivobook F556UQ-XO626D Intel Core i5-6198DU 2.3GHz
HD Graphics 510
fps
43%
HD Graphics 500:
13.7 fps
68%
UHD Graphics 605:
21.8 fps
UHD Graphics 605:
10.5 fps
UHD Graphics 605:
14.3 fps
100%
HD Graphics 510:
135.5 [X] Asus Vivobook F556UQ-XO626D Intel Core i5-6198DU 2.3GHz
HD Graphics 510
fps
32%
HD Graphics 500:
43.8 fps
43%
UHD Graphics 605:
58.5 fps
100%
HD Graphics 510:
32.8 [X] Asus Vivobook F556UQ-XO626D Intel Core i5-6198DU 2.3GHz
HD Graphics 510
fps
58%
HD Graphics 500:
19.1 fps
50%
UHD Graphics 605:
16.5 fps
UHD Graphics 605:
12.5 fps
100%
HD Graphics 510:
33.4 [X] Asus Vivobook F556UQ-XO626D Intel Core i5-6198DU 2.3GHz
HD Graphics 510
fps
100%
HD Graphics 510:
22.5 [X] Asus Vivobook F556UQ-XO626D Intel Core i5-6198DU 2.3GHz
HD Graphics 510
fps
100%
HD Graphics 510:
15.9 [X] Asus Vivobook F556UQ-XO626D Intel Core i5-6198DU 2.3GHz
HD Graphics 510
fps
UHD Graphics 605:
34.7 fps
UHD Graphics 605:
17.1 fps
100%
HD Graphics 510:
39 [X] Asus Vivobook F556UQ-XO626D Intel Core i5-6198DU 2.3GHz
HD Graphics 510
fps
100%
HD Graphics 510:
20.1 [X] Asus Vivobook F556UQ-XO626D Intel Core i5-6198DU 2.3GHz
HD Graphics 510
fps
50%
HD Graphics 500:
8.8 9.6 9.8 [X] Acer Aspire 1 A114-31-C472 Intel Celeron N3450 1.1GHz
HD Graphics 500
11 13 ~ 10 fps
100%
HD Graphics 510:
17.7 [X] Asus Vivobook F556UQ-XO626D Intel Core i5-6198DU 2.3GHz
HD Graphics 510
fps
51%
HD Graphics 500:
7.9 8.9 [X] Acer Aspire 1 A114-31-C472 Intel Celeron N3450 1.1GHz
HD Graphics 500
9.7 ~ 9 fps
100%
HD Graphics 510:
52.7 [X] Asus Vivobook F556UQ-XO626D Intel Core i5-6198DU 2.3GHz
HD Graphics 510
fps
41%
HD Graphics 500:
21.5 fps
60%
UHD Graphics 605:
31.6 fps
100%
HD Graphics 510:
23.9 [X] Asus Vivobook F556UQ-XO626D Intel Core i5-6198DU 2.3GHz
HD Graphics 510
fps
39%
HD Graphics 500:
9.3 fps
77%
UHD Graphics 605:
18.5 fps
100%
HD Graphics 510:
16.2 [X] Asus Vivobook F556UQ-XO626D Intel Core i5-6198DU 2.3GHz
HD Graphics 510
fps
77%
UHD Graphics 605:
12.5 fps
UHD Graphics 605:
32.3 fps
UHD Graphics 605:
17.1 fps
UHD Graphics 605:
14.1 fps
HD Graphics 500:
14 16.6 ~ 15 fps
HD Graphics 500:
12.7 22 ~ 17 fps
UHD Graphics 605:
28.8 fps
UHD Graphics 605:
21.1 fps
UHD Graphics 605:
18.6 fps
UHD Graphics 605:
12.5 fps
UHD Graphics 605:
11.4 fps
UHD Graphics 605:
19.9 fps
UHD Graphics 605:
12.3 fps
UHD Graphics 605:
27.4 fps
UHD Graphics 605:
21.2 fps
UHD Graphics 605:
55.6 fps
UHD Graphics 605:
22.7 fps
UHD Graphics 605:
15.2 fps
UHD Graphics 605:
12.5 fps
UHD Graphics 605:
78.7 fps
UHD Graphics 605:
17.4 fps
Average Gaming Intel HD Graphics 510 → 100% Average Gaming 30-70 fps → 100%
Average Gaming Intel HD Graphics 500 → 43% Average Gaming 30-70 fps → 32%
Average Gaming Intel UHD Graphics 605 → 52% Average Gaming 30-70 fps → 48%
For more games that might be playable and a list of all games and graphics cards visit our Gaming List
v1.26
log 24. 14:10:41
#0 checking url part for id 6475 +0s ... 0s
#1 checking url part for id 7543 +0s ... 0s
#2 checking url part for id 8270 +0s ... 0s
#3 not redirecting to Ajax server +0s ... 0s
#4 did not recreate cache, as it is less than 5 days old! Created at Mon, 22 Apr 2024 05:40:21 +0200 +0.001s ... 0.001s
#5 composed specs +0.189s ... 0.191s
#6 did output specs +0s ... 0.191s
#7 start showIntegratedCPUs +0s ... 0.191s
#8 getting avg benchmarks for device 6475 +0.057s ... 0.247s
#9 got single benchmarks 6475 +0.016s ... 0.263s
#10 getting avg benchmarks for device 7543 +0.018s ... 0.281s
#11 got single benchmarks 7543 +0.092s ... 0.373s
#12 getting avg benchmarks for device 8270 +0.014s ... 0.387s
#13 got single benchmarks 8270 +0.051s ... 0.437s
#14 got avg benchmarks for devices +0s ... 0.437s
#15 min, max, avg, median took s +0.359s ... 0.797s
#16 before gaming benchmark output +0s ... 0.797s
#17 Got 329 rows for game benchmarks. +0.03s ... 0.827s
#18 composed SQL query for gamebenchmarks +0s ... 0.827s
#19 got data and put it in $dataArray +0.042s ... 0.869s
#20 benchmarks composed for output. +0.141s ... 1.01s
#21 calculated avg scores. +0s ... 1.01s
#22 return log +0.003s ... 1.013s
Please share our article, every link counts!
Redaktion, 2017-09- 8 (Update: 2023-07- 1)
 Deutsch
 English
 Español
 Français
 Italiano
 Nederlands
 Polski
 Português
 Русский
 Türkçe
 Svenska
 Chinese
 Magyar