Intel HD Graphics 405 (Braswell) vs Intel HD Graphics (Cherry Trail) vs Intel HD Graphics 5300
Intel HD Graphics 405 (Braswell) ► remove from comparison
The Intel HD Graphics 405 (Braswell) is an integrated graphics card in the low end SoCs of the Braswell series (e.g. Pentium N3710 ). It is based on the same architecture as the integrated GPU of the Broadwell graphics cards (e.g. HD Graphics 5300 ), but offers less shader cores and slower clock speeds.
The GPU was simply called Intel HD Graphics (Broadwell) before 2016 and included also the slower 12 EUs version in the Celeron model. The Graphics 405 name currently only stands for 16-core-versions in Pentium models. The 12 EU version is now called Intel HD Graphics 400.
The clock speed and memory configuration can still vary from model to model.
Gaming performance ist still only suited for older or less demanding games. Often also the processor is limited gaming performance (e.g. in the dual-core N3000).
The SoC also integrates a video decoding engine that should be able to handle 4K H.265 videos.
Intel HD Graphics (Cherry Trail) ► remove from comparison
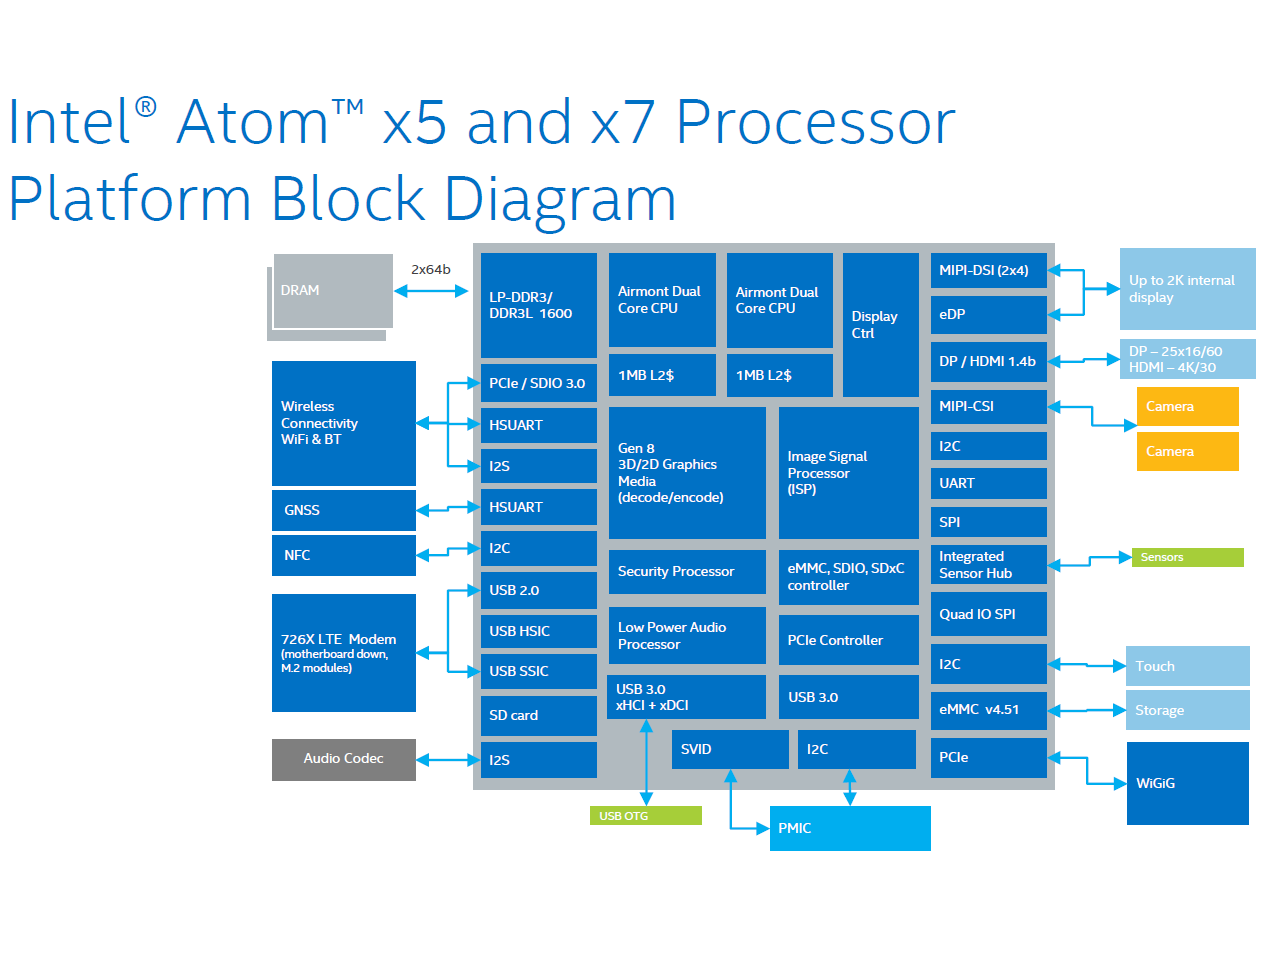
The Intel HD Graphics (Cherry Trail) is an integrated graphics card in the Cherry-Trail SoCs (e.g. Atom x7-Z8700). Based on a Broadwell GPU (Intel Gen8) and supports DirectX 11.2. Depending on the SoC offers 12 or 16 EUs.
Atom x7-Z8700: 16 EUs @ 200 - 600 MHz, dual-channel memory
In Windows, gaming is limited to less demanding or quite old games. Using Android, even high end 3D games should run fluently. For example Team Fortress 2 was running on the Surface 3 (x7-Z8700) only in lowest settings and 1280x720 fluently (11 - 69 fps range).
The integrated video decoder is able to display even 4K videos (H.264 tested) fluently.
The Intel HD Graphics GPU in our review sample of the MS Surface 3 (Atom x7-Z8700) only supported DisplayPort 1.1 as it seems, as 4K (3840x2160) with 30 Hz was the maximum Refresh Rate we could achieve (no 60 Hz selectable with the pre-installed drivers).
Intel HD Graphics 5300 ► remove from comparison
The Intel HD Graphics 5300 (GT2) is an integrated Broadwell graphics card revealed in late 2014. It can be found in Core M ULV SoCs such as the Core M-5Y70 . While the GPU shines with its extremely low power consumption, raw performance is quite low and barely sufficient for modern games.
Architecture and Features
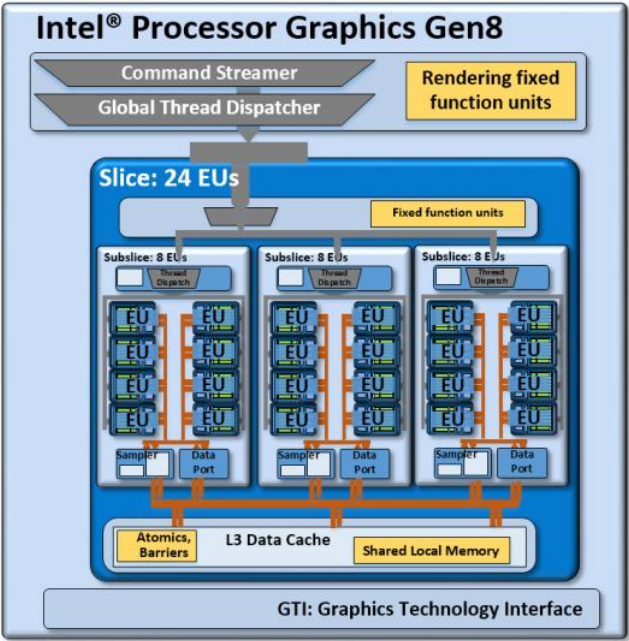
Broadwell features a GPU based on the Intel Gen8 architecture, which has been optimized in various aspects compared to the previous Gen7.5 (Haswell). Inter alia, the shader arrays called "subslice" have been reorganized and now offer 8 Execution Units (EUs) each. Three subslices form a "slice" for a total of 24 EUs. Combined with other improvements such as larger L1 caches and an optimized frontend, the integrated GPU has become faster and more efficient than its predecessor.
The HD Graphics 5300 represents the mid-range version of the Broadwell GPU family and consists of one slice with 24 EUs. Beyond that, there is also a low-end variant (GT1, 12 EUs) as well as higher-end models (GT3/GT3e + eDRAM, 48 EUs).
All Broadwell GPUs support OpenCL 2.0 and DirectX 11.2. The video engine can now decode H.265 using both fixed function hardware as well as available GPU shaders. Up to three displays can be connected via DP 1.2/eDP 1.3 (max. 3840 x 2160 @ 60 Hz) or HDMI 1.4a (max. 3840 x 2160 @ 24 Hz). HDMI 2.0, however, is not supported.
Performance
Depending on the specific CPU, the maximum GPU frequency varies between 800 and 900 MHz. Due to the very low TDP, however, the average clock in 3D applications will be significantly lower. Therefore, the HD 5300 just barely outperforms the old HD 4000 or HD 4200 , but requires much less energy for the same performance.
Only a few games as of 2014/2015 will run fluently at low settings, e.g. Dota 2 or Sims 4.
Power Consumption
Thanks to a new 14 nm process, the entire Core M chip is specified at just 4.5 W TDP and is suited for passively cooled tablets. The TDP is flexible and can be reduced or increased, which has a significant impact on performance.
Intel HD Graphics 405 (Braswell) Intel HD Graphics (Cherry Trail) Intel HD Graphics 5300 HD Graphics Series Codename Braswell Cherry Trail Broadwell GT2 Architecture Gen. 8 Gen. 8 Gen. 8 Broadwell Pipelines 16 - unified 16 - unified 24 - unified Core Speed 320 - 700 (Boost) MHz 200 - 600 (Boost) MHz 100 - 900 (Boost) MHz Memory Bus Width 64/128 Bit 64/128 Bit 64/128 Bit Shared Memory yes yes yes API DirectX 11.2, Shader 5.0 DirectX 12 (FL 11_1), Shader 5.0, OpenGL 4.3 DirectX 12 (FL 11_1), OpenGL 4.3 technology 14 nm 14 nm 14 nm Date of Announcement 01.04.2016 02.03.2015 05.09.2014 Transistors 1.3 Billion Features QuickSync
Benchmarks Performance Rating - 3DMark 11 + Fire Strike + Time Spy - HD Graphics 405 (Braswell)
0.1 pt (0%)
Intel HD Graphics 405 (Braswell)
...
max:
Performance Rating - 3DMark 11 + Fire Strike + Time Spy - HD Graphics (Cherry Trail)
0.1 pt (0%)
Intel HD Graphics (Cherry Trail)
...
max:
Performance Rating - 3DMark 11 + Fire Strike + Time Spy - HD Graphics 5300
0.2 pt (1%)
...
...
max:
3DMark - 3DMark Ice Storm Unlimited Graphics
min: 19812 avg: 23763 median: 23763 (3%) max: 27714 Points
min: 18563 avg: 20873 median: 19303 (2%) max: 27537 Points
min: 39138 avg: 55907 median: 59555 (7%) max: 65380 Points
3DMark - 3DMark Ice Storm Extreme Graphics
min: 12601 avg: 14069 median: 14068.5 (2%) max: 15536 Points
min: 19630 avg: 24597 median: 24597 (3%) max: 29564 Points
3DMark - 3DMark Cloud Gate Score
min: 1743 avg: 2000 median: 1933 (2%) max: 2392 Points
min: 769 avg: 1454 median: 1488 (2%) max: 1905 Points
min: 1361 avg: 3085 median: 3041 (3%) max: 4274 Points
3DMark - 3DMark Cloud Gate Graphics
min: 1767 avg: 2206 median: 2113 (1%) max: 2831 Points
min: 1537 avg: 1851 median: 1783.5 (0%) max: 2272 Points
min: 2895 avg: 3862 median: 3720 (1%) max: 5512 Points
3DMark - 3DMark Fire Strike Standard Score
min: 216 avg: 237.5 median: 237.5 (0%) max: 259 Points
min: 174 avg: 390.4 median: 248 (0%) max: 1059 Points
min: 327 avg: 413.8 median: 407 (1%) max: 620 Points
3DMark - 3DMark Fire Strike Standard Graphics
min: 231 avg: 254.5 median: 254.5 (0%) max: 278 Points
min: 193 avg: 233 median: 225 (0%) max: 281 Points
min: 352 avg: 453.8 median: 439 (0%) max: 671 Points
3DMark - 3DMark Ice Storm Graphics
min: 26056 avg: 28119 median: 28119 (3%) max: 30182 Points
min: 7544 avg: 16078 median: 17063.5 (2%) max: 23395 Points
min: 27164 avg: 35716 median: 34405 (4%) max: 48901 Points
3DMark - 3DMark Sling Shot (ES 3.0) Unlimited
min: 1445 avg: 1525 median: 1525 (7%) max: 1605 Points
3DMark - 3DMark Sling Shot (ES 3.0) Unlimited Graphics
min: 1598 avg: 1684 median: 1684 (4%) max: 1770 Points
3DMark - 3DMark Sling Shot Extreme (ES 3.1) Unlimited
min: 1072 avg: 1215 median: 1159 (6%) max: 1414 Points
3DMark - 3DMark Sling Shot Extreme (ES 3.1) Unlimited Graphics
min: 1058 avg: 1251 median: 1142 (3%) max: 1554 Points
3DMark 11 - 3DM11 Performance Score
min: 451 avg: 523 median: 537 (1%) max: 565 Points
min: 314 avg: 359.4 median: 343 (0%) max: 562 Points
min: 498 avg: 721 median: 731 (1%) max: 973 Points
3DMark 11 - 3DM11 Performance GPU
min: 408 avg: 469.1 median: 473 (0%) max: 496 Points
min: 278 avg: 319.9 median: 298 (0%) max: 494 Points
min: 458 avg: 648 median: 647 (1%) max: 885 Points
3DMark Vantage + Intel HD Graphics 405 (Braswell) 3DMark Vantage - 3DM Vant. Perf. total
2081 Points (1%)
3DM Vant. Perf. total + Intel HD Graphics 5300
min: 2966 avg: 3104 median: 3104 (1%) max: 3242 Points
3DM Vant. Perf. GPU no PhysX + Intel HD Graphics 405 (Braswell) 3DMark Vantage - 3DM Vant. Perf. GPU no PhysX
1730 Points (1%)
3DM Vant. Perf. GPU no PhysX + Intel HD Graphics 5300
min: 2538 avg: 2914 median: 2913.5 (2%) max: 3289 Points
3DMark 06 3DMark 06 - Standard 1280x1024 + Intel HD Graphics 405 (Braswell)
min: 2274 avg: 2920 median: 2920 (4%) max: 3566 Points
3DMark 06 - Standard 1280x1024 + Intel HD Graphics (Cherry Trail)
min: 2403 avg: 2833 median: 2595 (3%) max: 3330 Points
3DMark 06 - Standard 1280x1024 + Intel HD Graphics 5300
min: 3951 avg: 5044 median: 4775 (6%) max: 6754 Points
3DMark 06 - Standard 1024x768 + Intel HD Graphics (Cherry Trail)
2877 Points (4%)
Unigine Valley 1.0 - Unigine Valley 1.0 DX
1.2 fps (0%)
Unigine Heaven 3.0 - Unigine Heaven 3.0 DX 11
7.6 fps (3%)
Unigine Heaven 2.1 - Heaven 2.1 high
7.4 fps (1%)
5.7 fps (1%)
SPECviewperf 12 + Intel HD Graphics 5300 SPECviewperf 12 - specvp12 sw-03
min: 0.97 avg: 4.7 median: 4.7 (1%) max: 8.44 fps
specvp12 snx-02 + Intel HD Graphics 5300 SPECviewperf 12 - specvp12 snx-02
min: 1.07 avg: 1.2 median: 1.2 (0%) max: 1.28 fps
specvp12 showcase-01 + Intel HD Graphics 5300 SPECviewperf 12 - specvp12 showcase-01
min: 2.69 avg: 4.7 median: 4.7 (1%) max: 6.69 fps
specvp12 mediacal-01 + Intel HD Graphics 5300 SPECviewperf 12 - specvp12 mediacal-01
min: 0.58 avg: 0.8 median: 0.8 (0%) max: 1.1 fps
specvp12 maya-04 + Intel HD Graphics 5300 SPECviewperf 12 - specvp12 maya-04
min: 2.13 avg: 4 median: 4 (1%) max: 5.79 fps
specvp12 energy-01 + Intel HD Graphics 5300 SPECviewperf 12 - specvp12 energy-01
min: 0.04 avg: 4.5 median: 4.5 (4%) max: 9 fps
specvp12 creo-01 + Intel HD Graphics 5300 SPECviewperf 12 - specvp12 creo-01
min: 0.91 avg: 2.8 median: 2.8 (1%) max: 4.73 fps
specvp12 catia-04 + Intel HD Graphics 5300 SPECviewperf 12 - specvp12 catia-04
5.5 fps (1%)
Cinebench R10 Cinebench R10 Shading (32bit) + Intel HD Graphics 405 (Braswell) Cinebench R10 - Cinebench R10 Shading (32bit)
min: 2412 avg: 2685 median: 2753 (2%) max: 2822 Points
Cinebench R10 Shading (32bit) + Intel HD Graphics (Cherry Trail)
min: 1192 avg: 2009 median: 1973 (1%) max: 2551 Points
Cinebench R10 Shading (32bit) + Intel HD Graphics 5300
min: 2978 avg: 4412 median: 4018 (3%) max: 6679 Points
Cinebench R11.5 Cinebench R11.5 OpenGL 64 Bit + Intel HD Graphics 405 (Braswell) Cinebench R11.5 - Cinebench R11.5 OpenGL 64 Bit
min: 10.24 avg: 11.7 median: 11.7 (4%) max: 13.06 fps
Cinebench R11.5 OpenGL 64 Bit + Intel HD Graphics (Cherry Trail)
min: 4.01 avg: 8.8 median: 8.4 (3%) max: 11.71 fps
Cinebench R11.5 OpenGL 64 Bit + Intel HD Graphics 5300
min: 11.6 avg: 16.4 median: 15.9 (6%) max: 23.2 fps
Cinebench R15 + Intel HD Graphics 405 (Braswell) Cinebench R15 - Cinebench R15 OpenGL 64 Bit
min: 10.3 avg: 13.8 median: 14.1 (1%) max: 15.74 fps
Cinebench R15 OpenGL 64 Bit + Intel HD Graphics (Cherry Trail)
min: 6.64 avg: 10.3 median: 9.7 (1%) max: 15.52 fps
Cinebench R15 OpenGL 64 Bit + Intel HD Graphics 5300
min: 16.04 avg: 19 median: 18.4 (1%) max: 23.64 fps
Cinebench R15 OpenGL Ref. Match 64 Bit + Intel HD Graphics 405 (Braswell) Cinebench R15 - Cinebench R15 OpenGL Ref. Match 64 Bit
min: 9 avg: 83.2 median: 98 (98%) max: 98 %
Cinebench R15 OpenGL Ref. Match 64 Bit + Intel HD Graphics (Cherry Trail)
min: 98 avg: 98 median: 98 (98%) max: 98.6 %
Cinebench R15 OpenGL Ref. Match 64 Bit + Intel HD Graphics 5300
min: 98 avg: 98.1 median: 98 (98%) max: 99.3 %
GFXBench - GFXBench Car Chase Offscreen
9.9 fps (1%)
min: 6.3 avg: 7.3 median: 7 (1%) max: 9 fps
GFXBench 3.1 - GFXBench Manhattan ES 3.1 Offscreen
20.3 fps (0%)
min: 9.2 avg: 10.8 median: 11 (0%) max: 13 fps
GFXBench 3.0 - GFXBench 3.0 Manhattan Offscreen
20.3 fps (1%)
min: 8.4 avg: 13.8 median: 13.5 (1%) max: 18 fps
min: 26.7 avg: 30.3 median: 30.1 (2%) max: 34.1 fps
GFXBench (DX / GLBenchmark) 2.7 + Intel HD Graphics 405 (Braswell) GFXBench (DX / GLBenchmark) 2.7 - GFXBench T-Rex HD Offscreen C24Z16
41.3 fps (0%)
GFXBench T-Rex HD Offscreen C24Z16 + Intel HD Graphics (Cherry Trail) min: 22 avg: 30.5 median: 32 (0%) max: 38.5 fps
GFXBench T-Rex HD Offscreen C24Z16 + Intel HD Graphics 5300
min: 39.4 avg: 54.4 median: 55 (0%) max: 66.2 fps
LuxMark v2.0 64Bit - LuxMark v2.0 Room GPU
min: 56 avg: 68 median: 68 (0%) max: 80 Samples/s
min: 48 avg: 58.7 median: 59 (0%) max: 69 Samples/s
min: 93 avg: 116.7 median: 112 (1%) max: 145 Samples/s
LuxMark v2.0 64Bit - LuxMark v2.0 Sala GPU
min: 81 avg: 102.5 median: 102.5 (0%) max: 124 Samples/s
min: 69 avg: 87.7 median: 89 (0%) max: 105 Samples/s
min: 180 avg: 228.7 median: 210 (0%) max: 296 Samples/s
ComputeMark v2.1 - ComputeMark v2.1 Result
min: 388 avg: 390.5 median: 390.5 (0%) max: 393 Points
277 Points (0%)
min: 460 avg: 519 median: 518.5 (1%) max: 577 Points
Power Consumption - Furmark Stress Test Power Consumption - external Monitor *
9.8 Watt (1%)
Average Benchmarks Intel HD Graphics 405 (Braswell) → 100% n=18 Average Benchmarks Intel HD Graphics (Cherry Trail) → 78% n=18 Average Benchmarks Intel HD Graphics 5300 → 155% n=18
- Range of benchmark values for this graphics card
- Average benchmark values for this graphics card
* Smaller numbers mean a higher performance
1 This benchmark is not used for the average calculation
Game Benchmarks The following benchmarks stem from our benchmarks of review laptops. The performance depends on the used graphics memory, clock rate, processor, system settings, drivers, and operating systems. So the results don't have to be representative for all laptops with this GPU. For detailed information on the benchmark results, click on the fps number.
100%
HD Graphics 405 (Braswell):
17.8 fps
100%
HD Graphics 405 (Braswell):
18 fps
100%
HD Graphics 405 (Braswell):
9.9 fps
100%
HD Graphics 405 (Braswell):
23.6 fps
100%
HD Graphics 405 (Braswell):
18 fps
100%
HD Graphics 405 (Braswell):
13.9 fps
HD Graphics 405 (Braswell):
0 (!) [X] Teclast Tbook 16 Power Intel Atom x7-Z8750 1.6GHz
HD Graphics 405 (Braswell)
fps
100%
HD Graphics 405 (Braswell):
37 fps
100%
HD Graphics 405 (Braswell):
24 fps
100%
HD Graphics 405 (Braswell):
25 fps
100%
HD Graphics 405 (Braswell):
30 fps
100%
HD Graphics 405 (Braswell):
37 fps
100%
HD Graphics 405 (Braswell):
19.6 fps
109%
HD Graphics (Cherry Trail):
21.4 fps
100%
HD Graphics 405 (Braswell):
18.7 fps
83%
HD Graphics (Cherry Trail):
15.5 fps
100%
HD Graphics 405 (Braswell):
13.5 fps
100%
HD Graphics 405 (Braswell):
11 fps
100%
HD Graphics 405 (Braswell):
14.4 fps
100%
HD Graphics 405 (Braswell):
10.5 fps
100%
HD Graphics 405 (Braswell):
17.6 31.3 ~ 24 fps
94%
HD Graphics (Cherry Trail):
22.6 [X] Chuwi Hi12 Intel Atom x5-Z8300 1.4GHz
HD Graphics (Cherry Trail)
min:
21 fps, max:
27 fps
fps
100%
HD Graphics 405 (Braswell):
21.3 fps
100%
HD Graphics 405 (Braswell):
12.2 fps
100%
HD Graphics 405 (Braswell):
5.2 fps
100%
HD Graphics 405 (Braswell):
10.5 fps
116%
HD Graphics 5300:
12.2 fps
100%
HD Graphics 405 (Braswell):
6.1 fps
113%
HD Graphics 5300:
6.9 fps
HD Graphics 5300:
10.8 fps
100%
HD Graphics 405 (Braswell):
7.1 fps
93%
HD Graphics 5300:
6.6 fps
100%
HD Graphics 405 (Braswell):
4.2 fps
93%
HD Graphics 5300:
3.9 fps
100%
HD Graphics 405 (Braswell):
15.3 fps
75%
HD Graphics (Cherry Trail):
11.5 fps
86%
HD Graphics 5300:
13.2 fps
100%
HD Graphics 405 (Braswell):
8.9 fps
79%
HD Graphics (Cherry Trail):
7 fps
96%
HD Graphics 5300:
8.5 fps
HD Graphics (Cherry Trail):
8.8 fps
HD Graphics 5300:
13.8 fps
HD Graphics (Cherry Trail):
4.8 fps
100%
HD Graphics 405 (Braswell):
10.8 fps
75%
HD Graphics (Cherry Trail):
8.1 fps
98%
HD Graphics 5300:
10.6 fps
100%
HD Graphics 405 (Braswell):
6.9 fps
57%
HD Graphics (Cherry Trail):
3.9 fps
88%
HD Graphics 5300:
6.1 fps
HD Graphics 5300:
26.3 fps
HD Graphics 5300:
15.3 fps
100%
HD Graphics 405 (Braswell):
15 21.8 ~ 18 fps
83%
HD Graphics (Cherry Trail):
13.9 [X] Chuwi Hi12 Intel Atom x5-Z8300 1.4GHz
HD Graphics (Cherry Trail)
min:
7 fps, max:
19 fps
16.8 ~ 15 fps
144%
HD Graphics 5300:
26 fps
100%
HD Graphics 405 (Braswell):
16.2 fps
109%
HD Graphics 5300:
17.7 fps
100%
HD Graphics 405 (Braswell):
18.8 fps
80%
HD Graphics (Cherry Trail):
15.1 fps
110%
HD Graphics 5300:
20.6 fps
100%
HD Graphics 405 (Braswell):
13 fps
75%
HD Graphics (Cherry Trail):
9.8 fps
95%
HD Graphics 5300:
12.4 fps
100%
HD Graphics 405 (Braswell):
22.1 35.2 ~ 29 fps
69%
HD Graphics (Cherry Trail):
20 [X] Chuwi Hi12 Intel Atom x5-Z8300 1.4GHz
HD Graphics (Cherry Trail)
min:
18 fps
fps
100%
HD Graphics 405 (Braswell):
13.7 22.8 ~ 18 fps
84%
HD Graphics (Cherry Trail):
15.2 [X] Chuwi Hi12 Intel Atom x5-Z8300 1.4GHz
HD Graphics (Cherry Trail)
min:
13 fps
fps
HD Graphics (Cherry Trail):
7.2 [X] Chuwi Hi12 Intel Atom x5-Z8300 1.4GHz
HD Graphics (Cherry Trail)
min:
6 fps
fps
100%
HD Graphics 405 (Braswell):
41.5 fps
48%
HD Graphics (Cherry Trail):
20.1 fps
99%
HD Graphics 5300:
41 fps
100%
HD Graphics 405 (Braswell):
12.5 fps
100%
HD Graphics (Cherry Trail):
12.5 fps
100%
HD Graphics 5300:
12.5 fps
HD Graphics (Cherry Trail):
10.8 (!) [X] Microsoft Surface 3 Intel Atom x7-Z8700 1.6GHz
HD Graphics (Cherry Trail)
fps
HD Graphics 5300:
15.3 fps
100%
HD Graphics 405 (Braswell):
12.1 fps
79%
HD Graphics (Cherry Trail):
9.5 fps
91%
HD Graphics 5300:
11 11.9 ~ 11 fps
100%
HD Graphics 405 (Braswell):
7.6 fps
75%
HD Graphics (Cherry Trail):
5.7 fps
105%
HD Graphics 5300:
7.6 8.2 ~ 8 fps
HD Graphics 5300:
3 3.1 ~ 3 fps
HD Graphics (Cherry Trail):
16.2 fps
HD Graphics 5300:
21.2 fps
HD Graphics (Cherry Trail):
6.1 fps
100%
HD Graphics 405 (Braswell):
28 fps
57%
HD Graphics (Cherry Trail):
16 fps
125%
HD Graphics 5300:
33 34 39 ~ 35 fps
100%
HD Graphics 405 (Braswell):
17 fps
71%
HD Graphics (Cherry Trail):
12 fps
129%
HD Graphics 5300:
20 20 25 ~ 22 fps
HD Graphics 5300:
12 13 14 ~ 13 fps
100%
HD Graphics 405 (Braswell):
18.9 fps
100%
HD Graphics 405 (Braswell):
13.6 fps
HD Graphics (Cherry Trail):
15.6 fps
100%
HD Graphics 405 (Braswell):
77.5 fps
117%
HD Graphics 5300:
91 fps
100%
HD Graphics 405 (Braswell):
19.6 fps
90%
HD Graphics 5300:
17.6 fps
HD Graphics (Cherry Trail):
5.5 10 ~ 8 fps
100%
HD Graphics 405 (Braswell):
14 fps
124%
HD Graphics 5300:
17.3 fps
100%
HD Graphics 405 (Braswell):
9.1 fps
129%
HD Graphics 5300:
11.7 fps
100%
HD Graphics 405 (Braswell):
50.5 fps
50%
HD Graphics (Cherry Trail):
22 27.3 ~ 25 fps
100%
HD Graphics 405 (Braswell):
15 fps
87%
HD Graphics (Cherry Trail):
12.5 13.5 ~ 13 fps
HD Graphics 5300:
12.5 fps
HD Graphics 5300:
18.3 fps
HD Graphics 5300:
11.1 fps
100%
HD Graphics 405 (Braswell):
6 fps
150%
HD Graphics 5300:
8.3 [X] HP Elitebook Folio 1020 G1 H9V72EA Intel Core M-5Y51 1.1GHz
HD Graphics 5300
9.3 9.5 10.8 ~ 9 fps
HD Graphics 5300:
5.1 5.3 5.5 [X] HP Elitebook Folio 1020 G1 H9V72EA Intel Core M-5Y51 1.1GHz
HD Graphics 5300
6.9 ~ 6 fps
HD Graphics 5300:
4.3 4.3 4.4 4.6 [X] HP Elitebook Folio 1020 G1 H9V72EA Intel Core M-5Y51 1.1GHz
HD Graphics 5300
~ 4 fps
HD Graphics 5300:
2 [X] HP Elitebook Folio 1020 G1 H9V72EA Intel Core M-5Y51 1.1GHz
HD Graphics 5300
2.2 ~ 2 fps
HD Graphics 5300:
26.7 fps
HD Graphics 5300:
10.7 fps
100%
HD Graphics 405 (Braswell):
16.5 fps
81%
HD Graphics (Cherry Trail):
13.3 fps
92%
HD Graphics 5300:
15.2 fps
100%
HD Graphics 405 (Braswell):
12.5 fps
93%
HD Graphics 5300:
11.6 fps
100%
HD Graphics 405 (Braswell):
8.3 fps
90%
HD Graphics 5300:
7.5 fps
HD Graphics 5300:
91.4 fps
HD Graphics 5300:
48.8 fps
HD Graphics 5300:
45.2 fps
HD Graphics 5300:
21.6 fps
HD Graphics 5300:
24.9 fps
HD Graphics 5300:
17.4 fps
HD Graphics 5300:
18.2 fps
HD Graphics 5300:
11.7 fps
HD Graphics (Cherry Trail):
58 fps
HD Graphics (Cherry Trail):
47 fps
HD Graphics (Cherry Trail):
29.7 fps
HD Graphics 5300:
33.1 48 50.9 51.2 [X] HP Elitebook Folio 1020 G1 H9V72EA Intel Core M-5Y51 1.1GHz
HD Graphics 5300
53.6 ~ 47 fps
HD Graphics (Cherry Trail):
16.5 fps
HD Graphics 5300:
21.4 23.2 26.7 28.6 29.7 [X] HP Elitebook Folio 1020 G1 H9V72EA Intel Core M-5Y51 1.1GHz
HD Graphics 5300
~ 26 fps
HD Graphics 5300:
9.8 12.2 14.9 15.4 [X] HP Elitebook Folio 1020 G1 H9V72EA Intel Core M-5Y51 1.1GHz
HD Graphics 5300
~ 13 fps
HD Graphics (Cherry Trail):
24 fps
HD Graphics (Cherry Trail):
13.5 fps
HD Graphics 5300:
21.3 fps
HD Graphics 5300:
13.3 fps
HD Graphics 5300:
10.1 fps
95%
HD Graphics (Cherry Trail):
16 18 18.9 [X] Medion Akoya E2215T Intel Atom x5-Z8350 1.4GHz
HD Graphics (Cherry Trail)
19.8 20.1 20.5 ~ 19 fps
82%
HD Graphics (Cherry Trail):
6.4 7.9 [X] Medion Akoya E2215T Intel Atom x5-Z8350 1.4GHz
HD Graphics (Cherry Trail)
9.3 9.8 10 10 ~ 9 fps
100%
HD Graphics 405 (Braswell):
9.2 10 ~ 10 fps
70%
HD Graphics (Cherry Trail):
5.6 5.7 [X] Medion Akoya E2215T Intel Atom x5-Z8350 1.4GHz
HD Graphics (Cherry Trail)
6.7 7.6 7.9 8.4 ~ 7 fps
HD Graphics (Cherry Trail):
2.4 2.6 ~ 2 fps
HD Graphics 5300:
18 20.5 ~ 19 fps
HD Graphics 5300:
12.4 fps
100%
HD Graphics 405 (Braswell):
27.8 fps
100%
HD Graphics 405 (Braswell):
12.8 fps
100%
HD Graphics 405 (Braswell):
9.5 fps
84%
HD Graphics (Cherry Trail):
7 8.3 9 ~ 8 fps
HD Graphics (Cherry Trail):
3.7 3.8 ~ 4 fps
HD Graphics 5300:
12.5 fps
100%
HD Graphics 405 (Braswell):
43.2 fps
83%
HD Graphics 5300:
35.9 fps
100%
HD Graphics 405 (Braswell):
19.6 fps
93%
HD Graphics 5300:
18.3 fps
100%
HD Graphics 405 (Braswell):
14.3 fps
97%
HD Graphics 5300:
13.9 fps
HD Graphics (Cherry Trail):
34 fps
HD Graphics 5300:
19.4 fps
HD Graphics 5300:
12.6 fps
HD Graphics 5300:
11.8 fps
HD Graphics (Cherry Trail):
15.2 fps
HD Graphics (Cherry Trail):
11.6 fps
HD Graphics (Cherry Trail):
0 (!) [X] Microsoft Surface 3 Intel Atom x7-Z8700 1.6GHz
HD Graphics (Cherry Trail)
fps
HD Graphics 5300:
20.2 fps
HD Graphics (Cherry Trail):
0 (!) [X] Microsoft Surface 3 Intel Atom x7-Z8700 1.6GHz
HD Graphics (Cherry Trail)
fps
HD Graphics 5300:
11.3 fps
HD Graphics 5300:
46.6 fps
HD Graphics 5300:
12.9 fps
100%
HD Graphics 405 (Braswell):
42.6 fps
148%
HD Graphics 5300:
53.5 62 73 ~ 63 fps
100%
HD Graphics 405 (Braswell):
32 fps
100%
HD Graphics 405 (Braswell):
20.4 fps
100%
HD Graphics (Cherry Trail):
20.3 fps
HD Graphics (Cherry Trail):
11.4 fps
HD Graphics 5300:
14.1 17 ~ 16 fps
HD Graphics 5300:
7.1 7.2 ~ 7 fps
100%
HD Graphics 405 (Braswell):
32 fps
88%
HD Graphics (Cherry Trail):
24.3 [X] Chuwi Hi12 Intel Atom x5-Z8300 1.4GHz
HD Graphics (Cherry Trail)
min:
20 fps, max:
29 fps
31.9 ~ 28 fps
100%
HD Graphics 405 (Braswell):
19.1 fps
94%
HD Graphics (Cherry Trail):
16 [X] Chuwi Hi12 Intel Atom x5-Z8300 1.4GHz
HD Graphics (Cherry Trail)
min:
13 fps, max:
19 fps
19 ~ 18 fps
100%
HD Graphics 405 (Braswell):
14.4 fps
139%
HD Graphics 5300:
12 18 28.9 ~ 20 fps
HD Graphics 5300:
10.6 20 ~ 15 fps
HD Graphics 5300:
11.2 fps
HD Graphics 5300:
40.5 45 ~ 43 fps
HD Graphics (Cherry Trail):
8 fps
100%
HD Graphics 405 (Braswell):
21.8 fps
78%
HD Graphics (Cherry Trail):
15.5 18.9 ~ 17 fps
89%
HD Graphics 5300:
19.5 fps
100%
HD Graphics 405 (Braswell):
10.4 fps
77%
HD Graphics (Cherry Trail):
7.2 8.5 ~ 8 fps
88%
HD Graphics 5300:
9.2 fps
100%
HD Graphics 405 (Braswell):
6.5 fps
89%
HD Graphics 5300:
5.8 fps
HD Graphics 5300:
16.3 fps
HD Graphics 5300:
12.7 fps
100%
HD Graphics 405 (Braswell):
35.4 fps
72%
HD Graphics (Cherry Trail):
25.6 fps
116%
HD Graphics 5300:
40.9 fps
100%
HD Graphics 405 (Braswell):
14.7 fps
82%
HD Graphics (Cherry Trail):
12 fps
146%
HD Graphics 5300:
21.5 fps
HD Graphics (Cherry Trail):
28.1 fps
HD Graphics 5300:
57.4 fps
HD Graphics (Cherry Trail):
12.5 fps
HD Graphics 5300:
26.5 fps
HD Graphics 5300:
16.7 fps
HD Graphics (Cherry Trail):
18.7 fps
HD Graphics 5300:
18.9 [X] HP Elitebook Folio 1020 G1 H9V72EA Intel Core M-5Y51 1.1GHz
HD Graphics 5300
fps
HD Graphics 5300:
15.4 [X] HP Elitebook Folio 1020 G1 H9V72EA Intel Core M-5Y51 1.1GHz
HD Graphics 5300
fps
HD Graphics 5300:
13.4 [X] HP Elitebook Folio 1020 G1 H9V72EA Intel Core M-5Y51 1.1GHz
HD Graphics 5300
fps
HD Graphics 5300:
8.8 [X] HP Elitebook Folio 1020 G1 H9V72EA Intel Core M-5Y51 1.1GHz
HD Graphics 5300
fps
HD Graphics (Cherry Trail):
63.2 64 ~ 64 fps
HD Graphics (Cherry Trail):
18 18.8 ~ 18 fps
HD Graphics (Cherry Trail):
14 fps
HD Graphics (Cherry Trail):
7 fps
HD Graphics 5300:
33.1 fps
HD Graphics 5300:
20.3 60 ~ 40 fps
HD Graphics 5300:
48.1 fps
HD Graphics 5300:
21.4 fps
HD Graphics 5300:
10.3 fps
HD Graphics 5300:
52.3 fps
HD Graphics 5300:
21.8 fps
HD Graphics (Cherry Trail):
44 50.9 [X] Chuwi Hi12 Intel Atom x5-Z8300 1.4GHz
HD Graphics (Cherry Trail)
min:
40 fps, max:
60 fps
~ 47 fps
HD Graphics (Cherry Trail):
18.3 [X] Chuwi Hi12 Intel Atom x5-Z8300 1.4GHz
HD Graphics (Cherry Trail)
min:
13 fps, max:
29 fps
fps
HD Graphics 5300:
39 43.6 ~ 41 fps
HD Graphics 5300:
12.6 31 ~ 22 fps
Average Gaming Intel HD Graphics 405 (Braswell) → 100% Average Gaming 30-70 fps → 100%
Average Gaming Intel HD Graphics (Cherry Trail) → 80% Average Gaming Intel HD Graphics 5300 → 112% Average Gaming 30-70 fps → 116%
For more games that might be playable and a list of all games and graphics cards visit our Gaming List
v1.26
log 18. 06:28:39
#0 checking url part for id 7348 +0s ... 0s
#1 checking url part for id 6197 +0s ... 0s
#2 checking url part for id 5939 +0s ... 0s
#3 not redirecting to Ajax server +0s ... 0s
#4 did not recreate cache, as it is less than 5 days old! Created at Tue, 16 Apr 2024 05:39:00 +0200 +0.001s ... 0.001s
#5 composed specs +0.178s ... 0.178s
#6 did output specs +0s ... 0.179s
#7 start showIntegratedCPUs +0s ... 0.179s
#8 getting avg benchmarks for device 7348 +0.06s ... 0.238s
#9 got single benchmarks 7348 +0.027s ... 0.266s
#10 getting avg benchmarks for device 6197 +0.014s ... 0.28s
#11 got single benchmarks 6197 +0.086s ... 0.366s
#12 getting avg benchmarks for device 5939 +0.018s ... 0.385s
#13 got single benchmarks 5939 +0.071s ... 0.455s
#14 got avg benchmarks for devices +0s ... 0.455s
#15 min, max, avg, median took s +0.464s ... 0.919s
#16 before gaming benchmark output +0s ... 0.919s
#17 Got 779 rows for game benchmarks. +0.102s ... 1.021s
#18 composed SQL query for gamebenchmarks +0s ... 1.021s
#19 got data and put it in $dataArray +0.064s ... 1.085s
#20 benchmarks composed for output. +0.203s ... 1.288s
#21 calculated avg scores. +0s ... 1.288s
#22 return log +0.003s ... 1.291s
Please share our article, every link counts!
Redaktion, 2017-09- 8 (Update: 2023-07- 1)
 Deutsch
 English
 Español
 Français
 Italiano
 Nederlands
 Polski
 Português
 Русский
 Türkçe
 Svenska
 Chinese
 Magyar