Intel HD Graphics 400 (Braswell) vs Intel HD Graphics 6000 vs Intel HD Graphics 5000
Intel HD Graphics 400 (Braswell) ► remove from comparison
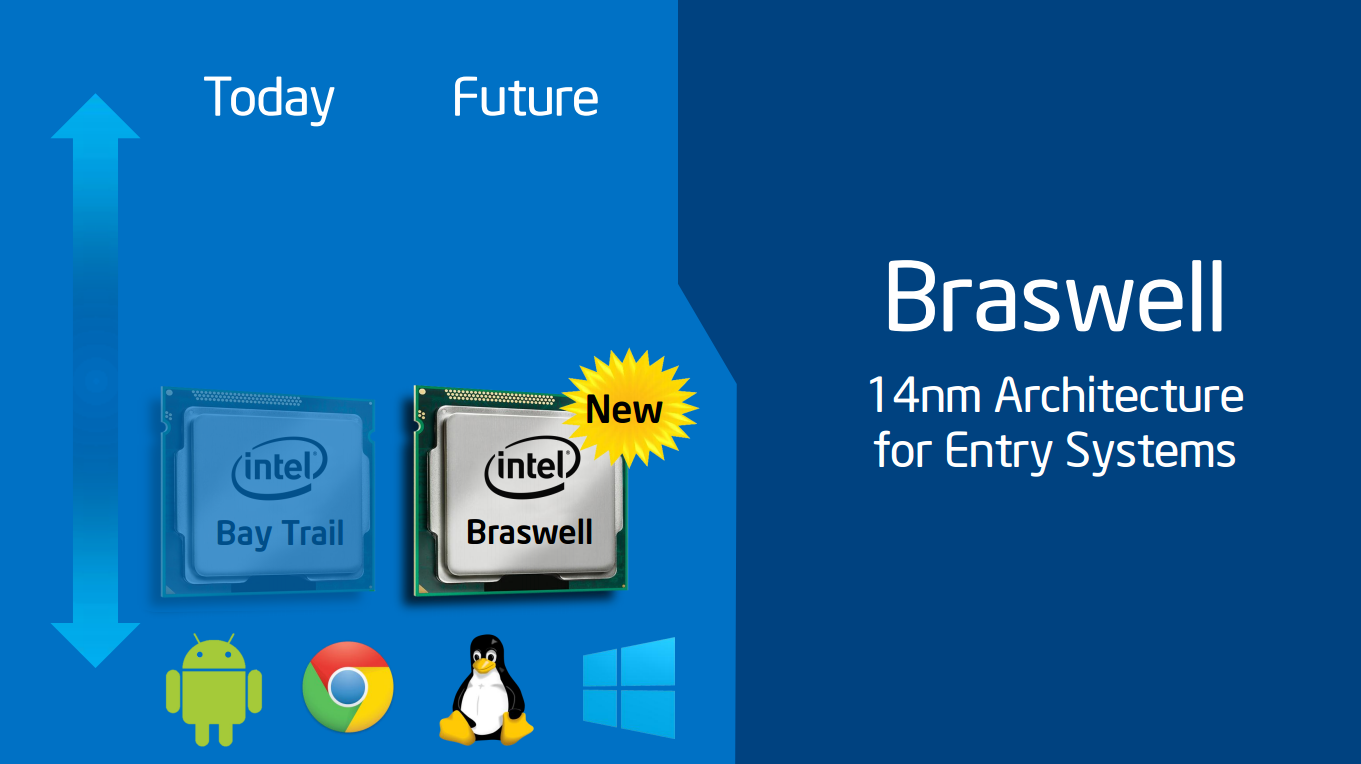
The Intel HD Graphics 400 (Braswell) is an integrated graphics card in the low end SoCs of the Braswell series (2016 Celeron models). It is based on the same architecture as the integrated GPU of the Broadwell graphics cards (e.g. HD Graphics 5300 ), but offers less shader cores and slower clock speeds.
It is a rename from the Intel HD Graphics (Braswell) card that included the faster 16 EU model in the Pentium SoCs. See the Intel HD Graphics Braswell graphics card page for benchmarks .
The performance depends on the processor (different boost speed for the GPU) and the used memory.
Gaming performance ist still only suited for older or less demanding games. Often also the processor is limited gaming performance (e.g. in the dual-core N3000).
The SoC also integrates a video decoding engine that should be able to handle 4K H.265 videos.
Intel HD Graphics 6000 ► remove from comparison
The Intel HD Graphics 6000 (GT3) is an integrated Broadwell graphics card revealed in Q1 2015. It can be found in several ULV SoCs (15 W TDP) such as the Core i5-5250U or i7-5650U . The so-called GT3 GPU offers 48 EUs (Execution Units) and therefore somewhat more shader power than the previous HD 5000 (40 EUs). Depending on the specific CPU, the maximum GPU frequency varies between 950 and 1000 MHz.
Architecture and Features
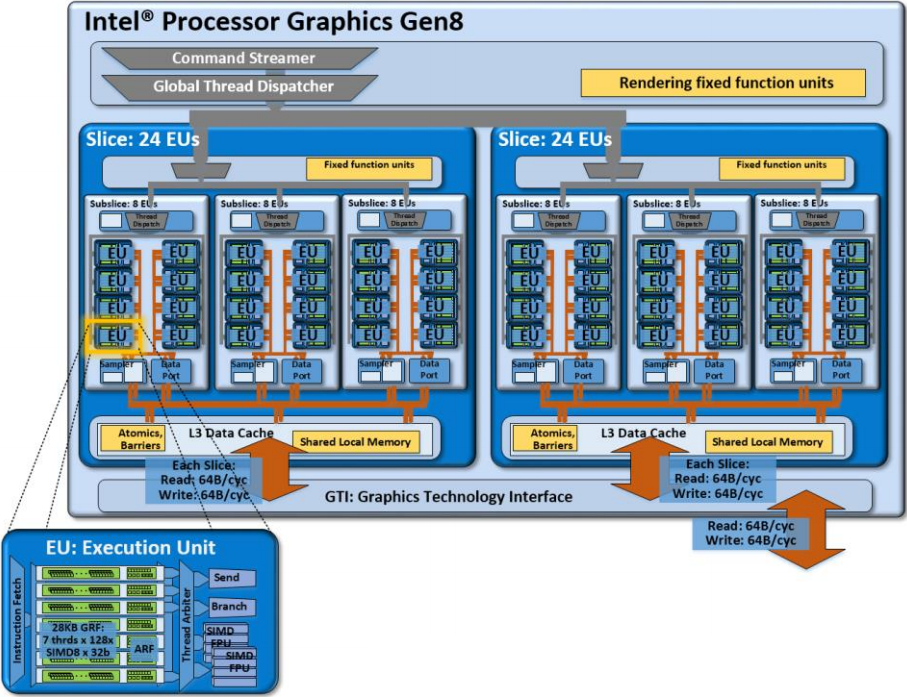
Broadwell features a GPU based on the Intel Gen8 architecture, which has been optimized in various aspects compared to the previous Gen7.5 (Haswell). Inter alia, the shader arrays called "subslice" have been reorganized and now offer 8 Execution Units (EUs) each. Three subslices form a "slice" for a total of 24 EUs. Combined with other improvements such as larger L1 caches and an optimized frontend, the integrated GPU has become faster and more efficient than its predecessor.
The HD Graphics 6000 represents the top-end version of the Broadwell GPU family and consists of two slices with 48 EUs. Beyond that, there is also a low-end (GT1, 12 EUs), a mid-range (GT2, 24 EUs) and a high-end variant (GT3e, 48 EUs + eDRAM).
All Broadwell GPUs support OpenCL 2.0 and DirectX 12 (FL 11_1) . The video engine can now decode H.265 using both fixed function hardware as well as available GPU shaders. Up to three displays can be connected via DP 1.2/eDP 1.3 (max. 3840 x 2160 @ 60 Hz) or HDMI 1.4a (max. 3840 x 2160 @ 24 Hz). HDMI 2.0, however, is not supported.
Performance
Depending on the specific CPU, the maximum GPU frequency varies between 950 and 1000 MHz. Due to the low TDP, however, the average clock in 3D applications will be significantly lower. Overall, the HD Graphics 6000 outperforms the previous HD 5000 by 20 - 25 percent and offers a performance slightly below a dedicated GeForce 820M .
Games as of 2014/2015 will usually run fluently only at (very) low settings.
Power Consumption
Utilizing a new 14 nm process, the Broadwell ULV chips are specified at just 15 W TDP and therefore suited for thin ultrabooks. The TDP is flexible and can be further reduced (9.5 W), which has a significant impact on performance.
Intel HD Graphics 5000 ► remove from comparison
The Intel HD Graphics 5000 (GT3) is a processor graphics card included in some of the ULV Haswell processors of 2013 (e.g. Core i5-4250U ). It represents the highest configuration of the integrated graphics unit (40 execution units), but lacks the additional eDRAM cache of the Iris Pro Graphics 5200 . The relatively low base clock can be automatically overclocked using Turbo Boost technology. Depending on the processor model, the base and turbo clock rates may differ, resulting in varying graphics performance between CPU models.
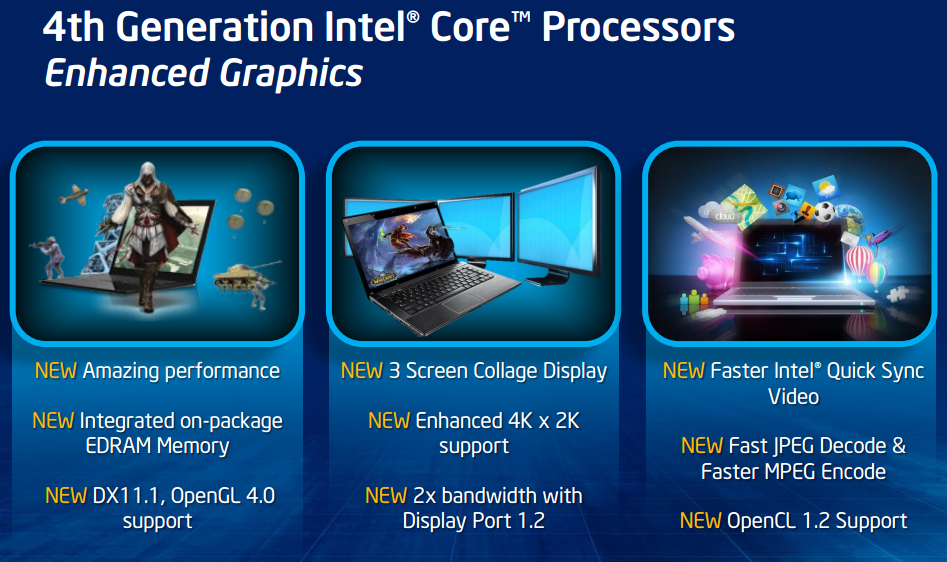
In comparison to the HD 4000, the graphics core has been modified extensively. The GPU supports DirectX 11.1, OpenCL 1.2 and OpenGL 4.0. It also features an improved decoder for 4K videos and the fast Quick Sync encoder.
According to benchmarks in 3DMark 11, the HD Graphics 5000 is up to 50 percent faster than the previous HD 4000 . In games, however, the performance advantage is significantly lower. With simultaneous load on the CPU, the low TDP of the ULV models (15 W) limits the Turbo Boost of the GPU. Although the HD 5000 features 40 Execution Units, the graphics performance is still somewhat below the HD Graphics 4600 with only 20 EUs (HD 4000 : 16 EUs). Overall, the HD 5000 is thus just behind the AMD Radeon HD 7660G and at the level of a dedicated Radeon HD 7650M . Current games (as of 2013) will run fluently in low to medium-low settings.
Due to the 22nm 3D Tri-Gate production process, power consumption is relatively low. The HD Graphics 5000 is available on certain ULV dual-core Haswell models in the 15 Watt TDP range.
Intel HD Graphics 400 (Braswell) Intel HD Graphics 6000 Intel HD Graphics 5000 HD Graphics Series Codename Braswell Broadwell GT3 Haswell GT3 Architecture Gen. 8 Gen. 8 Broadwell Gen. 7.5 Haswell Pipelines 12 - unified 48 - unified 40 - unified Core Speed 320 - 640 (Boost) MHz 300 - 1000 (Boost) MHz 200 - 1100 (Boost) MHz Memory Bus Width 64/128 Bit 64/128 Bit 64/128 Bit Shared Memory yes yes yes API DirectX 11.2, Shader 5.0 DirectX 12 (FL 11_1), OpenGL 4.3 DirectX 11.1, Shader 5.0, OpenGL 4.0 technology 14 nm 14 nm 22 nm Date of Announcement 01.04.2016 05.01.2015 05.06.2013 Transistors 1.9 Billion Features QuickSync QuickSync
CPU in HD Graphics 400 (Braswell) GPU Base Speed GPU Boost / Turbo Intel Atom x5-Z8550 4 x 1440 MHz 200 MHz 600 MHz Intel Celeron N3060 2 x 1600 MHz, 6 W 320 MHz 700 MHz min. - max. 200 - 320 MHz 600 - 700 MHz
CPU in HD Graphics 6000 GPU Base Speed GPU Boost / Turbo Intel Core i7-5650U 2 x 2200 MHz, 15 W 300 MHz 1000 MHz Intel Core i7-5550U 2 x 2000 MHz, 15 W 300 MHz 1000 MHz Intel Core i5-5350U 2 x 1800 MHz, 15 W 300 MHz 1000 MHz Intel Core i5-5250U 2 x 1600 MHz, 15 W 300 MHz 1000 MHz min. - max. 200 - 320 MHz 600 - 1000 MHz
CPU in HD Graphics 5000 GPU Base Speed GPU Boost / Turbo Intel Core i7-4650U 2 x 1700 MHz, 15 W 200 MHz 1100 MHz Intel Core i7-4550U 2 x 1500 MHz, 15 W 200 MHz 1100 MHz Intel Core i5-4360U 2 x 1500 MHz, 15 W 200 MHz 1100 MHz » show 3 more Intel Core i5-4350U 2 x 1400 MHz, 15 W 200 MHz 1100 MHz Intel Core i5-4260U 2 x 1400 MHz, 15 W 200 MHz 1000 MHz Intel Core i5-4250U 2 x 1300 MHz, 15 W 200 MHz 1000 MHz min. - max. 200 - 320 MHz 600 - 1100 MHz
Benchmarks Performance Rating - 3DMark 11 + Fire Strike + Time Spy - HD Graphics 400 (Braswell)
0.1 pt (0%)
Intel HD Graphics 400 (Braswell)
...
max:
Performance Rating - 3DMark 11 + Fire Strike + Time Spy - HD Graphics 6000
0.4 pt (1%)
...
...
max:
Performance Rating - 3DMark 11 + Fire Strike + Time Spy - HD Graphics 5000
0.3 pt (1%)
...
...
max:
3DMark - 3DMark Time Spy Score
374 Points (1%)
3DMark - 3DMark Time Spy Graphics
334 Points (1%)
3DMark - 3DMark Ice Storm Unlimited Graphics
min: 17968 avg: 20459 median: 20277 (2%) max: 23161 Points
65904 Points (7%)
3DMark - 3DMark Ice Storm Extreme Graphics
14334 Points (2%)
37346 Points (5%)
3DMark - 3DMark Cloud Gate Score
min: 1350 avg: 1553 median: 1457 (2%) max: 2087 Points
min: 5425 avg: 5737 median: 5872 (6%) max: 6061 Points
min: 4331 avg: 4586 median: 4496.5 (5%) max: 5059 Points
3DMark - 3DMark Cloud Gate Graphics
min: 1519 avg: 1865 median: 1841 (0%) max: 2455 Points
min: 7378 avg: 7700 median: 7660 (2%) max: 8102 Points
min: 5381 avg: 5981 median: 5693.5 (1%) max: 6762 Points
3DMark - 3DMark Fire Strike Standard Score
min: 176 avg: 188 median: 188 (0%) max: 200 Points
min: 844 avg: 906 median: 903 (2%) max: 971 Points
min: 583 avg: 669 median: 651 (1%) max: 808 Points
3DMark - 3DMark Fire Strike Standard Graphics
min: 202 avg: 218 median: 218 (0%) max: 234 Points
min: 858 avg: 947 median: 951 (1%) max: 1033 Points
min: 620 avg: 725 median: 715.5 (1%) max: 875 Points
3DMark - 3DMark Ice Storm Graphics
min: 13689 avg: 18517 median: 18516.5 (2%) max: 23344 Points
min: 61674 avg: 62508 median: 61979 (7%) max: 63871 Points
min: 35584 avg: 41867 median: 40454 (5%) max: 52302 Points
3DMark - 3DMark Sling Shot (ES 3.0) Unlimited
min: 1502 avg: 1926 median: 1925.5 (8%) max: 2349 Points
3DMark - 3DMark Sling Shot (ES 3.0) Unlimited Graphics
min: 1452 avg: 2046 median: 2046 (4%) max: 2640 Points
3DMark - 3DMark Sling Shot Extreme (ES 3.1) Unlimited
1180 Points (6%)
3DMark - 3DMark Sling Shot Extreme (ES 3.1) Unlimited Graphics
977 Points (3%)
3DMark 11 - 3DM11 Performance Score
min: 289 avg: 386.1 median: 397 (1%) max: 478 Points
min: 1328 avg: 1487 median: 1513.5 (2%) max: 1591 Points
min: 962 avg: 1088 median: 1125.5 (2%) max: 1163 Points
3DMark 11 - 3DM11 Performance GPU
min: 247 avg: 341.1 median: 349 (0%) max: 418 Points
min: 1210 avg: 1372 median: 1395.5 (1%) max: 1487 Points
min: 859 avg: 993 median: 1033.5 (1%) max: 1072 Points
3DMark Vantage + Intel HD Graphics 6000 3DMark Vantage - 3DM Vant. Perf. total
min: 5797 avg: 6106 median: 6188 (2%) max: 6333 Points
3DM Vant. Perf. total + Intel HD Graphics 5000
min: 3418 avg: 4231 median: 4276.5 (1%) max: 4734 Points
3DM Vant. Perf. GPU no PhysX + Intel HD Graphics 6000 3DMark Vantage - 3DM Vant. Perf. GPU no PhysX
min: 5129 avg: 5410 median: 5432 (3%) max: 5670 Points
3DM Vant. Perf. GPU no PhysX + Intel HD Graphics 5000
min: 2917 avg: 3639 median: 3665 (2%) max: 4108 Points
3DMark 03 - 3DMark 03 - Standard
min: 15752 avg: 18768 median: 18768 (10%) max: 21784 Points
3DMark 05 - 3DMark 05 - Standard
min: 9623 avg: 9763 median: 9763 (11%) max: 9903 Points
3DMark 06 3DMark 06 - Standard 1280x1024 + Intel HD Graphics 400 (Braswell)
2474 Points (3%)
3DMark 06 - Standard 1280x1024 + Intel HD Graphics 6000
min: 7844 avg: 8448 median: 8091 (11%) max: 9408 Points
3DMark 06 - Standard 1280x1024 + Intel HD Graphics 5000
min: 4751 avg: 5775 median: 5940 (8%) max: 6160 Points
3DMark 06 - Standard 1280x800 + Intel HD Graphics 5000
6675 Points (9%)
Unigine Valley 1.0 - Unigine Valley 1.0 DX
3.7 fps (1%)
Unigine Heaven 3.0 - Unigine Heaven 3.0 DX 11
12.1 fps (4%)
Unigine Heaven 3.0 - Unigine Heaven 3.0 OpenGL
12.1 fps (5%)
Unigine Heaven 2.1 - Heaven 2.1 high
min: 18.6 avg: 19 median: 18.7 (4%) max: 19.8 fps
min: 12.3 avg: 13 median: 13.1 (2%) max: 13.5 fps
SPECviewperf 11 + Intel HD Graphics 5000 SPECviewperf 11 - specvp11 snx-01
min: 1.26 avg: 1.5 median: 1.5 (1%) max: 1.64 fps
specvp11 tcvis-02 + Intel HD Graphics 5000 SPECviewperf 11 - specvp11 tcvis-02
min: 1.77 avg: 2.1 median: 2.1 (1%) max: 2.51 fps
specvp11 sw-02 + Intel HD Graphics 5000 SPECviewperf 11 - specvp11 sw-02
min: 7.95 avg: 9.9 median: 9.9 (8%) max: 11.8 fps
specvp11 proe-05 + Intel HD Graphics 5000 SPECviewperf 11 - specvp11 proe-05
min: 1.42 avg: 1.6 median: 1.6 (2%) max: 1.78 fps
specvp11 maya-03 + Intel HD Graphics 5000 SPECviewperf 11 - specvp11 maya-03
min: 12.95 avg: 14.2 median: 14.2 (11%) max: 15.43 fps
specvp11 lightwave-01 + Intel HD Graphics 5000 SPECviewperf 11 - specvp11 lightwave-01
min: 13.34 avg: 14.5 median: 14.5 (16%) max: 15.62 fps
specvp11 ensight-04 + Intel HD Graphics 5000 SPECviewperf 11 - specvp11 ensight-04
min: 2.06 avg: 2.1 median: 2.1 (1%) max: 2.11 fps
specvp11 catia-03 + Intel HD Graphics 5000 SPECviewperf 11 - specvp11 catia-03
4.5 fps (2%)
SPECviewperf 12 + Intel HD Graphics 6000 SPECviewperf 12 - specvp12 sw-03
16.6 fps (4%)
specvp12 snx-02 + Intel HD Graphics 6000 SPECviewperf 12 - specvp12 snx-02
2.5 fps (0%)
specvp12 showcase-01 + Intel HD Graphics 6000 SPECviewperf 12 - specvp12 showcase-01
5.6 fps (1%)
specvp12 mediacal-01 + Intel HD Graphics 6000 SPECviewperf 12 - specvp12 mediacal-01
1.6 fps (0%)
specvp12 maya-04 + Intel HD Graphics 6000 SPECviewperf 12 - specvp12 maya-04
3.3 fps (1%)
specvp12 energy-01 + Intel HD Graphics 6000 SPECviewperf 12 - specvp12 energy-01
0.1 fps (0%)
specvp12 creo-01 + Intel HD Graphics 6000 SPECviewperf 12 - specvp12 creo-01
9.9 fps (4%)
specvp12 catia-04 + Intel HD Graphics 6000 SPECviewperf 12 - specvp12 catia-04
11.3 fps (2%)
Windows 7 Experience Index - Win7 Gaming graphics
6.9 Points (87%)
min: 6.5 avg: 6.6 median: 6.6 (84%) max: 6.7 Points
Windows 7 Experience Index - Win7 Graphics
5.9 Points (75%)
min: 5.8 avg: 5.9 median: 5.9 (74%) max: 5.9 Points
Cinebench R10 Cinebench R10 Shading (32bit) + Intel HD Graphics 400 (Braswell) Cinebench R10 - Cinebench R10 Shading (32bit)
min: 1627 avg: 2057 median: 2052.5 (1%) max: 2510 Points
Cinebench R10 Shading (32bit) + Intel HD Graphics 6000
min: 6148 avg: 6928 median: 6527 (5%) max: 8110 Points
Cinebench R10 Shading (32bit) + Intel HD Graphics 5000
min: 5143 avg: 6901 median: 6946.5 (5%) max: 7959 Points
Cinebench R11.5 Cinebench R11.5 OpenGL 64 Bit + Intel HD Graphics 400 (Braswell) Cinebench R11.5 - Cinebench R11.5 OpenGL 64 Bit
min: 9.97 avg: 10.1 median: 10 (3%) max: 10.12 fps
Cinebench R11.5 OpenGL 64 Bit + Intel HD Graphics 6000
min: 21.27 avg: 23.7 median: 23.9 (8%) max: 25.67 fps
Cinebench R11.5 OpenGL 64 Bit + Intel HD Graphics 5000
min: 15.01 avg: 19.6 median: 19.6 (7%) max: 24.76 fps
Cinebench R15 + Intel HD Graphics 400 (Braswell) Cinebench R15 - Cinebench R15 OpenGL 64 Bit
min: 8.48 avg: 11 median: 11.3 (1%) max: 13.98 fps
Cinebench R15 OpenGL 64 Bit + Intel HD Graphics 6000
min: 25.89 avg: 30.1 median: 30.7 (2%) max: 34.45 fps
Cinebench R15 OpenGL 64 Bit + Intel HD Graphics 5000
min: 24.15 avg: 27.4 median: 27.4 (2%) max: 30.64 fps
Cinebench R15 OpenGL Ref. Match 64 Bit + Intel HD Graphics 400 (Braswell) Cinebench R15 - Cinebench R15 OpenGL Ref. Match 64 Bit
98 % (98%)
Cinebench R15 OpenGL Ref. Match 64 Bit + Intel HD Graphics 6000
min: 98 avg: 98.5 median: 98 (98%) max: 99.3 %
Cinebench R15 OpenGL Ref. Match 64 Bit + Intel HD Graphics 5000
min: 63.3 avg: 81.1 median: 80.7 (81%) max: 99.6 %
GFXBench - GFXBench 5.0 Aztec Ruins High Tier Offscreen
3.3 fps (1%)
GFXBench - GFXBench 5.0 Aztec Ruins Normal Tier Offscreen
9.3 fps (1%)
GFXBench 3.1 - GFXBench Manhattan ES 3.1 Offscreen
min: 7.2 avg: 10.6 median: 10.6 (0%) max: 14 fps
GFXBench 3.0 - GFXBench 3.0 Manhattan Offscreen
min: 14 avg: 16 median: 16 (1%) max: 18 fps
min: 34.22 avg: 39.5 median: 39.5 (2%) max: 44.7 fps
22.5 fps (1%)
GFXBench (DX / GLBenchmark) 2.7 + Intel HD Graphics 400 (Braswell) GFXBench (DX / GLBenchmark) 2.7 - GFXBench T-Rex HD Offscreen C24Z16
min: 27 avg: 29 median: 29 (0%) max: 31 fps
GFXBench T-Rex HD Offscreen C24Z16 + Intel HD Graphics 5000
min: 62 avg: 72.5 median: 72.5 (1%) max: 83 fps
LuxMark v2.0 64Bit - LuxMark v2.0 Room GPU
min: 127 avg: 136 median: 135 (1%) max: 146 Samples/s
min: 139 avg: 187 median: 201 (1%) max: 221 Samples/s
LuxMark v2.0 64Bit - LuxMark v2.0 Sala GPU
min: 342 avg: 357 median: 350 (1%) max: 379 Samples/s
min: 286 avg: 305.3 median: 306 (1%) max: 324 Samples/s
ComputeMark v2.1 - ComputeMark v2.1 Result
min: 941 avg: 1032 median: 1021 (1%) max: 1134 Points
min: 775 avg: 817 median: 816.5 (1%) max: 858 Points
Power Consumption - Furmark Stress Test Power Consumption - external Monitor *
32.9 Watt (5%)
Power Consumption - The Witcher 3 Power Consumption - external Monitor *
32.1 Watt (4%)
Clock Speed - GPU Clock Witcher 3 ultra
850 MHz (33%)
Clock Speed - GPU Clock Speed Furmark
649 MHz (26%)
Average Benchmarks Intel HD Graphics 400 (Braswell) → 100% n=13 Average Benchmarks Intel HD Graphics 6000 → 335% n=13 Average Benchmarks Intel HD Graphics 5000 → 256% n=13
- Range of benchmark values for this graphics card
- Average benchmark values for this graphics card
* Smaller numbers mean a higher performance
1 This benchmark is not used for the average calculation
Game Benchmarks The following benchmarks stem from our benchmarks of review laptops. The performance depends on the used graphics memory, clock rate, processor, system settings, drivers, and operating systems. So the results don't have to be representative for all laptops with this GPU. For detailed information on the benchmark results, click on the fps number.
HD Graphics 6000:
18.4 [X] Intel NUC5i5RYK Intel Core i5-5250U 1.6GHz
HD Graphics 6000
min:
15 fps, max:
22 fps
fps
100%
HD Graphics 400 (Braswell):
14.1 fps
HD Graphics 6000:
18.2 [X] Intel NUC5i5RYK Intel Core i5-5250U 1.6GHz
HD Graphics 6000
fps
HD Graphics 6000:
12.9 [X] Intel NUC5i5RYK Intel Core i5-5250U 1.6GHz
HD Graphics 6000
fps
HD Graphics 6000:
11.6 [X] Intel NUC5i5RYK Intel Core i5-5250U 1.6GHz
HD Graphics 6000
fps
100%
HD Graphics 400 (Braswell):
18.5 fps
347%
HD Graphics 6000:
64.2 [X] Intel NUC5i5RYK Intel Core i5-5250U 1.6GHz
HD Graphics 6000
min:
58 fps
fps
100%
HD Graphics 400 (Braswell):
16 fps
HD Graphics 6000:
37.4 (!) [X] Intel NUC5i5RYK Intel Core i5-5250U 1.6GHz
HD Graphics 6000
min:
34 fps
fps
HD Graphics 6000:
41.3 [X] Intel NUC5i5RYK Intel Core i5-5250U 1.6GHz
HD Graphics 6000
min:
37 fps, max:
45 fps
fps
100%
HD Graphics 400 (Braswell):
12.7 fps
224%
HD Graphics 6000:
28.4 [X] Intel NUC5i5RYK Intel Core i5-5250U 1.6GHz
HD Graphics 6000
min:
22 fps, max:
35 fps
fps
100%
HD Graphics 400 (Braswell):
6.8 fps
100%
HD Graphics 400 (Braswell):
10.7 fps
100%
HD Graphics 400 (Braswell):
20.9 fps
278%
HD Graphics 6000:
55.3 61 [X] Intel NUC5i5RYK Intel Core i5-5250U 1.6GHz
HD Graphics 6000
min:
53 fps, max:
80 fps
~ 58 fps
100%
HD Graphics 400 (Braswell):
5.8 fps
564%
HD Graphics 6000:
32.7 fps
HD Graphics 6000:
18.9 fps
100%
HD Graphics 400 (Braswell):
9.7 fps
HD Graphics 6000:
20.8 [X] Intel NUC5i5RYK Intel Core i5-5250U 1.6GHz
HD Graphics 6000
min:
17 fps, max:
23 fps
fps
100%
HD Graphics 400 (Braswell):
15 15.1 ~ 15 fps
167%
HD Graphics 6000:
25 [X] Intel NUC5i5RYK Intel Core i5-5250U 1.6GHz
HD Graphics 6000
min:
20 fps, max:
31 fps
fps
100%
HD Graphics 400 (Braswell):
9.5 9.7 ~ 10 fps
100%
HD Graphics 400 (Braswell):
5.3 fps
100%
HD Graphics 400 (Braswell):
7.3 fps
396%
HD Graphics 6000:
28.9 [X] Intel NUC5i5RYK Intel Core i5-5250U 1.6GHz
HD Graphics 6000
min:
9 fps, max:
80 fps
fps
100%
HD Graphics 400 (Braswell):
3.2 fps
569%
HD Graphics 6000:
18.2 [X] Intel NUC5i5RYK Intel Core i5-5250U 1.6GHz
HD Graphics 6000
min:
8 fps, max:
71 fps
fps
HD Graphics 6000:
10.9 [X] Intel NUC5i5RYK Intel Core i5-5250U 1.6GHz
HD Graphics 6000
min:
5 fps, max:
70 fps
fps
HD Graphics 6000:
9.1 [X] Intel NUC5i5RYK Intel Core i5-5250U 1.6GHz
HD Graphics 6000
min:
4 fps, max:
80 fps
fps
HD Graphics 6000:
18.6 [X] Intel NUC5i5RYK Intel Core i5-5250U 1.6GHz
HD Graphics 6000
min:
14 fps, max:
23 fps
fps
HD Graphics 6000:
14 [X] Intel NUC5i5RYK Intel Core i5-5250U 1.6GHz
HD Graphics 6000
min:
10 fps, max:
18 fps
fps
HD Graphics 6000:
24.6 [X] Intel NUC5i5RYK Intel Core i5-5250U 1.6GHz
HD Graphics 6000
min:
20 fps, max:
31 fps
fps
HD Graphics 6000:
16.6 [X] Intel NUC5i5RYK Intel Core i5-5250U 1.6GHz
HD Graphics 6000
min:
14 fps, max:
19 fps
fps
100%
HD Graphics 400 (Braswell):
36.5 fps
145%
HD Graphics 6000:
53 (!) [X] Intel NUC5i5RYK Intel Core i5-5250U 1.6GHz
HD Graphics 6000
min:
47 fps, max:
59 fps
fps
100%
HD Graphics 400 (Braswell):
14.2 fps
275%
HD Graphics 6000:
39 (!) [X] Intel NUC5i5RYK Intel Core i5-5250U 1.6GHz
HD Graphics 6000
min:
33 fps, max:
42 fps
fps
100%
HD Graphics 400 (Braswell):
9 fps
237%
HD Graphics 6000:
21.3 [X] Intel NUC5i5RYK Intel Core i5-5250U 1.6GHz
HD Graphics 6000
min:
18 fps, max:
24 fps
fps
100%
HD Graphics 400 (Braswell):
13 fps
402%
HD Graphics 6000:
52.3 [X] Intel NUC5i5RYK 0.5.0.0
Intel Core i5-5250U 1.6GHz
HD Graphics 6000
min:
34 fps, max:
63 fps
fps
100%
HD Graphics 400 (Braswell):
8 fps
HD Graphics 6000:
16 [X] Intel NUC5i5RYK Intel Core i5-5250U 1.6GHz
HD Graphics 6000
min:
10 fps, max:
22 fps
fps
100%
HD Graphics 400 (Braswell):
13.3 fps
263%
HD Graphics 6000:
35 [X] Intel NUC5i5RYK Intel Core i5-5250U 1.6GHz
HD Graphics 6000
min:
31 fps, max:
37 fps
fps
HD Graphics 6000:
24.8 [X] Intel NUC5i5RYK Intel Core i5-5250U 1.6GHz
HD Graphics 6000
min:
22 fps, max:
28 fps
fps
HD Graphics 6000:
9.5 [X] Intel NUC5i5RYK Intel Core i5-5250U 1.6GHz
HD Graphics 6000
min:
8 fps, max:
10 fps
fps
HD Graphics 6000:
19.3 [X] Intel NUC5i5RYK Intel Core i5-5250U 1.6GHz
HD Graphics 6000
min:
16 fps, max:
22 fps
fps
100%
HD Graphics 400 (Braswell):
21.3 fps
257%
HD Graphics 6000:
54.7 [X] Intel NUC5i5RYK Intel Core i5-5250U 1.6GHz
HD Graphics 6000
fps
100%
HD Graphics 400 (Braswell):
11.4 fps
297%
HD Graphics 6000:
33.9 [X] Intel NUC5i5RYK Intel Core i5-5250U 1.6GHz
HD Graphics 6000
min:
30.7 fps
fps
HD Graphics 6000:
16.7 [X] Intel NUC5i5RYK Intel Core i5-5250U 1.6GHz
HD Graphics 6000
min:
15.4 fps
fps
HD Graphics 6000:
15.4 [X] Intel NUC5i5RYK Intel Core i5-5250U 1.6GHz
HD Graphics 6000
min:
14.4 fps
fps
HD Graphics 6000:
11 [X] Core i5-5250U (Intel NUC) Intel Core i5-5250U 1.6GHz
HD Graphics 6000
min:
8 fps, max:
15 fps
fps
HD Graphics 6000:
10 [X] Core i5-5250U (Intel NUC) Intel Core i5-5250U 1.6GHz
HD Graphics 6000
min:
7 fps, max:
14 fps
fps
100%
HD Graphics 400 (Braswell):
8.5 fps
165%
HD Graphics 6000:
13.4 [X] Core i5-5250U (Intel NUC) 1.07
Intel Core i5-5250U 1.6GHz
HD Graphics 6000
min:
10 fps, max:
18 fps
13.8 [X] Core i5-5250U (Intel NUC) 1.03
Intel Core i5-5250U 1.6GHz
HD Graphics 6000
min:
10 fps, max:
17 fps
~ 14 fps
100%
HD Graphics 400 (Braswell):
5.6 fps
100%
HD Graphics 400 (Braswell):
40.1 fps
232%
HD Graphics 6000:
93 [X] Core i5-5250U (Intel NUC) Intel Core i5-5250U 1.6GHz
HD Graphics 6000
min:
79 fps, max:
120 fps
fps
100%
HD Graphics 400 (Braswell):
11.7 fps
195%
HD Graphics 6000:
22.8 [X] Core i5-5250U (Intel NUC) Intel Core i5-5250U 1.6GHz
HD Graphics 6000
min:
18 fps, max:
33 fps
fps
HD Graphics 6000:
12.9 [X] Core i5-5250U (Intel NUC) Intel Core i5-5250U 1.6GHz
HD Graphics 6000
min:
12.5 fps, max:
16.5 fps
fps
100%
HD Graphics 400 (Braswell):
14.3 fps
134%
HD Graphics 5000:
19.2 fps
HD Graphics 6000:
35.3 [X] Core i5-5250U (Intel NUC) Intel Core i5-5250U 1.6GHz
HD Graphics 6000
min:
30 fps, max:
45 fps
fps
HD Graphics 5000:
20.8 fps
HD Graphics 6000:
26.9 [X] Core i5-5250U (Intel NUC) Intel Core i5-5250U 1.6GHz
HD Graphics 6000
min:
23 fps, max:
33 fps
fps
HD Graphics 5000:
15.1 fps
HD Graphics 6000:
9.1 [X] Core i5-5250U (Intel NUC) Intel Core i5-5250U 1.6GHz
HD Graphics 6000
min:
7 fps, max:
12 fps
fps
HD Graphics 6000:
18.7 [X] Core i5-5250U (Intel NUC) Intel Core i5-5250U 1.6GHz
HD Graphics 6000
min:
16 fps, max:
21 fps
fps
HD Graphics 5000:
12.7 fps
HD Graphics 6000:
13.5 [X] Core i5-5250U (Intel NUC) Intel Core i5-5250U 1.6GHz
HD Graphics 6000
min:
11 fps, max:
16 fps
fps
HD Graphics 5000:
15.8 fps
HD Graphics 5000:
10.6 fps
100%
HD Graphics 400 (Braswell):
5.4 fps
387%
HD Graphics 6000:
20.9 [X] Core i5-5250U (Intel NUC) Intel Core i5-5250U 1.6GHz
HD Graphics 6000
min:
18.1 fps
fps
322%
HD Graphics 5000:
17.4 fps
100%
HD Graphics 400 (Braswell):
2.9 fps
579%
HD Graphics 6000:
16.8 [X] Core i5-5250U (Intel NUC) Intel Core i5-5250U 1.6GHz
HD Graphics 6000
min:
13.4 fps
fps
414%
HD Graphics 5000:
12 fps
HD Graphics 6000:
6.1 [X] Core i5-5250U (Intel NUC) Intel Core i5-5250U 1.6GHz
HD Graphics 6000
min:
5.1 fps
fps
HD Graphics 5000:
14.3 fps
HD Graphics 5000:
10.6 fps
HD Graphics 6000:
0 (!) [X] Core i5-5250U (Intel NUC) Intel Core i5-5250U 1.6GHz
HD Graphics 6000
fps
HD Graphics 6000:
33 [X] Core i5-5250U (Intel NUC) Intel Core i5-5250U 1.6GHz
HD Graphics 6000
min:
24 fps, max:
61 fps
fps
HD Graphics 5000:
25.4 fps
HD Graphics 6000:
17.6 [X] Core i5-5250U (Intel NUC) Intel Core i5-5250U 1.6GHz
HD Graphics 6000
min:
14 fps, max:
32 fps
fps
HD Graphics 5000:
16.2 fps
HD Graphics 6000:
40.9 [X] Core i5-5250U (Intel NUC) Intel Core i5-5250U 1.6GHz
HD Graphics 6000
min:
16 fps, max:
68 fps
fps
HD Graphics 5000:
15.5 fps
HD Graphics 6000:
20.8 [X] Core i5-5250U (Intel NUC) Intel Core i5-5250U 1.6GHz
HD Graphics 6000
min:
10 fps, max:
33 fps
fps
HD Graphics 5000:
12.2 fps
HD Graphics 6000:
13.3 [X] Core i5-5250U (Intel NUC) Intel Core i5-5250U 1.6GHz
HD Graphics 6000
min:
5 fps, max:
38 fps
fps
HD Graphics 6000:
10.7 [X] Core i5-5250U (Intel NUC) Intel Core i5-5250U 1.6GHz
HD Graphics 6000
min:
7 fps, max:
22 fps
fps
100%
HD Graphics 400 (Braswell):
27 fps
204%
HD Graphics 6000:
55 [X] Core i5-5250U (Intel NUC) Intel Core i5-5250U 1.6GHz
HD Graphics 6000
min:
40 fps
fps
189%
HD Graphics 5000:
51 fps
100%
HD Graphics 400 (Braswell):
16 fps
231%
HD Graphics 6000:
37 [X] Core i5-5250U (Intel NUC) Intel Core i5-5250U 1.6GHz
HD Graphics 6000
min:
27 fps
fps
219%
HD Graphics 5000:
35 fps
HD Graphics 6000:
21 [X] Core i5-5250U (Intel NUC) Intel Core i5-5250U 1.6GHz
HD Graphics 6000
min:
16 fps
fps
HD Graphics 6000:
13 [X] Core i5-5250U (Intel NUC) Intel Core i5-5250U 1.6GHz
HD Graphics 6000
min:
12 fps
fps
HD Graphics 5000:
14.2 fps
HD Graphics 5000:
10.6 fps
HD Graphics 5000:
14.7 fps
100%
HD Graphics 400 (Braswell):
11.5 11.9 ~ 12 fps
283%
HD Graphics 6000:
34 fps
241%
HD Graphics 5000:
28.9 fps
100%
HD Graphics 400 (Braswell):
7 fps
377%
HD Graphics 6000:
26.4 fps
299%
HD Graphics 5000:
20.9 fps
HD Graphics 5000:
11.4 fps
HD Graphics 5000:
20.1 fps
HD Graphics 6000:
50 [X] Core i5-5250U (Intel NUC) Intel Core i5-5250U 1.6GHz
HD Graphics 6000
min:
42 fps, max:
61 fps
fps
HD Graphics 5000:
36.2 fps
HD Graphics 6000:
35.7 [X] Core i5-5250U (Intel NUC) Intel Core i5-5250U 1.6GHz
HD Graphics 6000
min:
30 fps, max:
40 fps
fps
HD Graphics 5000:
28.1 fps
HD Graphics 6000:
23.3 [X] Core i5-5250U (Intel NUC) Intel Core i5-5250U 1.6GHz
HD Graphics 6000
min:
20 fps, max:
27 fps
fps
HD Graphics 5000:
17.4 fps
100%
HD Graphics 400 (Braswell):
37 fps
389%
HD Graphics 6000:
144 [X] Core i5-5250U (Intel NUC) Intel Core i5-5250U 1.6GHz
HD Graphics 6000
min:
110 fps, max:
187 fps
fps
455%
HD Graphics 5000:
168.3 fps
100%
HD Graphics 400 (Braswell):
7.6 fps
597%
HD Graphics 6000:
45.4 [X] Core i5-5250U (Intel NUC) Intel Core i5-5250U 1.6GHz
HD Graphics 6000
min:
34 fps, max:
64 fps
fps
432%
HD Graphics 5000:
32.8 fps
HD Graphics 6000:
21.8 [X] Core i5-5250U (Intel NUC) Intel Core i5-5250U 1.6GHz
HD Graphics 6000
min:
15 fps, max:
28 fps
fps
HD Graphics 5000:
14.2 fps
HD Graphics 6000:
14.1 [X] Core i5-5250U (Intel NUC) Intel Core i5-5250U 1.6GHz
HD Graphics 6000
min:
10 fps, max:
20 fps
fps
100%
HD Graphics 400 (Braswell):
6.5 fps
442%
HD Graphics 5000:
28.7 fps
100%
HD Graphics 400 (Braswell):
4.8 fps
367%
HD Graphics 5000:
17.6 fps
100%
HD Graphics 400 (Braswell):
28.9 fps
325%
HD Graphics 6000:
94 fps
297%
HD Graphics 5000:
85.7 fps
100%
HD Graphics 400 (Braswell):
12.5 fps
256%
HD Graphics 6000:
32 fps
242%
HD Graphics 5000:
30.2 fps
HD Graphics 5000:
14.9 fps
HD Graphics 5000:
12.5 fps
HD Graphics 5000:
17 18.1 ~ 18 fps
HD Graphics 5000:
27.2 fps
HD Graphics 5000:
22.1 fps
HD Graphics 5000:
10.7 fps
HD Graphics 5000:
33.2 fps
HD Graphics 5000:
20.2 fps
HD Graphics 5000:
13.2 fps
HD Graphics 5000:
8.4 9.7 ~ 9 fps
100%
HD Graphics 400 (Braswell):
11.8 fps
339%
HD Graphics 6000:
40 [X] Core i5-5250U (Intel NUC) Intel Core i5-5250U 1.6GHz
HD Graphics 6000
fps
HD Graphics 6000:
13 [X] Core i5-5250U (Intel NUC) Intel Core i5-5250U 1.6GHz
HD Graphics 6000
fps
HD Graphics 6000:
6.9 [X] Core i5-5250U (Intel NUC) Intel Core i5-5250U 1.6GHz
HD Graphics 6000
fps
HD Graphics 5000:
20.5 fps
100%
HD Graphics 400 (Braswell):
16.2 fps
198%
HD Graphics 6000:
32 [X] Core i5-5250U (Intel NUC) Intel Core i5-5250U 1.6GHz
HD Graphics 6000
min:
26 fps, max:
43 fps
fps
177%
HD Graphics 5000:
28.6 fps
100%
HD Graphics 400 (Braswell):
12.3 fps
180%
HD Graphics 6000:
22.2 [X] Core i5-5250U (Intel NUC) Intel Core i5-5250U 1.6GHz
HD Graphics 6000
min:
19 fps, max:
28 fps
fps
162%
HD Graphics 5000:
19.9 fps
100%
HD Graphics 400 (Braswell):
7.9 fps
197%
HD Graphics 6000:
15.6 [X] Core i5-5250U (Intel NUC) Intel Core i5-5250U 1.6GHz
HD Graphics 6000
min:
12 fps, max:
22 fps
fps
168%
HD Graphics 5000:
13.3 fps
HD Graphics 6000:
5.6 [X] Core i5-5250U (Intel NUC) Intel Core i5-5250U 1.6GHz
HD Graphics 6000
min:
3 fps, max:
9 fps
fps
100%
HD Graphics 400 (Braswell):
30 fps
100%
HD Graphics 400 (Braswell):
28 fps
182%
HD Graphics 5000:
51 fps
100%
HD Graphics 400 (Braswell):
17 fps
200%
HD Graphics 5000:
34 fps
HD Graphics 5000:
165.1 fps
HD Graphics 5000:
100.2 fps
HD Graphics 5000:
71.4 fps
HD Graphics 5000:
39.3 fps
HD Graphics 5000:
39.8 fps
HD Graphics 5000:
29.4 fps
HD Graphics 5000:
21.6 fps
100%
HD Graphics 400 (Braswell):
30 fps
100%
HD Graphics 400 (Braswell):
30 fps
HD Graphics 5000:
13.3 fps
HD Graphics 5000:
10.4 fps
100%
HD Graphics 400 (Braswell):
19.9 fps
294%
HD Graphics 5000:
58.6 fps
100%
HD Graphics 400 (Braswell):
12.5 fps
250%
HD Graphics 5000:
31.3 fps
HD Graphics 5000:
22.7 fps
HD Graphics 5000:
12.5 fps
HD Graphics 6000:
19 [X] Core i5-5250U (Intel NUC) Intel Core i5-5250U 1.6GHz
HD Graphics 6000
min:
10 fps, max:
36 fps
fps
HD Graphics 6000:
15.7 [X] Core i5-5250U (Intel NUC) Intel Core i5-5250U 1.6GHz
HD Graphics 6000
min:
8 fps, max:
32 fps
fps
HD Graphics 6000:
12 [X] Core i5-5250U (Intel NUC) Intel Core i5-5250U 1.6GHz
HD Graphics 6000
min:
7 fps, max:
23 fps
fps
HD Graphics 6000:
6 [X] Core i5-5250U (Intel NUC) Intel Core i5-5250U 1.6GHz
HD Graphics 6000
min:
2 fps, max:
10 fps
fps
239%
HD Graphics 6000:
42.9 43.9 ~ 43 fps
194%
HD Graphics 5000:
32 [X] Dell XPS 12 Haswell Intel Core i7-4650U 1.7GHz
HD Graphics 5000
34.3 34.3 38.3 ~ 35 fps
300%
HD Graphics 6000:
26.4 26.6 ~ 27 fps
222%
HD Graphics 5000:
17 [X] Dell XPS 12 Haswell Intel Core i7-4650U 1.7GHz
HD Graphics 5000
20.1 20.9 22.5 ~ 20 fps
100%
HD Graphics 400 (Braswell):
6.2 fps
354%
HD Graphics 6000:
22.1 fps
257%
HD Graphics 5000:
14 [X] Dell XPS 12 Haswell Intel Core i7-4650U 1.7GHz
HD Graphics 5000
14.2 16.6 18.2 ~ 16 fps
100%
HD Graphics 400 (Braswell):
1.8 fps
428%
HD Graphics 5000:
7.7 fps
100%
HD Graphics 400 (Braswell):
24.8 fps
250%
HD Graphics 6000:
60 64.7 ~ 62 fps
214%
HD Graphics 5000:
44 [X] Dell XPS 12 Haswell Intel Core i7-4650U 1.7GHz
HD Graphics 5000
52.5 53.9 54.3 55.3 56 ~ 53 fps
100%
HD Graphics 400 (Braswell):
10.2 (!) fps
333%
HD Graphics 6000:
33 34.5 ~ 34 fps
255%
HD Graphics 5000:
23 [X] Dell XPS 12 Haswell Intel Core i7-4650U 1.7GHz
HD Graphics 5000
25 26 27.5 28.3 28.6 ~ 26 fps
HD Graphics 6000:
22 22.9 ~ 22 fps
HD Graphics 5000:
14 14.9 15 [X] Dell XPS 12 Haswell Intel Core i7-4650U 1.7GHz
HD Graphics 5000
15.8 17.4 17.5 ~ 16 fps
HD Graphics 5000:
7.9 8 [X] Dell XPS 12 Haswell Intel Core i7-4650U 1.7GHz
HD Graphics 5000
9.5 ~ 8 fps
HD Graphics 6000:
20.9 [X] Core i5-5250U (Intel NUC) Intel Core i5-5250U 1.6GHz
HD Graphics 6000
min:
16 fps, max:
29 fps
fps
HD Graphics 5000:
20.9 fps
HD Graphics 6000:
13.9 [X] Core i5-5250U (Intel NUC) Intel Core i5-5250U 1.6GHz
HD Graphics 6000
min:
11 fps, max:
19 fps
fps
100%
HD Graphics 400 (Braswell):
21.1 fps
100%
HD Graphics 400 (Braswell):
10.8 fps
100%
HD Graphics 400 (Braswell):
8.7 fps
HD Graphics 5000:
28.6 fps
HD Graphics 5000:
19.2 fps
HD Graphics 5000:
16.6 fps
HD Graphics 5000:
11.2 fps
HD Graphics 5000:
22.3 fps
HD Graphics 5000:
15.7 fps
HD Graphics 5000:
40.5 fps
HD Graphics 5000:
14.1 fps
100%
HD Graphics 400 (Braswell):
10.5 fps
100%
HD Graphics 400 (Braswell):
18.3 fps
372%
HD Graphics 6000:
68 fps
311%
HD Graphics 5000:
54 58 59 [X] Dell XPS 12 Haswell Intel Core i7-4650U 1.7GHz
HD Graphics 5000
~ 57 fps
HD Graphics 5000:
38 [X] Dell XPS 12 Haswell Intel Core i7-4650U 1.7GHz
HD Graphics 5000
42 ~ 40 fps
HD Graphics 5000:
31 [X] Dell XPS 12 Haswell Intel Core i7-4650U 1.7GHz
HD Graphics 5000
32 ~ 32 fps
HD Graphics 5000:
13 19 21 [X] Dell XPS 12 Haswell Intel Core i7-4650U 1.7GHz
HD Graphics 5000
~ 18 fps
100%
HD Graphics 400 (Braswell):
27.7 fps
213%
HD Graphics 5000:
57.8 59.2 61 [X] Dell XPS 12 Haswell Intel Core i7-4650U 1.7GHz
HD Graphics 5000
~ 59 fps
HD Graphics 5000:
30 [X] Dell XPS 12 Haswell Intel Core i7-4650U 1.7GHz
HD Graphics 5000
32.2 32.8 ~ 32 fps
HD Graphics 5000:
16.2 18 [X] Dell XPS 12 Haswell Intel Core i7-4650U 1.7GHz
HD Graphics 5000
20.1 ~ 18 fps
HD Graphics 5000:
9 [X] Dell XPS 12 Haswell Intel Core i7-4650U 1.7GHz
HD Graphics 5000
fps
100%
HD Graphics 400 (Braswell):
19.8 fps
149%
HD Graphics 5000:
29.5 fps
100%
HD Graphics 400 (Braswell):
9.5 fps
194%
HD Graphics 5000:
18.4 fps
HD Graphics 5000:
11.6 fps
100%
HD Graphics 400 (Braswell):
18.4 fps
100%
HD Graphics 400 (Braswell):
11.3 fps
100%
HD Graphics 400 (Braswell):
29.4 fps
100%
HD Graphics 400 (Braswell):
14.3 fps
100%
HD Graphics 400 (Braswell):
12.5 fps
HD Graphics 5000:
88.8 fps
100%
HD Graphics 400 (Braswell):
34.5 fps
342%
HD Graphics 6000:
118 fps
429%
HD Graphics 5000:
126 169 [X] Dell XPS 12 Haswell Intel Core i7-4650U 1.7GHz
HD Graphics 5000
~ 148 fps
100%
HD Graphics 400 (Braswell):
8.8 fps
489%
HD Graphics 6000:
43 fps
466%
HD Graphics 5000:
38 43 [X] Dell XPS 12 Haswell Intel Core i7-4650U 1.7GHz
HD Graphics 5000
~ 41 fps
100%
HD Graphics 400 (Braswell):
5.6 fps
375%
HD Graphics 6000:
21 fps
446%
HD Graphics 5000:
24 26 [X] Dell XPS 12 Haswell Intel Core i7-4650U 1.7GHz
HD Graphics 5000
~ 25 fps
HD Graphics 5000:
10 16 [X] Dell XPS 12 Haswell Intel Core i7-4650U 1.7GHz
HD Graphics 5000
~ 13 fps
100%
HD Graphics 400 (Braswell):
60 88.5 [X] Medion Akoya E2228T-MD61250 Intel Atom x5-Z8350 1.4GHz
HD Graphics 400 (Braswell)
~ 74 fps
100%
HD Graphics 400 (Braswell):
22.6 [X] Medion Akoya E2228T-MD61250 Intel Atom x5-Z8350 1.4GHz
HD Graphics 400 (Braswell)
25.2 ~ 24 fps
100%
HD Graphics 400 (Braswell):
9.9 [X] Medion Akoya E2228T-MD61250 Intel Atom x5-Z8350 1.4GHz
HD Graphics 400 (Braswell)
fps
Average Gaming Intel HD Graphics 400 (Braswell) → 100% Average Gaming 30-70 fps → 100%
Average Gaming Intel HD Graphics 6000 → 315% Average Gaming 30-70 fps → 315%
Average Gaming Intel HD Graphics 5000 → 281% Average Gaming 30-70 fps → 262%
For more games that might be playable and a list of all games and graphics cards visit our Gaming List
v1.26
log 18. 04:14:12
#0 checking url part for id 7349 +0s ... 0s
#1 checking url part for id 5943 +0s ... 0s
#2 checking url part for id 4574 +0s ... 0s
#3 not redirecting to Ajax server +0s ... 0s
#4 did not recreate cache, as it is less than 5 days old! Created at Tue, 16 Apr 2024 05:39:00 +0200 +0.001s ... 0.001s
#5 composed specs +0.171s ... 0.172s
#6 did output specs +0s ... 0.172s
#7 start showIntegratedCPUs +0s ... 0.172s
#8 getting avg benchmarks for device 7349 +0.057s ... 0.229s
#9 got single benchmarks 7349 +0.098s ... 0.327s
#10 getting avg benchmarks for device 5943 +0.021s ... 0.349s
#11 got single benchmarks 5943 +0.022s ... 0.371s
#12 getting avg benchmarks for device 4574 +0.021s ... 0.392s
#13 got single benchmarks 4574 +0.031s ... 0.423s
#14 got avg benchmarks for devices +0s ... 0.423s
#15 min, max, avg, median took s +0.485s ... 0.908s
#16 before gaming benchmark output +0s ... 0.908s
#17 Got 412 rows for game benchmarks. +0.046s ... 0.955s
#18 composed SQL query for gamebenchmarks +0s ... 0.955s
#19 got data and put it in $dataArray +0.057s ... 1.012s
#20 benchmarks composed for output. +0.192s ... 1.204s
#21 calculated avg scores. +0s ... 1.204s
#22 return log +0.003s ... 1.207s
Please share our article, every link counts!
Redaktion, 2017-09- 8 (Update: 2023-07- 1)
 Deutsch
 English
 Español
 Français
 Italiano
 Nederlands
 Polski
 Português
 Русский
 Türkçe
 Svenska
 Chinese
 Magyar