Notebookcheck Logo

NVIDIA GeForce RTX 3050 6GB Laptop GPU vs NVIDIA T600 vs NVIDIA Quadro T2000 Max-Q

NVIDIA GeForce RTX 3050 6GB Laptop GPU

► remove from comparison NVIDIA GeForce RTX 3050 6GB Laptop GPU

The Nvidia GeForce RTX 3050 6GB Laptop GPU (mobile, GN20-P0-R, 2023 Refresh) is the refresh of the RTX 3050 4GB Laptop GPU (slowest RTX 3000 mobile card) and also based on the GA107 Ampere chip. The 6GB variant offers more CUDA cores (2,560, +25%) but a cut down memory bus to 96 Bit. The clock speed depends on the TGP variant and can range from 713 - 1530 (base) and 1058 - 1740 (boost) for the TGP variants of 35 to 80 Watt (see table below).

The performance is between the old 4GB RTX 3050 and the RTX 3050 Ti and therefore best suited for full HD gaming (1920 x 1080) in medium to high graphic settings. The performance is not sufficient to enable Raytracing in most games, but the Tensor cores can be used for DLSS in some games (and get performance boost with slight quality reduction). Beware, that the low TGP variants will offer a significantly lower performance.

The GA107 chip offers 3,072 FP32 ALUs of which half can also execute INT32 instructions (i.e. 1,536 INT32 ALUs). The RTX 3050 however maybe won't use all ALUs on the chip. With Turing all shaders could still execute FP32 or INT32 instructions. The raytracing and tensor cores on the chip were also improved according to Nvidia. The Ampere chips also include an improved 5th generation video encoder (NVENC for H.264 and H.265) and a 7th generation decoder (for various formats now including AV1).

The GA107 chip is manufactured by Samsung in 8nm (8N), which is not quite able to keep up with the 7nm node at TSMC (e.g. used by AMD and also for the professional GA100 Ampere chip).

NVIDIA T600

► remove from comparison NVIDIA T600

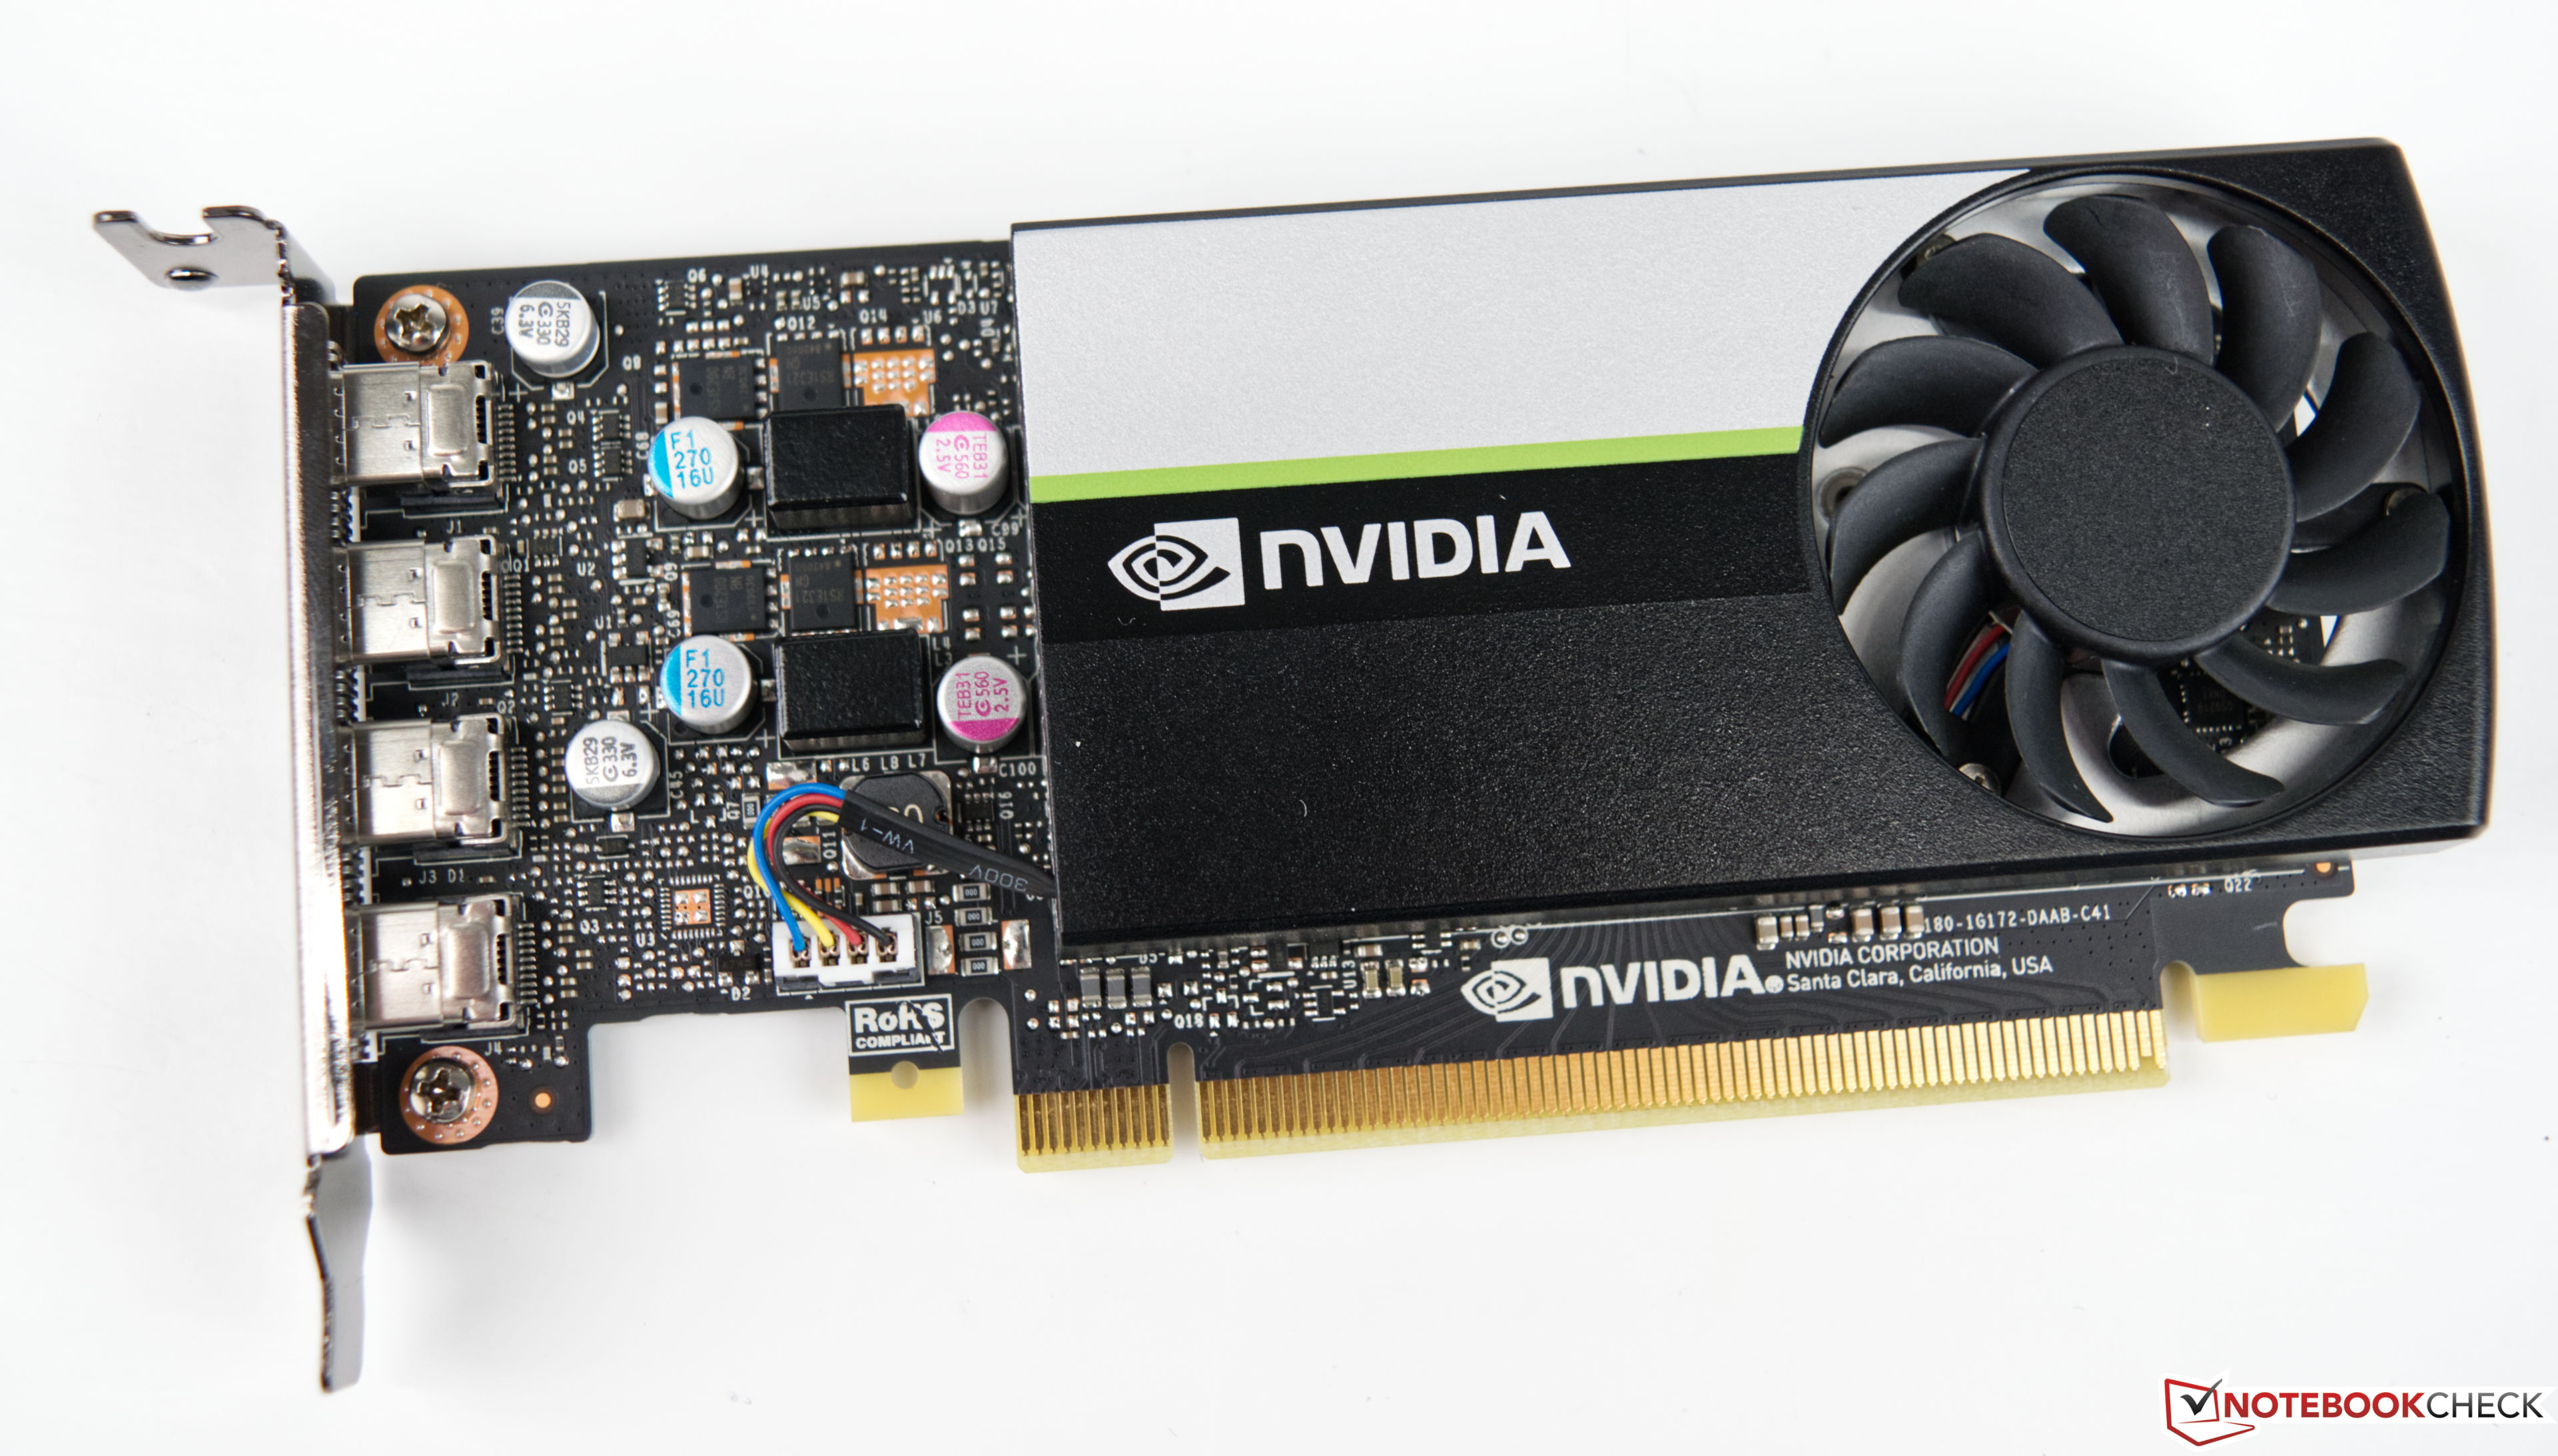
The Nvidia T600 Desktop GPU is a professional graphics card for workstations that is based on the Turing architecture (TU117 chip). The desktop version only offers 640 of the 1024 cores and therefore also less than the T600 mobile (896 CUDA cores). The card offers 4 GB GDDR6 graphics memory connected with a 128 bit bus (up to 160 GB/s bandwidth). The T600 supports certified drivers (former Quadro line) for professional applications like CAD, 3D modelling, DCC, medicine, or visualization applications.

The maximum power consumption of the card is rated at 40W.

NVIDIA Quadro T2000 Max-Q

► remove from comparison

The Nvidia Quadro T2000 with Max-Q Design is a professional mobile graphics card that is based on the Turing architecture (TU117 chip). It is based on the consumer desktop GTX 1650 Ti therefore currently between a mobile GTX 1650 and GTX 1660 Ti. The chip is manufactured in 12nm FinFET at TSMC. Compared to the normal Quadro T2000, the Max-Q variants are clocked lower and work in a more efficient state. Currently, we know of two variants with different clock speeds and power consumptions (35 and 40 W).

ModelShaderTGP (W)Base (MHz)Boost (MHz)
Quadro T2000 Mobile10246015751785
Quadro T2000 Max-Q10244012001620
Quadro T2000 Max-Q1024359301500
GeForce GTX 1650 Ti (Desktop)102475?15301725
GeForce GTX 1660 Ti Mobile15368014551590
GeForce GTX 1650 Mobile8965013951560

The Turing generation did not only introduce raytracing for the RTX cards, but also optimized the architecture of the cores and caches. According to Nvidia the CUDA cores offer now a concurrent execution of floating point and integer operations for increased performance in compute-heavy workloads of modern games. Furthermore, the caches were reworked (new unified memory architecture with twice the cache compared to Pascal). This leads to up to 50% more instructions per clock and a 40% more power efficient usage compared to Pascal.

The performance in professional apps should be clearly lower than a normal (Max-P) Quadro T2000 due to the lower clock speeds, but still ahead the slower Quadro T1000 due to the higher shader count. Compared to consumer cards, the mobile GTX 1650 should be still slower.

Thanks to the relative low power consumption of the Quadro T2000 Max-Q, the GPU is suited for thin and light laptops. The used TU116 chip is manufactured in 12nm FFN at TSMC.

NVIDIA GeForce RTX 3050 6GB Laptop GPUNVIDIA T600NVIDIA Quadro T2000 Max-Q
Quadro Turing Series
NVIDIA GeForce RTX 3090 Ti 10752 @ 1.56 - 1.86 GHz384 Bit @ 21000 MHz
NVIDIA GeForce RTX 3090 10496 @ 1.4 - 1.7 GHz384 Bit @ 19500 MHz
NVIDIA GeForce RTX 3080 Ti 10240 @ 1.37 - 1.67 GHz384 Bit @ 19000 MHz
NVIDIA GeForce RTX 3080 12 GB 8960/ cores @ 1.26 - 1.71 GHz384 Bit @ 19000 MHz
NVIDIA GeForce RTX 3080 8704 @ 1.45 - 1.71 GHz320 Bit @ 19000 MHz
GeForce RTX 3070 Ti 6144 @ 1.58 - 1.77 GHz256 Bit @ 19000 MHz
GeForce RTX 3080 Ti Laptop GPU 7424 @ 0.98 - 1.59 GHz256 Bit @ 14000 MHz
NVIDIA GeForce RTX 3070 5888 @ 1.5 - 1.73 GHz256 Bit @ 14000 MHz
GeForce RTX 3080 Laptop GPU 6144 @ 0.78 - 1.25 GHz256 Bit @ 14000 MHz
NVIDIA GeForce RTX 3060 Ti 4864 @ 1.41 - 1.67 GHz256 Bit @ 14000 MHz
GeForce RTX 3070 Ti Laptop GPU 5888 @ 0.92 - 1.48 GHz256 Bit @ 14000 MHz
GeForce RTX 3070 Laptop GPU 5120 @ 0.78 - 1.29 GHz256 Bit @ 14000 MHz
NVIDIA GeForce RTX 3060 3584 @ 1.32 - 1.78 GHz192 Bit @ 15000 MHz
GeForce RTX 3080 Max-Q 6144 @ 0.78 - 1.25 GHz256 Bit @ 6000 MHz
GeForce RTX 3070 Max-Q 5120 @ 1.29 GHz256 Bit
GeForce RTX 3060 Laptop GPU 3840 @ 0.82 - 1.7 GHz192 Bit @ 14000 MHz
GeForce RTX 3060 Max-Q 3840 @ 1.28 GHz192 Bit
NVIDIA GeForce RTX 3050 2560 @ 1.55 - 1.78 GHz128 Bit Bit @ 1750 MHz
GeForce RTX 3050 Ti Laptop GPU 2560 @ 1.22 - 1.49 GHz128 Bit @ 12000 MHz
GeForce RTX 3050 6GB Laptop GPU 2560 @ 1.24 - 1.49 GHz96 Bit @ 12000 MHz
GeForce RTX 3050 A Laptop GPU 1792 64 Bit
GeForce RTX 3050 4GB Laptop GPU 2048 @ 1.24 - 1.5 GHz128 Bit @ 12000 MHz
Quadro RTX 6000 (Laptop) 4608 @ 1.28 - 1.46 GHz384 Bit @ 14000 MHz
Quadro RTX 5000 (Laptop) 3072 @ 1.04 - 1.55 GHz256 Bit @ 14000 MHz
Quadro RTX 5000 Max-Q 3072 @ 0.6 - 1.35 GHz256 Bit @ 14000 MHz
Quadro RTX 4000 (Laptop) 2560 @ 1.11 - 1.56 GHz256 Bit @ 14000 MHz
Quadro RTX 4000 Max-Q 2560 @ 0.78 - 1.38 GHz256 Bit @ 14000 MHz
Quadro RTX 3000 (Laptop) 1920 @ 0.95 - 1.38 GHz192 Bit @ 14000 MHz
Quadro RTX 3000 Max-Q 1920 @ 0.6 - 1.22 GHz192 Bit @ 14000 MHz
Quadro T2000 (Laptop) 1024 @ 1.58 - 1.79 GHz128 Bit @ 8000 MHz
Quadro T2000 Max-Q 1024 @ 0.93 - 1.5 GHz128 Bit @ 8000 MHz
Quadro T1000 (Laptop) 768 @ 1.4 - 1.46 GHz128 Bit @ 8000 MHz
T1000 896 @ 1.07 - 1.4 GHz128 Bit @ 10000 MHz
T1200 Laptop GPU 1024 @ 0.86 - 1.43 GHz128 Bit @ 10000 MHz
Quadro T1000 Max-Q 768 @ 0.8 - 1.46 GHz128 Bit @ 8000 MHz
T600 Laptop GPU 896 @ 1.4 GHz128 Bit @ 10000 MHz
T550 Laptop GPU 1024 @ 1.07 - 1.67 GHz64 Bit @ 12000 MHz
T500 Laptop GPU 896 @ 1.37 - 1.7 GHz64 Bit @ 10000 MHz
T600 640 @ 0.74 - 1.34 GHz128 Bit @ 10000 MHz
CodenameGN20-P0-R 6GBN19P-Q3 MAX-Q
ArchitectureAmpereTuringTuring
Pipelines2560 - unified640 - unified1024 - unified
TMUs8040
ROPs3232
Raytracing Cores16
Tensor / AI Cores64
Core Speed1237 - 1492 (Boost) MHz735 - 1335 (Boost) MHz930 / 1200 - 1500 / 1620 (Boost) MHz
Memory Speed12000 effective = 1500 MHz10000 effective = 1250 MHz8000 MHz
Memory Bus Width96 Bit128 Bit128 Bit
Memory TypeGDDR6GDDR6GDDR5
Max. Amount of Memory6 GB4 GB4 GB
Shared Memorynonono
Memory Bandwidth144 GB/s160 GB/s
APIDirectX 12_2, Shader 6.7, OpenGL 4.6DirectX 12_1, Shader 6.6, OpenGL 4.6, OpenCL 3.0, Vulkan 1.3DirectX 12_1, OpenGL 4.6
Power Consumption60 Watt (35 - 80 Watt TGP)40 Watt35 - 40 Watt
technology8 nm12 nm12 nm
PCIe4.03.0 x16
DisplaysHDMI 2.1, DisplayPort 1.4a4 Displays (max.), DisplayPort 4x mini-DisplayPort 1.4a
FeaturesNVIDIA DLSS, NVIDIA Reflex, Resizable BAR, NVIDIA Broadcast, NVIDIA Ansel, NVIDIA ShadowPlay, NVIDIA G-SYNC, Advanced Optimus, Nvidia Max-Q, Dynamic Boost
Notebook Sizelargemedium sized
Date of Announcement06.01.2023 12.04.2021 27.05.2019
PredecessorGeForce RTX 3050 4GB Laptop GPU
Transistors4.7 Billion4.7 Billion
Die Size 200 mm²

Benchmarks

Performance Rating - 3DMark 11 + Fire Strike + Time Spy - GeForce RTX 3050 6GB Laptop GPU
4.5 pt (13%)
Restrict / Search: Model: Max. age: years
Performance Rating - 3DMark 11 + Fire Strike + Time Spy - T600
2.5 pt (7%)
Restrict / Search: Model: Max. age: years
3DMark - 3DMark Time Spy Score
min: 4933     avg: 5049     median: 5033 (13%)     max: 5182 Points
2496 Points (7%)
min: 3348     avg: 3352     median: 3352 (9%)     max: 3356 Points
3DMark - 3DMark Time Spy Graphics
min: 4501     avg: 4631     median: 4571 (9%)     max: 4820 Points
2195 Points (4%)
min: 3066     avg: 3094     median: 3094 (6%)     max: 3122 Points
3DMark - 3DMark Ice Storm Unlimited Graphics
500518 Points (51%)
304731 Points (31%)
75193 Points (8%)
3DMark - 3DMark Ice Storm Extreme Graphics
80214 Points (9%)
191%
1 T600 +
152912 Points (18%)
3DMark - 3DMark Cloud Gate Score
43015 Points (41%)
31922 Points (30%)
min: 21582     avg: 24992     median: 24991.5 (24%)     max: 28401 Points
3DMark - 3DMark Cloud Gate Graphics
72486 Points (18%)
40917 Points (10%)
min: 39803     avg: 41106     median: 41106 (10%)     max: 42409 Points
3DMark - 3DMark Fire Strike Standard Score
min: 10765     avg: 10944     median: 10840 (16%)     max: 11330 Points
6284 Points (9%)
min: 7320     avg: 7544     median: 7543.5 (11%)     max: 7767 Points
3DMark - 3DMark Fire Strike Standard Graphics
min: 11887     avg: 12113     median: 11973 (11%)     max: 12618 Points
6552 Points (6%)
min: 8107     avg: 8262     median: 8261.5 (8%)     max: 8416 Points
3DMark - 3DMark Ice Storm Graphics
80553 Points (9%)
227%
1 T600 +
182459 Points (20%)
3DMark - 3DMark Wild Life Extreme Unlimited
8916 Points (10%)
3DMark 11 - 3DM11 Performance Score
min: 15844     avg: 16748     median: 16933.5 (20%)     max: 17282 Points
9497 Points (11%)
min: 11695     avg: 11907     median: 11907 (14%)     max: 12119 Points
3DMark 11 - 3DM11 Performance GPU
min: 15860     avg: 16970     median: 16979.5 (13%)     max: 18059 Points
8694 Points (7%)
min: 11454     avg: 11461     median: 11461 (9%)     max: 11468 Points
3DMark Vantage
3DM Vant. Perf. total + NVIDIA T600
3DMark Vantage - 3DM Vant. Perf. total
100%
1 T600 +
344838 Points (100%)
3DM Vant. Perf. total + NVIDIA Quadro T2000 Max-Q
39269 Points (11%)
3DM Vant. Perf. GPU no PhysX + NVIDIA T600
3DMark Vantage - 3DM Vant. Perf. GPU no PhysX
100%
1 T600 +
30400 Points (17%)
3DM Vant. Perf. GPU no PhysX + NVIDIA Quadro T2000 Max-Q
36812 Points (20%)
3DMark 05 - 3DMark 05 - Standard
100%
1 T600 +
46380 Points (51%)
3DMark 06 3DMark 06 - Standard 1280x1024 + NVIDIA T600
3DMark 06
100%
1 T600 +
43997 Points (57%)
3DMark 06 - Standard 1280x1024 + NVIDIA Quadro T2000 Max-Q
36376 Points (48%)
Unigine Valley 1.0 - Unigine Valley 1.0 DX
100%
1 T600 +
32.7 fps (10%)
Blender - Blender 3.3 Classroom CUDA *
min: 107     avg: 111     median: 111 (16%)     max: 115 Seconds
Blender - Blender 3.3 Classroom OPTIX *
min: 68     avg: 70     median: 70 (26%)     max: 72 Seconds
SPECviewperf 12
specvp12 sw-03 + NVIDIA T600
SPECviewperf 12 - specvp12 sw-03
100%
1 T600 +
115 fps (29%)
specvp12 sw-03 + NVIDIA Quadro T2000 Max-Q
min: 94     avg: 97.4     median: 97.4 (24%)     max: 100.8 fps
specvp12 snx-02 + NVIDIA T600
SPECviewperf 12 - specvp12 snx-02
100%
1 T600 +
68.6 fps (10%)
specvp12 snx-02 + NVIDIA Quadro T2000 Max-Q
min: 74.5     avg: 74.6     median: 74.6 (11%)     max: 74.6 fps
specvp12 showcase-01 + NVIDIA T600
SPECviewperf 12 - specvp12 showcase-01
100%
1 T600 +
35.3 fps (6%)
specvp12 showcase-01 + NVIDIA Quadro T2000 Max-Q
min: 37.81     avg: 40.3     median: 40.3 (7%)     max: 42.75 fps
specvp12 mediacal-01 + NVIDIA T600
SPECviewperf 12 - specvp12 mediacal-01
100%
1 T600 +
19.5 fps (5%)
specvp12 mediacal-01 + NVIDIA Quadro T2000 Max-Q
min: 28.57     avg: 32.1     median: 32.1 (8%)     max: 35.53 fps
specvp12 maya-04 + NVIDIA T600
SPECviewperf 12 - specvp12 maya-04
100%
1 T600 +
67.4 fps (18%)
specvp12 maya-04 + NVIDIA Quadro T2000 Max-Q
min: 50.4     avg: 50.7     median: 50.7 (14%)     max: 51 fps
specvp12 energy-01 + NVIDIA T600
SPECviewperf 12 - specvp12 energy-01
100%
1 T600 +
5 fps (4%)
specvp12 energy-01 + NVIDIA Quadro T2000 Max-Q
min: 6.31     avg: 7.1     median: 7.1 (6%)     max: 7.79 fps
specvp12 creo-01 + NVIDIA T600
SPECviewperf 12 - specvp12 creo-01
100%
1 T600 +
78.5 fps (31%)
specvp12 creo-01 + NVIDIA Quadro T2000 Max-Q
min: 88.3     avg: 89     median: 89 (36%)     max: 89.6 fps
specvp12 catia-04 + NVIDIA T600
SPECviewperf 12 - specvp12 catia-04
100%
1 T600 +
76.9 fps (13%)
specvp12 catia-04 + NVIDIA Quadro T2000 Max-Q
min: 88.9     avg: 90.5     median: 90.5 (15%)     max: 92 fps
specvp12 3dsmax-05 + NVIDIA T600
SPECviewperf 12 - specvp12 3dsmax-05
100%
1 T600 +
80 fps (12%)
specvp12 3dsmax-05 + NVIDIA Quadro T2000 Max-Q
min: 93.7     avg: 93.9     median: 93.9 (14%)     max: 94 fps
SPECviewperf 13 specvp13 sw-04 + NVIDIA T600
SPECviewperf 13 - specvp13 sw-04
100%
1 T600 +
114 fps (31%)
specvp13 sw-04 + NVIDIA Quadro T2000 Max-Q
min: 97.2     avg: 100.6     median: 100.6 (27%)     max: 103.9 fps
specvp13 snx-03 + NVIDIA T600
SPECviewperf 13 - specvp13 snx-03
100%
1 T600 +
122 fps (14%)
specvp13 snx-03 + NVIDIA Quadro T2000 Max-Q
min: 139.4     avg: 141.6     median: 141.6 (16%)     max: 143.8 fps
specvp13 showcase-02 + NVIDIA T600
SPECviewperf 13 - specvp13 showcase-02
100%
1 T600 +
34.9 fps (6%)
specvp13 showcase-02 + NVIDIA Quadro T2000 Max-Q
min: 37.56     avg: 40     median: 40 (7%)     max: 42.39 fps
specvp13 medical-02 + NVIDIA T600
SPECviewperf 13 - specvp13 medical-02
100%
1 T600 +
35.7 fps (6%)
specvp13 medical-02 + NVIDIA Quadro T2000 Max-Q
min: 41.71     avg: 44.9     median: 44.9 (8%)     max: 48.02 fps
specvp13 maya-05 + NVIDIA T600
SPECviewperf 13 - specvp13 maya-05
100%
1 T600 +
99.8 fps (11%)
specvp13 maya-05 + NVIDIA Quadro T2000 Max-Q
min: 105.7     avg: 108     median: 108 (12%)     max: 110.2 fps
specvp13 energy-02 + NVIDIA T600
SPECviewperf 13 - specvp13 energy-02
100%
1 T600 +
12.6 fps (4%)
specvp13 energy-02 + NVIDIA Quadro T2000 Max-Q
min: 14.87     avg: 15.3     median: 15.3 (5%)     max: 15.66 fps
specvp13 creo-02 + NVIDIA T600
SPECviewperf 13 - specvp13 creo-02
100%
1 T600 +
98 fps (14%)
specvp13 creo-02 + NVIDIA Quadro T2000 Max-Q
min: 109.6     avg: 113.2     median: 113.2 (17%)     max: 116.8 fps
specvp13 3dsmax-06 + NVIDIA T600
SPECviewperf 13 - specvp13 3dsmax-06
100%
1 T600 +
79.9 fps (13%)
specvp13 3dsmax-06 + NVIDIA Quadro T2000 Max-Q
min: 88.9     avg: 91.1     median: 91.1 (14%)     max: 93.3 fps
specvp13 catia-05 + NVIDIA Quadro T2000 Max-Q
SPECviewperf 13 - specvp13 catia-05
min: 134.6     avg: 139.3     median: 139.3 (15%)     max: 143.9 fps
SPECviewperf 2020 specvp2020 solidworks-05 4k + NVIDIA T600
SPECviewperf 2020 - specvp2020 solidworks-05 4k
100%
1 T600 +
16.9 fps (4%)
specvp2020 snx-04 4k + NVIDIA T600
SPECviewperf 2020 - specvp2020 snx-04 4k
100%
1 T600 +
75.6 fps (8%)
specvp2020 medical-03 4k + NVIDIA T600
SPECviewperf 2020 - specvp2020 medical-03 4k
100%
1 T600 +
4.5 fps (3%)
specvp2020 maya-06 4k + NVIDIA T600
SPECviewperf 2020 - specvp2020 maya-06 4k
100%
1 T600 +
46.1 fps (7%)
specvp2020 energy-03 4k + NVIDIA T600
SPECviewperf 2020 - specvp2020 energy-03 4k
100%
1 T600 +
6.7 fps (1%)
specvp2020 creo-03 4k + NVIDIA T600
SPECviewperf 2020 - specvp2020 creo-03 4k
100%
1 T600 +
32.3 fps (14%)
specvp2020 catia-06 4k + NVIDIA T600
SPECviewperf 2020 - specvp2020 catia-06 4k
100%
1 T600 +
13.8 fps (9%)
specvp2020 3dsmax-07 4k + NVIDIA T600
SPECviewperf 2020 - specvp2020 3dsmax-07 4k
100%
1 T600 +
19.4 fps (7%)
Cinebench R10 Cinebench R10 Shading (32bit) + NVIDIA T600
Cinebench R10 - Cinebench R10 Shading (32bit)
100%
1 T600 +
6830 Points (5%)
Cinebench R10 Shading (32bit) + NVIDIA Quadro T2000 Max-Q
5840 Points (4%)
Cinebench R11.5 Cinebench R11.5 OpenGL 64 Bit + NVIDIA T600
Cinebench R11.5 - Cinebench R11.5 OpenGL 64 Bit
100%
1 T600 +
104.1 fps (34%)
Cinebench R11.5 OpenGL 64 Bit + NVIDIA Quadro T2000 Max-Q
141.2 fps (46%)
Cinebench R15
Cinebench R15 OpenGL 64 Bit + NVIDIA GeForce RTX 3050 6GB Laptop GPU
Cinebench R15 - Cinebench R15 OpenGL 64 Bit
min: 117.6     avg: 195.4     median: 221 (13%)     max: 222 fps
Cinebench R15 OpenGL 64 Bit + NVIDIA T600
103%
T600 +
227.1 fps (13%)
Cinebench R15 OpenGL 64 Bit + NVIDIA Quadro T2000 Max-Q
min: 216     avg: 220     median: 220 (13%)     max: 224 fps
Cinebench R15 OpenGL Ref. Match 64 Bit + NVIDIA GeForce RTX 3050 6GB Laptop GPU
Cinebench R15 - Cinebench R15 OpenGL Ref. Match 64 Bit
99.6 % (100%)
Cinebench R15 OpenGL Ref. Match 64 Bit + NVIDIA T600
100%
T600 +
99.6 % (100%)
Cinebench R15 OpenGL Ref. Match 64 Bit + NVIDIA Quadro T2000 Max-Q
99.6 % (100%)
GFXBench - GFXBench 5.0 Aztec Ruins High Tier Offscreen
64.8 fps (12%)
GFXBench - GFXBench 5.0 Aztec Ruins Normal Tier Offscreen
133.4 fps (10%)
GFXBench - GFXBench Car Chase Offscreen
150.8 fps (14%)
GFXBench 3.1 - GFXBench Manhattan ES 3.1 Offscreen
234.9 fps (5%)
GFXBench 3.0 - GFXBench 3.0 Manhattan Offscreen
255.2 fps (11%)
GFXBench (DX / GLBenchmark) 2.7
GFXBench T-Rex HD Offscreen C24Z16 + NVIDIA Quadro T2000 Max-Q
GFXBench (DX / GLBenchmark) 2.7 - GFXBench T-Rex HD Offscreen C24Z16
622 fps (5%)
Basemark GPU 1.2 - Basemark GPU 1.2 Vulkan Official Medium Offscreen 1080
min: 104.6     avg: 169.5     median: 142.2 (3%)     max: 289 fps
Basemark GPU 1.2 - Basemark GPU 1.2 Vulkan Official High Offscreen 2160
3.6 fps (1%)
Geekbench 6.4 - Geekbench 6.4 GPU OpenCL
min: 52427     avg: 53532     median: 53414 (14%)     max: 54754 Points
Geekbench 6.4 - Geekbench 6.4 GPU Vulkan
min: 18152     avg: 30115     median: 20847 (5%)     max: 51347 Points
LuxMark v2.0 64Bit - LuxMark v2.0 Room GPU
100%
1 T600 +
1121 Samples/s (4%)
1640 Samples/s (6%)
LuxMark v2.0 64Bit - LuxMark v2.0 Sala GPU
100%
1 T600 +
2049 Samples/s (4%)
3050 Samples/s (5%)
ComputeMark v2.1 - ComputeMark v2.1 Result
100%
1 T600 +
4825 Points (4%)
6331 Points (5%)
Power Consumption - Furmark Stress Test Power Consumption - external Monitor *
min: 76.8     avg: 84.9     median: 83.4 (11%)     max: 96.1 Watt
109%
1 T600 +
76.7 Watt (10%)
Power Consumption - The Witcher 3 Power Consumption - external Monitor *
min: 83     avg: 87.2     median: 86.1 (12%)     max: 92.6 Watt
103%
1 T600 +
83.5 Watt (12%)
Power Consumption - Witcher 3 Power Consumption *
min: 86.8     avg: 90.8     median: 89.5 (20%)     max: 96.2 Watt
min: 76.7     avg: 83.3     median: 83.3 (18%)     max: 89.9 Watt
Power Consumption - Power Efficiency - Witcher 3 ultra
min: 0.503     avg: 0.5     median: 0.5 (47%)     max: 0.591 fps per Watt
min: 0.3604     avg: 0.4     median: 0.4 (36%)     max: 0.4355 fps per Watt
Power Consumption - Power Efficiency - Witcher 3 ultra external Monitor
min: 0.527     avg: 0.6     median: 0.5 (45%)     max: 0.614 fps per Watt
60%
1 T600 +
0.3 fps per Watt (27%)
Power Consumption - Cyberpunk 2077 Power Consumption 150cd *
92.1 Watt (27%)
Power Consumption - Cyberpunk 2077 Power Consumption - external Monitor *
88.7 Watt (11%)
Emissions Witcher 3 Fan Noise + NVIDIA GeForce RTX 3050 6GB Laptop GPU
Emissions - Witcher 3 Fan Noise
min: 42.1     avg: 44.9     median: 43.8 (70%)     max: 48.7 dB(A)
Witcher 3 Fan Noise + NVIDIA Quadro T2000 Max-Q
min: 34.7     avg: 36.9     median: 36.9 (59%)     max: 39 dB(A)

Average Benchmarks NVIDIA GeForce RTX 3050 6GB Laptop GPU → 100% n=11

Average Benchmarks NVIDIA T600 → 65% n=11

Average Benchmarks NVIDIA Quadro T2000 Max-Q → 67% n=11

- Range of benchmark values for this graphics card
red legend - Average benchmark values for this graphics card
* Smaller numbers mean a higher performance
1 This benchmark is not used for the average calculation

Game Benchmarks

The following benchmarks stem from our benchmarks of review laptops. The performance depends on the used graphics memory, clock rate, processor, system settings, drivers, and operating systems. So the results don't have to be representative for all laptops with this GPU. For detailed information on the benchmark results, click on the fps number.

low 1920x1080
100%
GeForce RTX 3050 6GB Laptop GPU:
39.5  fps
med. 1920x1080
100%
GeForce RTX 3050 6GB Laptop GPU:
36.3  fps
high 1920x1080
100%
GeForce RTX 3050 6GB Laptop GPU:
31.5  fps
ultra 1920x1080
100%
GeForce RTX 3050 6GB Laptop GPU:
23.4  fps
QHD 2560x1440
100%
GeForce RTX 3050 6GB Laptop GPU:
15.1  fps
low 1920x1080
100%
GeForce RTX 3050 6GB Laptop GPU:
70  fps
med. 1920x1080
100%
GeForce RTX 3050 6GB Laptop GPU:
63  fps
high 1920x1080
100%
GeForce RTX 3050 6GB Laptop GPU:
55  fps
ultra 1920x1080
100%
GeForce RTX 3050 6GB Laptop GPU:
41  fps
QHD 2560x1440
100%
GeForce RTX 3050 6GB Laptop GPU:
31  fps
low 1920x1080
100%
GeForce RTX 3050 6GB Laptop GPU:
55.2 66.7 67.6 ~ 63 fps
med. 1920x1080
100%
GeForce RTX 3050 6GB Laptop GPU:
43.7 51.4 52.1 ~ 49 fps
high 1920x1080
100%
GeForce RTX 3050 6GB Laptop GPU:
36.6 42.7 43.2 ~ 41 fps
ultra 1920x1080
100%
GeForce RTX 3050 6GB Laptop GPU:
31.4 36.1 36.9 ~ 35 fps
QHD 2560x1440
100%
GeForce RTX 3050 6GB Laptop GPU:
21.3  fps
low 1920x1080
100%
GeForce RTX 3050 6GB Laptop GPU:
59.7  fps
med. 1920x1080
100%
GeForce RTX 3050 6GB Laptop GPU:
50.3  fps
high 1920x1080
100%
GeForce RTX 3050 6GB Laptop GPU:
45.4  fps
ultra 1920x1080
100%
GeForce RTX 3050 6GB Laptop GPU:
44.3  fps
F1 23

F1 23

2023
low 1920x1080
100%
GeForce RTX 3050 6GB Laptop GPU:
113.9 150.1 ~ 132 fps
med. 1920x1080
100%
GeForce RTX 3050 6GB Laptop GPU:
109 141.2 ~ 125 fps
high 1920x1080
100%
GeForce RTX 3050 6GB Laptop GPU:
86.9 97.5 ~ 92 fps
ultra 1920x1080
100%
GeForce RTX 3050 6GB Laptop GPU:
20.5 26 ~ 23 fps
QHD 2560x1440
100%
GeForce RTX 3050 6GB Laptop GPU:
10.6 14.3 ~ 12 fps
Returnal

Returnal

2023
low 1920x1080
100%
GeForce RTX 3050 6GB Laptop GPU:
40  fps
med. 1920x1080
100%
GeForce RTX 3050 6GB Laptop GPU:
38  fps
high 1920x1080
100%
GeForce RTX 3050 6GB Laptop GPU:
34  fps
ultra 1920x1080
100%
GeForce RTX 3050 6GB Laptop GPU:
29  fps
F1 22

F1 22

2022
low 1920x1080
100%
GeForce RTX 3050 6GB Laptop GPU:
110.9 149.9 150.2 163.5 ~ 144 fps
med. 1920x1080
100%
GeForce RTX 3050 6GB Laptop GPU:
106.1 138.9 145.3 151.5 ~ 135 fps
high 1920x1080
100%
GeForce RTX 3050 6GB Laptop GPU:
85.5 102 109.5 109.7 ~ 102 fps
ultra 1920x1080
100%
GeForce RTX 3050 6GB Laptop GPU:
30.7 31.6 33.6 34 ~ 32 fps
QHD 2560x1440
100%
GeForce RTX 3050 6GB Laptop GPU:
18.1 20.1 ~ 19 fps
low 1920x1080
100%
GeForce RTX 3050 6GB Laptop GPU:
105.6 113.3 ~ 109 fps
med. 1920x1080
100%
GeForce RTX 3050 6GB Laptop GPU:
84.7 89.7 ~ 87 fps
high 1920x1080
100%
GeForce RTX 3050 6GB Laptop GPU:
55.9 59.2 ~ 58 fps
ultra 1920x1080
100%
GeForce RTX 3050 6GB Laptop GPU:
44.3 46.4 ~ 45 fps
low 1920x1080
100%
GeForce RTX 3050 6GB Laptop GPU:
80.8  fps
med. 1920x1080
100%
GeForce RTX 3050 6GB Laptop GPU:
64.2  fps
high 1920x1080
100%
GeForce RTX 3050 6GB Laptop GPU:
46.4  fps
ultra 1920x1080
100%
GeForce RTX 3050 6GB Laptop GPU:
38.5  fps
Far Cry 6

Far Cry 6

2021
low 1280x720
T600:
93.5  fps
med. 1920x1080
T600:
44.6  fps
high 1920x1080
T600:
21.3  fps
ultra 1920x1080
T600:
6.3  fps
F1 2021

F1 2021

2021
low 1280x720
100%
GeForce RTX 3050 6GB Laptop GPU:
218  fps
79%
T600:
171.9  fps
med. 1920x1080
100%
GeForce RTX 3050 6GB Laptop GPU:
127.4  fps
62%
T600:
78.8  fps
high 1920x1080
100%
GeForce RTX 3050 6GB Laptop GPU:
104.8  fps
61%
T600:
63.7  fps
ultra 1920x1080
100%
GeForce RTX 3050 6GB Laptop GPU:
61.9  fps
65%
T600:
40.2  fps
QHD 2560x1440
100%
GeForce RTX 3050 6GB Laptop GPU:
40  fps
73%
T600:
29.1  fps
4K 3840x2160
T600:
15.7  fps
F1 2020

F1 2020

2020
low 1280x720
T600:
150.4  fps
Quadro T2000 Max-Q:
182  fps
med. 1920x1080
T600:
73.1  fps
Quadro T2000 Max-Q:
96  fps
high 1920x1080
T600:
55.5  fps
Quadro T2000 Max-Q:
78  fps
ultra 1920x1080
T600:
38.6  fps
Quadro T2000 Max-Q:
55  fps
QHD 2560x1440
T600:
27  fps
4K 3840x2160
T600:
14.5  fps
low 1280x720
Quadro T2000 Max-Q:
263.3  fps
med. 1920x1080
Quadro T2000 Max-Q:
77.5  fps
high 1920x1080
Quadro T2000 Max-Q:
47.6  fps
ultra 1920x1080
Quadro T2000 Max-Q:
35.1  fps
low 1280x720
Quadro T2000 Max-Q:
147.4  fps
med. 1920x1080
Quadro T2000 Max-Q:
85.5  fps
high 1920x1080
Quadro T2000 Max-Q:
58.1  fps
low 1280x720
Quadro T2000 Max-Q:
141.3  fps
med. 1920x1080
Quadro T2000 Max-Q:
50.3  fps
high 1920x1080
Quadro T2000 Max-Q:
44.5  fps
med. 1920x1080
Quadro T2000 Max-Q:
64.2  fps
high 1920x1080
Quadro T2000 Max-Q:
53.1  fps
ultra 1920x1080
Quadro T2000 Max-Q:
47  fps
GRID 2019

GRID 2019

2019
low 1280x720
Quadro T2000 Max-Q:
179  fps
med. 1920x1080
Quadro T2000 Max-Q:
94.7  fps
high 1920x1080
Quadro T2000 Max-Q:
77.7  fps
ultra 1920x1080
Quadro T2000 Max-Q:
51  fps
low 1280x720
T600:
107.6  fps
Quadro T2000 Max-Q:
123.4  fps
med. 1920x1080
T600:
42  fps
Quadro T2000 Max-Q:
56  fps
high 1920x1080
T600:
26.7  fps
Quadro T2000 Max-Q:
35.8  fps
ultra 1920x1080
T600:
19.9  fps
Quadro T2000 Max-Q:
27.3  fps
QHD 2560x1440
T600:
13.4  fps
4K 3840x2160
T600:
5.5  fps
Control

Control

2019
low 1280x720
Quadro T2000 Max-Q:
120.2  fps
med. 1920x1080
Quadro T2000 Max-Q:
40.4  fps
high 1920x1080
Quadro T2000 Max-Q:
28.3  fps
low 1280x720
Quadro T2000 Max-Q:
148.4  fps
med. 1920x1080
Quadro T2000 Max-Q:
60.3  fps
high 1920x1080
Quadro T2000 Max-Q:
36.3  fps
ultra 1920x1080
Quadro T2000 Max-Q:
24.4  fps
Anno 1800

Anno 1800

2019
low 1280x720
Quadro T2000 Max-Q:
27.9  fps
med. 1920x1080
Quadro T2000 Max-Q:
12.9  fps
high 1920x1080
Quadro T2000 Max-Q:
9.8  fps
low 1280x720
Quadro T2000 Max-Q:
271  fps
med. 1920x1080
Quadro T2000 Max-Q:
86.1  fps
high 1920x1080
Quadro T2000 Max-Q:
69.9  fps
ultra 1920x1080
Quadro T2000 Max-Q:
40.3  fps
low 1280x720
Quadro T2000 Max-Q:
83  fps
med. 1920x1080
Quadro T2000 Max-Q:
58  fps
high 1920x1080
Quadro T2000 Max-Q:
55  fps
ultra 1920x1080
Quadro T2000 Max-Q:
50  fps
low 1280x720
T600:
74.6  fps
Quadro T2000 Max-Q:
91.5  fps
med. 1920x1080
T600:
34  fps
Quadro T2000 Max-Q:
41.7  fps
high 1920x1080
T600:
24  fps
Quadro T2000 Max-Q:
31.2  fps
ultra 1920x1080
T600:
19.4  fps
Quadro T2000 Max-Q:
24.6  fps
QHD 2560x1440
T600:
14.8  fps
4K 3840x2160
T600:
8.5  fps
low 1280x720
Quadro T2000 Max-Q:
144  fps
med. 1920x1080
Quadro T2000 Max-Q:
86.4  fps
high 1920x1080
Quadro T2000 Max-Q:
72.7  fps
ultra 1920x1080
Quadro T2000 Max-Q:
64.9  fps
low 1280x720
Quadro T2000 Max-Q:
71  fps
med. 1920x1080
Quadro T2000 Max-Q:
53  fps
high 1920x1080
Quadro T2000 Max-Q:
45  fps
ultra 1920x1080
Quadro T2000 Max-Q:
25  fps
low 1280x720
Quadro T2000 Max-Q:
101  fps
med. 1920x1080
Quadro T2000 Max-Q:
56  fps
high 1920x1080
Quadro T2000 Max-Q:
48  fps
ultra 1920x1080
Quadro T2000 Max-Q:
42  fps
Strange Brigade

Strange Brigade

2018
low 1280x720
100%
GeForce RTX 3050 6GB Laptop GPU:
210 246 256 ~ 237 fps
74%
T600:
174.4  fps
med. 1920x1080
100%
GeForce RTX 3050 6GB Laptop GPU:
96.5 106.9 112.8 ~ 105 fps
62%
T600:
64.9  fps
high 1920x1080
100%
GeForce RTX 3050 6GB Laptop GPU:
80.9 88.4 91.9 ~ 87 fps
59%
T600:
51.4  fps
ultra 1920x1080
100%
GeForce RTX 3050 6GB Laptop GPU:
70.7 77 80.5 ~ 76 fps
59%
T600:
44.8  fps
QHD 2560x1440
100%
GeForce RTX 3050 6GB Laptop GPU:
57.1  fps
56%
T600:
31.9  fps
4K 3840x2160
T600:
17.9  fps
Far Cry 5

Far Cry 5

2018
low 1280x720
100%
GeForce RTX 3050 6GB Laptop GPU:
132 149 ~ 141 fps
67%
T600:
95  fps
med. 1920x1080
100%
GeForce RTX 3050 6GB Laptop GPU:
76 85 89 ~ 83 fps
55%
T600:
46  fps
high 1920x1080
100%
GeForce RTX 3050 6GB Laptop GPU:
70 78 82 ~ 77 fps
55%
T600:
42  fps
ultra 1920x1080
100%
GeForce RTX 3050 6GB Laptop GPU:
65 74 76 ~ 72 fps
54%
T600:
39  fps
QHD 2560x1440
100%
GeForce RTX 3050 6GB Laptop GPU:
52  fps
50%
T600:
26  fps
4K 3840x2160
T600:
12  fps
low 1280x720
100%
GeForce RTX 3050 6GB Laptop GPU:
86.7 96.3 140.6 144.7 ~ 117 fps
114%
T600:
132.8  fps
82%
Quadro T2000 Max-Q:
91.9 101 ~ 96 fps
med. 1920x1080
100%
GeForce RTX 3050 6GB Laptop GPU:
76 89.3 116.2 117 ~ 100 fps
107%
T600:
107  fps
82%
Quadro T2000 Max-Q:
76 87 ~ 82 fps
high 1920x1080
100%
GeForce RTX 3050 6GB Laptop GPU:
61.6 78.6 97.1 97.3 ~ 84 fps
114%
T600:
95.9  fps
82%
Quadro T2000 Max-Q:
64.8 73 ~ 69 fps
4K 3840x2160
T600:
40.8  fps
Quadro T2000 Max-Q:
47.2  fps
low 1280x720
100%
GeForce RTX 3050 6GB Laptop GPU:
111.6 126.5 128.2 128.5 ~ 124 fps
57%
T600:
70.7  fps
73%
Quadro T2000 Max-Q:
91  fps
med. 1920x1080
100%
GeForce RTX 3050 6GB Laptop GPU:
59.9 67.6 70.3 70.9 ~ 67 fps
52%
T600:
34.9  fps
67%
Quadro T2000 Max-Q:
41.7 48.5 ~ 45 fps
high 1920x1080
100%
GeForce RTX 3050 6GB Laptop GPU:
44.2 49.1 51.2 52 ~ 49 fps
51%
T600:
25.1  fps
67%
Quadro T2000 Max-Q:
28.8 36.8 ~ 33 fps
QHD 2560x1440
100%
GeForce RTX 3050 6GB Laptop GPU:
32 37.4 ~ 35 fps
51%
T600:
17.8  fps
73%
Quadro T2000 Max-Q:
25.7  fps
4K 3840x2160
T600:
10  fps
Quadro T2000 Max-Q:
12.3 13.7 ~ 13 fps
low 1280x720
100%
GeForce RTX 3050 6GB Laptop GPU:
117.3 152.8 155.2 181.4 ~ 152 fps
107%
T600:
162.8  fps
98%
Quadro T2000 Max-Q:
145 153 ~ 149 fps
med. 1366x768
100%
GeForce RTX 3050 6GB Laptop GPU:
112.6 131 137.8 161.2 ~ 136 fps
109%
T600:
148.6  fps
100%
Quadro T2000 Max-Q:
132 140 ~ 136 fps
high 1920x1080
100%
GeForce RTX 3050 6GB Laptop GPU:
104.4 112.6 124.2 146.8 ~ 122 fps
99%
T600:
120.7  fps
102%
Quadro T2000 Max-Q:
118 130 ~ 124 fps
ultra 1920x1080
100%
GeForce RTX 3050 6GB Laptop GPU:
98 99.5 116.9 135.1 ~ 112 fps
99%
T600:
110.5  fps
101%
Quadro T2000 Max-Q:
108 118 ~ 113 fps
4K 3840x2160
T600:
39.6  fps
Quadro T2000 Max-Q:
43.4 47.9 ~ 46 fps
low 1024x768
100%
GeForce RTX 3050 6GB Laptop GPU:
187 236 244 ~ 222 fps
63%
T600:
139.1  fps
82%
Quadro T2000 Max-Q:
181  fps
med. 1366x768
100%
GeForce RTX 3050 6GB Laptop GPU:
118 159.1 ~ 139 fps
60%
T600:
82.8  fps
77%
Quadro T2000 Max-Q:
107.6  fps
high 1920x1080
100%
GeForce RTX 3050 6GB Laptop GPU:
71 91.4 96.5 ~ 86 fps
55%
T600:
47.5  fps
73%
Quadro T2000 Max-Q:
62.5  fps
ultra 1920x1080
100%
GeForce RTX 3050 6GB Laptop GPU:
43.7 50.1 52.9 ~ 49 fps
56%
T600:
27.2  fps
67%
Quadro T2000 Max-Q:
32.4 33.4 ~ 33 fps
QHD 2560x1440
100%
GeForce RTX 3050 6GB Laptop GPU:
37  fps
4K 3840x2160
T600:
16.1  fps
GTA V

GTA V

2015
low 1024x768
100%
GeForce RTX 3050 6GB Laptop GPU:
163.4 177.9 178.2 184.2 ~ 176 fps
103%
T600:
181.5  fps
med. 1366x768
100%
GeForce RTX 3050 6GB Laptop GPU:
172 172.6 178.4 ~ 174 fps
101%
T600:
175.6  fps
high 1920x1080
100%
GeForce RTX 3050 6GB Laptop GPU:
95.3 119.5 123.3 127.3 ~ 116 fps
69%
T600:
80.3  fps
ultra 1920x1080
100%
GeForce RTX 3050 6GB Laptop GPU:
53 62.7 63.2 63.8 ~ 61 fps
63%
T600:
38.2  fps
QHD 2560x1440
100%
GeForce RTX 3050 6GB Laptop GPU:
36.5 42.7 ~ 40 fps
67%
T600:
26.6  fps
4K 3840x2160
T600:
25  fps
ultra 1920x1080
Quadro T2000 Max-Q:
79.5  fps

Average Gaming NVIDIA GeForce RTX 3050 6GB Laptop GPU → 100%

Average Gaming 30-70 fps → 100%

Average Gaming NVIDIA T600 → 72%

Average Gaming 30-70 fps → 58%

Average Gaming NVIDIA Quadro T2000 Max-Q → 82%

Average Gaming 30-70 fps → 71%

NVIDIA GeForce RTX 3050 6GB Laptop GPUNVIDIA T600NVIDIA Quadro T2000 Max-Q
lowmed.highultraQHD4Klowmed.highultraQHD4Klowmed.highultraQHD4K
Avatar Frontiers of Pandora39.536.331.523.415.1
Assassin's Creed Mirage7063554131
Cyberpunk 2077 2.2 Phantom Liberty6349413521.3
Baldur's Gate 359.750.345.444.3
F1 23132125922312
Returnal40383429
F1 221441351023219
Tiny Tina's Wonderlands109875845
Cyberpunk 2077 1.680.864.246.438.5
F1 2021218127.4104.861.940171.978.863.740.229.115.7
Strange Brigade237105877657.1174.464.951.444.831.917.9
Far Cry 514183777252954642392612
X-Plane 11.1111710084132.810795.940.896826947.2
Final Fantasy XV Benchmark12467493570.734.925.117.89.9891453325.713
Dota 2 Reborn152136122112162.8148.6120.7110.539.614913612411346
The Witcher 3222139864937139.182.847.527.216.1181107.662.533
GTA V1761741166140181.5175.680.338.226.625
NVIDIA GeForce RTX 3050 6GB Laptop GPUNVIDIA T600NVIDIA Quadro T2000 Max-Q
lowmed.highultraQHD4Klowmed.highultraQHD4Klowmed.highultraQHD4K
< 30 fps
< 60 fps
< 120 fps
≥ 120 fps

3
5
9

4
7
6

8
8
1
3
7
5
4
7


< 30 fps
< 60 fps
< 120 fps
≥ 120 fps


2
6

2
4
2
1
3
3
1
1
4
1
4
1

6
2

< 30 fps
< 60 fps
< 120 fps
≥ 120 fps


2
2

1
2
1

1
2
1

1
1
1


1
2

For more games that might be playable and a list of all games and graphics cards visit our Gaming List

v1.33
log 17. 16:32:15

#0 ran 0s before starting gpusingle class +0s ... 0s

#1 checking url part for id 11576 +0s ... 0s

#2 checking url part for id 11373 +0s ... 0s

#3 checking url part for id 9886 +0s ... 0s

#4 redirected to Ajax server, took 1752762735s time from redirect:0 +0s ... 0s

#5 did not recreate cache, as it is less than 5 days old! Created at Thu, 17 Jul 2025 15:21:38 +0200 +0s ... 0s

#6 composed specs +0.041s ... 0.041s

#7 did output specs +0s ... 0.041s

#8 start showIntegratedCPUs +0s ... 0.041s

#9 getting avg benchmarks for device 11576 +0.028s ... 0.069s

#10 got single benchmarks 11576 +0.012s ... 0.08s

#11 getting avg benchmarks for device 11373 +0.003s ... 0.084s

#12 got single benchmarks 11373 +0.004s ... 0.088s

#13 getting avg benchmarks for device 9886 +0s ... 0.088s

#14 got single benchmarks 9886 +0.005s ... 0.093s

#15 got avg benchmarks for devices +0s ... 0.093s

#16 min, max, avg, median took s +0.049s ... 0.143s

#17 before gaming benchmark output +0s ... 0.143s

#18 Got 327 rows for game benchmarks. +0.024s ... 0.167s

#19 composed SQL query for gamebenchmarks +0s ... 0.167s

#20 got data and put it in $dataArray +0.002s ... 0.169s

#21 benchmarks composed for output. +0.012s ... 0.181s

#22 calculated avg scores. +0s ... 0.181s

#23 return log +0.001s ... 0.181s

Please share our article, every link counts!
Mail Logo
> Expert Reviews and News on Laptops, Smartphones and Tech Innovations > Benchmarks / Tech > Graphics Card Comparison - Head 2 Head
Redaktion, 2017-09- 8 (Update: 2023-07- 1)