Notebookcheck Logo

NVIDIA GeForce Go 7900 GTX vs NVIDIA GeForce Go 7900 GS vs NVIDIA GeForce Go 7900 GS SLI

NVIDIA GeForce Go 7900 GTX

► remove from comparison NVIDIA GeForce Go 7900 GTX

NVidia GeForce Go 7900 GTX is the predecessor of the 7950 GTX and has still a very good DirectX 9 performance. The card enalbes the user to play e.g. Doom3 in 1600x1200 fluently. The card was used in large notebooks (because of heat issues).

The chip also features the PureVideo Technology but has less features as the PureVideo engine in the current 8600M GT chip. > Comparison of PureVideo features

NVIDIA GeForce Go 7900 GS

► remove from comparison NVIDIA GeForce Go 7900 GS

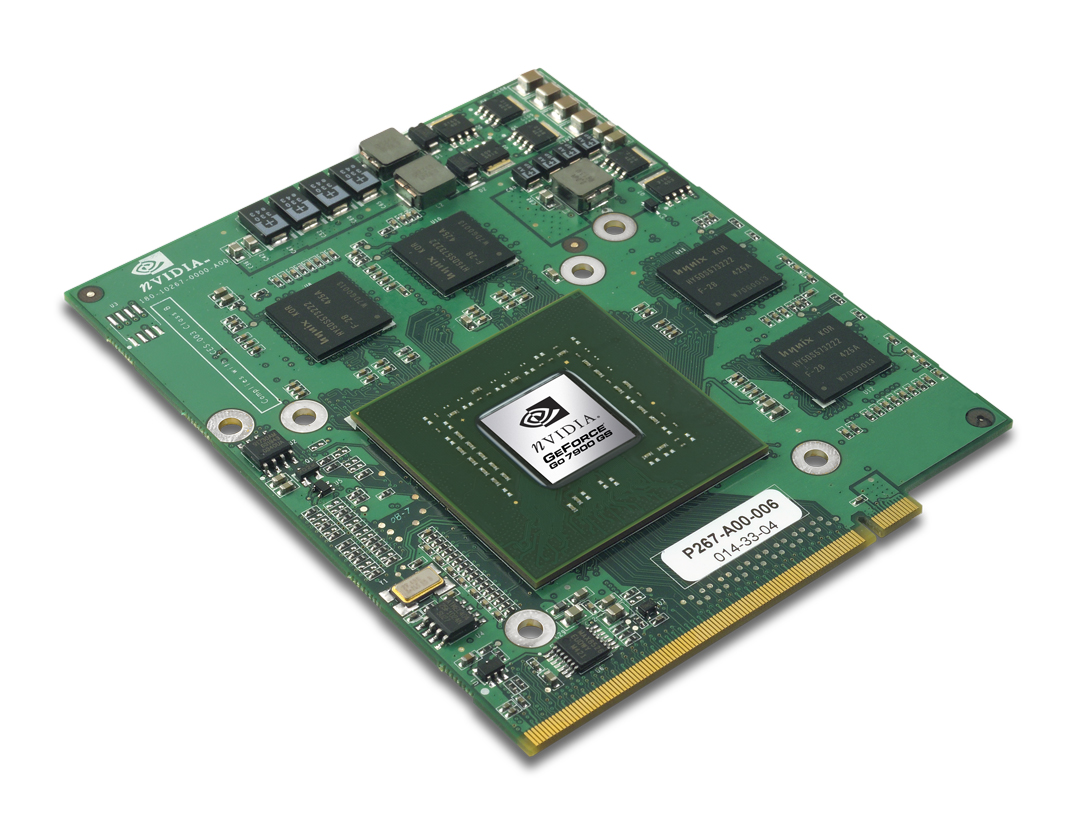
This is the smaller version of the 7900 GTX with less shader- and vertex-pipelines and less current consumption. Nevertheless it is not apt for small notebooks.

The performance is near to the 7800 GTX, but needs clearly less energy. It is used for 17" notebooks, because a lot of heat arises.

The chip also features the PureVideo Technology but has less features as the PureVideo engine in the current 8600M GT chip. > Comparison of PureVideo features

Compared to the Desktop GeForce 7900 GS graphics card the mobile version has a smaller core and memory speed (375 versus 450 MHz chip, 500 versus 660 MHz memory speed) and is therefore a bit slower.

NVIDIA GeForce Go 7900 GS SLI

► remove from comparison NVIDIA GeForce Go 7900 GS SLI

Two NVIDIA GeForce Go 7900 GS graphics cards are bounded by SLI. This shows only in SLI supported games a clear performance advantage and makes it partially faster than a GTX version. The smaller version of the 7900 GTX with less shader- and vertex-pipelines and according data sheet less current consumption. It is only useful for big laptops, because of the high current consumption of each graphic card.

Current games like Far Cry, Splinter Cell - Chaos Theory, Oblivion, Call of Duty 2 or Half Life 2 - Lost Coast can be played with high details and resolutions without any problem. Antialiasing and anisotrope filter can be set in all games except Oblivion (with >30fps).

List of SLI supported games: SLIZone.com

The chip also features the PureVideo Technology but has less features as the PureVideo engine in the current 8600M GT chip. > Comparison of PureVideo features

NVIDIA GeForce Go 7900 GTXNVIDIA GeForce Go 7900 GSNVIDIA GeForce Go 7900 GS SLI
GeForce Go 7900 Series
GeForce Go 7950 GTX SLI 48/16 cores @ 0.58 GHz256 Bit @ 700 MHz
GeForce Go 7900 GTX SLI 48/16 cores @ 0.5 GHz256 Bit @ 600 MHz
GeForce Go 7950 GTX 24/8 cores @ 0.58 GHz256 Bit @ 700 MHz
GeForce Go 7900 GS SLI 40/14 cores @ 0.38 GHz256 Bit @ 500 MHz
GeForce Go 7900 GTX 24/8 cores @ 0.5 GHz256 Bit @ 600 MHz
GeForce Go 7900 GS 20/7 cores @ 0.38 GHz256 Bit @ 500 MHz
CodenameG71MG71MG71M
ArchitectureG7xG7xG7x
Pipelines24 / 8 Pixel- / Vertexshader20 / 7 Pixel- / Vertexshader40 / 14 Pixel- / Vertexshader
Core Speed500 MHz375 MHz375 MHz
Memory Speed600 MHz500 MHz500 MHz
Memory Bus Width256 Bit256 Bit256 Bit
Memory TypeGDDR3GDDR3GDDR3
Max. Amount of Memory512 MB512 MB1024 MB
Shared Memorynonono
APIDirectX 9c, Shader 3.0DirectX 9c, Shader 3.0DirectX 9c, Shader 3.0
Power Consumption45 Watt20 Watt40 Watt
Transistors278 Million278 Million556 Million
technology90 nm90 nm90 nm
Features90nm90nm90nm
Notebook Sizelargelargelarge
Date of Announcement18.04.2006 18.04.2006 01.06.2006
Information90nm, 278 Mio Transistoren, MXM-Modul90nm, 278 Mio Transistoren, MXM-ModulSLI = 2 Grafikkarten im Verbund, 90nm, 2.278 Mio Transistoren, MXM-Modul
Link to Manufacturer Pagewww.nvidia.dewww.nvidia.dewww.nvidia.de

Benchmarks

3DMark 2001SE - 3DMark 2001 - Standard
min: 25000     avg: 29490     median: 29490 (31%)     max: 33980 Points
min: 22934     avg: 24505     median: 23613.5 (25%)     max: 27860 Points
min: 24400     avg: 24456     median: 24456 (25%)     max: 24512 Points
3DMark 03 - 3DMark 03 - Standard
min: 18200     avg: 18878     median: 18877.5 (10%)     max: 19555 Points
min: 13472     avg: 14103     median: 13907 (7%)     max: 15126 Points
min: 22000     avg: 22068     median: 22068 (12%)     max: 22136 Points
3DMark 05 - 3DMark 05 - Standard
min: 7909     avg: 8436     median: 8504.5 (9%)     max: 8824 Points
min: 4857     avg: 5937     median: 6159 (7%)     max: 6337 Points
min: 9991     avg: 9996     median: 9995.5 (11%)     max: 10000 Points
3DMark 06 3DMark 06 - Score Unknown Settings + NVIDIA GeForce Go 7900 GTX
3DMark 06
min: 4700     avg: 4766     median: 4755.5 (6%)     max: 4852 Points
3DMark 06 - Score Unknown Settings + NVIDIA GeForce Go 7900 GS
min: 3762     avg: 3895     median: 3800 (5%)     max: 4123 Points
3DMark 06 - Score Unknown Settings + NVIDIA GeForce Go 7900 GS SLI
5000 Points (7%)
3DMark 06 - Standard 1280x1024 + NVIDIA GeForce Go 7900 GTX
3DMark 06
min: 4320     avg: 4503     median: 4503 (6%)     max: 4686 Points
3DMark 06 - Standard 1280x1024 + NVIDIA GeForce Go 7900 GS
min: 3510     avg: 3519     median: 3519 (5%)     max: 3528 Points
3DMark 06 - Standard 1280x1024 + NVIDIA GeForce Go 7900 GS SLI
5076 Points (7%)

Average Benchmarks NVIDIA GeForce Go 7900 GTX → 100% n=5

Average Benchmarks NVIDIA GeForce Go 7900 GS → 77% n=5

Average Benchmarks NVIDIA GeForce Go 7900 GS SLI → 107% n=5

- Range of benchmark values for this graphics card
- Average benchmark values for this graphics card
* Smaller numbers mean a higher performance
1 This benchmark is not used for the average calculation

Game Benchmarks

The following benchmarks stem from our benchmarks of review laptops. The performance depends on the used graphics memory, clock rate, processor, system settings, drivers, and operating systems. So the results don't have to be representative for all laptops with this GPU. For detailed information on the benchmark results, click on the fps number.

Anno 1404

Anno 1404

2009
low 1024x768
100%
GeForce Go 7900 GTX:
80  fps
ultra 1280x1024
100%
GeForce Go 7900 GTX:
10  fps
F.E.A.R. 2

F.E.A.R. 2

2009
low 800x600
100%
GeForce Go 7900 GTX:
108  fps
med. 1024x768
100%
GeForce Go 7900 GTX:
67  fps
high 1280x1024
100%
GeForce Go 7900 GTX:
27  fps
Left 4 Dead

Left 4 Dead

2008
high 1024x768
100%
GeForce Go 7900 GTX:
51  fps
Call of Duty 4 - Modern Warfare

Call of Duty 4 - Modern Warfare

2007
med. 1024x768
100%
GeForce Go 7900 GTX:
38  fps
high 1280x1024
100%
GeForce Go 7900 GTX:
27  fps
Supreme Commander - FA Bench

Supreme Commander - FA Bench

2007
low 1024x768
100%
GeForce Go 7900 GTX:
57.7  fps
med. 1024x768
100%
GeForce Go 7900 GTX:
38.7  fps
high 1024x768
100%
GeForce Go 7900 GTX:
29.6  fps
Crysis - GPU Benchmark

Crysis - GPU Benchmark

2007
low 1024x768
100%
GeForce Go 7900 GTX:
51.5  fps
med. 1024x768
100%
GeForce Go 7900 GTX:
17.2  fps
Half Life 2 - Lost Coast Benchmark

Half Life 2 - Lost Coast Benchmark

2005
high 1024x768
100%
GeForce Go 7900 GTX:
175.5  fps
F.E.A.R.

F.E.A.R.

2005
low 640x480
100%
GeForce Go 7900 GTX:
59  fps
476%
GeForce Go 7900 GS:
246 315 ~ 281 fps
349%
GeForce Go 7900 GS SLI:
206  fps
med. 800x600
100%
GeForce Go 7900 GTX:
55  fps
240%
GeForce Go 7900 GS:
130 133 ~ 132 fps
215%
GeForce Go 7900 GS SLI:
118  fps
high 1024x768
100%
GeForce Go 7900 GTX:
6  fps
917%
GeForce Go 7900 GS:
55 55 ~ 55 fps
1167%
GeForce Go 7900 GS SLI:
70  fps
Quake 4

Quake 4

2005
low 640x480
GeForce Go 7900 GS:
127.7  fps
med. 800x600
GeForce Go 7900 GS:
127.9  fps
high 1024x768
GeForce Go 7900 GS:
126.5  fps
ultra 1024x768
GeForce Go 7900 GS:
117.5  fps
Counter-Strike Source

Counter-Strike Source

2004
high 1024x768
100%
GeForce Go 7900 GTX:
205  fps
Doom 3

Doom 3

2004
low 640x480
100%
GeForce Go 7900 GTX:
139.9  fps
115%
GeForce Go 7900 GS:
161.1  fps
68%
GeForce Go 7900 GS SLI:
95.5  fps
med. 640x480
100%
GeForce Go 7900 GTX:
135  fps
120%
GeForce Go 7900 GS:
162.2  fps
70%
GeForce Go 7900 GS SLI:
94.9  fps
high 800x600
100%
GeForce Go 7900 GTX:
139.7  fps
111%
GeForce Go 7900 GS:
155  fps
67%
GeForce Go 7900 GS SLI:
94  fps
ultra 1024x768
100%
GeForce Go 7900 GTX:
133.7  fps
87%
GeForce Go 7900 GS:
116.4  fps
71%
GeForce Go 7900 GS SLI:
94.6  fps
Quake 3 Arena - Timedemo

Quake 3 Arena - Timedemo

1999
high 1024x768
100%
GeForce Go 7900 GTX:
326.8  fps
168%
GeForce Go 7900 GS:
550  fps
90%
GeForce Go 7900 GS SLI:
293  fps

Average Gaming NVIDIA GeForce Go 7900 GTX → 100%

Average Gaming 30-70 fps → 100%

Average Gaming NVIDIA GeForce Go 7900 GS → 279%

Average Gaming 30-70 fps → 917%

Average Gaming NVIDIA GeForce Go 7900 GS SLI → 262%

NVIDIA GeForce Go 7900 GTXlowmed.highultraQHD4K
Anno 14048010
F.E.A.R. 21086727
Left 4 Dead51
Call of Duty 4 - Modern Warfare3827
Supreme Commander - FA Bench57.738.729.6
Crysis - GPU Benchmark51.517.2
Half Life 2 - Lost Coast Benchmark175.5
F.E.A.R.59556
Counter-Strike Source205
Doom 3139.9135139.7133.7
Quake 3 Arena - Timedemo326.8
< 30 fps
< 60 fps
< 120 fps
≥ 120 fps

3
2
1
1
3
1
1
4
1

4
1


1


NVIDIA GeForce Go 7900 GSlowmed.highultraQHD4K
F.E.A.R.28113255
Quake 4127.7127.9126.5117.5
Doom 3161.1162.2155116.4
Quake 3 Arena - Timedemo550
< 30 fps
< 60 fps
< 120 fps
≥ 120 fps


3


3

1

3


2


NVIDIA GeForce Go 7900 GS SLIlowmed.highultraQHD4K
F.E.A.R.20611870
Doom 395.594.99494.6
Quake 3 Arena - Timedemo293
< 30 fps
< 60 fps
< 120 fps
≥ 120 fps


1
1


2


2
1


1


For more games that might be playable and a list of all games and graphics cards visit our Gaming List

v1.26
log 20. 05:25:35

#0 checking url part for id 4 +0s ... 0s

#1 checking url part for id 8 +0s ... 0s

#2 checking url part for id 2 +0s ... 0s

#3 not redirecting to Ajax server +0s ... 0s

#4 did not recreate cache, as it is less than 5 days old! Created at Fri, 19 Apr 2024 05:40:26 +0200 +0.001s ... 0.001s

#5 composed specs +0.298s ... 0.299s

#6 did output specs +0s ... 0.299s

#7 start showIntegratedCPUs +0s ... 0.299s

#8 getting avg benchmarks for device 4 +0.052s ... 0.351s

#9 got single benchmarks 4 +0.018s ... 0.368s

#10 getting avg benchmarks for device 8 +0.002s ... 0.37s

#11 got single benchmarks 8 +0.022s ... 0.392s

#12 getting avg benchmarks for device 2 +0.002s ... 0.394s

#13 got single benchmarks 2 +0.025s ... 0.419s

#14 got avg benchmarks for devices +0s ... 0.419s

#15 min, max, avg, median took s +0.418s ... 0.837s

#16 before gaming benchmark output +0s ... 0.837s

#17 Got 46 rows for game benchmarks. +0.004s ... 0.841s

#18 composed SQL query for gamebenchmarks +0s ... 0.841s

#19 got data and put it in $dataArray +0.006s ... 0.848s

#20 benchmarks composed for output. +0.032s ... 0.88s

#21 calculated avg scores. +0s ... 0.88s

#22 return log +0.002s ... 0.882s

Please share our article, every link counts!
> Expert Reviews and News on Laptops, Smartphones and Tech Innovations > Benchmarks / Tech > Graphics Card Comparison - Head 2 Head
Redaktion, 2017-09- 8 (Update: 2023-07- 1)