NVIDIA GeForce GTX 660 Ti vs NVIDIA GeForce GTX 680
NVIDIA GeForce GTX 660 Ti ► remove from comparison
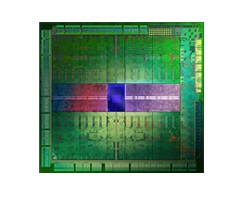
The NVIDIA GeForce GTX 660 Ti is a high-end desktop graphics card based on the GK104 Kepler chip. It supports DirectX 11 and is manufactured in 28nm at TSMC. The core clock can be up to 980 MHz under load (GeForce Boost) and is a tleast 915 MHz. The GDDR5 VRAM is usually clocked at 1500 MHz (6000 MHz effective data rate).
Due to the higher core clock speed, the performance of the desktop GTX 660Ti is above the mobile GTX 680M (altough the 680M offers a wider memory bus of 256 Bit). Demanding games of 2013 should run in 1920x1080 with maximum settings and 4x Antialiasing fluently. Only Company of Heroes 2 and Hitman: Absolution scored below 30fps in our benchmarks on the average.
The chip offers the 5th generation video processor VP5, which is able to decode MPEG-1, 2, 4, H.264, VC1/WMV9 with a resolution of up to 4K. Furthermore, the included vidoe encoder called NVENC is able to encode H.264 vidoes without stressing the CPU.
The Geforce GTX 660Ti is rated at 150 Watt TDP and the default design uses two 6-pin power connectors.
Beware: For our benchmarks we used a slightly overclocked version that ran with 980-1059 MHz compared to the default 915 - 980 MHz.
NVIDIA GeForce GTX 680 ► remove from comparison
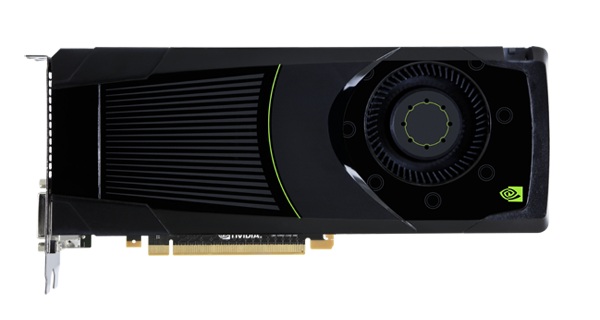
The Nvidia GeForce GTX 680 is a DirectX 11 high-end desktop graphics card. It is based on the GK104 chip and manufactured in 28 nm at TSMC. The core clock can be boosted up to 1058 MHz (from 1006 base clock) and the memory is clocked at 3004 MHz (GDDR5). The similar named mobile GeForce GTX 680M is also based on the GK104 chip, but offers only 1344 shader as the desktop GTX 670 and a low clock rate of 720 MHz.
Depending on game and settings, the performance of the GTX 680 is similar to a Radeon R9 280X . Therefore, even the fastest mobile GPUs like the GeForce GTX 780M are outperformed by more than 30 percent. Demanding games like Metro: Last Light can be played fluently in 1080p and maximum detail settings. In some cases, even higher resolutions or additional AA/AF are possible.
The power consumption of the GTX 680 desktop card is rated at 195 Watt TDP and therefore two 6-pin power connectors are needed to power the card.
NVIDIA GeForce GTX 660 Ti NVIDIA GeForce GTX 680 GeForce GTX 600 Series GeForce GTX 680 1536 @ 1.01 - 1.06 GHz 256 Bit @ 6000 MHz GeForce GTX 660 Ti 1344 @ 0.92 - 0.98 GHz 192 Bit @ 6000 MHz
GeForce GTX 680 1536 @ 1.01 - 1.06 GHz 256 Bit @ 6000 MHz GeForce GTX 660 Ti 1344 @ 0.92 - 0.98 GHz 192 Bit @ 6000 MHz
Codename GK104 GK104 Architecture Kepler Kepler Pipelines 1344 - unified 1536 - unified Core Speed 915 - 980 (Boost) MHz 1006 - 1058 (Boost) MHz Memory Speed 6000 MHz 6000 MHz Memory Bus Width 192 Bit 256 Bit Memory Type GDDR5 GDDR5 Max. Amount of Memory 3 GB 2048 MB Shared Memory no no API DirectX 11, Shader 5.1 DirectX 11, Shader 5.1, OpenGL 4.2 Power Consumption 150 Watt 195 Watt Transistors 3.5 Billion 3.5 Billion technology 28 nm 28 nm Features SLI, PhysX, CUDA, 3D Vision , GPU Boost SLI, PhysX, CUDA, 3D Vision, GPU Boost Date of Announcement 16.08.2012 22.03.2012 Link to Manufacturer Page www.nvidia.de www.geforce.com
Benchmarks Performance Rating - 3DMark 11 + Fire Strike + Time Spy - GeForce GTX 660 Ti
2.5 pt (7%)
...
NVIDIA GeForce GTX 660 Ti
...
Performance Rating - 3DMark 11 + Fire Strike + Time Spy - GeForce GTX 680
3.5 pt (10%)
...
...
3DMark - 3DMark Time Spy Score
2332 Points (7%)
Model CPU GPU RAM Value Desktop PC GeForce GTX 680 1069 / 3104 MHz 2 GB 64 GB 2332
3DMark - 3DMark Time Spy Graphics
2068 Points (5%)
Model CPU GPU RAM Value Desktop PC GeForce GTX 680 1069 / 3104 MHz 2 GB 64 GB 2068
3DMark - 3DMark Ice Storm Unlimited Graphics
min: 215624 avg: 247307 median: 247306 (28%) max: 278989 Points
3DMark - 3DMark Ice Storm Extreme Graphics
min: 177730 avg: 202749 median: 202749 (26%) max: 227768 Points
3DMark - 3DMark Cloud Gate Score
13673 Points (15%)
Model CPU GPU RAM Value Desktop-PC (GTX 660 Ti) 2400 GeForce GTX 660 Ti 1059 / 3004 MHz 3 GB 8 GB 13673
min: 19275 avg: 23150 median: 23150 (25%) max: 27025 Points
3DMark - 3DMark Cloud Gate Graphics
37758 Points (10%)
Model CPU GPU RAM Value Desktop-PC (GTX 660 Ti) 2400 GeForce GTX 660 Ti 1059 / 3004 MHz 3 GB 8 GB 37758
min: 46869 avg: 47130 median: 47130 (12%) max: 47391 Points
3DMark - 3DMark Fire Strike Standard Score
4734 Points (8%)
Model CPU GPU RAM Value Desktop-PC (GTX 660 Ti) 2400 GeForce GTX 660 Ti 1059 / 3004 MHz 3 GB 8 GB 4734
min: 6119 avg: 6861 median: 6861 (12%) max: 7603 Points
3DMark - 3DMark Fire Strike Standard Graphics
5432 Points (6%)
Model CPU GPU RAM Value Desktop-PC (GTX 660 Ti) 2400 GeForce GTX 660 Ti 1059 / 3004 MHz 3 GB 8 GB 5432
min: 6904 avg: 7587 median: 7587 (9%) max: 8270 Points
3DMark - 3DMark Ice Storm Graphics
227651 Points (27%)
Model CPU GPU RAM Value Desktop-PC (GTX 660 Ti) 2400 GeForce GTX 660 Ti 1059 / 3004 MHz 3 GB 8 GB 227651
min: 190182 avg: 235508 median: 235508 (28%) max: 280833 Points
3DMark 11 - 3DM11 Performance Score
7693 Points (11%)
Model CPU GPU RAM Value Desktop-PC (GTX 660 Ti) 2400 GeForce GTX 660 Ti 1059 / 3004 MHz 3 GB 8 GB 7693
min: 9255 avg: 10000 median: 10000 (14%) max: 10745 Points
3DMark 11 - 3DM11 Performance GPU
8415 Points (7%)
Model CPU GPU RAM Value Desktop-PC (GTX 660 Ti) 2400 GeForce GTX 660 Ti 1059 / 3004 MHz 3 GB 8 GB 8415
min: 9861 avg: 10217 median: 10216.5 (9%) max: 10572 Points
3DMark Vantage + NVIDIA GeForce GTX 660 Ti 3DMark Vantage - 3DM Vant. Perf. total
23726 Points (7%)
Model CPU GPU RAM Value Desktop-PC (GTX 660 Ti) 2400 GeForce GTX 660 Ti 1059 / 3004 MHz 3 GB 8 GB 23726
3DM Vant. Perf. total + NVIDIA GeForce GTX 680
29702 Points (9%)
3DM Vant. Perf. GPU no PhysX + NVIDIA GeForce GTX 660 Ti 3DMark Vantage - 3DM Vant. Perf. GPU no PhysX
27687 Points (16%)
Model CPU GPU RAM Value Desktop-PC (GTX 660 Ti) 2400 GeForce GTX 660 Ti 1059 / 3004 MHz 3 GB 8 GB 27687
3DM Vant. Perf. GPU no PhysX + NVIDIA GeForce GTX 680
33025 Points (19%)
3DMark 2001SE - 3DMark 2001 - Standard
52955 Points (55%)
3DMark 03 - 3DMark 03 - Standard
87436 Points (46%)
Model CPU GPU RAM Value Desktop-PC (GTX 660 Ti) 2400 GeForce GTX 660 Ti 1059 / 3004 MHz 3 GB 8 GB 87436
min: 84572 avg: 91644 median: 91644 (48%) max: 98716 Points
3DMark 05 - 3DMark 05 - Standard
28651 Points (31%)
Model CPU GPU RAM Value Desktop-PC (GTX 660 Ti) 2400 GeForce GTX 660 Ti 1059 / 3004 MHz 3 GB 8 GB 28651
min: 24071 avg: 27536 median: 27536 (30%) max: 31001 Points
3DMark 06 3DMark 06 - Standard 1280x1024 + NVIDIA GeForce GTX 660 Ti
22997 Points (30%)
Model CPU GPU RAM Value 3DMark 06 - Standard 1280x1024 Desktop-PC (GTX 660 Ti) (3DMark 06 - Standard 1280x1024) 2400 GeForce GTX 660 Ti 1059 / 3004 MHz 3 GB 8 GB 22997
3DMark 06 - Standard 1280x1024 + NVIDIA GeForce GTX 680
min: 21143 avg: 24731 median: 24660 (32%) max: 28391 Points
Model CPU GPU RAM Value 3DMark 06 - Standard 1280x1024 Desktop PC (3DMark 06 - Standard 1280x1024) GeForce GTX 680 1069 / 3104 MHz 2 GB 64 GB 21143 Desktop GTX 680 (3DMark 06 - Standard 1280x1024) 2600K GeForce GTX 680 1059 / 1502 MHz 2 GB 8 GB 24660 (3DMark 06 - Standard 1280x1024) 4770K GeForce GTX 680 8 GB 28391
Unigine Valley 1.0 - Unigine Valley 1.0 DX
45.1 fps (15%)
Model CPU GPU RAM Value Desktop PC GeForce GTX 680 1069 / 3104 MHz 2 GB 64 GB 45.1
Unigine Heaven 3.0 - Unigine Heaven 3.0 DX 11
78.7 fps (26%)
Model CPU GPU RAM Value Desktop-PC (GTX 660 Ti) 2400 GeForce GTX 660 Ti 1059 / 3004 MHz 3 GB 8 GB 78.7
Unigine Heaven 2.1 - Heaven 2.1 high
102.1 fps (19%)
Model CPU GPU RAM Value Desktop-PC (GTX 660 Ti) 2400 GeForce GTX 660 Ti 1059 / 3004 MHz 3 GB 8 GB 102.1
139.4 fps (26%)
Windows 7 Experience Index - Win7 Gaming graphics
7.9 Points (100%)
Model CPU GPU RAM Value Desktop-PC (GTX 660 Ti) 2400 GeForce GTX 660 Ti 1059 / 3004 MHz 3 GB 8 GB 7.9
Windows 7 Experience Index - Win7 Graphics
7.9 Points (100%)
Model CPU GPU RAM Value Desktop-PC (GTX 660 Ti) 2400 GeForce GTX 660 Ti 1059 / 3004 MHz 3 GB 8 GB 7.9
Cinebench R15 + NVIDIA GeForce GTX 680 Cinebench R15 - Cinebench R15 OpenGL 64 Bit
78.2 fps (5%)
Cinebench R15 OpenGL Ref. Match 64 Bit + NVIDIA GeForce GTX 680 Cinebench R15 - Cinebench R15 OpenGL Ref. Match 64 Bit
99.6 % (100%)
GFXBench (DX / GLBenchmark) 2.7 + NVIDIA GeForce GTX 680 GFXBench (DX / GLBenchmark) 2.7 - GFXBench T-Rex HD Offscreen C24Z16
652 fps (5%)
LuxMark v2.0 64Bit - LuxMark v2.0 Room GPU
284 Samples/s (1%)
LuxMark v2.0 64Bit - LuxMark v2.0 Sala GPU
626 Samples/s (1%)
ComputeMark v2.1 - ComputeMark v2.1 Result
5790 Points (6%)
Average Benchmarks NVIDIA GeForce GTX 660 Ti → 100% n=13 Average Benchmarks NVIDIA GeForce GTX 680 → 125% n=13
- Range of benchmark values for this graphics card
- Average benchmark values for this graphics card
* Smaller numbers mean a higher performance
1 This benchmark is not used for the average calculation
Game Benchmarks The following benchmarks stem from our benchmarks of review laptops. The performance depends on the used graphics memory, clock rate, processor, system settings, drivers, and operating systems. So the results don't have to be representative for all laptops with this GPU. For detailed information on the benchmark results, click on the fps number.
GeForce GTX 680:
72.5 [X] Desktop PC GeForce GTX 680
min:
49.3 fps, max:
97.6 fps
fps
GeForce GTX 680:
51.2 [X] Desktop PC GeForce GTX 680
min:
38.3 fps, max:
67.6 fps
fps
GeForce GTX 680:
30.3 [X] Desktop PC GeForce GTX 680
min:
24.2 fps, max:
37.9 fps
fps
GeForce GTX 680:
8.9 [X] Desktop PC GeForce GTX 680
min:
4.5 fps, max:
25.8 fps
fps
GeForce GTX 680:
8.5 [X] Desktop PC GeForce GTX 680
min:
3.9 fps, max:
11.1 fps
fps
GeForce GTX 680:
88.7 [X] Desktop PC GeForce GTX 680
min:
58 fps, max:
109 fps
fps
GeForce GTX 680:
89.8 [X] Desktop PC GeForce GTX 680
min:
51 fps, max:
110 fps
fps
GeForce GTX 680:
47 [X] Desktop PC GeForce GTX 680
min:
26 fps, max:
58 fps
fps
GeForce GTX 680:
19.7 [X] Desktop PC GeForce GTX 680
min:
6 fps, max:
27 fps
fps
GeForce GTX 680:
18.2 [X] Desktop PC GeForce GTX 680
max:
25 fps
fps
GeForce GTX 680:
156.5 [X] Desktop PC GeForce GTX 680
min:
138 fps, max:
179 fps
fps
GeForce GTX 680:
102.9 [X] Desktop PC GeForce GTX 680
min:
94 fps, max:
121 fps
fps
GeForce GTX 680:
47.2 [X] Desktop PC GeForce GTX 680
min:
43 fps, max:
53 fps
fps
GeForce GTX 680:
38.6 [X] Desktop PC GeForce GTX 680
min:
31 fps, max:
50 fps
fps
GeForce GTX 680:
7.1 [X] Desktop PC GeForce GTX 680
min:
5 fps, max:
10 fps
fps
GeForce GTX 680:
299.6 [X] Desktop PC GeForce GTX 680
min:
290 fps, max:
302 fps
fps
GeForce GTX 680:
262.2 [X] Desktop PC GeForce GTX 680
min:
199 fps, max:
302 fps
fps
GeForce GTX 680:
125.4 [X] Desktop PC GeForce GTX 680
min:
99 fps, max:
148 fps
fps
GeForce GTX 680:
77.3 [X] Desktop PC GeForce GTX 680
min:
58 fps, max:
84 fps
fps
GeForce GTX 680:
40 [X] Desktop PC GeForce GTX 680
min:
33 fps, max:
47 fps
fps
GeForce GTX 680:
113.5 [X] Desktop PC GeForce GTX 680
min:
85 fps, max:
169 fps
fps
GeForce GTX 680:
82.2 [X] Desktop PC GeForce GTX 680
min:
58 fps, max:
122 fps
fps
GeForce GTX 680:
46.3 [X] Desktop PC GeForce GTX 680
min:
33 fps, max:
63 fps
fps
GeForce GTX 680:
44.2 [X] Desktop PC GeForce GTX 680
min:
31 fps, max:
62 fps
fps
GeForce GTX 680:
11.8 [X] Desktop PC GeForce GTX 680
min:
4 fps, max:
22 fps
fps
GeForce GTX 680:
75.1 [X] Desktop PC GeForce GTX 680
min:
51 fps, max:
102 fps
fps
GeForce GTX 680:
144.6 [X] Desktop PC GeForce GTX 680
fps
GeForce GTX 680:
91.8 [X] Desktop PC GeForce GTX 680
fps
GeForce GTX 680:
46.3 [X] Desktop PC GeForce GTX 680
fps
GeForce GTX 680:
34.9 [X] Desktop PC GeForce GTX 680
fps
GeForce GTX 680:
16.9 [X] Desktop PC GeForce GTX 680
fps
GeForce GTX 680:
103 [X] Desktop PC GeForce GTX 680
min:
74 fps, max:
122 fps
fps
GeForce GTX 680:
67 [X] Desktop PC GeForce GTX 680
min:
58 fps, max:
75 fps
fps
GeForce GTX 680:
59 [X] Desktop PC GeForce GTX 680
min:
51 fps, max:
66 fps
fps
GeForce GTX 680:
42 [X] Desktop PC GeForce GTX 680
min:
32 fps, max:
52 fps
fps
GeForce GTX 680:
17 [X] Desktop PC GeForce GTX 680
min:
12 fps, max:
20 fps
fps
GeForce GTX 680:
88.5 [X] Desktop PC GeForce GTX 680
min:
76 fps, max:
109 fps
fps
GeForce GTX 680:
47.8 [X] Desktop PC GeForce GTX 680
min:
41 fps, max:
55 fps
fps
GeForce GTX 680:
36.5 [X] Desktop PC GeForce GTX 680
min:
32 fps, max:
41 fps
fps
GeForce GTX 680:
16.4 [X] Desktop PC GeForce GTX 680
min:
12 fps, max:
19 fps
fps
GeForce GTX 680:
9.7 [X] Desktop PC GeForce GTX 680
min:
8 fps, max:
12 fps
fps
GeForce GTX 680:
110.9 [X] Desktop PC GeForce GTX 680
min:
105 fps, max:
124 fps
fps
GeForce GTX 680:
68.9 [X] Desktop PC GeForce GTX 680
min:
65 fps, max:
76 fps
fps
GeForce GTX 680:
46.4 [X] Desktop PC GeForce GTX 680
min:
45 fps, max:
52 fps
fps
GeForce GTX 680:
40.6 [X] Desktop PC GeForce GTX 680
min:
38 fps, max:
45 fps
fps
GeForce GTX 680:
17.2 [X] Desktop PC GeForce GTX 680
min:
14 fps, max:
21 fps
fps
GeForce GTX 680:
271.6 [X] Desktop PC GeForce GTX 680
min:
37 fps, max:
474.5 fps
fps
GeForce GTX 680:
180.6 [X] Desktop PC GeForce GTX 680
min:
25.1 fps, max:
289.7 fps
fps
GeForce GTX 680:
102.9 [X] Desktop PC GeForce GTX 680
min:
64.8 fps, max:
185.5 fps
fps
GeForce GTX 680:
67.4 [X] Desktop PC GeForce GTX 680
min:
27.8 fps, max:
105.4 fps
fps
GeForce GTX 680:
25 [X] Desktop PC GeForce GTX 680
min:
11.9 fps, max:
34.4 fps
fps
GeForce GTX 680:
111 [X] Desktop PC GeForce GTX 680
min:
79 fps, max:
133 fps
fps
GeForce GTX 680:
91.9 [X] Desktop PC GeForce GTX 680
min:
74 fps, max:
110 fps
fps
GeForce GTX 680:
63.5 [X] Desktop PC GeForce GTX 680
min:
42 fps, max:
92 fps
fps
GeForce GTX 680:
49 [X] Desktop PC GeForce GTX 680
min:
34 fps, max:
56 fps
fps
GeForce GTX 680:
15.9 [X] Desktop PC GeForce GTX 680
min:
11 fps, max:
20 fps
fps
GeForce GTX 680:
164 [X] Desktop PC GeForce GTX 680
min:
146 fps, max:
181 fps
fps
GeForce GTX 680:
143.9 [X] Desktop PC GeForce GTX 680
min:
117 fps, max:
169 fps
fps
GeForce GTX 680:
71.3 [X] Desktop PC GeForce GTX 680
min:
60 fps, max:
84 fps
fps
GeForce GTX 680:
61.4 [X] Desktop PC GeForce GTX 680
min:
47 fps, max:
72 fps
fps
GeForce GTX 680:
21.9 [X] Desktop PC GeForce GTX 680
min:
17 fps, max:
27 fps
fps
GeForce GTX 680:
93.4 [X] Desktop PC GeForce GTX 680
min:
80 fps, max:
115 fps
fps
GeForce GTX 680:
79.6 [X] Desktop PC GeForce GTX 680
min:
70 fps, max:
92 fps
fps
GeForce GTX 680:
45.9 [X] Desktop PC GeForce GTX 680
min:
37 fps, max:
60 fps
fps
GeForce GTX 680:
5.6 [X] Desktop PC GeForce GTX 680
min:
4 fps, max:
8 fps
fps
GeForce GTX 680:
14.1 [X] Desktop PC GeForce GTX 680
min:
11 fps, max:
17 fps
fps
GeForce GTX 680:
102.5 [X] Desktop PC GeForce GTX 680
min:
87 fps, max:
119 fps
fps
GeForce GTX 680:
58.2 [X] Desktop PC GeForce GTX 680
min:
48 fps, max:
71 fps
fps
GeForce GTX 680:
53 [X] Desktop PC GeForce GTX 680
min:
48 fps, max:
70 fps
fps
GeForce GTX 680:
47.2 [X] Desktop PC GeForce GTX 680
min:
37 fps, max:
64 fps
fps
GeForce GTX 680:
19.8 [X] Desktop PC GeForce GTX 680
min:
14 fps, max:
25 fps
fps
GeForce GTX 680:
113.8 [X] Desktop PC GeForce GTX 680
min:
107 fps, max:
122 fps
fps
GeForce GTX 680:
101.6 [X] Desktop PC GeForce GTX 680
min:
94 fps, max:
112 fps
fps
GeForce GTX 680:
56.3 [X] Desktop PC GeForce GTX 680
min:
53 fps, max:
60 fps
fps
GeForce GTX 680:
13.8 [X] Desktop PC GeForce GTX 680
min:
12 fps, max:
15 fps
fps
GeForce GTX 680:
23 [X] Desktop PC GeForce GTX 680
min:
21 fps, max:
24 fps
fps
GeForce GTX 680:
296.2 [X] Desktop PC GeForce GTX 680
min:
147 fps, max:
350 fps
fps
GeForce GTX 680:
281.7 [X] Desktop PC GeForce GTX 680
min:
254 fps, max:
318 fps
fps
GeForce GTX 680:
173 [X] Desktop GTX 680, Intel Core i7-2600K Intel Core i7-2600K 3.4GHz
GeForce GTX 680
min:
152 fps, max:
190 fps
212 [X] Desktop PC GeForce GTX 680
min:
94 fps, max:
233 fps
~ 193 fps
GeForce GTX 680:
84 [X] Desktop GTX 680, Intel Core i7-2600K Intel Core i7-2600K 3.4GHz
GeForce GTX 680
min:
77 fps, max:
90 fps
90.2 [X] Desktop PC GeForce GTX 680
min:
36 fps, max:
98 fps
~ 87 fps
GeForce GTX 680:
88 [X] Desktop GTX 680, Intel Core i7-2600K Intel Core i7-2600K 3.4GHz
GeForce GTX 680
min:
64 fps, max:
124 fps
fps
GeForce GTX 680:
78 [X] Desktop GTX 680, Intel Core i7-2600K Intel Core i7-2600K 3.4GHz
GeForce GTX 680
min:
54 fps, max:
108 fps
fps
GeForce GTX 680:
48 [X] Desktop GTX 680, Intel Core i7-2600K Intel Core i7-2600K 3.4GHz
GeForce GTX 680
min:
15 fps, max:
72 fps
fps
GeForce GTX 680:
26 [X] Desktop GTX 680, Intel Core i7-2600K Intel Core i7-2600K 3.4GHz
GeForce GTX 680
min:
7 fps, max:
42 fps
fps
GeForce GTX 680:
14 [X] Desktop GTX 680, Intel Core i7-2600K Intel Core i7-2600K 3.4GHz
GeForce GTX 680
min:
8 fps, max:
24 fps
fps
GeForce GTX 680:
105 [X] Desktop GTX 680, Intel Core i7-2600K Intel Core i7-2600K 3.4GHz
GeForce GTX 680
min:
76 fps, max:
121 fps
125.6 [X] Desktop PC GeForce GTX 680
min:
109 fps, max:
143 fps
~ 115 fps
GeForce GTX 680:
65 [X] Desktop GTX 680, Intel Core i7-2600K Intel Core i7-2600K 3.4GHz
GeForce GTX 680
min:
55 fps, max:
78 fps
79.7 [X] Desktop PC GeForce GTX 680
min:
71 fps, max:
92 fps
~ 72 fps
GeForce GTX 680:
39 [X] Desktop GTX 680, Intel Core i7-2600K Intel Core i7-2600K 3.4GHz
GeForce GTX 680
min:
28 fps, max:
47 fps
44.6 [X] Desktop PC GeForce GTX 680
min:
39 fps, max:
50 fps
~ 42 fps
GeForce GTX 680:
20.5 [X] Desktop GTX 680, Intel Core i7-2600K Intel Core i7-2600K 3.4GHz
GeForce GTX 680
min:
16 fps, max:
25 fps
24.4 [X] Desktop PC GeForce GTX 680
min:
19 fps, max:
31 fps
~ 22 fps
GeForce GTX 680:
14.9 [X] Desktop GTX 680, Intel Core i7-2600K Intel Core i7-2600K 3.4GHz
GeForce GTX 680
min:
12 fps, max:
17 fps
16.6 [X] Desktop PC GeForce GTX 680
min:
14 fps, max:
18 fps
~ 16 fps
GeForce GTX 680:
235.6 [X] Desktop PC GeForce GTX 680
min:
215.1 fps, max:
247.8 fps
fps
GeForce GTX 680:
149.6 [X] Desktop PC GeForce GTX 680
min:
84.2 fps, max:
207.2 fps
fps
GeForce GTX 680:
94.3 [X] Desktop PC GeForce GTX 680
min:
65.3 fps, max:
152.6 fps
fps
GeForce GTX 680:
67 [X] Desktop PC GeForce GTX 680
min:
57.7 fps, max:
93.4 fps
fps
GeForce GTX 680:
60 [X] Desktop PC GeForce GTX 680
min:
49 fps, max:
79.4 fps
fps
GeForce GTX 680:
134 [X] Desktop GTX 680, Intel Core i7-2600K Intel Core i7-2600K 3.4GHz
GeForce GTX 680
min:
45 fps, max:
206 fps
166.6 [X] Desktop PC GeForce GTX 680
min:
4.8 fps, max:
278 fps
~ 150 fps
GeForce GTX 680:
128 [X] Desktop GTX 680, Intel Core i7-2600K Intel Core i7-2600K 3.4GHz
GeForce GTX 680
min:
26 fps, max:
198 fps
159.8 [X] Desktop PC GeForce GTX 680
min:
10.8 fps, max:
226.9 fps
~ 144 fps
GeForce GTX 680:
72 [X] Desktop GTX 680, Intel Core i7-2600K Intel Core i7-2600K 3.4GHz
GeForce GTX 680
min:
21 fps, max:
122 fps
80 [X] Desktop PC GeForce GTX 680
min:
17.3 fps, max:
164.1 fps
~ 76 fps
GeForce GTX 680:
32 [X] Desktop GTX 680, Intel Core i7-2600K Intel Core i7-2600K 3.4GHz
GeForce GTX 680
min:
1 fps, max:
119 fps
40.3 [X] Desktop PC GeForce GTX 680
min:
3.2 fps, max:
87 fps
~ 36 fps
GeForce GTX 680:
20.9 [X] Desktop PC GeForce GTX 680
min:
1.7 fps, max:
126.9 fps
fps
GeForce GTX 680:
173 [X] Desktop GTX 680, Intel Core i7-2600K Intel Core i7-2600K 3.4GHz
GeForce GTX 680
min:
161 fps, max:
185 fps
fps
GeForce GTX 680:
152 [X] Desktop GTX 680, Intel Core i7-2600K Intel Core i7-2600K 3.4GHz
GeForce GTX 680
min:
140 fps, max:
169 fps
fps
GeForce GTX 680:
85 [X] Desktop GTX 680, Intel Core i7-2600K Intel Core i7-2600K 3.4GHz
GeForce GTX 680
min:
78 fps, max:
94 fps
fps
GeForce GTX 680:
54 [X] Desktop GTX 680, Intel Core i7-2600K Intel Core i7-2600K 3.4GHz
GeForce GTX 680
min:
47 fps, max:
62 fps
fps
GeForce GTX 680:
141 [X] Desktop GTX 680, Intel Core i7-2600K Intel Core i7-2600K 3.4GHz
GeForce GTX 680
min:
108 fps
fps
GeForce GTX 680:
120 [X] Desktop GTX 680, Intel Core i7-2600K Intel Core i7-2600K 3.4GHz
GeForce GTX 680
min:
90 fps
fps
GeForce GTX 680:
55.2 [X] Desktop GTX 680, Intel Core i7-2600K Intel Core i7-2600K 3.4GHz
GeForce GTX 680
min:
45.5 fps
fps
GeForce GTX 680:
39.5 [X] Desktop GTX 680, Intel Core i7-2600K Intel Core i7-2600K 3.4GHz
GeForce GTX 680
min:
28.9 fps
fps
GeForce GTX 680:
45 [X] Desktop GTX 680, Intel Core i7-2600K Intel Core i7-2600K 3.4GHz
GeForce GTX 680
min:
33 fps, max:
59 fps
fps
GeForce GTX 680:
183.1 [X] Desktop PC GeForce GTX 680
min:
146 fps, max:
196 fps
191 [X] Desktop GTX 680, Intel Core i7-2600K Intel Core i7-2600K 3.4GHz
GeForce GTX 680
min:
155 fps, max:
201 fps
~ 187 fps
GeForce GTX 680:
129 [X] Desktop GTX 680, Intel Core i7-2600K Intel Core i7-2600K 3.4GHz
GeForce GTX 680
min:
72 fps, max:
200 fps
154.3 [X] Desktop PC GeForce GTX 680
min:
99 fps, max:
192 fps
~ 142 fps
GeForce GTX 680:
104 [X] Desktop GTX 680, Intel Core i7-2600K Intel Core i7-2600K 3.4GHz
GeForce GTX 680
min:
50 fps, max:
164 fps
133.2 [X] Desktop PC GeForce GTX 680
min:
86 fps, max:
192 fps
~ 119 fps
GeForce GTX 680:
96 [X] Desktop GTX 680, Intel Core i7-2600K Intel Core i7-2600K 3.4GHz
GeForce GTX 680
min:
46 fps, max:
174 fps
122.8 [X] Desktop PC GeForce GTX 680
min:
72 fps, max:
189 fps
~ 109 fps
GeForce GTX 680:
64 [X] Desktop GTX 680, Intel Core i7-2600K Intel Core i7-2600K 3.4GHz
GeForce GTX 680
min:
60 fps, max:
67 fps
fps
GeForce GTX 680:
64 [X] Desktop GTX 680, Intel Core i7-2600K Intel Core i7-2600K 3.4GHz
GeForce GTX 680
min:
60 fps, max:
67 fps
fps
GeForce GTX 680:
64 [X] Desktop GTX 680, Intel Core i7-2600K Intel Core i7-2600K 3.4GHz
GeForce GTX 680
min:
59 fps, max:
67 fps
fps
GeForce GTX 680:
63 [X] Desktop GTX 680, Intel Core i7-2600K Intel Core i7-2600K 3.4GHz
GeForce GTX 680
min:
57 fps, max:
67 fps
fps
GeForce GTX 680:
233 [X] Desktop GTX 680, Intel Core i7-2600K Intel Core i7-2600K 3.4GHz
GeForce GTX 680
fps
GeForce GTX 680:
143 [X] Desktop GTX 680, Intel Core i7-2600K Intel Core i7-2600K 3.4GHz
GeForce GTX 680
fps
GeForce GTX 680:
125 [X] Desktop GTX 680, Intel Core i7-2600K Intel Core i7-2600K 3.4GHz
GeForce GTX 680
min:
97 fps, max:
157 fps
fps
GeForce GTX 680:
86 [X] Desktop GTX 680, Intel Core i7-2600K Intel Core i7-2600K 3.4GHz
GeForce GTX 680
min:
70 fps, max:
109 fps
fps
100%
GeForce GTX 660 Ti:
87.3 [X] Desktop-PC Intel Core i7-3770K 3.5GHz
GeForce GTX 660 Ti
min:
70 fps
fps
94%
GeForce GTX 680:
82 [X] Desktop GTX 680, Intel Core i7-2600K Intel Core i7-2600K 3.4GHz
GeForce GTX 680
min:
66 fps, max:
107 fps
fps
100%
GeForce GTX 660 Ti:
76 [X] Desktop-PC Intel Core i7-3770K 3.5GHz
GeForce GTX 660 Ti
min:
61 fps
fps
93%
GeForce GTX 680:
71 [X] Desktop GTX 680, Intel Core i7-2600K Intel Core i7-2600K 3.4GHz
GeForce GTX 680
min:
56 fps, max:
87 fps
fps
100%
GeForce GTX 660 Ti:
43.4 [X] Desktop-PC Intel Core i7-3770K 3.5GHz
GeForce GTX 660 Ti
min:
38 fps
fps
111%
GeForce GTX 680:
48 [X] Desktop GTX 680, Intel Core i7-2600K Intel Core i7-2600K 3.4GHz
GeForce GTX 680
min:
38 fps, max:
56 fps
fps
100%
GeForce GTX 660 Ti:
31.7 [X] Desktop-PC Intel Core i7-3770K 3.5GHz
GeForce GTX 660 Ti
min:
26 fps
fps
91%
GeForce GTX 680:
28.7 [X] Desktop GTX 680, Intel Core i7-2600K Intel Core i7-2600K 3.4GHz
GeForce GTX 680
min:
12 fps, max:
39 fps
fps
100%
GeForce GTX 660 Ti:
60 [X] Desktop-PC Intel Core i7-3770K 3.5GHz
GeForce GTX 660 Ti
min:
59 fps
fps
100%
GeForce GTX 680:
60 [X] Desktop GTX 680, Intel Core i7-2600K Intel Core i7-2600K 3.4GHz
GeForce GTX 680
fps
100%
GeForce GTX 660 Ti:
60 [X] Desktop-PC Intel Core i7-3770K 3.5GHz
GeForce GTX 660 Ti
min:
59 fps
fps
100%
GeForce GTX 680:
60 [X] Desktop GTX 680, Intel Core i7-2600K Intel Core i7-2600K 3.4GHz
GeForce GTX 680
fps
100%
GeForce GTX 660 Ti:
60 [X] Desktop-PC Intel Core i7-3770K 3.5GHz
GeForce GTX 660 Ti
min:
59 fps
fps
100%
GeForce GTX 680:
59.8 [X] Desktop GTX 680, Intel Core i7-2600K Intel Core i7-2600K 3.4GHz
GeForce GTX 680
min:
56 fps, max:
62 fps
fps
100%
GeForce GTX 660 Ti:
57.1 [X] Desktop-PC Intel Core i7-3770K 3.5GHz
GeForce GTX 660 Ti
min:
46 fps
fps
100%
GeForce GTX 660 Ti:
98.4 [X] Desktop-PC Intel Core i7-3770K 3.5GHz
GeForce GTX 660 Ti
fps
101%
GeForce GTX 680:
99 [X] Desktop GTX 680, Intel Core i7-2600K Intel Core i7-2600K 3.4GHz
GeForce GTX 680
min:
88 fps, max:
100 fps
fps
100%
GeForce GTX 660 Ti:
94 [X] Desktop-PC Intel Core i7-3770K 3.5GHz
GeForce GTX 660 Ti
fps
104%
GeForce GTX 680:
98 [X] Desktop GTX 680, Intel Core i7-2600K Intel Core i7-2600K 3.4GHz
GeForce GTX 680
min:
83 fps, max:
100 fps
fps
100%
GeForce GTX 660 Ti:
85.7 [X] Desktop-PC Intel Core i7-3770K 3.5GHz
GeForce GTX 660 Ti
fps
111%
GeForce GTX 680:
95 [X] Desktop GTX 680, Intel Core i7-2600K Intel Core i7-2600K 3.4GHz
GeForce GTX 680
min:
70 fps, max:
100 fps
fps
100%
GeForce GTX 660 Ti:
67.4 [X] Desktop-PC Intel Core i7-3770K 3.5GHz
GeForce GTX 660 Ti
fps
106%
GeForce GTX 680:
71.5 [X] Desktop GTX 680, Intel Core i7-2600K Intel Core i7-2600K 3.4GHz
GeForce GTX 680
min:
47 fps, max:
91 fps
fps
100%
GeForce GTX 660 Ti:
60 [X] Desktop-PC Intel Core i7-3770K 3.5GHz
GeForce GTX 660 Ti
fps
100%
GeForce GTX 680:
60 [X] Desktop GTX 680, Intel Core i7-2600K Intel Core i7-2600K 3.4GHz
GeForce GTX 680
fps
100%
GeForce GTX 660 Ti:
60 [X] Desktop-PC Intel Core i7-3770K 3.5GHz
GeForce GTX 660 Ti
fps
100%
GeForce GTX 680:
60 [X] Desktop GTX 680, Intel Core i7-2600K Intel Core i7-2600K 3.4GHz
GeForce GTX 680
fps
100%
GeForce GTX 660 Ti:
60 [X] Desktop-PC Intel Core i7-3770K 3.5GHz
GeForce GTX 660 Ti
fps
100%
GeForce GTX 680:
60 [X] Desktop GTX 680, Intel Core i7-2600K Intel Core i7-2600K 3.4GHz
GeForce GTX 680
fps
100%
GeForce GTX 660 Ti:
59.5 [X] Desktop-PC Intel Core i7-3770K 3.5GHz
GeForce GTX 660 Ti
fps
99%
GeForce GTX 680:
58.8 [X] Desktop GTX 680, Intel Core i7-2600K Intel Core i7-2600K 3.4GHz
GeForce GTX 680
min:
47 fps, max:
61 fps
fps
100%
GeForce GTX 660 Ti:
72.5 [X] Desktop-PC Intel Core i7-3770K 3.5GHz
GeForce GTX 660 Ti
fps
104%
GeForce GTX 680:
75.5 [X] Desktop GTX 680, Intel Core i7-2600K Intel Core i7-2600K 3.4GHz
GeForce GTX 680
min:
49 fps, max:
153 fps
fps
100%
GeForce GTX 660 Ti:
66.7 [X] Desktop-PC Intel Core i7-3770K 3.5GHz
GeForce GTX 660 Ti
fps
108%
GeForce GTX 680:
71.8 [X] Desktop GTX 680, Intel Core i7-2600K Intel Core i7-2600K 3.4GHz
GeForce GTX 680
min:
48 fps, max:
121 fps
fps
100%
GeForce GTX 660 Ti:
64.8 [X] Desktop-PC Intel Core i7-3770K 3.5GHz
GeForce GTX 660 Ti
fps
107%
GeForce GTX 680:
69.3 [X] Desktop GTX 680, Intel Core i7-2600K Intel Core i7-2600K 3.4GHz
GeForce GTX 680
min:
35 fps, max:
112 fps
fps
100%
GeForce GTX 660 Ti:
40.9 [X] Desktop-PC Intel Core i7-3770K 3.5GHz
GeForce GTX 660 Ti
fps
121%
GeForce GTX 680:
49.3 [X] Desktop GTX 680, Intel Core i7-2600K Intel Core i7-2600K 3.4GHz
GeForce GTX 680
min:
22.4 fps, max:
67 fps
fps
100%
GeForce GTX 660 Ti:
62.1 [X] Desktop-PC Intel Core i7-3770K 3.5GHz
GeForce GTX 660 Ti
fps
98%
GeForce GTX 680:
61 [X] Desktop GTX 680, Intel Core i7-2600K Intel Core i7-2600K 3.4GHz
GeForce GTX 680
min:
48 fps, max:
63 fps
fps
100%
GeForce GTX 660 Ti:
61.8 [X] Desktop-PC Intel Core i7-3770K 3.5GHz
GeForce GTX 660 Ti
fps
97%
GeForce GTX 680:
59.8 [X] Desktop GTX 680, Intel Core i7-2600K Intel Core i7-2600K 3.4GHz
GeForce GTX 680
min:
46 fps, max:
63 fps
fps
100%
GeForce GTX 660 Ti:
61.2 [X] Desktop-PC Intel Core i7-3770K 3.5GHz
GeForce GTX 660 Ti
fps
96%
GeForce GTX 680:
58.9 [X] Desktop GTX 680, Intel Core i7-2600K Intel Core i7-2600K 3.4GHz
GeForce GTX 680
min:
44 fps, max:
63 fps
fps
100%
GeForce GTX 660 Ti:
37.3 [X] Desktop-PC Intel Core i7-3770K 3.5GHz
GeForce GTX 660 Ti
fps
116%
GeForce GTX 680:
43.1 [X] Desktop GTX 680, Intel Core i7-2600K Intel Core i7-2600K 3.4GHz
GeForce GTX 680
min:
34 fps, max:
49 fps
fps
100%
GeForce GTX 660 Ti:
105.7 [X] Desktop-PC Intel Core i7-3770K 3.5GHz
GeForce GTX 660 Ti
fps
90%
GeForce GTX 680:
95 [X] Desktop GTX 680, Intel Core i7-2600K Intel Core i7-2600K 3.4GHz
GeForce GTX 680
fps
100%
GeForce GTX 660 Ti:
46.8 [X] Desktop-PC Intel Core i7-3770K 3.5GHz
GeForce GTX 660 Ti
fps
92%
GeForce GTX 680:
43.1 [X] Desktop GTX 680, Intel Core i7-2600K Intel Core i7-2600K 3.4GHz
GeForce GTX 680
fps
100%
GeForce GTX 660 Ti:
26.4 [X] Desktop-PC Intel Core i7-3770K 3.5GHz
GeForce GTX 660 Ti
fps
91%
GeForce GTX 680:
24.1 [X] Desktop GTX 680, Intel Core i7-2600K Intel Core i7-2600K 3.4GHz
GeForce GTX 680
fps
100%
GeForce GTX 660 Ti:
21.7 [X] Desktop-PC Intel Core i7-3770K 3.5GHz
GeForce GTX 660 Ti
fps
93%
GeForce GTX 680:
20.1 [X] Desktop GTX 680, Intel Core i7-2600K Intel Core i7-2600K 3.4GHz
GeForce GTX 680
fps
GeForce GTX 680:
30 [X] Desktop GTX 680, Intel Core i7-2600K Intel Core i7-2600K 3.4GHz
GeForce GTX 680
fps
GeForce GTX 680:
30 [X] Desktop GTX 680, Intel Core i7-2600K Intel Core i7-2600K 3.4GHz
GeForce GTX 680
fps
GeForce GTX 680:
30 [X] Desktop GTX 680, Intel Core i7-2600K Intel Core i7-2600K 3.4GHz
GeForce GTX 680
fps
GeForce GTX 680:
30 [X] Desktop GTX 680, Intel Core i7-2600K Intel Core i7-2600K 3.4GHz
GeForce GTX 680
min:
28 fps
fps
100%
GeForce GTX 660 Ti:
84.1 [X] Desktop-PC Intel Core i7-3770K 3.5GHz
GeForce GTX 660 Ti
fps
119%
GeForce GTX 680:
99.7 [X] Desktop GTX 680, Intel Core i7-2600K Intel Core i7-2600K 3.4GHz
GeForce GTX 680
min:
54 fps, max:
186 fps
fps
100%
GeForce GTX 660 Ti:
83.4 [X] Desktop-PC Intel Core i7-3770K 3.5GHz
GeForce GTX 660 Ti
fps
105%
GeForce GTX 680:
87.9 [X] Desktop GTX 680, Intel Core i7-2600K Intel Core i7-2600K 3.4GHz
GeForce GTX 680
min:
50 fps, max:
177 fps
fps
100%
GeForce GTX 660 Ti:
70.2 [X] Desktop-PC Intel Core i7-3770K 3.5GHz
GeForce GTX 660 Ti
fps
101%
GeForce GTX 680:
70.8 [X] Desktop GTX 680, Intel Core i7-2600K Intel Core i7-2600K 3.4GHz
GeForce GTX 680
min:
45 fps, max:
106 fps
fps
100%
GeForce GTX 660 Ti:
41.5 [X] Desktop-PC Intel Core i7-3770K 3.5GHz
GeForce GTX 660 Ti
fps
117%
GeForce GTX 680:
48.7 [X] Desktop GTX 680, Intel Core i7-2600K Intel Core i7-2600K 3.4GHz
GeForce GTX 680
min:
27 fps, max:
73 fps
fps
100%
GeForce GTX 660 Ti:
126 [X] Desktop-PC Intel Core i7-3770K 3.5GHz
GeForce GTX 660 Ti
fps
122%
GeForce GTX 680:
108 [X] Desktop GTX 680, Intel Core i7-2600K Intel Core i7-2600K 3.4GHz
GeForce GTX 680
min:
80 fps, max:
190 fps
199.2 [X] Desktop PC GeForce GTX 680
min:
189 fps, max:
201 fps
~ 154 fps
100%
GeForce GTX 660 Ti:
107.2 [X] Desktop-PC Intel Core i7-3770K 3.5GHz
GeForce GTX 660 Ti
fps
130%
GeForce GTX 680:
90 [X] Desktop GTX 680, Intel Core i7-2600K Intel Core i7-2600K 3.4GHz
GeForce GTX 680
min:
67 fps, max:
128 fps
187.7 [X] Desktop PC GeForce GTX 680
min:
175 fps, max:
201 fps
~ 139 fps
100%
GeForce GTX 660 Ti:
90.4 [X] Desktop-PC Intel Core i7-3770K 3.5GHz
GeForce GTX 660 Ti
fps
127%
GeForce GTX 680:
86 [X] Desktop GTX 680, Intel Core i7-2600K Intel Core i7-2600K 3.4GHz
GeForce GTX 680
min:
60 fps, max:
114 fps
143.5 [X] Desktop PC GeForce GTX 680
min:
131 fps, max:
189 fps
~ 115 fps
100%
GeForce GTX 660 Ti:
42 [X] Desktop-PC Intel Core i7-3770K 3.5GHz
GeForce GTX 660 Ti
fps
136%
GeForce GTX 680:
50.6 [X] Desktop GTX 680, Intel Core i7-2600K Intel Core i7-2600K 3.4GHz
GeForce GTX 680
min:
41 fps, max:
69 fps
64.3 [X] Desktop PC GeForce GTX 680
min:
53 fps, max:
87 fps
~ 57 fps
GeForce GTX 680:
32.4 [X] Desktop PC GeForce GTX 680
min:
28 fps, max:
40 fps
fps
100%
GeForce GTX 660 Ti:
343 [X] Desktop-PC Intel Core i7-3770K 3.5GHz
GeForce GTX 660 Ti
fps
97%
GeForce GTX 680:
331 [X] Desktop GTX 680, Intel Core i7-2600K Intel Core i7-2600K 3.4GHz
GeForce GTX 680
fps
100%
GeForce GTX 660 Ti:
250 [X] Desktop-PC Intel Core i7-3770K 3.5GHz
GeForce GTX 660 Ti
fps
98%
GeForce GTX 680:
244 [X] Desktop GTX 680, Intel Core i7-2600K Intel Core i7-2600K 3.4GHz
GeForce GTX 680
fps
100%
GeForce GTX 660 Ti:
147 [X] Desktop-PC Intel Core i7-3770K 3.5GHz
GeForce GTX 660 Ti
fps
117%
GeForce GTX 680:
172 [X] Desktop GTX 680, Intel Core i7-2600K Intel Core i7-2600K 3.4GHz
GeForce GTX 680
min:
64 fps, max:
252 fps
fps
100%
GeForce GTX 660 Ti:
73 [X] Desktop-PC Intel Core i7-3770K 3.5GHz
GeForce GTX 660 Ti
fps
122%
GeForce GTX 680:
89 [X] Desktop GTX 680, Intel Core i7-2600K Intel Core i7-2600K 3.4GHz
GeForce GTX 680
min:
45 fps, max:
139 fps
fps
100%
GeForce GTX 660 Ti:
188 [X] Desktop-PC Intel Core i7-3770K 3.5GHz
GeForce GTX 660 Ti
fps
87%
GeForce GTX 680:
162 [X] Desktop GTX 680 Intel Core i7-2600K 3.4GHz
GeForce GTX 680
165 [X] Desktop GTX 680, Intel Core i7-2600K Intel Core i7-2600K 3.4GHz
GeForce GTX 680
min:
135 fps
~ 164 fps
100%
GeForce GTX 660 Ti:
139 [X] Desktop-PC Intel Core i7-3770K 3.5GHz
GeForce GTX 660 Ti
fps
91%
GeForce GTX 680:
118 [X] Desktop GTX 680 Intel Core i7-2600K 3.4GHz
GeForce GTX 680
133 [X] Desktop GTX 680, Intel Core i7-2600K Intel Core i7-2600K 3.4GHz
GeForce GTX 680
min:
104 fps
~ 126 fps
100%
GeForce GTX 660 Ti:
130 [X] Desktop-PC Intel Core i7-3770K 3.5GHz
GeForce GTX 660 Ti
fps
96%
GeForce GTX 680:
122 [X] Desktop GTX 680, Intel Core i7-2600K Intel Core i7-2600K 3.4GHz
GeForce GTX 680
min:
96 fps
128 [X] Desktop GTX 680 Intel Core i7-2600K 3.4GHz
GeForce GTX 680
~ 125 fps
100%
GeForce GTX 660 Ti:
110 [X] Desktop-PC Intel Core i7-3770K 3.5GHz
GeForce GTX 660 Ti
fps
99%
GeForce GTX 680:
105 [X] Desktop GTX 680, Intel Core i7-2600K Intel Core i7-2600K 3.4GHz
GeForce GTX 680
min:
81 fps
113 [X] Desktop GTX 680 Intel Core i7-2600K 3.4GHz
GeForce GTX 680
min:
78 fps
~ 109 fps
100%
GeForce GTX 660 Ti:
752 [X] Desktop-PC Intel Core i7-3770K 3.5GHz
GeForce GTX 660 Ti
fps
100%
GeForce GTX 660 Ti:
554 [X] Desktop-PC Intel Core i7-3770K 3.5GHz
GeForce GTX 660 Ti
fps
100%
GeForce GTX 660 Ti:
546 [X] Desktop-PC Intel Core i7-3770K 3.5GHz
GeForce GTX 660 Ti
fps
100%
GeForce GTX 660 Ti:
408.9 [X] Desktop-PC Intel Core i7-3770K 3.5GHz
GeForce GTX 660 Ti
fps
108%
GeForce GTX 680:
440 [X] Desktop GTX 680 Intel Core i7-2600K 3.4GHz
GeForce GTX 680
fps
100%
GeForce GTX 660 Ti:
266 [X] Desktop-PC Intel Core i7-3770K 3.5GHz
GeForce GTX 660 Ti
fps
94%
GeForce GTX 680:
249 [X] Desktop GTX 680 Intel Core i7-2600K 3.4GHz
GeForce GTX 680
min:
161 fps
fps
100%
GeForce GTX 660 Ti:
194.8 [X] Desktop-PC Intel Core i7-3770K 3.5GHz
GeForce GTX 660 Ti
fps
86%
GeForce GTX 680:
168 [X] Desktop GTX 680 Intel Core i7-2600K 3.4GHz
GeForce GTX 680
min:
110 fps
fps
100%
GeForce GTX 660 Ti:
141.4 [X] Desktop-PC Intel Core i7-3770K 3.5GHz
GeForce GTX 660 Ti
fps
89%
GeForce GTX 680:
125.6 [X] Desktop GTX 680 Intel Core i7-2600K 3.4GHz
GeForce GTX 680
min:
69 fps
fps
100%
GeForce GTX 660 Ti:
33.8 [X] Desktop-PC Intel Core i7-3770K 3.5GHz
GeForce GTX 660 Ti
fps
114%
GeForce GTX 680:
38.4 [X] Desktop GTX 680 Intel Core i7-2600K 3.4GHz
GeForce GTX 680
min:
18 fps
fps
100%
GeForce GTX 660 Ti:
90.7 [X] Desktop-PC Intel Core i7-3770K 3.5GHz
GeForce GTX 660 Ti
fps
90%
GeForce GTX 680:
82 [X] Desktop GTX 680 Intel Core i7-2600K 3.4GHz
GeForce GTX 680
fps
100%
GeForce GTX 660 Ti:
78.8 [X] Desktop-PC Intel Core i7-3770K 3.5GHz
GeForce GTX 660 Ti
fps
104%
GeForce GTX 680:
82 [X] Desktop GTX 680 Intel Core i7-2600K 3.4GHz
GeForce GTX 680
fps
100%
GeForce GTX 660 Ti:
66.3 [X] Desktop-PC Intel Core i7-3770K 3.5GHz
GeForce GTX 660 Ti
fps
107%
GeForce GTX 680:
71 [X] Desktop GTX 680 Intel Core i7-2600K 3.4GHz
GeForce GTX 680
fps
100%
GeForce GTX 660 Ti:
52.2 [X] Desktop-PC Intel Core i7-3770K 3.5GHz
GeForce GTX 660 Ti
fps
123%
GeForce GTX 680:
63 [X] Desktop GTX 680 Intel Core i7-2600K 3.4GHz
GeForce GTX 680
65 [X] Desktop GTX 680 Intel Core i7-2600K 3.4GHz
GeForce GTX 680
~ 64 fps
100%
GeForce GTX 660 Ti:
121.9 [X] Desktop-PC Intel Core i7-3770K 3.5GHz
GeForce GTX 660 Ti
fps
100%
GeForce GTX 680:
121.8 [X] Desktop GTX 680 Intel Core i7-2600K 3.4GHz
GeForce GTX 680
fps
100%
GeForce GTX 660 Ti:
121.2 [X] Desktop-PC Intel Core i7-3770K 3.5GHz
GeForce GTX 660 Ti
fps
100%
GeForce GTX 680:
121.2 [X] Desktop GTX 680 Intel Core i7-2600K 3.4GHz
GeForce GTX 680
fps
100%
GeForce GTX 660 Ti:
66.3 [X] Desktop-PC Intel Core i7-3770K 3.5GHz
GeForce GTX 660 Ti
fps
137%
GeForce GTX 680:
91.1 [X] Desktop GTX 680 Intel Core i7-2600K 3.4GHz
GeForce GTX 680
fps
100%
GeForce GTX 660 Ti:
34.8 [X] Desktop-PC Intel Core i7-3770K 3.5GHz
GeForce GTX 660 Ti
fps
130%
GeForce GTX 680:
45.4 [X] Desktop GTX 680 Intel Core i7-2600K 3.4GHz
GeForce GTX 680
fps
100%
GeForce GTX 660 Ti:
134.4 [X] Desktop-PC Intel Core i7-3770K 3.5GHz
GeForce GTX 660 Ti
fps
86%
GeForce GTX 680:
115 [X] Desktop GTX 680 Intel Core i7-2600K 3.4GHz
GeForce GTX 680
fps
100%
GeForce GTX 660 Ti:
135.9 [X] Desktop-PC Intel Core i7-3770K 3.5GHz
GeForce GTX 660 Ti
fps
94%
GeForce GTX 680:
128 [X] Desktop GTX 680 Intel Core i7-2600K 3.4GHz
GeForce GTX 680
fps
100%
GeForce GTX 660 Ti:
86 [X] Desktop-PC Intel Core i7-3770K 3.5GHz
GeForce GTX 660 Ti
fps
113%
GeForce GTX 680:
97 [X] Desktop GTX 680 Intel Core i7-2600K 3.4GHz
GeForce GTX 680
fps
100%
GeForce GTX 660 Ti:
42 [X] Desktop-PC Intel Core i7-3770K 3.5GHz
GeForce GTX 660 Ti
fps
123%
GeForce GTX 680:
51.7 [X] Desktop GTX 680 Intel Core i7-2600K 3.4GHz
GeForce GTX 680
fps
100%
GeForce GTX 660 Ti:
113.6 [X] Desktop-PC Intel Core i7-3770K 3.5GHz
GeForce GTX 660 Ti
fps
98%
GeForce GTX 680:
111 [X] Desktop GTX 680 Intel Core i7-2600K 3.4GHz
GeForce GTX 680
fps
100%
GeForce GTX 660 Ti:
103.9 [X] Desktop-PC Intel Core i7-3770K 3.5GHz
GeForce GTX 660 Ti
fps
93%
GeForce GTX 680:
97 [X] Desktop GTX 680 Intel Core i7-2600K 3.4GHz
GeForce GTX 680
fps
100%
GeForce GTX 660 Ti:
96 [X] Desktop-PC Intel Core i7-3770K 3.5GHz
GeForce GTX 660 Ti
fps
96%
GeForce GTX 680:
92 [X] Desktop GTX 680 Intel Core i7-2600K 3.4GHz
GeForce GTX 680
fps
100%
GeForce GTX 660 Ti:
55.9 [X] Desktop-PC Intel Core i7-3770K 3.5GHz
GeForce GTX 660 Ti
fps
100%
GeForce GTX 680:
56.1 [X] Desktop GTX 680 Intel Core i7-2600K 3.4GHz
GeForce GTX 680
fps
100%
GeForce GTX 660 Ti:
51.5 [X] Desktop-PC Intel Core i7-3770K 3.5GHz
GeForce GTX 660 Ti
fps
104%
GeForce GTX 680:
53.7 [X] Desktop GTX 680 Intel Core i7-2600K 3.4GHz
GeForce GTX 680
fps
100%
GeForce GTX 660 Ti:
46.8 [X] Desktop-PC Intel Core i7-3770K 3.5GHz
GeForce GTX 660 Ti
fps
116%
GeForce GTX 680:
54.2 [X] Desktop GTX 680 Intel Core i7-2600K 3.4GHz
GeForce GTX 680
fps
100%
GeForce GTX 660 Ti:
25.3 [X] Desktop-PC Intel Core i7-3770K 3.5GHz
GeForce GTX 660 Ti
fps
113%
GeForce GTX 680:
28.5 [X] Desktop GTX 680 Intel Core i7-2600K 3.4GHz
GeForce GTX 680
fps
100%
GeForce GTX 660 Ti:
167.9 [X] Desktop-PC Intel Core i7-3770K 3.5GHz
GeForce GTX 660 Ti
fps
88%
GeForce GTX 680:
148 [X] Desktop GTX 680 Intel Core i7-2600K 3.4GHz
GeForce GTX 680
fps
100%
GeForce GTX 660 Ti:
119.8 [X] Desktop-PC Intel Core i7-3770K 3.5GHz
GeForce GTX 660 Ti
fps
92%
GeForce GTX 680:
110 [X] Desktop GTX 680 Intel Core i7-2600K 3.4GHz
GeForce GTX 680
fps
100%
GeForce GTX 660 Ti:
111.7 [X] Desktop-PC Intel Core i7-3770K 3.5GHz
GeForce GTX 660 Ti
fps
91%
GeForce GTX 680:
102 [X] Desktop GTX 680 Intel Core i7-2600K 3.4GHz
GeForce GTX 680
fps
100%
GeForce GTX 660 Ti:
70.2 [X] Desktop-PC Intel Core i7-3770K 3.5GHz
GeForce GTX 660 Ti
fps
108%
GeForce GTX 680:
76 [X] Desktop GTX 680 Intel Core i7-2600K 3.4GHz
GeForce GTX 680
fps
100%
GeForce GTX 660 Ti:
122.3 [X] Desktop-PC Intel Core i7-3770K 3.5GHz
GeForce GTX 660 Ti
fps
97%
GeForce GTX 680:
119.1 [X] Desktop GTX 680 Intel Core i7-2600K 3.4GHz
GeForce GTX 680
fps
100%
GeForce GTX 660 Ti:
110 [X] Desktop-PC Intel Core i7-3770K 3.5GHz
GeForce GTX 660 Ti
fps
104%
GeForce GTX 680:
114.8 [X] Desktop GTX 680 Intel Core i7-2600K 3.4GHz
GeForce GTX 680
fps
100%
GeForce GTX 660 Ti:
72.1 [X] Desktop-PC Intel Core i7-3770K 3.5GHz
GeForce GTX 660 Ti
fps
125%
GeForce GTX 680:
90.1 [X] Desktop GTX 680 Intel Core i7-2600K 3.4GHz
GeForce GTX 680
fps
100%
GeForce GTX 660 Ti:
41.1 [X] Desktop-PC Intel Core i7-3770K 3.5GHz
GeForce GTX 660 Ti
fps
121%
GeForce GTX 680:
49.8 [X] Desktop GTX 680 Intel Core i7-2600K 3.4GHz
GeForce GTX 680
fps
100%
GeForce GTX 660 Ti:
200.7 [X] Desktop-PC (GTX 660 Ti) Intel Core i5-2400 3.1GHz
GeForce GTX 660 Ti
fps
100%
GeForce GTX 680:
195 [X] Desktop GTX 680 Intel Core i7-2600K 3.4GHz
GeForce GTX 680
204.8 [X] Desktop PC GeForce GTX 680
min:
30.2 fps, max:
505.6 fps
~ 200 fps
100%
GeForce GTX 660 Ti:
168.8 [X] Desktop-PC (GTX 660 Ti) Intel Core i5-2400 3.1GHz
GeForce GTX 660 Ti
fps
94%
GeForce GTX 680:
150.3 [X] Desktop PC GeForce GTX 680
min:
23 fps, max:
477.3 fps
168 [X] Desktop GTX 680 Intel Core i7-2600K 3.4GHz
GeForce GTX 680
~ 159 fps
100%
GeForce GTX 660 Ti:
151.3 [X] Desktop-PC (GTX 660 Ti) Intel Core i5-2400 3.1GHz
GeForce GTX 660 Ti
fps
96%
GeForce GTX 680:
136.1 [X] Desktop PC GeForce GTX 680
min:
25.7 fps, max:
255.2 fps
153 [X] Desktop GTX 680 Intel Core i7-2600K 3.4GHz
GeForce GTX 680
~ 145 fps
100%
GeForce GTX 660 Ti:
62.9 [X] Desktop-PC (GTX 660 Ti) Intel Core i5-2400 3.1GHz
GeForce GTX 660 Ti
fps
99%
GeForce GTX 680:
55.3 [X] Desktop PC GeForce GTX 680
min:
13.8 fps, max:
172.7 fps
55.8 [X] Desktop GTX 680 Intel Core i7-2600K 3.4GHz
GeForce GTX 680
73.6 [X] Desktop GTX 680 Intel Core i7-2600K 3.4GHz
GeForce GTX 680
~ 62 fps
100%
GeForce GTX 660 Ti:
296.3 [X] Desktop-PC (GTX 660 Ti) Intel Core i5-2400 3.1GHz
GeForce GTX 660 Ti
fps
97%
GeForce GTX 680:
288 [X] Desktop GTX 680 Intel Core i7-2600K 3.4GHz
GeForce GTX 680
fps
100%
GeForce GTX 660 Ti:
121.4 [X] Desktop-PC (GTX 660 Ti) Intel Core i5-2400 3.1GHz
GeForce GTX 660 Ti
fps
102%
GeForce GTX 680:
124 [X] Desktop GTX 680 Intel Core i7-2600K 3.4GHz
GeForce GTX 680
fps
100%
GeForce GTX 660 Ti:
108.9 [X] Desktop-PC (GTX 660 Ti) Intel Core i5-2400 3.1GHz
GeForce GTX 660 Ti
fps
102%
GeForce GTX 680:
111 [X] Desktop GTX 680 Intel Core i7-2600K 3.4GHz
GeForce GTX 680
fps
100%
GeForce GTX 660 Ti:
65.9 [X] Desktop-PC (GTX 660 Ti) Intel Core i5-2400 3.1GHz
GeForce GTX 660 Ti
fps
114%
GeForce GTX 680:
75.2 [X] Desktop GTX 680 Intel Core i7-2600K 3.4GHz
GeForce GTX 680
fps
100%
GeForce GTX 660 Ti:
158.4 [X] Desktop-PC (GTX 660 Ti) Intel Core i5-2400 3.1GHz
GeForce GTX 660 Ti
fps
121%
GeForce GTX 680:
153 [X] Desktop GTX 680 Intel Core i7-2600K 3.4GHz
GeForce GTX 680
228 [X] no model Intel Core i7-4770K 3.5GHz
GeForce GTX 680
~ 191 fps
100%
GeForce GTX 660 Ti:
119.3 [X] Desktop-PC (GTX 660 Ti) Intel Core i5-2400 3.1GHz
GeForce GTX 660 Ti
fps
102%
GeForce GTX 680:
122 [X] Desktop GTX 680 Intel Core i7-2600K 3.4GHz
GeForce GTX 680
fps
100%
GeForce GTX 660 Ti:
95.2 [X] Desktop-PC (GTX 660 Ti) Intel Core i5-2400 3.1GHz
GeForce GTX 660 Ti
fps
107%
GeForce GTX 680:
102 [X] Desktop GTX 680 Intel Core i7-2600K 3.4GHz
GeForce GTX 680
fps
100%
GeForce GTX 660 Ti:
62.9 [X] Desktop-PC (GTX 660 Ti) Intel Core i5-2400 3.1GHz
GeForce GTX 660 Ti
fps
114%
GeForce GTX 680:
71.7 [X] Desktop GTX 680 Intel Core i7-2600K 3.4GHz
GeForce GTX 680
fps
100%
GeForce GTX 660 Ti:
304.4 [X] Desktop-PC (GTX 660 Ti) Intel Core i5-2400 3.1GHz
GeForce GTX 660 Ti
fps
92%
GeForce GTX 680:
280 [X] Desktop GTX 680 Intel Core i7-2600K 3.4GHz
GeForce GTX 680
fps
100%
GeForce GTX 660 Ti:
222.5 [X] Desktop-PC (GTX 660 Ti) Intel Core i5-2400 3.1GHz
GeForce GTX 660 Ti
fps
109%
GeForce GTX 680:
242 [X] Desktop GTX 680 Intel Core i7-2600K 3.4GHz
GeForce GTX 680
fps
100%
GeForce GTX 660 Ti:
135.3 [X] Desktop-PC (GTX 660 Ti) Intel Core i5-2400 3.1GHz
GeForce GTX 660 Ti
fps
128%
GeForce GTX 680:
173.3 [X] Desktop GTX 680 Intel Core i7-2600K 3.4GHz
GeForce GTX 680
fps
100%
GeForce GTX 660 Ti:
48.1 [X] Desktop-PC (GTX 660 Ti) Intel Core i5-2400 3.1GHz
GeForce GTX 660 Ti
fps
121%
GeForce GTX 680:
58 [X] Desktop GTX 680 Intel Core i7-2600K 3.4GHz
GeForce GTX 680
fps
100%
GeForce GTX 660 Ti:
94.1 [X] Desktop-PC (GTX 660 Ti) Intel Core i5-2400 3.1GHz
GeForce GTX 660 Ti
fps
112%
GeForce GTX 680:
105 [X] Desktop GTX 680 Intel Core i7-2600K 3.4GHz
GeForce GTX 680
fps
100%
GeForce GTX 660 Ti:
83 [X] Desktop-PC (GTX 660 Ti) Intel Core i5-2400 3.1GHz
GeForce GTX 660 Ti
fps
112%
GeForce GTX 680:
93 [X] Desktop GTX 680 Intel Core i7-2600K 3.4GHz
GeForce GTX 680
fps
100%
GeForce GTX 660 Ti:
61.9 [X] Desktop-PC (GTX 660 Ti) Intel Core i5-2400 3.1GHz
GeForce GTX 660 Ti
fps
118%
GeForce GTX 680:
73 [X] Desktop GTX 680 Intel Core i7-2600K 3.4GHz
GeForce GTX 680
fps
100%
GeForce GTX 660 Ti:
30.3 [X] Desktop-PC (GTX 660 Ti) Intel Core i5-2400 3.1GHz
GeForce GTX 660 Ti
fps
121%
GeForce GTX 680:
36.8 [X] Desktop GTX 680 Intel Core i7-2600K 3.4GHz
GeForce GTX 680
fps
100%
GeForce GTX 660 Ti:
410.2 [X] Desktop-PC (GTX 660 Ti) Intel Core i5-2400 3.1GHz
GeForce GTX 660 Ti
fps
111%
GeForce GTX 680:
455 [X] Desktop GTX 680 Intel Core i7-2600K 3.4GHz
GeForce GTX 680
fps
100%
GeForce GTX 660 Ti:
319.9 [X] Desktop-PC (GTX 660 Ti) Intel Core i5-2400 3.1GHz
GeForce GTX 660 Ti
fps
111%
GeForce GTX 680:
354 [X] Desktop GTX 680 Intel Core i7-2600K 3.4GHz
GeForce GTX 680
fps
100%
GeForce GTX 660 Ti:
248.6 [X] Desktop-PC (GTX 660 Ti) Intel Core i5-2400 3.1GHz
GeForce GTX 660 Ti
fps
115%
GeForce GTX 680:
287 [X] Desktop GTX 680 Intel Core i7-2600K 3.4GHz
GeForce GTX 680
fps
100%
GeForce GTX 660 Ti:
159.2 [X] Desktop-PC (GTX 660 Ti) Intel Core i5-2400 3.1GHz
GeForce GTX 660 Ti
fps
116%
GeForce GTX 680:
184 [X] Desktop GTX 680 Intel Core i7-2600K 3.4GHz
GeForce GTX 680
fps
100%
GeForce GTX 660 Ti:
109.2 [X] Desktop-PC (GTX 660 Ti) Intel Core i5-2400 3.1GHz
GeForce GTX 660 Ti
fps
110%
GeForce GTX 680:
120 [X] Desktop GTX 680 Intel Core i7-2600K 3.4GHz
GeForce GTX 680
fps
100%
GeForce GTX 660 Ti:
101.8 [X] Desktop-PC (GTX 660 Ti) Intel Core i5-2400 3.1GHz
GeForce GTX 660 Ti
fps
109%
GeForce GTX 680:
111 [X] Desktop GTX 680 Intel Core i7-2600K 3.4GHz
GeForce GTX 680
fps
100%
GeForce GTX 660 Ti:
79.1 [X] Desktop-PC (GTX 660 Ti) Intel Core i5-2400 3.1GHz
GeForce GTX 660 Ti
fps
110%
GeForce GTX 680:
87 [X] Desktop GTX 680 Intel Core i7-2600K 3.4GHz
GeForce GTX 680
fps
100%
GeForce GTX 660 Ti:
32.3 [X] Desktop-PC (GTX 660 Ti) Intel Core i5-2400 3.1GHz
GeForce GTX 660 Ti
fps
116%
GeForce GTX 680:
37.6 [X] Desktop GTX 680 Intel Core i7-2600K 3.4GHz
GeForce GTX 680
fps
100%
GeForce GTX 660 Ti:
76.6 [X] Desktop-PC (GTX 660 Ti) Intel Core i5-2400 3.1GHz
GeForce GTX 660 Ti
fps
85%
GeForce GTX 680:
64.9 [X] Desktop GTX 680 Intel Core i7-2600K 3.4GHz
GeForce GTX 680
fps
100%
GeForce GTX 660 Ti:
73.8 [X] Desktop-PC (GTX 660 Ti) Intel Core i5-2400 3.1GHz
GeForce GTX 660 Ti
fps
83%
GeForce GTX 680:
61.6 [X] Desktop GTX 680 Intel Core i7-2600K 3.4GHz
GeForce GTX 680
fps
100%
GeForce GTX 660 Ti:
43.7 [X] Desktop-PC (GTX 660 Ti) Intel Core i5-2400 3.1GHz
GeForce GTX 660 Ti
fps
108%
GeForce GTX 680:
47.4 [X] Desktop GTX 680 Intel Core i7-2600K 3.4GHz
GeForce GTX 680
fps
100%
GeForce GTX 660 Ti:
67.2 [X] Desktop-PC (GTX 660 Ti) Intel Core i5-2400 3.1GHz
GeForce GTX 660 Ti
fps
109%
GeForce GTX 680:
73.2 [X] Desktop GTX 680 Intel Core i7-2600K 3.4GHz
GeForce GTX 680
fps
100%
GeForce GTX 660 Ti:
62.9 [X] Desktop-PC (GTX 660 Ti) Intel Core i5-2400 3.1GHz
GeForce GTX 660 Ti
fps
109%
GeForce GTX 680:
68.5 [X] Desktop GTX 680 Intel Core i7-2600K 3.4GHz
GeForce GTX 680
fps
100%
GeForce GTX 660 Ti:
55.4 [X] Desktop-PC (GTX 660 Ti) Intel Core i5-2400 3.1GHz
GeForce GTX 660 Ti
fps
112%
GeForce GTX 680:
62 [X] Desktop GTX 680 Intel Core i7-2600K 3.4GHz
GeForce GTX 680
fps
100%
GeForce GTX 660 Ti:
27.8 [X] Desktop-PC (GTX 660 Ti) Intel Core i5-2400 3.1GHz
GeForce GTX 660 Ti
fps
133%
GeForce GTX 680:
36.9 [X] Desktop GTX 680 Intel Core i7-2600K 3.4GHz
GeForce GTX 680
fps
100%
GeForce GTX 660 Ti:
235.5 [X] Desktop-PC (GTX 660 Ti) Intel Core i5-2400 3.1GHz
GeForce GTX 660 Ti
fps
103%
GeForce GTX 680:
242 [X] Desktop GTX 680 Intel Core i7-2600K 3.4GHz
GeForce GTX 680
243 [X] Desktop GTX 680 Intel Core i7-2600K 3.4GHz
GeForce GTX 680
~ 243 fps
100%
GeForce GTX 660 Ti:
206.7 [X] Desktop-PC (GTX 660 Ti) Intel Core i5-2400 3.1GHz
GeForce GTX 660 Ti
fps
107%
GeForce GTX 680:
217 [X] Desktop GTX 680 Intel Core i7-2600K 3.4GHz
GeForce GTX 680
224 [X] Desktop GTX 680 Intel Core i7-2600K 3.4GHz
GeForce GTX 680
~ 221 fps
100%
GeForce GTX 660 Ti:
140.4 [X] Desktop-PC (GTX 660 Ti) Intel Core i5-2400 3.1GHz
GeForce GTX 660 Ti
fps
112%
GeForce GTX 680:
153 [X] Desktop GTX 680 Intel Core i7-2600K 3.4GHz
GeForce GTX 680
161 [X] Desktop GTX 680 Intel Core i7-2600K 3.4GHz
GeForce GTX 680
~ 157 fps
100%
GeForce GTX 660 Ti:
95.4 [X] Desktop-PC (GTX 660 Ti) Intel Core i5-2400 3.1GHz
GeForce GTX 660 Ti
fps
114%
GeForce GTX 680:
102.1 [X] Desktop GTX 680 Intel Core i7-2600K 3.4GHz
GeForce GTX 680
115 [X] Desktop GTX 680 Intel Core i7-2600K 3.4GHz
GeForce GTX 680
~ 109 fps
100%
GeForce GTX 660 Ti:
60 [X] Desktop-PC (GTX 660 Ti) Intel Core i5-2400 3.1GHz
GeForce GTX 660 Ti
fps
100%
GeForce GTX 680:
59.9 [X] Desktop GTX 680 Intel Core i7-2600K 3.4GHz
GeForce GTX 680
fps
100%
GeForce GTX 660 Ti:
59.9 [X] Desktop-PC (GTX 660 Ti) Intel Core i5-2400 3.1GHz
GeForce GTX 660 Ti
fps
100%
GeForce GTX 680:
59.9 [X] Desktop GTX 680 Intel Core i7-2600K 3.4GHz
GeForce GTX 680
fps
100%
GeForce GTX 660 Ti:
57.4 [X] Desktop-PC (GTX 660 Ti) Intel Core i5-2400 3.1GHz
GeForce GTX 660 Ti
fps
104%
GeForce GTX 680:
59.9 [X] Desktop GTX 680 Intel Core i7-2600K 3.4GHz
GeForce GTX 680
fps
100%
GeForce GTX 660 Ti:
56.6 [X] Desktop-PC (GTX 660 Ti) Intel Core i5-2400 3.1GHz
GeForce GTX 660 Ti
fps
105%
GeForce GTX 680:
59.6 [X] Desktop GTX 680 Intel Core i7-2600K 3.4GHz
GeForce GTX 680
min:
55 fps, max:
61 fps
fps
100%
GeForce GTX 660 Ti:
189.7 [X] Desktop-PC (GTX 660 Ti) Intel Core i5-2400 3.1GHz
GeForce GTX 660 Ti
fps
104%
GeForce GTX 680:
197 [X] Desktop GTX 680 Intel Core i7-2600K 3.4GHz
GeForce GTX 680
fps
100%
GeForce GTX 660 Ti:
151.5 [X] Desktop-PC (GTX 660 Ti) Intel Core i5-2400 3.1GHz
GeForce GTX 660 Ti
fps
112%
GeForce GTX 680:
170 [X] Desktop GTX 680 Intel Core i7-2600K 3.4GHz
GeForce GTX 680
fps
100%
GeForce GTX 660 Ti:
128.2 [X] Desktop-PC (GTX 660 Ti) Intel Core i5-2400 3.1GHz
GeForce GTX 660 Ti
fps
117%
GeForce GTX 680:
150 [X] Desktop GTX 680 Intel Core i7-2600K 3.4GHz
GeForce GTX 680
fps
100%
GeForce GTX 660 Ti:
54.1 [X] Desktop-PC (GTX 660 Ti) Intel Core i5-2400 3.1GHz
GeForce GTX 660 Ti
fps
123%
GeForce GTX 680:
66.7 [X] Desktop GTX 680 Intel Core i7-2600K 3.4GHz
GeForce GTX 680
fps
100%
GeForce GTX 660 Ti:
126.5 [X] Desktop-PC (GTX 660 Ti) Intel Core i5-2400 3.1GHz
GeForce GTX 660 Ti
fps
101%
GeForce GTX 680:
127.7 [X] Desktop GTX 680 Intel Core i7-2600K 3.4GHz
GeForce GTX 680
fps
100%
GeForce GTX 660 Ti:
126.5 [X] Desktop-PC (GTX 660 Ti) Intel Core i5-2400 3.1GHz
GeForce GTX 660 Ti
fps
101%
GeForce GTX 680:
127.7 [X] Desktop GTX 680 Intel Core i7-2600K 3.4GHz
GeForce GTX 680
fps
100%
GeForce GTX 660 Ti:
126.8 [X] Desktop-PC (GTX 660 Ti) Intel Core i5-2400 3.1GHz
GeForce GTX 660 Ti
fps
101%
GeForce GTX 680:
127.7 [X] Desktop GTX 680 Intel Core i7-2600K 3.4GHz
GeForce GTX 680
fps
100%
GeForce GTX 660 Ti:
126.2 [X] Desktop-PC (GTX 660 Ti) Intel Core i5-2400 3.1GHz
GeForce GTX 660 Ti
fps
101%
GeForce GTX 680:
127.7 [X] Desktop GTX 680 Intel Core i7-2600K 3.4GHz
GeForce GTX 680
fps
100%
GeForce GTX 660 Ti:
113.8 [X] Desktop-PC (GTX 660 Ti) Intel Core i5-2400 3.1GHz
GeForce GTX 660 Ti
fps
102%
GeForce GTX 680:
116 [X] Desktop GTX 680 Intel Core i7-2600K 3.4GHz
GeForce GTX 680
fps
100%
GeForce GTX 660 Ti:
73.1 [X] Desktop-PC (GTX 660 Ti) Intel Core i5-2400 3.1GHz
GeForce GTX 660 Ti
fps
109%
GeForce GTX 680:
80 [X] Desktop GTX 680 Intel Core i7-2600K 3.4GHz
GeForce GTX 680
fps
100%
GeForce GTX 660 Ti:
66.7 [X] Desktop-PC (GTX 660 Ti) Intel Core i5-2400 3.1GHz
GeForce GTX 660 Ti
fps
117%
GeForce GTX 680:
78 [X] Desktop GTX 680 Intel Core i7-2600K 3.4GHz
GeForce GTX 680
fps
100%
GeForce GTX 660 Ti:
60.5 [X] Desktop-PC (GTX 660 Ti) Intel Core i5-2400 3.1GHz
GeForce GTX 660 Ti
fps
107%
GeForce GTX 680:
65 [X] Desktop GTX 680 Intel Core i7-2600K 3.4GHz
GeForce GTX 680
fps
100%
GeForce GTX 660 Ti:
491.2 [X] Desktop-PC (GTX 660 Ti) Intel Core i5-2400 3.1GHz
GeForce GTX 660 Ti
fps
101%
GeForce GTX 680:
495 [X] Desktop GTX 680 Intel Core i7-2600K 3.4GHz
GeForce GTX 680
fps
100%
GeForce GTX 660 Ti:
382 [X] Desktop-PC (GTX 660 Ti) Intel Core i5-2400 3.1GHz
GeForce GTX 660 Ti
fps
105%
GeForce GTX 680:
400 [X] Desktop GTX 680 Intel Core i7-2600K 3.4GHz
GeForce GTX 680
fps
100%
GeForce GTX 660 Ti:
361.3 [X] Desktop-PC (GTX 660 Ti) Intel Core i5-2400 3.1GHz
GeForce GTX 660 Ti
fps
118%
GeForce GTX 680:
425 [X] Desktop GTX 680 Intel Core i7-2600K 3.4GHz
GeForce GTX 680
fps
100%
GeForce GTX 660 Ti:
322.7 [X] Desktop-PC (GTX 660 Ti) Intel Core i5-2400 3.1GHz
GeForce GTX 660 Ti
fps
124%
GeForce GTX 680:
400 [X] Desktop GTX 680 Intel Core i7-2600K 3.4GHz
GeForce GTX 680
fps
100%
GeForce GTX 660 Ti:
140 [X] Desktop-PC (GTX 660 Ti) Intel Core i5-2400 3.1GHz
GeForce GTX 660 Ti
fps
94%
GeForce GTX 680:
132 [X] Desktop GTX 680 Intel Core i7-2600K 3.4GHz
GeForce GTX 680
min:
112 fps
fps
100%
GeForce GTX 660 Ti:
112 [X] Desktop-PC (GTX 660 Ti) Intel Core i5-2400 3.1GHz
GeForce GTX 660 Ti
fps
96%
GeForce GTX 680:
107 [X] Desktop GTX 680 Intel Core i7-2600K 3.4GHz
GeForce GTX 680
fps
100%
GeForce GTX 660 Ti:
103 [X] Desktop-PC (GTX 660 Ti) Intel Core i5-2400 3.1GHz
GeForce GTX 660 Ti
fps
111%
GeForce GTX 680:
114 [X] Desktop GTX 680 Intel Core i7-2600K 3.4GHz
GeForce GTX 680
fps
100%
GeForce GTX 660 Ti:
79 [X] Desktop-PC (GTX 660 Ti) Intel Core i5-2400 3.1GHz
GeForce GTX 660 Ti
fps
122%
GeForce GTX 680:
96 [X] Desktop GTX 680 Intel Core i7-2600K 3.4GHz
GeForce GTX 680
min:
77 fps
fps
100%
GeForce GTX 660 Ti:
122.7 [X] Desktop-PC (GTX 660 Ti) Intel Core i5-2400 3.1GHz
GeForce GTX 660 Ti
fps
106%
GeForce GTX 680:
130.6 [X] Desktop GTX 680 Intel Core i7-2600K 3.4GHz
GeForce GTX 680
fps
100%
GeForce GTX 660 Ti:
108.7 [X] Desktop-PC (GTX 660 Ti) Intel Core i5-2400 3.1GHz
GeForce GTX 660 Ti
fps
110%
GeForce GTX 680:
119.4 [X] Desktop GTX 680 Intel Core i7-2600K 3.4GHz
GeForce GTX 680
fps
100%
GeForce GTX 660 Ti:
104.3 [X] Desktop-PC (GTX 660 Ti) Intel Core i5-2400 3.1GHz
GeForce GTX 660 Ti
fps
108%
GeForce GTX 680:
113 [X] Desktop GTX 680 Intel Core i7-2600K 3.4GHz
GeForce GTX 680
fps
100%
GeForce GTX 660 Ti:
89.4 [X] Desktop-PC (GTX 660 Ti) Intel Core i5-2400 3.1GHz
GeForce GTX 660 Ti
fps
113%
GeForce GTX 680:
100.7 [X] Desktop GTX 680 Intel Core i7-2600K 3.4GHz
GeForce GTX 680
fps
100%
GeForce GTX 660 Ti:
72.8 [X] Desktop-PC (GTX 660 Ti) Intel Core i5-2400 3.1GHz
GeForce GTX 660 Ti
fps
104%
GeForce GTX 680:
76 [X] Desktop GTX 680 Intel Core i7-2600K 3.4GHz
GeForce GTX 680
fps
100%
GeForce GTX 660 Ti:
44 [X] Desktop-PC (GTX 660 Ti) Intel Core i5-2400 3.1GHz
GeForce GTX 660 Ti
fps
109%
GeForce GTX 680:
48 [X] Desktop GTX 680 Intel Core i7-2600K 3.4GHz
GeForce GTX 680
fps
100%
GeForce GTX 660 Ti:
35.8 [X] Desktop-PC (GTX 660 Ti) Intel Core i5-2400 3.1GHz
GeForce GTX 660 Ti
fps
115%
GeForce GTX 680:
41.2 [X] Desktop GTX 680 Intel Core i7-2600K 3.4GHz
GeForce GTX 680
fps
100%
GeForce GTX 660 Ti:
246.3 [X] Desktop-PC (GTX 660 Ti) Intel Core i5-2400 3.1GHz
GeForce GTX 660 Ti
fps
100%
GeForce GTX 660 Ti:
220.8 [X] Desktop-PC (GTX 660 Ti) Intel Core i5-2400 3.1GHz
GeForce GTX 660 Ti
fps
100%
GeForce GTX 660 Ti:
198.9 [X] Desktop-PC (GTX 660 Ti) Intel Core i5-2400 3.1GHz
GeForce GTX 660 Ti
fps
115%
GeForce GTX 680:
228 [X] Desktop GTX 680 Intel Core i7-2600K 3.4GHz
GeForce GTX 680
fps
100%
GeForce GTX 660 Ti:
191.6 [X] Desktop-PC (GTX 660 Ti) Intel Core i5-2400 3.1GHz
GeForce GTX 660 Ti
fps
117%
GeForce GTX 680:
224 [X] Desktop GTX 680 Intel Core i7-2600K 3.4GHz
GeForce GTX 680
min:
179 fps, max:
258 fps
fps
100%
GeForce GTX 660 Ti:
228.8 [X] Desktop-PC (GTX 660 Ti) Intel Core i5-2400 3.1GHz
GeForce GTX 660 Ti
fps
122%
GeForce GTX 680:
280 [X] Desktop GTX 680 Intel Core i7-2600K 3.4GHz
GeForce GTX 680
fps
100%
GeForce GTX 660 Ti:
142.8 [X] Desktop-PC (GTX 660 Ti) Intel Core i5-2400 3.1GHz
GeForce GTX 660 Ti
fps
123%
GeForce GTX 680:
175 [X] Desktop GTX 680 Intel Core i7-2600K 3.4GHz
GeForce GTX 680
fps
100%
GeForce GTX 660 Ti:
145 [X] Desktop-PC (GTX 660 Ti) Intel Core i5-2400 3.1GHz
GeForce GTX 660 Ti
fps
102%
GeForce GTX 680:
148.6 [X] Desktop GTX 680 Intel Core i7-2600K 3.4GHz
GeForce GTX 680
min:
57.8 fps, max:
391 fps
fps
100%
GeForce GTX 660 Ti:
96.8 [X] Desktop-PC (GTX 660 Ti) Intel Core i5-2400 3.1GHz
GeForce GTX 660 Ti
fps
114%
GeForce GTX 680:
110.2 [X] Desktop GTX 680 Intel Core i7-2600K 3.4GHz
GeForce GTX 680
min:
52.3 fps, max:
267.2 fps
fps
100%
GeForce GTX 660 Ti:
89.9 [X] Desktop-PC (GTX 660 Ti) Intel Core i5-2400 3.1GHz
GeForce GTX 660 Ti
fps
106%
GeForce GTX 680:
95.7 [X] Desktop GTX 680 Intel Core i7-2600K 3.4GHz
GeForce GTX 680
min:
54.7 fps, max:
159.3 fps
fps
100%
GeForce GTX 660 Ti:
33.1 [X] Desktop-PC (GTX 660 Ti) Intel Core i5-2400 3.1GHz
GeForce GTX 660 Ti
fps
119%
GeForce GTX 680:
39.4 [X] Desktop GTX 680 Intel Core i7-2600K 3.4GHz
GeForce GTX 680
min:
26.2 fps, max:
51.8 fps
fps
GeForce GTX 680:
76 [X] Desktop GTX 680 Intel Core i7-2600K 3.4GHz
GeForce GTX 680
fps
GeForce GTX 680:
73 [X] Desktop GTX 680 Intel Core i7-2600K 3.4GHz
GeForce GTX 680
fps
GeForce GTX 680:
64 [X] Desktop GTX 680 Intel Core i7-2600K 3.4GHz
GeForce GTX 680
fps
GeForce GTX 680:
48 [X] Desktop GTX 680 Intel Core i7-2600K 3.4GHz
GeForce GTX 680
fps
100%
GeForce GTX 660 Ti:
62.4 [X] Desktop-PC (GTX 660 Ti) Intel Core i5-2400 3.1GHz
GeForce GTX 660 Ti
fps
100%
GeForce GTX 680:
62.5 [X] Desktop GTX 680 Intel Core i7-2600K 3.4GHz
GeForce GTX 680
fps
100%
GeForce GTX 660 Ti:
61.9 [X] Desktop-PC (GTX 660 Ti) Intel Core i5-2400 3.1GHz
GeForce GTX 660 Ti
fps
101%
GeForce GTX 680:
62.5 [X] Desktop GTX 680 Intel Core i7-2600K 3.4GHz
GeForce GTX 680
fps
100%
GeForce GTX 660 Ti:
56.5 [X] Desktop-PC (GTX 660 Ti) Intel Core i5-2400 3.1GHz
GeForce GTX 660 Ti
fps
110%
GeForce GTX 680:
62 [X] Desktop GTX 680 1.5
Intel Core i7-2600K 3.4GHz
GeForce GTX 680
fps
100%
GeForce GTX 660 Ti:
71.2 [X] Desktop-PC (GTX 660 Ti) Intel Core i5-2400 3.1GHz
GeForce GTX 660 Ti
fps
112%
GeForce GTX 680:
80 [X] Desktop GTX 680 Intel Core i7-2600K 3.4GHz
GeForce GTX 680
fps
100%
GeForce GTX 660 Ti:
69.6 [X] Desktop-PC (GTX 660 Ti) Intel Core i5-2400 3.1GHz
GeForce GTX 660 Ti
fps
112%
GeForce GTX 680:
78 [X] Desktop GTX 680 Intel Core i7-2600K 3.4GHz
GeForce GTX 680
fps
100%
GeForce GTX 660 Ti:
63.1 [X] Desktop-PC (GTX 660 Ti) Intel Core i5-2400 3.1GHz
GeForce GTX 660 Ti
fps
114%
GeForce GTX 680:
72 [X] Desktop GTX 680 Intel Core i7-2600K 3.4GHz
GeForce GTX 680
fps
100%
GeForce GTX 660 Ti:
56.6 [X] Desktop-PC (GTX 660 Ti) Intel Core i5-2400 3.1GHz
GeForce GTX 660 Ti
fps
115%
GeForce GTX 680:
65 [X] Desktop GTX 680 Intel Core i7-2600K 3.4GHz
GeForce GTX 680
fps
100%
GeForce GTX 660 Ti:
90.9 [X] Desktop-PC (GTX 660 Ti) Intel Core i5-2400 3.1GHz
GeForce GTX 660 Ti
fps
112%
GeForce GTX 680:
102 [X] Desktop GTX 680 Intel Core i7-2600K 3.4GHz
GeForce GTX 680
fps
100%
GeForce GTX 660 Ti:
72.9 [X] Desktop-PC (GTX 660 Ti) Intel Core i5-2400 3.1GHz
GeForce GTX 660 Ti
fps
106%
GeForce GTX 680:
77 [X] Desktop GTX 680 Intel Core i7-2600K 3.4GHz
GeForce GTX 680
fps
100%
GeForce GTX 660 Ti:
71.7 [X] Desktop-PC (GTX 660 Ti) Intel Core i5-2400 3.1GHz
GeForce GTX 660 Ti
fps
105%
GeForce GTX 680:
75 [X] Desktop GTX 680 Intel Core i7-2600K 3.4GHz
GeForce GTX 680
fps
100%
GeForce GTX 660 Ti:
62.1 [X] Desktop-PC (GTX 660 Ti) Intel Core i5-2400 3.1GHz
GeForce GTX 660 Ti
fps
121%
GeForce GTX 680:
75 [X] Desktop GTX 680 Intel Core i7-2600K 3.4GHz
GeForce GTX 680
fps
100%
GeForce GTX 660 Ti:
312.8 [X] Desktop-PC (GTX 660 Ti) Intel Core i5-2400 3.1GHz
GeForce GTX 660 Ti
fps
69%
GeForce GTX 680:
216 [X] Desktop GTX 680 1.0.3
Intel Core i7-2600K 3.4GHz
GeForce GTX 680
fps
100%
GeForce GTX 660 Ti:
250.8 [X] Desktop-PC (GTX 660 Ti) Intel Core i5-2400 3.1GHz
GeForce GTX 660 Ti
fps
80%
GeForce GTX 680:
200 [X] Desktop GTX 680 1.0.3
Intel Core i7-2600K 3.4GHz
GeForce GTX 680
fps
100%
GeForce GTX 660 Ti:
246.1 [X] Desktop-PC (GTX 660 Ti) Intel Core i5-2400 3.1GHz
GeForce GTX 660 Ti
fps
81%
GeForce GTX 680:
200 [X] Desktop GTX 680 1.0.3
Intel Core i7-2600K 3.4GHz
GeForce GTX 680
fps
100%
GeForce GTX 660 Ti:
217.7 [X] Desktop-PC (GTX 660 Ti) Intel Core i5-2400 3.1GHz
GeForce GTX 660 Ti
fps
86%
GeForce GTX 680:
188 [X] Desktop GTX 680 1.0.3
Intel Core i7-2600K 3.4GHz
GeForce GTX 680
fps
100%
GeForce GTX 660 Ti:
89.8 [X] Desktop-PC (GTX 660 Ti) Intel Core i5-2400 3.1GHz
GeForce GTX 660 Ti
fps
106%
GeForce GTX 680:
95 [X] Desktop GTX 680 Intel Core i7-2600K 3.4GHz
GeForce GTX 680
fps
100%
GeForce GTX 660 Ti:
96.2 [X] Desktop-PC (GTX 660 Ti) Intel Core i5-2400 3.1GHz
GeForce GTX 660 Ti
fps
103%
GeForce GTX 680:
99 [X] Desktop GTX 680 Intel Core i7-2600K 3.4GHz
GeForce GTX 680
fps
100%
GeForce GTX 660 Ti:
76.9 [X] Desktop-PC (GTX 660 Ti) Intel Core i5-2400 3.1GHz
GeForce GTX 660 Ti
fps
101%
GeForce GTX 680:
78 [X] Desktop GTX 680 Intel Core i7-2600K 3.4GHz
GeForce GTX 680
fps
100%
GeForce GTX 660 Ti:
53.2 [X] Desktop-PC (GTX 660 Ti) Intel Core i5-2400 3.1GHz
GeForce GTX 660 Ti
fps
126%
GeForce GTX 680:
67 [X] Desktop GTX 680 Intel Core i7-2600K 3.4GHz
GeForce GTX 680
fps
100%
GeForce GTX 660 Ti:
60 [X] Desktop-PC (GTX 660 Ti) Intel Core i5-2400 3.1GHz
GeForce GTX 660 Ti
fps
100%
GeForce GTX 680:
60 [X] Desktop GTX 680 Intel Core i7-2600K 3.4GHz
GeForce GTX 680
fps
100%
GeForce GTX 660 Ti:
59.9 [X] Desktop-PC (GTX 660 Ti) Intel Core i5-2400 3.1GHz
GeForce GTX 660 Ti
fps
100%
GeForce GTX 680:
60 [X] Desktop GTX 680 Intel Core i7-2600K 3.4GHz
GeForce GTX 680
fps
100%
GeForce GTX 660 Ti:
59.9 [X] Desktop-PC (GTX 660 Ti) Intel Core i5-2400 3.1GHz
GeForce GTX 660 Ti
fps
100%
GeForce GTX 680:
60 [X] Desktop GTX 680 Intel Core i7-2600K 3.4GHz
GeForce GTX 680
fps
100%
GeForce GTX 660 Ti:
124.6 [X] Desktop-PC (GTX 660 Ti) Intel Core i5-2400 3.1GHz
GeForce GTX 660 Ti
fps
107%
GeForce GTX 680:
133 [X] Desktop GTX 680 Intel Core i7-2600K 3.4GHz
GeForce GTX 680
fps
100%
GeForce GTX 660 Ti:
95.7 [X] Desktop-PC (GTX 660 Ti) Intel Core i5-2400 3.1GHz
GeForce GTX 660 Ti
fps
111%
GeForce GTX 680:
106 [X] Desktop GTX 680 Intel Core i7-2600K 3.4GHz
GeForce GTX 680
fps
100%
GeForce GTX 660 Ti:
54.7 [X] Desktop-PC (GTX 660 Ti) Intel Core i5-2400 3.1GHz
GeForce GTX 660 Ti
fps
130%
GeForce GTX 680:
71 [X] Desktop GTX 680 Intel Core i7-2600K 3.4GHz
GeForce GTX 680
fps
100%
GeForce GTX 660 Ti:
249 [X] Desktop-PC (GTX 660 Ti) Intel Core i5-2400 3.1GHz
GeForce GTX 660 Ti
fps
122%
GeForce GTX 680:
305 [X] Desktop GTX 680 Intel Core i7-2600K 3.4GHz
GeForce GTX 680
fps
100%
GeForce GTX 660 Ti:
192.5 [X] Desktop-PC (GTX 660 Ti) Intel Core i5-2400 3.1GHz
GeForce GTX 660 Ti
fps
113%
GeForce GTX 680:
217 [X] Desktop GTX 680 Intel Core i7-2600K 3.4GHz
GeForce GTX 680
fps
100%
GeForce GTX 660 Ti:
134.3 [X] Desktop-PC (GTX 660 Ti) Intel Core i5-2400 3.1GHz
GeForce GTX 660 Ti
fps
127%
GeForce GTX 680:
171 [X] Desktop GTX 680 Intel Core i7-2600K 3.4GHz
GeForce GTX 680
fps
100%
GeForce GTX 660 Ti:
75.2 [X] Desktop-PC (GTX 660 Ti) Intel Core i5-2400 3.1GHz
GeForce GTX 660 Ti
fps
120%
GeForce GTX 680:
90 [X] Desktop GTX 680 Intel Core i7-2600K 3.4GHz
GeForce GTX 680
fps
100%
GeForce GTX 660 Ti:
90 [X] Desktop-PC (GTX 660 Ti) Intel Core i5-2400 3.1GHz
GeForce GTX 660 Ti
fps
100%
GeForce GTX 660 Ti:
65 [X] Desktop-PC (GTX 660 Ti) Intel Core i5-2400 3.1GHz
GeForce GTX 660 Ti
fps
122%
GeForce GTX 680:
79 [X] Desktop GTX 680 Intel Core i7-2600K 3.4GHz
GeForce GTX 680
fps
100%
GeForce GTX 660 Ti:
228.1 [X] Desktop-PC (GTX 660 Ti) Intel Core i5-2400 3.1GHz
GeForce GTX 660 Ti
fps
100%
GeForce GTX 660 Ti:
152.3 [X] Desktop-PC (GTX 660 Ti) Intel Core i5-2400 3.1GHz
GeForce GTX 660 Ti
fps
100%
GeForce GTX 660 Ti:
145.9 [X] Desktop-PC (GTX 660 Ti) Intel Core i5-2400 3.1GHz
GeForce GTX 660 Ti
fps
100%
GeForce GTX 660 Ti:
128.1 [X] Desktop-PC (GTX 660 Ti) Intel Core i5-2400 3.1GHz
GeForce GTX 660 Ti
fps
108%
GeForce GTX 680:
138 [X] Desktop GTX 680 Intel Core i7-2600K 3.4GHz
GeForce GTX 680
fps
100%
GeForce GTX 660 Ti:
141.2 [X] Desktop-PC (GTX 660 Ti) Intel Core i5-2400 3.1GHz
GeForce GTX 660 Ti
fps
98%
GeForce GTX 680:
138 [X] Desktop GTX 680 Intel Core i7-2600K 3.4GHz
GeForce GTX 680
fps
100%
GeForce GTX 660 Ti:
112.1 [X] Desktop-PC (GTX 660 Ti) Intel Core i5-2400 3.1GHz
GeForce GTX 660 Ti
fps
109%
GeForce GTX 680:
122 [X] Desktop GTX 680 Intel Core i7-2600K 3.4GHz
GeForce GTX 680
fps
100%
GeForce GTX 660 Ti:
99.5 [X] Desktop-PC (GTX 660 Ti) Intel Core i5-2400 3.1GHz
GeForce GTX 660 Ti
fps
114%
GeForce GTX 680:
113 [X] Desktop GTX 680 Intel Core i7-2600K 3.4GHz
GeForce GTX 680
fps
100%
GeForce GTX 660 Ti:
46.4 [X] Desktop-PC (GTX 660 Ti) Intel Core i5-2400 3.1GHz
GeForce GTX 660 Ti
fps
121%
GeForce GTX 680:
56 [X] Desktop GTX 680 Intel Core i7-2600K 3.4GHz
GeForce GTX 680
fps
GeForce GTX 680:
152 [X] Desktop GTX 680 Intel Core i7-2600K 3.4GHz
GeForce GTX 680
fps
GeForce GTX 680:
76 [X] Desktop GTX 680 Intel Core i7-2600K 3.4GHz
GeForce GTX 680
fps
GeForce GTX 680:
69 [X] Desktop GTX 680 Intel Core i7-2600K 3.4GHz
GeForce GTX 680
min:
14 fps, max:
109 fps
fps
GeForce GTX 680:
334 [X] Desktop GTX 680 Intel Core i7-2600K 3.4GHz
GeForce GTX 680
fps
GeForce GTX 680:
86 [X] Desktop GTX 680 Intel Core i7-2600K 3.4GHz
GeForce GTX 680
min:
75 fps
fps
GeForce GTX 680:
74 [X] Desktop GTX 680 Intel Core i7-2600K 3.4GHz
GeForce GTX 680
min:
55 fps
fps
GeForce GTX 680:
134 (!) [X] Desktop GTX 680 Intel Core i7-2600K 3.4GHz
GeForce GTX 680
fps
GeForce GTX 680:
46 [X] Desktop GTX 680 Intel Core i7-2600K 3.4GHz
GeForce GTX 680
fps
GeForce GTX 680:
47 [X] Desktop GTX 680 Intel Core i7-2600K 3.4GHz
GeForce GTX 680
fps
GeForce GTX 680:
45 [X] Desktop GTX 680 Intel Core i7-2600K 3.4GHz
GeForce GTX 680
fps
GeForce GTX 680:
25 [X] Desktop GTX 680 Intel Core i7-2600K 3.4GHz
GeForce GTX 680
fps
GeForce GTX 680:
102 [X] Desktop GTX 680 Intel Core i7-2600K 3.4GHz
GeForce GTX 680
fps
GeForce GTX 680:
102 [X] Desktop GTX 680 Intel Core i7-2600K 3.4GHz
GeForce GTX 680
fps
GeForce GTX 680:
101 [X] Desktop GTX 680 Intel Core i7-2600K 3.4GHz
GeForce GTX 680
fps
GeForce GTX 680:
82.3 [X] Desktop GTX 680 Intel Core i7-2600K 3.4GHz
GeForce GTX 680
fps
GeForce GTX 680:
114.8 [X] Desktop GTX 680 Intel Core i7-2600K 3.4GHz
GeForce GTX 680
fps
GeForce GTX 680:
64.6 [X] Desktop GTX 680 Intel Core i7-2600K 3.4GHz
GeForce GTX 680
fps
GeForce GTX 680:
144.2 [X] Desktop GTX 680 Intel Core i7-2600K 3.4GHz
GeForce GTX 680
fps
GeForce GTX 680:
348 [X] Desktop GTX 680 1.4.3
Intel Core i7-2600K 3.4GHz
GeForce GTX 680
fps
GeForce GTX 680:
127 [X] Desktop GTX 680 1.4.3
Intel Core i7-2600K 3.4GHz
GeForce GTX 680
fps
GeForce GTX 680:
126 [X] Desktop GTX 680 1.4.3
Intel Core i7-2600K 3.4GHz
GeForce GTX 680
fps
GeForce GTX 680:
114 [X] Desktop GTX 680 1.4.3
Intel Core i7-2600K 3.4GHz
GeForce GTX 680
fps
GeForce GTX 680:
72.1 [X] Desktop GTX 680 Intel Core i7-2600K 3.4GHz
GeForce GTX 680
fps
GeForce GTX 680:
37 [X] Desktop GTX 680 Intel Core i7-2600K 3.4GHz
GeForce GTX 680
fps
GeForce GTX 680:
137 [X] Desktop GTX 680 Intel Core i7-2600K 3.4GHz
GeForce GTX 680
fps
GeForce GTX 680:
93 [X] Desktop GTX 680 Intel Core i7-2600K 3.4GHz
GeForce GTX 680
fps
GeForce GTX 680:
85 [X] Desktop GTX 680 Intel Core i7-2600K 3.4GHz
GeForce GTX 680
fps
GeForce GTX 680:
78 [X] Desktop GTX 680 Intel Core i7-2600K 3.4GHz
GeForce GTX 680
fps
GeForce GTX 680:
148 [X] Desktop GTX 680 Intel Core i7-2600K 3.4GHz
GeForce GTX 680
fps
GeForce GTX 680:
176 [X] Desktop GTX 680 Intel Core i7-2600K 3.4GHz
GeForce GTX 680
fps
GeForce GTX 680:
130.5 [X] Desktop GTX 680 Intel Core i7-2600K 3.4GHz
GeForce GTX 680
fps
GeForce GTX 680:
133.8 [X] Desktop GTX 680 Intel Core i7-2600K 3.4GHz
GeForce GTX 680
fps
GeForce GTX 680:
43 [X] Desktop GTX 680 Intel Core i7-2600K 3.4GHz
GeForce GTX 680
fps
GeForce GTX 680:
65 [X] Desktop GTX 680 Intel Core i7-2600K 3.4GHz
GeForce GTX 680
fps
GeForce GTX 680:
50.9 [X] Desktop GTX 680 Intel Core i7-2600K 3.4GHz
GeForce GTX 680
fps
GeForce GTX 680:
66.3 [X] Desktop GTX 680 Intel Core i7-2600K 3.4GHz
GeForce GTX 680
fps
GeForce GTX 680:
70.9 [X] Desktop GTX 680 Intel Core i7-2600K 3.4GHz
GeForce GTX 680
fps
GeForce GTX 680:
390 [X] Desktop GTX 680 Intel Core i7-2600K 3.4GHz
GeForce GTX 680
fps
GeForce GTX 680:
394 [X] Desktop GTX 680 Intel Core i7-2600K 3.4GHz
GeForce GTX 680
fps
GeForce GTX 680:
393 [X] Desktop GTX 680 Intel Core i7-2600K 3.4GHz
GeForce GTX 680
fps
GeForce GTX 680:
386 [X] Desktop GTX 680 Intel Core i7-2600K 3.4GHz
GeForce GTX 680
fps
GeForce GTX 680:
890 [X] Desktop GTX 680 Intel Core i7-2600K 3.4GHz
GeForce GTX 680
fps
Average Gaming NVIDIA GeForce GTX 660 Ti → 100% Average Gaming 30-70 fps → 100%
Average Gaming NVIDIA GeForce GTX 680 → 107% Average Gaming 30-70 fps → 109%
 Deutsch
 English
 Español
 Français
 Italiano
 Nederlands
 Polski
 Português
 Русский
 Türkçe
 Svenska
 Chinese
 Magyar