Notebookcheck Logo

NVIDIA GeForce GTX 480M vs NVIDIA GeForce GTX 485M SLI

NVIDIA GeForce GTX 480M

► remove from comparison NVIDIA GeForce GTX 480M

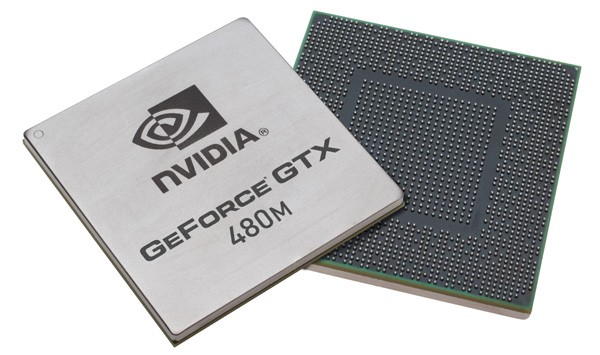
The NVIDIA GeForce GTX 480M is a high-end graphics card for laptops based on the Fermi architecture. As a result, it supports DirectX 11 and is produced in 40nm at TSMC. Featuring 352 cores, the GTX480M is similar to the desktop GTX 465 but with a lower clock rate. The GeForce GTX 480M is combined with 2 GB of fast dedicated GDDR5 graphics memory and the overall performance should be generally superior to the Mobility Radeon HD 5870.

The GF100 (aka. Fermi) chip was redesigned from scratch and features 3 billion transistors, assuming all 512 shaders are present. Compared to the desktop HD 5870 with 2.13 billion transistors or the Mobility Radeon HD 5870 (RV870) with 1.04 billion transistors, the GTX 480M die is physically quite large.

The mobile Fermi chip is stripped down to 352 shader cores (1-dimensional) with 32 ROPs and 44 Texture Units. The memory bus is 256 bit wide, but due to the fast GDDR5 memory, this should not be a bottleneck. The power consumption has been specified to 100 Watt TDP when taking into account the MXM board and the 2 GB GDDR5. AMD usually specifies the TDP of the chip alone, therefore this value is not directly comparable with competing Radeon cards. Still, the GTX 480M is only suited for very large desktop replacement (DTR) laptops with an excellent cooling solution. Originally, only Clevo was offering the GTX 480M in its 17" (D901F) and 18" (X8100) barebones.

The performance of the Nvidia GeForce GTX 480M is about 10% better on average than the ATI Mobility Radeon HD 5870. In demanding DirectX 11 games and benchmarks (that make use of the Tessellation engine), the GTX 480M is even faster. That means the GTX480M is the fastest single GPU graphics solution for laptops as of  early to mid 2010. Modern DirectX 10 games should run fluently in high resolutions and details with antialiasing. Only very demanding games like Crysis or Metro 2033 may need some reduced settings (see list below). Due to the DirectX 11 hardware support (and the good tessellation implementation), the Fermi based laptop graphics card should be well suited for upcoming DirectX 11 games.

As the GeForce 300M series, the GeForce GTX 480M supports PureVideo HD with VideoProcessor 4 (VP4 with Feature Set C). This means the GPU is able to fully decode HD videos in H.254, VC-1, MPEG-2, and MPEG-4 ASP. The graphics card can also accelerate Flash videos by using Flash 10.1 or greater.

The rendering cores of the Nvidia GeForce GTX 480M can be used for general calculations with CUDA or DirectCompute. For example, the encoding of HD videos can be done significantly faster than most modern CPUs by using the shader cores of the GPU instead. PhysX is also supported by the mobile Fermi chip to calculate physics effects in supported games.

Compared to desktop GPUs, the Geforce GTX 480M is comparable to a nunderclocked Nvidia GeForce GTX 465 (607/1200 clock speed) and is therefore on par with a desktop Radeon HD 5770.

NVIDIA GeForce GTX 485M SLI

► remove from comparison NVIDIA GeForce GTX 485M SLI

The NVIDIA GeForce GTX 485M SLI is a high-end laptop graphics solution based on two GTX 485M graphics cards. With SLI, each card usually renders a single frame (AFR mode). Therefore, it may suffer from micro stuttering in low fps ranges of 30fps. This happens because of different timespans between two frames (e.g. irregular delays between sequential frames).

The GeForce GTX485M SLI supports the same features as a single GTX 485M card. Therefore, it supports DirectX 11 and is produced in a 40nm fabrication process at TSMC. 

Unlike the GeForce GTX 480M, the 485M is no longer based on a trimmed down GF100 core, but on the GF104 core instead. The latter has been designed for the consumer sector and has 384 cores maximum if completely enabled. More information on the GF104 core can be found on the GTX 485M page.  

The performance of the Nvidia GeForce GTX 485M SLI is clearly better than the GTX 480M SLI and is therefore the fastest graphics solution for laptops as of early 2011. It allows the user to play all current games in high resolutions and detail settings with Antialiasing activated. Only Metro 2033 and Crysis may stutter with high Antialiasing and maximum details. Compared to a single GTX 485M, the performance from the SLI combination should be about 40% higher on average (with high details and Antialiasing). Compared to Crossfire solutions by AMD, the Nvdia SLI drivers have the advantage as of this writing.

As the GeForce 300M series, the GeForce GTX 485M supports PureVideo HD with VideoProcessor 4 (VP4 with Feature Set C). This means that the GPU is able to fully decode HD videos in H.254, VC-1, MPEG-2, and MPEG-4 ASP. Using Flash 10.1, the graphics card can also accelerate Flash videos.

What's new in the GF104 chips compared to the GF100 (480M) is the support for Bitstream transfer of HD Audio (Blu-Ray) via HDMI. Similar to the HD 5850, the GTX 485M can transmit Dolby True HD and DTS-HD via Bitstream to compatible receivers without quality loss.

The rendering cores of the Nvidia GeForce GTX 485M can be used for general calculations using CUDA or DirectCompute. In other words, the encoding for HD videos can be done significantly faster by using the shader cores of the GPUs instead of using modern CPUs. PhysX is also supported by the mobile Fermi to calculate physics effects in supported games. Furthermore, a single GTX485M can be used to calculate PhysX while the other card can render frames in the SLI setup.

Compared to desktop GPUs, the Geforce GTX 485M SLI is most similar to two Nvidia GeForce GTX 460 cards running in an SLI configuration.

NVIDIA GeForce GTX 480MNVIDIA GeForce GTX 485M SLI
GeForce GTX 400M Series
GeForce GTX 485M SLI 768 @ 0.58 GHz256 Bit @ 1500 MHz
GeForce GTX 470M SLI compare 576 @ 0.54 GHz192 Bit @ 1250 MHz
GeForce GTX 480M SLI compare 704 @ 0.43 GHz256 Bit @ 1200 MHz
GeForce GTX 460M SLI compare 384 @ 0.68 GHz192 Bit @ 1250 MHz
GeForce GTX 485M compare 384 @ 0.58 GHz256 Bit @ 1500 MHz
GeForce GTX 470M compare 288 @ 0.54 GHz192 Bit @ 1250 MHz
GeForce GTX 480M 352 @ 0.43 GHz256 Bit @ 1200 MHz
GeForce GTX 460M compare 192 @ 0.68 GHz192 Bit @ 1250 MHz
CodenameN11E-GTX-A3N11E-GTX-A1
ArchitectureFermiFermi
Pipelines352 - unified768 - unified
Core Speed425 MHz575 MHz
Shader Speed850 MHz1150 MHz
Memory Speed1200 MHz1500 MHz
Memory Bus Width256 Bit256 Bit
Memory TypeGDDR5GDDR5
Max. Amount of Memory2048 MB2x2048 MB
Shared Memorynono
APIDirectX 11, Shader 5.0DirectX 11, Shader 5.0
Power Consumption100 Watt100 Watt
Transistors3 Billion
technology40 nm40 nm
Notebook Sizelargelarge
Date of Announcement25.05.2010 06.01.2011
Link to Manufacturer Pagewww.nvidia.comwww.nvidia.com

Benchmarks

3DMark 11 - 3DM11 Performance Score
min: 2336     avg: 2387     median: 2387 (3%)     max: 2438 Points
5468 Points (8%)
3DMark 11 - 3DM11 Performance GPU
min: 2177     avg: 2185     median: 2184.5 (2%)     max: 2192 Points
5334 Points (5%)
3DMark Vantage
3DM Vant. Perf. total + NVIDIA GeForce GTX 480M
3DMark Vantage - 3DM Vant. Perf. total
min: 8467     avg: 8872     median: 8872 (3%)     max: 9277 Points
3DM Vant. Perf. total + NVIDIA GeForce GTX 485M SLI
min: 24816     avg: 24830     median: 24830 (7%)     max: 24844 Points
3DM Vant. Perf. GPU no PhysX + NVIDIA GeForce GTX 480M
3DMark Vantage - 3DM Vant. Perf. GPU no PhysX
min: 7854     avg: 7906     median: 7879 (4%)     max: 7986 Points
3DM Vant. Perf. GPU no PhysX + NVIDIA GeForce GTX 485M SLI
min: 23082     avg: 23092     median: 23092 (13%)     max: 23102 Points
3DMark 2001SE - 3DMark 2001 - Standard
min: 37908     avg: 39907     median: 39907 (41%)     max: 41906 Points
3DMark 03 - 3DMark 03 - Standard
min: 42919     avg: 43733     median: 43552 (23%)     max: 44727 Points
87591 Points (46%)
3DMark 05 - 3DMark 05 - Standard
min: 18745     avg: 20818     median: 19867 (22%)     max: 23842 Points
29690 Points (33%)
3DMark 06 3DMark 06 - Standard 1280x1024 + NVIDIA GeForce GTX 480M
3DMark 06
min: 13273     avg: 15394     median: 15066.5 (20%)     max: 18731 Points
3DMark 06 - Standard 1280x1024 + NVIDIA GeForce GTX 485M SLI
min: 23286     avg: 23415     median: 23415 (31%)     max: 23544 Points
Unigine Heaven 2.1 - Heaven 2.1 high
33.7 fps (6%)
78.5 fps (15%)
SPEC Viewperf 10.0 - SPEC Viewperf 10.0 - 3dsmax
10 Points (21%)
SPEC Viewperf 10.0 - SPEC Viewperf 10.0 - Catia
10.7 Points (23%)
SPEC Viewperf 10.0 - SPEC Viewperf 10.0 - EnSight
20.9 Points (44%)
SPEC Viewperf 10.0 - SPEC Viewperf 10.0 - Maya
17.9 Points (10%)
SPEC Viewperf 10.0 - SPEC Viewperf 10.0 - Pro/Engeneer
12.4 Points (24%)
SPEC Viewperf 10.0 - SPEC Viewperf 10.0 - SolidWorks
8.1 Points (12%)
SPEC Viewperf 10.0 - SPEC Viewperf 10.0 - UGS Teamcenter
1.1 Points (3%)
SPEC Viewperf 10.0 - SPEC Viewperf 10.0 - UGS NX
0.9 Points (2%)
SPECviewperf 11
specvp11 snx-01 + NVIDIA GeForce GTX 485M SLI
SPECviewperf 11 - specvp11 snx-01
2.2 fps (1%)
specvp11 tcvis-02 + NVIDIA GeForce GTX 485M SLI
SPECviewperf 11 - specvp11 tcvis-02
0.7 fps (0%)
specvp11 sw-02 + NVIDIA GeForce GTX 485M SLI
SPECviewperf 11 - specvp11 sw-02
6.4 fps (5%)
specvp11 proe-05 + NVIDIA GeForce GTX 485M SLI
SPECviewperf 11 - specvp11 proe-05
1.4 fps (2%)
specvp11 maya-03 + NVIDIA GeForce GTX 485M SLI
SPECviewperf 11 - specvp11 maya-03
7.4 fps (6%)
specvp11 lightwave-01 + NVIDIA GeForce GTX 485M SLI
SPECviewperf 11 - specvp11 lightwave-01
10.2 fps (11%)
specvp11 ensight-04 + NVIDIA GeForce GTX 485M SLI
SPECviewperf 11 - specvp11 ensight-04
22.6 fps (11%)
specvp11 catia-03 + NVIDIA GeForce GTX 485M SLI
SPECviewperf 11 - specvp11 catia-03
5.2 fps (3%)
Windows 7 Experience Index - Win7 Gaming graphics
min: 7.2     avg: 7.3     median: 7.3 (92%)     max: 7.3 Points
7.5 Points (95%)
Windows 7 Experience Index - Win7 Graphics
min: 7.2     avg: 7.3     median: 7.3 (92%)     max: 7.3 Points
7.5 Points (95%)
Cinebench R10 Cinebench R10 Shading (32bit) + NVIDIA GeForce GTX 480M
Cinebench R10 - Cinebench R10 Shading (32bit)
4919 Points (3%)
Cinebench R10 Shading (32bit) + NVIDIA GeForce GTX 485M SLI
5658 Points (4%)
Cinebench R11.5 Cinebench R11.5 OpenGL 64 Bit + NVIDIA GeForce GTX 480M
Cinebench R11.5 - Cinebench R11.5 OpenGL 64 Bit
min: 30.13     avg: 32.1     median: 32.1 (11%)     max: 34.09 fps
Cinebench R11.5 OpenGL 64 Bit + NVIDIA GeForce GTX 485M SLI
44.8 fps (16%)

Average Benchmarks NVIDIA GeForce GTX 480M → 100% n=12

Average Benchmarks NVIDIA GeForce GTX 485M SLI → 187% n=12

- Range of benchmark values for this graphics card
- Average benchmark values for this graphics card
* Smaller numbers mean a higher performance
1 This benchmark is not used for the average calculation

Game Benchmarks

The following benchmarks stem from our benchmarks of review laptops. The performance depends on the used graphics memory, clock rate, processor, system settings, drivers, and operating systems. So the results don't have to be representative for all laptops with this GPU. For detailed information on the benchmark results, click on the fps number.

low 800x600
GeForce GTX 485M SLI:
167  fps
med. 1024x768
GeForce GTX 485M SLI:
125.1  fps
high 1360x768
GeForce GTX 485M SLI:
128.4  fps
ultra 1920x1080
GeForce GTX 485M SLI:
119  fps
Fifa 11

Fifa 11

2010
low 800x600
GeForce GTX 485M SLI:
638  fps
med. 1024x768
GeForce GTX 485M SLI:
426.6  fps
high 1360x768
GeForce GTX 485M SLI:
307.3  fps
ultra 1920x1080
GeForce GTX 485M SLI:
199.2  fps
Mafia 2

Mafia 2

2010
low 800x600
GeForce GTX 485M SLI:
145.3  fps
med. 1024x768
100%
GeForce GTX 480M:
67.1  fps
208%
GeForce GTX 485M SLI:
139.5  fps
high 1360x768
100%
GeForce GTX 480M:
60  fps
221%
GeForce GTX 485M SLI:
132.4  fps
ultra 1920x1080
100%
GeForce GTX 480M:
40.9  fps
250%
GeForce GTX 485M SLI:
102.2  fps
low 1024x768
GeForce GTX 485M SLI:
323.8  fps
med. 1360x768
100%
GeForce GTX 480M:
45.2  fps
233%
GeForce GTX 485M SLI:
105.3  fps
high 1360x768
100%
GeForce GTX 480M:
44.5  fps
213%
GeForce GTX 485M SLI:
94.8  fps
ultra 1920x1080
100%
GeForce GTX 480M:
36.8  fps
179%
GeForce GTX 485M SLI:
65.9  fps
low 800x600
100%
GeForce GTX 480M:
126  fps
119%
GeForce GTX 485M SLI:
149.6  fps
med. 1360x768
100%
GeForce GTX 480M:
58.6 69 ~ 64 fps
220%
GeForce GTX 485M SLI:
141  fps
high 1600x900
100%
GeForce GTX 480M:
31.3 34 ~ 33 fps
271%
GeForce GTX 485M SLI:
89.4  fps
ultra 1920x1080
100%
GeForce GTX 480M:
11.8 12 ~ 12 fps
262%
GeForce GTX 485M SLI:
31.4  fps
low 1024x768
100%
GeForce GTX 480M:
108  fps
184%
GeForce GTX 485M SLI:
198.2  fps
med. 1366x768
100%
GeForce GTX 480M:
64.8 97 ~ 81 fps
238%
GeForce GTX 485M SLI:
192.4  fps
high 1366x768
100%
GeForce GTX 480M:
58 70 ~ 64 fps
263%
GeForce GTX 485M SLI:
168.6  fps
ultra 1920x1080
100%
GeForce GTX 480M:
37 38 ~ 38 fps
255%
GeForce GTX 485M SLI:
96.8  fps
low 800x600
GeForce GTX 485M SLI:
361.4  fps
med. 1024x768
100%
GeForce GTX 480M:
78.6  fps
270%
GeForce GTX 485M SLI:
212.5  fps
high 1366x768
100%
GeForce GTX 480M:
68 68 ~ 68 fps
280%
GeForce GTX 485M SLI:
190.1  fps
ultra 1920x1080
100%
GeForce GTX 480M:
47.9 51 ~ 49 fps
290%
GeForce GTX 485M SLI:
142  fps
Risen

Risen

2009
low 800x600
GeForce GTX 485M SLI:
189.2  fps
med. 1024x768
100%
GeForce GTX 480M:
68.4  fps
230%
GeForce GTX 485M SLI:
157.5  fps
high 1366x768
100%
GeForce GTX 480M:
48.7  fps
293%
GeForce GTX 485M SLI:
142.7  fps
ultra 1920x1080
100%
GeForce GTX 480M:
33.7 38 ~ 36 fps
303%
GeForce GTX 485M SLI:
109.1  fps
Resident Evil 5

Resident Evil 5

2009
low 800x600
100%
GeForce GTX 480M:
150.5  fps
135%
GeForce GTX 485M SLI:
202.6  fps
high 1360x768
100%
GeForce GTX 480M:
96.3  fps
149%
GeForce GTX 485M SLI:
143.7  fps
ultra 1920x1080
100%
GeForce GTX 480M:
59.7  fps
Need for Speed Shift

Need for Speed Shift

2009
med. 1024x768
100%
GeForce GTX 480M:
74  fps
187%
GeForce GTX 485M SLI:
138.6  fps
high 1366x768
100%
GeForce GTX 480M:
70.7 84 ~ 77 fps
181%
GeForce GTX 485M SLI:
139  fps
ultra 1920x1080
100%
GeForce GTX 480M:
51 52.6 ~ 52 fps
242%
GeForce GTX 485M SLI:
126  fps
Colin McRae: DIRT 2

Colin McRae: DIRT 2

2009
low 800x600
100%
GeForce GTX 480M:
176.5  fps
133%
GeForce GTX 485M SLI:
234.9  fps
med. 1024x768
100%
GeForce GTX 480M:
94.1 130.5 ~ 112 fps
176%
GeForce GTX 485M SLI:
197.6  fps
high 1360x768
100%
GeForce GTX 480M:
81.6 84.4 ~ 83 fps
213%
GeForce GTX 485M SLI:
177.2  fps
ultra 1920x1080
100%
GeForce GTX 480M:
46.8 46.9 ~ 47 fps
243%
GeForce GTX 485M SLI:
114.3  fps
Anno 1404

Anno 1404

2009
low 1024x768
100%
GeForce GTX 480M:
170  fps
134%
GeForce GTX 485M SLI:
228.2  fps
ultra 1280x1024
100%
GeForce GTX 480M:
53  fps
262%
GeForce GTX 485M SLI:
138.9  fps
Sims 3

Sims 3

2009
high 1280x1024
100%
GeForce GTX 480M:
105  fps
F.E.A.R. 2

F.E.A.R. 2

2009
low 800x600
GeForce GTX 485M SLI:
283.8  fps
med. 1024x768
GeForce GTX 485M SLI:
202.4  fps
high 1280x1024
100%
GeForce GTX 480M:
119  fps
165%
GeForce GTX 485M SLI:
195.9  fps
ultra 1920x1080
100%
GeForce GTX 480M:
61  fps
253%
GeForce GTX 485M SLI:
154.3  fps
GTA IV - Grand Theft Auto

GTA IV - Grand Theft Auto

2008
high 1280x1024
100%
GeForce GTX 480M:
53.9  fps
Left 4 Dead

Left 4 Dead

2008
high 1024x768
100%
GeForce GTX 480M:
142  fps
Far Cry 2

Far Cry 2

2008
low 640x480
100%
GeForce GTX 480M:
174  fps
high 1024x768
100%
GeForce GTX 480M:
106  fps
ultra 1920x1080
100%
GeForce GTX 480M:
45.4  fps
Crysis Warhead

Crysis Warhead

2008
low 800x600
100%
GeForce GTX 480M:
98  fps
ultra 1024x768
100%
GeForce GTX 480M:
34  fps
Trackmania Nations Forever

Trackmania Nations Forever

2008
ultra 1920x1080
100%
GeForce GTX 480M:
52.8  fps
Call of Duty 4 - Modern Warfare

Call of Duty 4 - Modern Warfare

2007
high 1280x1024
100%
GeForce GTX 480M:
93  fps
Supreme Commander - FA Bench

Supreme Commander - FA Bench

2007
high 1024x768
100%
GeForce GTX 480M:
52.4  fps
ultra 1920x1080
100%
GeForce GTX 480M:
45.1  fps
Crysis - GPU Benchmark

Crysis - GPU Benchmark

2007
low 1024x768
GeForce GTX 485M SLI:
158.2  fps
med. 1024x768
GeForce GTX 485M SLI:
92.8  fps
high 1024x768
100%
GeForce GTX 480M:
62.3  fps
123%
GeForce GTX 485M SLI:
76.7  fps
ultra 1920x1080
100%
GeForce GTX 480M:
16.1  fps
269%
GeForce GTX 485M SLI:
43.3  fps
Crysis - CPU Benchmark

Crysis - CPU Benchmark

2007
low 1024x768
GeForce GTX 485M SLI:
209.5  fps
med. 1024x768
GeForce GTX 485M SLI:
96.7  fps
high 1024x768
100%
GeForce GTX 480M:
58.3  fps
135%
GeForce GTX 485M SLI:
78.6  fps
ultra 1920x1080
100%
GeForce GTX 480M:
15.5  fps
267%
GeForce GTX 485M SLI:
41.4  fps
World in Conflict - Benchmark

World in Conflict - Benchmark

2007
high 1024x768
100%
GeForce GTX 480M:
84  fps
ultra 1920x1080
100%
GeForce GTX 480M:
35  fps
Half Life 2 - Lost Coast Benchmark

Half Life 2 - Lost Coast Benchmark

2005
high 1024x768
100%
GeForce GTX 480M:
234  fps
Quake 4

Quake 4

2005
ultra 1024x768
100%
GeForce GTX 480M:
62  fps
Counter-Strike Source

Counter-Strike Source

2004
high 1024x768
100%
GeForce GTX 480M:
191  fps
Doom 3

Doom 3

2004
low 640x480
100%
GeForce GTX 480M:
310  fps
ultra 1024x768
100%
GeForce GTX 480M:
290  fps
Quake 3 Arena - Timedemo

Quake 3 Arena - Timedemo

1999
high 1024x768
100%
GeForce GTX 480M:
720  fps

Average Gaming NVIDIA GeForce GTX 480M → 100%

Average Gaming 30-70 fps → 100%

Average Gaming NVIDIA GeForce GTX 485M SLI → 218%

Average Gaming 30-70 fps → 244%

NVIDIA GeForce GTX 485M SLIlowmed.highultraQHD4K
Call of Duty: Black Ops167125.1128.4119
Fifa 11638426.6307.3199.2
Mafia 2145.3139.5132.4102.2
StarCraft 2323.8105.394.865.9
Metro 2033149.614189.431.4
Battlefield: Bad Company 2198.2192.4168.696.8
CoD Modern Warfare 2361.4212.5190.1142
Risen189.2157.5142.7109.1
Resident Evil 5202.6143.7
Need for Speed Shift138.6139126
Colin McRae: DIRT 2234.9197.6177.2114.3
Anno 1404228.2138.9
F.E.A.R. 2283.8202.4195.9154.3
Crysis - GPU Benchmark158.292.876.743.3
Crysis - CPU Benchmark209.596.778.641.4
< 30 fps
< 60 fps
< 120 fps
≥ 120 fps


14


3
10


4
10

3
6
5


NVIDIA GeForce GTX 480Mlowmed.highultraQHD4K
Mafia 267.16040.9
StarCraft 245.244.536.8
Metro 2033126643312
Battlefield: Bad Company 2108816438
CoD Modern Warfare 278.66849
Risen68.448.736
Resident Evil 5150.596.359.7
Need for Speed Shift747752
Colin McRae: DIRT 2176.51128347
Anno 140417053
Sims 3105
F.E.A.R. 211961
GTA IV - Grand Theft Auto53.9
Left 4 Dead142
Far Cry 217410645.4
Crysis Warhead9834
Trackmania Nations Forever52.8
Call of Duty 4 - Modern Warfare93
Supreme Commander - FA Bench52.445.1
Crysis - GPU Benchmark62.316.1
Crysis - CPU Benchmark58.315.5
World in Conflict - Benchmark8435
Half Life 2 - Lost Coast Benchmark234
Quake 462
Counter-Strike Source191
Doom 3310290
Quake 3 Arena - Timedemo720
< 30 fps
< 60 fps
< 120 fps
≥ 120 fps


2
6

1
7

6
12
4
3
14
2
1


For more games that might be playable and a list of all games and graphics cards visit our Gaming List

Add one or more devices and compare

In the following list you can select (and also search for) devices that should be added to the comparison. You can select more than one device.

restrict list:

show all (including archived), 2024, 2023
v1.26
log 19. 19:34:37

#0 checking url part for id 1797 +0s ... 0s

#1 checking url part for id 2528 +0s ... 0s

#2 not redirecting to Ajax server +0s ... 0s

#3 did not recreate cache, as it is less than 5 days old! Created at Fri, 19 Apr 2024 05:40:26 +0200 +0.001s ... 0.001s

#4 composed specs +0.084s ... 0.085s

#5 did output specs +0s ... 0.085s

#6 start showIntegratedCPUs +0s ... 0.085s

#7 getting avg benchmarks for device 1797 +0.023s ... 0.109s

#8 got single benchmarks 1797 +0.017s ... 0.126s

#9 getting avg benchmarks for device 2528 +0.002s ... 0.127s

#10 got single benchmarks 2528 +0.007s ... 0.134s

#11 got avg benchmarks for devices +0s ... 0.134s

#12 min, max, avg, median took s +0.143s ... 0.277s

#13 before gaming benchmark output +0s ... 0.277s

#14 Got 127 rows for game benchmarks. +0.006s ... 0.284s

#15 composed SQL query for gamebenchmarks +0s ... 0.284s

#16 got data and put it in $dataArray +0.014s ... 0.298s

#17 benchmarks composed for output. +0.07s ... 0.368s

#18 calculated avg scores. +0s ... 0.368s

#19 return log +0.081s ... 0.449s

Please share our article, every link counts!
> Expert Reviews and News on Laptops, Smartphones and Tech Innovations > Benchmarks / Tech > Graphics Card Comparison - Head 2 Head
Redaktion, 2017-09- 8 (Update: 2023-07- 1)