Notebookcheck Logo

NVIDIA GeForce GTX 285M SLI vs NVIDIA GeForce GTX 280M

NVIDIA GeForce GTX 285M SLI

► remove from comparison NVIDIA GeForce GTX 285M SLI

The Nvidia GeForce GTX 285M SLI is a graphics solution that combines two Nvidia GeForce GTX 285M with an SLI connection. As not every game supports SLI efficiently, the performance increase compared to a single card is only about 0-40%. The most frequently used technique is Alternate Frame Rendering (AFR), where each card take turns rendering a frame in an alternating manner. Therefore, the SLI solution may suffer from noticeable micro stuttering at frame-rates between 20-30 fps (due to display irregularities between each rendered frame).

Each of the two GeForce GTX 285M is based on the G92b core and is therefore produced in 55nm. It features the full 128 pipelines of the G92b core and is therefore comparable to the desktop 9800M GTX+ and not the desktop GTX 280.

The Nvidia GeForce GTX 285M SLI in laptops with Core 2 Duo CPUs is bundled with the GeForce 9400M G chipset and therefore supports HybridPower (if the manufacturer enables it). With HybridPower, both GTX cards can be disabled and only the chipset graphics core can run, leading to improved battery life (and possibly less fan noise). Modern Core i7 laptops are using an Intel chipset and do not support HybridPower.

Since there are two GTX 285M cards active in SLI, the electrical current consumption and exhumed heat are about twice as much as what a single GTX 285M can produce. Due to the large power and cooling requirements, this SLI combination can only be found in large DTR laptops (like the Alienware M17x).

NVIDIA GeForce GTX 280M

► remove from comparison NVIDIA GeForce GTX 280M

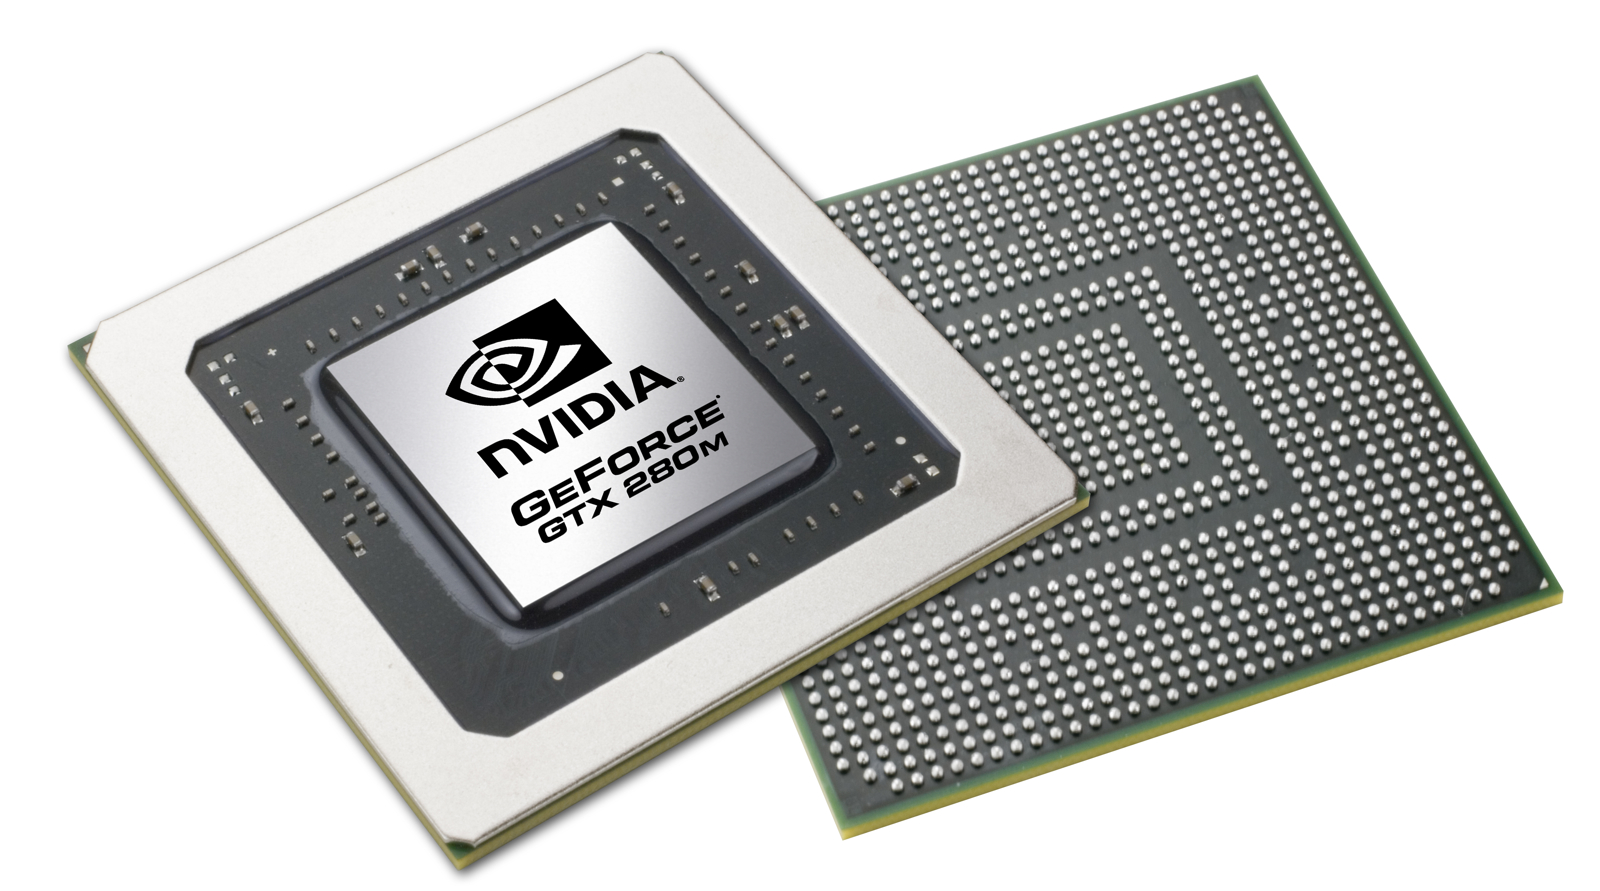
The NVidia GeForce GTX 280M is a high-end graphics card as part of the 200M series and is based on the G92b core (Desktop GeForce 9800 GTX+). Therefore, it is actually more related to the GeForce 9800 GTX+, both performance-wise and architecturally, than to the GTX 280. The chip is produced in 55nm with all 128 pipelines enabled, as opposed to the GT 9800M with only 112 pipelines produced in a 65nm process.

Hybrid Power makes an appearance on the GTX 280M as well, but with much improved performance. Switch times on the graphics card now completes in just a fraction of a second, compared to a full 7 seconds on the 9800M GTX,

As with all DirectX 10 graphics cards, the GeForce GTX 280M renders 3D images using "Unified Shaders". Dedicated pixel and vertex shaders of yesteryear are gone in favor of 128 stream processors running at 1250MHz on the GTX 280M.  The stream processors handle all of the workload that would have otherwise been processed by pixel or vertex shaders. VRAM can be up to 1024 MB GDDR3 clocked at either 800MHz (on MXM2 boards) or 950MHz (on MXM3 boards).

Due to the full 128 shader cores, the GTX 280M is about 10-25% faster than the older 9800M GTX and slightly faster than the 260M. Compared to the performance of the Mobility Radeon HD 4870, the GTX 280M is about equal in synthetic benchmarks, if not slightly lower. The Nvidia card, however, has proven to be slightly faster in games, so the GTX 280M can therefore be rated more highly in terms of real-life performance. Specifically, games with PhysX support (e.g., Mirrors Edge) can have significant performance advantages if PhysX effects are enabled. 

Another feature of the GeForce GTX 280M is the integrated PureVideo HD video processor. The card is able to assist the CPU in decoding of H.264-, VC-1-, MPEG2- and WMV9 video material.

HybridPower is a Windows Vista-only technique used to switch between the integrated (only with Nvidia chipset) and dedicated graphics cores for power-saving purposes. Eventually, Nvidia will have its future chips switch automatically between dedicated or integrated through drivers (now known as Optimus Technology). GeForceBoost is not supported with this card, as there would be no performance gain from combining the integrated GPU with the discrete video card.

A high power consumption of up to 75 Watts (including the VRAM and MXM board) means that only large notebooks with powerful (and possibly loud) cooling systems can run the GTX 280M.

The newer GTX 285M is based on the same core as the GTX 280M, but with only slightly altered clock rates. As a result, the performance of the GeForce GTX285M is very similar to the GTX 280M.

Compared with Desktop graphic cards, the performance can be considered somewhere in between the 9800 GT and the 9800 GTX, the latter of which has considerably higher clock rates at 675/1675/1100MHz.

NVIDIA GeForce GTX 285M SLINVIDIA GeForce GTX 280M
GeForce GTX 200M Series
GeForce GTX 285M SLI 256 @ 0.58 GHz256 Bit @ 1020 MHz
GeForce GTX 280M SLI compare 256 @ 0.59 GHz256 Bit @ 950 MHz
GeForce GTX 260M SLI compare 224 @ 0.55 GHz256 Bit @ 950 MHz
GeForce GTX 285M compare 128 @ 0.58 GHz256 Bit @ 1020 MHz
GeForce GTX 280M 128 @ 0.59 GHz256 Bit @ 950 MHz
GeForce GTX 260M compare 112 @ 0.55 GHz256 Bit @ 950 MHz
CodenameN10E-GTXN10E-GTX
ArchitectureG9xG9x
Pipelines256 - unified128 - unified
Core Speed576 MHz585 MHz
Shader Speed1500 MHz1463 MHz
Memory Speed1020 MHz950 MHz
Memory Bus Width256 Bit256 Bit
Memory TypeGDDR3GDDR3
Max. Amount of Memory2048 (2x1024) MB1024 MB
Shared Memorynono
APIDirectX 10, Shader 4.0DirectX 10, Shader 4.0
Power Consumption150 Watt
Transistors1.5 Billion754 Million
technology55 nm55 nm
FeaturesHybridPower, PureVideo HD, CUDA, PhysX readyHybridPower, PureVideo HD, CUDA, PhysX ready
Notebook Sizelargelarge
Date of Announcement02.03.2009 02.03.2009
InformationMXM 3MXM 3
Link to Manufacturer Pagewww.nvidia.comwww.nvidia.com

Benchmarks

3DMark Vantage
3DM Vant. Perf. total + NVIDIA GeForce GTX 285M SLI
3DMark Vantage - 3DM Vant. Perf. total
11233 Points (3%)
3DM Vant. Perf. total + NVIDIA GeForce GTX 280M
min: 5314     avg: 6328     median: 6672 (2%)     max: 6779 Points
3DM Vant. Perf. GPU no PhysX + NVIDIA GeForce GTX 285M SLI
3DMark Vantage - 3DM Vant. Perf. GPU no PhysX
10511 Points (6%)
3DM Vant. Perf. GPU no PhysX + NVIDIA GeForce GTX 280M
min: 5071     avg: 5243     median: 5257.5 (3%)     max: 5319 Points
3DMark 2001SE - 3DMark 2001 - Standard
min: 36607     avg: 38714     median: 38780 (40%)     max: 40754 Points
3DMark 03 - 3DMark 03 - Standard
min: 34632     avg: 35749     median: 35748.5 (19%)     max: 36865 Points
3DMark 05 - 3DMark 05 - Standard
21611 Points (24%)
min: 16800     avg: 18414     median: 18669 (20%)     max: 20713 Points
3DMark 06 3DMark 06 - Score Unknown Settings + NVIDIA GeForce GTX 285M SLI
3DMark 06
16132 Points (21%)
3DMark 06 - Standard 1280x1024 + NVIDIA GeForce GTX 285M SLI
3DMark 06
16608 Points (22%)
3DMark 06 - Standard 1280x1024 + NVIDIA GeForce GTX 280M
min: 11767     avg: 12569     median: 12551 (17%)     max: 13652 Points
Windows 7 Experience Index - Win7 Gaming graphics
7.3 Points (92%)
Windows 7 Experience Index - Win7 Graphics
7.3 Points (92%)
Cinebench R10 Cinebench R10 Shading (32bit) + NVIDIA GeForce GTX 285M SLI
Cinebench R10 - Cinebench R10 Shading (32bit)
min: 4418     avg: 4616     median: 4482 (3%)     max: 4949 Points
Cinebench R10 Shading (32bit) + NVIDIA GeForce GTX 280M
min: 4111     avg: 5505     median: 5276.5 (4%)     max: 7845 Points
Cinebench R11.5 Cinebench R11.5 OpenGL 64 Bit + NVIDIA GeForce GTX 285M SLI
Cinebench R11.5 - Cinebench R11.5 OpenGL 64 Bit
min: 29.33     avg: 30.7     median: 30.7 (11%)     max: 32.04 fps

Average Benchmarks NVIDIA GeForce GTX 285M SLI → 100% n=5

Average Benchmarks NVIDIA GeForce GTX 280M → 78% n=5

- Range of benchmark values for this graphics card
- Average benchmark values for this graphics card
* Smaller numbers mean a higher performance
1 This benchmark is not used for the average calculation

Game Benchmarks

The following benchmarks stem from our benchmarks of review laptops. The performance depends on the used graphics memory, clock rate, processor, system settings, drivers, and operating systems. So the results don't have to be representative for all laptops with this GPU. For detailed information on the benchmark results, click on the fps number.

high 1366x768
100%
GeForce GTX 285M SLI:
81.5  fps
ultra 1920x1080
100%
GeForce GTX 285M SLI:
50.6  fps
med. 1024x768
100%
GeForce GTX 285M SLI:
118.1  fps
high 1366x768
100%
GeForce GTX 285M SLI:
113.9  fps
ultra 1920x1080
100%
GeForce GTX 285M SLI:
84.3  fps
Risen

Risen

2009
med. 1024x768
100%
GeForce GTX 285M SLI:
103.5  fps
high 1366x768
100%
GeForce GTX 285M SLI:
84.7  fps
ultra 1920x1080
100%
GeForce GTX 285M SLI:
58  fps
Need for Speed Shift

Need for Speed Shift

2009
med. 1024x768
100%
GeForce GTX 285M SLI:
86.2  fps
high 1366x768
100%
GeForce GTX 285M SLI:
85.3  fps
ultra 1920x1080
100%
GeForce GTX 285M SLI:
79.8  fps
Colin McRae: DIRT 2

Colin McRae: DIRT 2

2009
med. 1024x768
100%
GeForce GTX 285M SLI:
127.1  fps
high 1360x768
100%
GeForce GTX 285M SLI:
103.7  fps
ultra 1920x1080
100%
GeForce GTX 285M SLI:
69.9  fps
Anno 1404

Anno 1404

2009
low 1024x768
GeForce GTX 280M:
100  fps
ultra 1280x1024
100%
GeForce GTX 285M SLI:
89.4  fps
54%
GeForce GTX 280M:
40 51.5 52.7 ~ 48 fps
F.E.A.R. 2

F.E.A.R. 2

2009
high 1280x1024
100%
GeForce GTX 285M SLI:
127.5  fps
68%
GeForce GTX 280M:
82.5 86.1 91 ~ 87 fps
ultra 1920x1080
100%
GeForce GTX 285M SLI:
87.7  fps
GTA IV - Grand Theft Auto

GTA IV - Grand Theft Auto

2008
low 800x600
GeForce GTX 280M:
48 55.7 63.9 65.3 ~ 58 fps
med. 1024x768
GeForce GTX 280M:
47 53.9 55.7 56.3 ~ 53 fps
high 1280x1024
GeForce GTX 280M:
33 38.4 39.3 41.5 ~ 38 fps
Left 4 Dead

Left 4 Dead

2008
high 1024x768
GeForce GTX 280M:
104 121.2 131.5 ~ 119 fps
Far Cry 2

Far Cry 2

2008
low 640x480
GeForce GTX 280M:
98  fps
high 1024x768
GeForce GTX 280M:
62  fps
Crysis Warhead

Crysis Warhead

2008
low 800x600
GeForce GTX 280M:
76  fps
ultra 1024x768
GeForce GTX 280M:
17  fps
Racedriver: GRID

Racedriver: GRID

2008
high 1280x1024
GeForce GTX 280M:
72.8  fps
Call of Duty 4 - Modern Warfare

Call of Duty 4 - Modern Warfare

2007
high 1280x1024
GeForce GTX 280M:
75 78.8 117.5 ~ 90 fps
Supreme Commander - FA Bench

Supreme Commander - FA Bench

2007
med. 1024x768
GeForce GTX 280M:
54.6 54.9 56 ~ 55 fps
high 1024x768
GeForce GTX 280M:
45 45.9 46.1 47.3 ~ 46 fps
Crysis - GPU Benchmark

Crysis - GPU Benchmark

2007
low 1024x768
GeForce GTX 280M:
106 115.4 128.6 138.9 ~ 122 fps
med. 1024x768
100%
GeForce GTX 285M SLI:
74.2  fps
88%
GeForce GTX 280M:
60.9 65.9 66 67 ~ 65 fps
high 1024x768
100%
GeForce GTX 285M SLI:
62  fps
73%
GeForce GTX 280M:
43.1 44 45 45.1 48.6 ~ 45 fps
ultra 1920x1080
100%
GeForce GTX 285M SLI:
26.9  fps
Crysis - CPU Benchmark

Crysis - CPU Benchmark

2007
low 1024x768
GeForce GTX 280M:
95.2 102.1 117.1 ~ 105 fps
med. 1024x768
100%
GeForce GTX 285M SLI:
73.9  fps
91%
GeForce GTX 280M:
61.2 66.2 72.4 ~ 67 fps
high 1024x768
100%
GeForce GTX 285M SLI:
59.3  fps
76%
GeForce GTX 280M:
41.2 43.8 47.3 49.5 ~ 45 fps
ultra 1920x1080
100%
GeForce GTX 285M SLI:
24.9  fps
World in Conflict - Benchmark

World in Conflict - Benchmark

2007
med. 1024x768
GeForce GTX 280M:
77  fps
high 1024x768
GeForce GTX 280M:
46  fps
Call of Juarez Benchmark

Call of Juarez Benchmark

2006
high 1024x768
GeForce GTX 280M:
29.3 33 33.1 ~ 32 fps
Half Life 2 - Lost Coast Benchmark

Half Life 2 - Lost Coast Benchmark

2005
high 1024x768
GeForce GTX 280M:
144  fps
Counter-Strike Source

Counter-Strike Source

2004
high 1024x768
GeForce GTX 280M:
265  fps
Doom 3

Doom 3

2004
low 640x480
GeForce GTX 280M:
161  fps
ultra 1024x768
GeForce GTX 280M:
160  fps
Quake 3 Arena - Timedemo

Quake 3 Arena - Timedemo

1999
high 1024x768
GeForce GTX 280M:
695  fps

Average Gaming NVIDIA GeForce GTX 285M SLI → 100%

Average Gaming 30-70 fps → 100%

Average Gaming NVIDIA GeForce GTX 280M → 75%

Average Gaming 30-70 fps → 76%

NVIDIA GeForce GTX 285M SLIlowmed.highultraQHD4K
Battlefield: Bad Company 281.550.6
CoD Modern Warfare 2118.1113.984.3
Risen103.584.758
Need for Speed Shift86.285.379.8
Colin McRae: DIRT 2127.1103.769.9
Anno 140489.4
F.E.A.R. 2127.587.7
Crysis - GPU Benchmark74.26226.9
Crysis - CPU Benchmark73.959.324.9
< 30 fps
< 60 fps
< 120 fps
≥ 120 fps


5
1

1
6
1
2
2
5


NVIDIA GeForce GTX 280Mlowmed.highultraQHD4K
Anno 140410048
F.E.A.R. 287
GTA IV - Grand Theft Auto585338
Left 4 Dead119
Far Cry 29862
Crysis Warhead7617
Racedriver: GRID72.8
Call of Duty 4 - Modern Warfare90
Supreme Commander - FA Bench5546
Crysis - GPU Benchmark1226545
Crysis - CPU Benchmark1056745
World in Conflict - Benchmark7746
Call of Juarez Benchmark32
Half Life 2 - Lost Coast Benchmark144
Counter-Strike Source265
Doom 3161160
Quake 3 Arena - Timedemo695
< 30 fps
< 60 fps
< 120 fps
≥ 120 fps

1
4
2

2
3

6
5
3
1
1

1


For more games that might be playable and a list of all games and graphics cards visit our Gaming List

Add one or more devices and compare

In the following list you can select (and also search for) devices that should be added to the comparison. You can select more than one device.

restrict list:

show all (including archived), 2024, 2023
v1.26
log 19. 04:31:50

#0 checking url part for id 1643 +0s ... 0s

#1 checking url part for id 1110 +0s ... 0s

#2 not redirecting to Ajax server +0s ... 0s

#3 did not recreate cache, as it is less than 5 days old! Created at Tue, 16 Apr 2024 05:39:00 +0200 +0.001s ... 0.001s

#4 composed specs +0.086s ... 0.087s

#5 did output specs +0s ... 0.087s

#6 start showIntegratedCPUs +0s ... 0.087s

#7 getting avg benchmarks for device 1643 +0.027s ... 0.114s

#8 got single benchmarks 1643 +0.015s ... 0.129s

#9 getting avg benchmarks for device 1110 +0.002s ... 0.131s

#10 got single benchmarks 1110 +0.038s ... 0.169s

#11 got avg benchmarks for devices +0s ... 0.169s

#12 min, max, avg, median took s +0.209s ... 0.378s

#13 before gaming benchmark output +0s ... 0.378s

#14 Got 93 rows for game benchmarks. +0.012s ... 0.391s

#15 composed SQL query for gamebenchmarks +0s ... 0.391s

#16 got data and put it in $dataArray +0.012s ... 0.402s

#17 benchmarks composed for output. +0.056s ... 0.458s

#18 calculated avg scores. +0s ... 0.458s

#19 return log +0.077s ... 0.535s

Please share our article, every link counts!
> Expert Reviews and News on Laptops, Smartphones and Tech Innovations > Benchmarks / Tech > Graphics Card Comparison - Head 2 Head
Redaktion, 2017-09- 8 (Update: 2023-07- 1)