NVIDIA GeForce GTX 1080 Ti (Desktop) vs NVIDIA GeForce GTX 1080 Max-Q vs NVIDIA GeForce GTX 1070 (Desktop)
NVIDIA GeForce GTX 1080 Ti (Desktop) ► remove from comparison
The Nvidia GeForce GTX 1080 Ti is the fastest desktop consumer graphics card (beginning 2017). It is based on the same GP107 chip as the Titan X but with slightly higher clock speeds and a different memory configuration. It offers one memory controller less (and 11 instead of 12 GB), but the GDDR5X memory is faster clocked (11 GHz) leading to a comparable memory bandwidth. Due to the higher boost clock, the 1080Ti should be around 5 % faster compared to the Pascal Titan X and about 35 % faster compared to the GTX 1080 . The TDP is equal to the Titan X with 250 Watt. A new cooler of the Founders Edition should be more efficient and quieter.
NVIDIA GeForce GTX 1080 Max-Q ► remove from comparison
The Nvidia GeForce GTX 1080 with the Max-Q design is a mobile high-end GPU from the Pascal series. It is designed for thin and light laptops and about 10-15% slower than a regular GTX 1080 for laptops based on the cooling capabilities. The base frequency (1101-1290 MHz) is also much lower than on the regular GTX 1080 (1566 MHz, at least -18%) and the Boost (1278-1458 MHz) is also much lower compared to 1733 MHz (at least -16%) for the regular GTX 1080. The memory clock, however, is identical.
The clock is not the only difference compared to the regular GTX 1080 though. The drivers for the Max-Q version were optimized for efficiency (and not performance; only for Max-Q models), there are optimized voltage converters for 1V operation, high-end cooling methods, and a 40 dB limit for the fan noise (with clock adjustments to ensure this at all times).
The performance is nearer to the normal (Max-P) GeForce GTX 1070 than to then GTX 1080 (at least in the Asus Zephyrus). Therefore, most demanding games should be playable in full HD and maximum detail settings (see game benchmarks below).
Features
The GP104 chip is manufactured in 16nm FinFET process at TSMC and offers a range of new features. DisplayPort 1.4 (ready), HDMI 2.0b, HDR, Simultaneous Multi-Projection (SMP), improved H.265 video en- and decoders (for PlayReady 3.0) are only some of the improvements. See our detailed Pascal architecture article for more details.
The power consumption of the Max-Q design is notably lower than the normal GTX 1080 for laptops and ranges between 90 and 110 Watt (TGP) according to Nvidia.
NVIDIA GeForce GTX 1070 (Desktop) ► remove from comparison
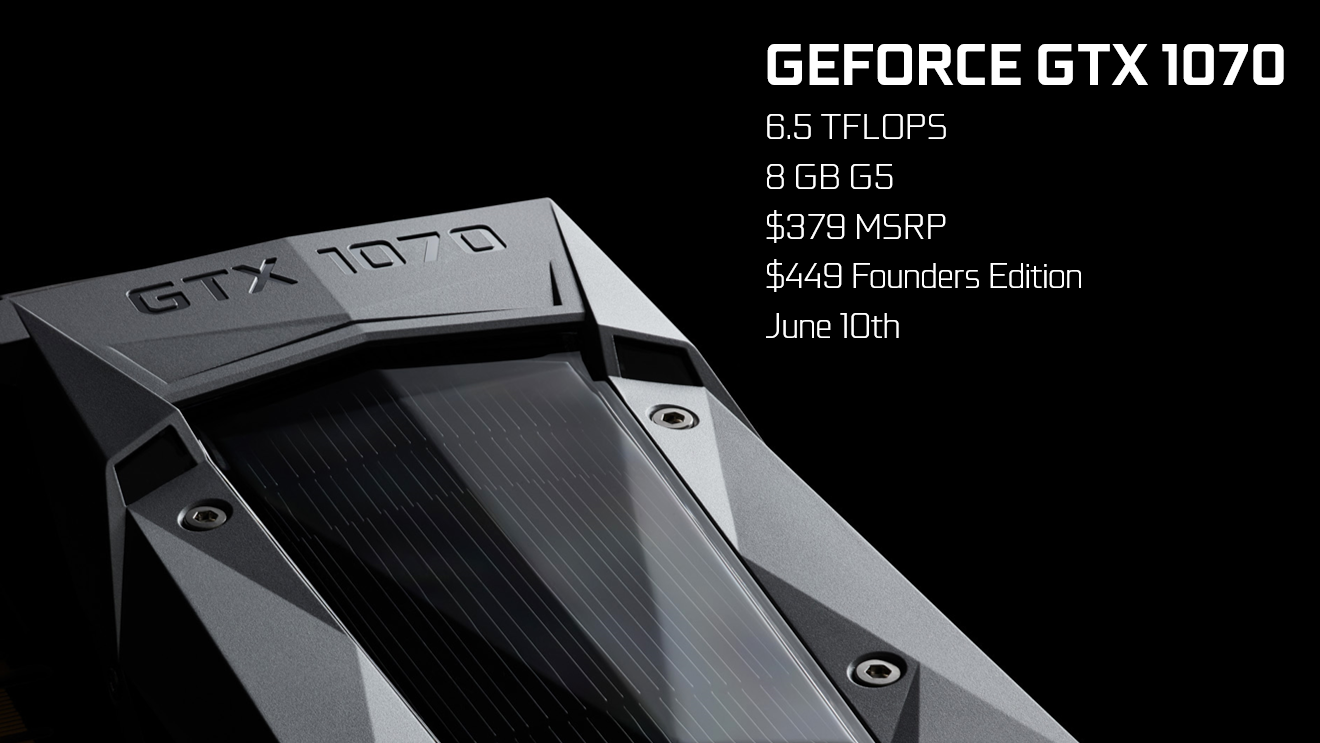
The Nvidia GeForce GTX 1070 is the second fastest Pascal based graphics card in mid May 2016. It is a high-end desktop graphics card. The mobile pendant is also called GeForce GTX 1070, but features more shaders and a lower core clock (see this page for details on the laptop version of the GTX 1070 ). Both cards are based on a cut down GP104 chip as the GTX 1080 and manufactured in 16 nm FinFET at TSMC. More details on the Pascal architecture including all features and comparisons to Maxwell, can be found here .
Compared to the GTX1080, the GTX1070 features less CUDA cores (1920 versus 2560) that are clocked a bit lower (maximum Boost 1683 versus 1733). Instead of the new GDDR5X, the GTX 1070 uses slower GDDR5 graphics memory - but still 8 GB. The TDP is also reduced from 180 Watt to 150 Watt.
The performance of the GTX 1070 is between the old GTX 980 Ti and the GTX 1080. Therefore, gaming in 4k at high details is possible with the card and also VR gaming is possible.
NVIDIA GeForce GTX 1080 Ti (Desktop) NVIDIA GeForce GTX 1080 Max-Q NVIDIA GeForce GTX 1070 (Desktop) GeForce GTX 1000 Series Codename GP102 N17E-G3 Max-Q Pascal GP104 Architecture Pascal Pascal Pascal Pipelines 3584 - unified 2560 - unified 1920 - unified Core Speed 1481 - 1600 (Boost) MHz 1101 - 1290 - 1278 - 1468 (Boost) MHz 1506 - 1683 (Boost) MHz Memory Speed 11000 MHz 10000 MHz 8000 MHz Memory Bus Width 352 Bit 256 Bit 256 Bit Memory Type GDDR5X GDDR5X GDDR5 Max. Amount of Memory 11 GB 8 GB 8 GB Shared Memory no no no API DirectX 12_1, OpenGL 4.5 / Vulkan DirectX 12_1, OpenGL 4.5 DirectX 12_1, OpenGL 4.5 Power Consumption 250 Watt 90 - 110 Watt 150 Watt Transistors 12 Billion 7.2 Billion 7.2 Billion technology 16 nm 16 nm 16 nm Features DP 1.4, HDMI 2.0b, HDCP 2.2, CUDA, PCIe 3.0, GPU Boost 3.0, G-SYNC Multi-Projection, VR Ready, G-SYNC, Vulkan, Multi Monitor Multi-Projection, VR Ready, G-SYNC, Vulkan, Multi Monitor Date of Announcement 28.02.2017 30.05.2017 06.05.2016 Notebook Size large Link to Manufacturer Page www.geforce.com
Benchmarks Performance Rating - 3DMark 11 + Fire Strike + Time Spy - GeForce GTX 1080 Max-Q
8.3 pt (25%)
...
NVIDIA GeForce GTX 1080 Max-Q
...
Performance Rating - 3DMark 11 + Fire Strike + Time Spy - GeForce GTX 1070 (Desktop)
8.3 pt (25%)
...
NVIDIA GeForce GTX 1070 (Desktop)
...
3DMark - 3DMark Time Spy Score
min: 6978 avg: 8628 median: 8684.5 (25%) max: 9806 Points
min: 5390 avg: 5592 median: 5591.5 (16%) max: 5793 Points
min: 5393 avg: 5726 median: 5679 (16%) max: 6106 Points
3DMark - 3DMark Time Spy Graphics
min: 9024 avg: 9372 median: 9401 (25%) max: 9608 Points
min: 5636 avg: 5869 median: 5868.5 (16%) max: 6101 Points
min: 5555 avg: 5808 median: 5896 (16%) max: 5973 Points
3DMark - 3DMark Ice Storm Unlimited Graphics
min: 350317 avg: 408298 median: 394694 (45%) max: 493486 Points
387951 Points (44%)
463865 Points (53%)
3DMark - 3DMark Ice Storm Extreme Graphics
252862 Points (32%)
310978 Points (40%)
3DMark - 3DMark Cloud Gate Score
min: 28990 avg: 41126 median: 43370.5 (46%) max: 49475 Points
min: 27935 avg: 28242 median: 28375 (30%) max: 28416 Points
min: 29721 avg: 32363 median: 30229.5 (32%) max: 39273 Points
3DMark - 3DMark Cloud Gate Graphics
min: 105276 avg: 136458 median: 142490 (37%) max: 157012 Points
min: 104506 avg: 111542 median: 114542 (30%) max: 115579 Points
min: 104764 avg: 107294 median: 106934 (28%) max: 110542 Points
3DMark - 3DMark Fire Strike Standard Score
min: 14936 avg: 19343 median: 19615.5 (35%) max: 22823 Points
min: 13822 avg: 14269 median: 14273.5 (25%) max: 14631 Points
min: 13917 avg: 15175 median: 14984 (26%) max: 16230 Points
3DMark - 3DMark Fire Strike Standard Graphics
min: 25771 avg: 27531 median: 27564 (31%) max: 28476 Points
min: 17151 avg: 18110 median: 18191.5 (21%) max: 18505 Points
min: 16685 avg: 17893 median: 18255 (21%) max: 18408 Points
3DMark - 3DMark Ice Storm Graphics
min: 251370 avg: 271726 median: 281682 (34%) max: 282127 Points
379960 Points (46%)
3DMark 11 - 3DM11 Performance Score
min: 16074 avg: 24293 median: 24935 (35%) max: 29827 Points
min: 16333 avg: 16947 median: 16910.5 (23%) max: 17829 Points
min: 18555 avg: 19713 median: 19449 (27%) max: 21560 Points
3DMark 11 - 3DM11 Performance GPU
min: 34761 avg: 37470 median: 37671.5 (32%) max: 39241 Points
min: 21816 avg: 23358 median: 23540 (20%) max: 24425 Points
min: 23660 avg: 24686 median: 24652 (21%) max: 26098 Points
3DMark Vantage + NVIDIA GeForce GTX 1080 Max-Q 3DMark Vantage - 3DM Vant. Perf. total
39562 Points (11%)
3DM Vant. Perf. total + NVIDIA GeForce GTX 1070 (Desktop)
min: 50091 avg: 52461 median: 50995 (15%) max: 56296 Points
3DM Vant. Perf. GPU no PhysX + NVIDIA GeForce GTX 1080 Max-Q 3DMark Vantage - 3DM Vant. Perf. GPU no PhysX
46945 Points (27%)
3DM Vant. Perf. GPU no PhysX + NVIDIA GeForce GTX 1070 (Desktop)
min: 61022 avg: 61767 median: 61090 (35%) max: 63188 Points
3DMark 2001SE - 3DMark 2001 - Standard
69346 Points (72%)
3DMark 03 - 3DMark 03 - Standard
163345 Points (85%)
3DMark 06 3DMark 06 - Standard 1280x1024 + NVIDIA GeForce GTX 1080 Ti (Desktop)
min: 23535 avg: 34281 median: 33610 (44%) max: 44272 Points
3DMark 06 - Standard 1280x1024 + NVIDIA GeForce GTX 1080 Max-Q
31555 Points (41%)
3DMark 06 - Standard 1280x1024 + NVIDIA GeForce GTX 1070 (Desktop)
min: 37452 avg: 38211 median: 37799.5 (49%) max: 39794 Points
Unigine Valley 1.0 - Unigine Valley 1.0 DX
min: 88.8 avg: 117.1 median: 114.5 (38%) max: 144 fps
84.8 fps (28%)
min: 91.8 avg: 93.4 median: 92.6 (30%) max: 95.8 fps
Unigine Heaven 3.0 - Unigine Heaven 3.0 DX 11
197 fps (65%)
SPECviewperf 12 + NVIDIA GeForce GTX 1080 Ti (Desktop) SPECviewperf 12 - specvp12 sw-03
min: 59.6 avg: 67.5 median: 67.5 (17%) max: 75.4 fps
specvp12 sw-03 + NVIDIA GeForce GTX 1080 Max-Q
49.4 fps (12%)
specvp12 sw-03 + NVIDIA GeForce GTX 1070 (Desktop)
60.2 fps (15%)
specvp12 snx-02 + NVIDIA GeForce GTX 1080 Ti (Desktop) SPECviewperf 12 - specvp12 snx-02
min: 9.77 avg: 10 median: 10 (1%) max: 10.2 fps
specvp12 snx-02 + NVIDIA GeForce GTX 1080 Max-Q
7.7 fps (1%)
specvp12 snx-02 + NVIDIA GeForce GTX 1070 (Desktop)
7.7 fps (1%)
specvp12 showcase-01 + NVIDIA GeForce GTX 1080 Ti (Desktop) SPECviewperf 12 - specvp12 showcase-01
min: 143.1 avg: 149.2 median: 149.2 (32%) max: 155.2 fps
specvp12 showcase-01 + NVIDIA GeForce GTX 1080 Max-Q
97.1 fps (21%)
specvp12 showcase-01 + NVIDIA GeForce GTX 1070 (Desktop)
82.2 fps (18%)
specvp12 mediacal-01 + NVIDIA GeForce GTX 1080 Ti (Desktop) SPECviewperf 12 - specvp12 mediacal-01
min: 56.7 avg: 58.3 median: 58.3 (15%) max: 59.8 fps
specvp12 mediacal-01 + NVIDIA GeForce GTX 1080 Max-Q
44.1 fps (11%)
specvp12 mediacal-01 + NVIDIA GeForce GTX 1070 (Desktop)
41 fps (10%)
specvp12 maya-04 + NVIDIA GeForce GTX 1080 Ti (Desktop) SPECviewperf 12 - specvp12 maya-04
min: 154.5 avg: 174.5 median: 174.5 (48%) max: 194.5 fps
specvp12 maya-04 + NVIDIA GeForce GTX 1080 Max-Q
122.3 fps (33%)
specvp12 maya-04 + NVIDIA GeForce GTX 1070 (Desktop)
131.8 fps (36%)
specvp12 energy-01 + NVIDIA GeForce GTX 1080 Ti (Desktop) SPECviewperf 12 - specvp12 energy-01
14.8 fps (13%)
specvp12 energy-01 + NVIDIA GeForce GTX 1080 Max-Q
7.9 fps (7%)
specvp12 energy-01 + NVIDIA GeForce GTX 1070 (Desktop)
7.5 fps (7%)
specvp12 creo-01 + NVIDIA GeForce GTX 1080 Ti (Desktop) SPECviewperf 12 - specvp12 creo-01
min: 52.5 avg: 60.1 median: 60.1 (24%) max: 67.7 fps
specvp12 creo-01 + NVIDIA GeForce GTX 1080 Max-Q
50.5 fps (20%)
specvp12 creo-01 + NVIDIA GeForce GTX 1070 (Desktop)
49.2 fps (20%)
specvp12 catia-04 + NVIDIA GeForce GTX 1080 Ti (Desktop) SPECviewperf 12 - specvp12 catia-04
min: 100.7 avg: 104.9 median: 104.9 (17%) max: 109.1 fps
specvp12 catia-04 + NVIDIA GeForce GTX 1080 Max-Q
74 fps (12%)
specvp12 catia-04 + NVIDIA GeForce GTX 1070 (Desktop)
67.1 fps (11%)
specvp12 3dsmax-05 + NVIDIA GeForce GTX 1080 Ti (Desktop) SPECviewperf 12 - specvp12 3dsmax-05
min: 128.2 avg: 147.7 median: 147.7 (26%) max: 167.1 fps
specvp12 3dsmax-05 + NVIDIA GeForce GTX 1070 (Desktop)
168.7 fps (30%)
SPECviewperf 13 specvp13 sw-04 + NVIDIA GeForce GTX 1070 (Desktop) SPECviewperf 13 - specvp13 sw-04
81.1 fps (22%)
specvp13 snx-03 + NVIDIA GeForce GTX 1070 (Desktop) SPECviewperf 13 - specvp13 snx-03
13.9 fps (2%)
specvp13 showcase-02 + NVIDIA GeForce GTX 1070 (Desktop) SPECviewperf 13 - specvp13 showcase-02
81.6 fps (18%)
specvp13 medical-02 + NVIDIA GeForce GTX 1070 (Desktop) SPECviewperf 13 - specvp13 medical-02
52.1 fps (11%)
specvp13 maya-05 + NVIDIA GeForce GTX 1070 (Desktop) SPECviewperf 13 - specvp13 maya-05
212.1 fps (24%)
specvp13 energy-02 + NVIDIA GeForce GTX 1070 (Desktop) SPECviewperf 13 - specvp13 energy-02
12.9 fps (4%)
specvp13 creo-02 + NVIDIA GeForce GTX 1070 (Desktop) SPECviewperf 13 - specvp13 creo-02
158.2 fps (23%)
specvp13 catia-05 + NVIDIA GeForce GTX 1070 (Desktop) SPECviewperf 13 - specvp13 catia-05
93 fps (10%)
specvp13 3dsmax-06 + NVIDIA GeForce GTX 1070 (Desktop) SPECviewperf 13 - specvp13 3dsmax-06
167.6 fps (29%)
Cinebench R10 Cinebench R10 Shading (32bit) + NVIDIA GeForce GTX 1080 Ti (Desktop) Cinebench R10 - Cinebench R10 Shading (32bit)
min: 3420 avg: 6309 median: 6805.5 (5%) max: 6829 Points
Cinebench R10 Shading (32bit) + NVIDIA GeForce GTX 1080 Max-Q
min: 6814 avg: 9138 median: 9138 (6%) max: 11462 Points
Cinebench R10 Shading (32bit) + NVIDIA GeForce GTX 1070 (Desktop)
6835 Points (5%)
Cinebench R11.5 Cinebench R11.5 OpenGL 64 Bit + NVIDIA GeForce GTX 1080 Ti (Desktop) Cinebench R11.5 - Cinebench R11.5 OpenGL 64 Bit
min: 58.2 avg: 60.7 median: 60.7 (21%) max: 63.1 fps
Cinebench R11.5 OpenGL 64 Bit + NVIDIA GeForce GTX 1080 Max-Q
min: 67.7 avg: 71.9 median: 71.9 (25%) max: 76.1 fps
Cinebench R11.5 OpenGL 64 Bit + NVIDIA GeForce GTX 1070 (Desktop)
88.2 fps (31%)
Cinebench R15 + NVIDIA GeForce GTX 1080 Ti (Desktop) Cinebench R15 - Cinebench R15 OpenGL 64 Bit
min: 87.7 avg: 142.8 median: 160 (9%) max: 185 fps
Cinebench R15 OpenGL 64 Bit + NVIDIA GeForce GTX 1080 Max-Q
min: 101 avg: 111.2 median: 111.2 (6%) max: 121.3 fps
Cinebench R15 OpenGL 64 Bit + NVIDIA GeForce GTX 1070 (Desktop)
136 fps (8%)
Cinebench R15 OpenGL Ref. Match 64 Bit + NVIDIA GeForce GTX 1080 Ti (Desktop) Cinebench R15 - Cinebench R15 OpenGL Ref. Match 64 Bit
min: 99.6 avg: 99.8 median: 99.6 (100%) max: 100 %
Cinebench R15 OpenGL Ref. Match 64 Bit + NVIDIA GeForce GTX 1080 Max-Q
99.6 % (100%)
Cinebench R15 OpenGL Ref. Match 64 Bit + NVIDIA GeForce GTX 1070 (Desktop)
99.6 % (100%)
GFXBench - GFXBench Car Chase Offscreen
min: 352 avg: 373 median: 373 (42%) max: 394 fps
294 fps (33%)
GFXBench 3.1 - GFXBench Manhattan ES 3.1 Offscreen
min: 419 avg: 480.5 median: 480.5 (10%) max: 542 fps
414 fps (9%)
GFXBench 3.0 - GFXBench 3.0 Manhattan Offscreen
min: 399 avg: 475.5 median: 475.5 (28%) max: 552 fps
min: 427 avg: 432.5 median: 432.5 (25%) max: 438 fps
GFXBench (DX / GLBenchmark) 2.7 + NVIDIA GeForce GTX 1080 Ti (Desktop) GFXBench (DX / GLBenchmark) 2.7 - GFXBench T-Rex HD Offscreen C24Z16
min: 1324 avg: 1521 median: 1521 (12%) max: 1718 fps
GFXBench T-Rex HD Offscreen C24Z16 + NVIDIA GeForce GTX 1080 Max-Q
1365 fps (11%)
Basemark GPU 1.2 - Basemark GPU 1.2 Vulkan Official Medium Offscreen 1080
1135 fps (7%)
Basemark GPU 1.2 - Basemark GPU 1.2 Vulkan Official High Offscreen 2160
102 fps (23%)
LuxMark v2.0 64Bit - LuxMark v2.0 Room GPU
min: 3050 avg: 3055 median: 3054.5 (14%) max: 3059 Samples/s
2094 Samples/s (9%)
min: 2474 avg: 2480 median: 2479.5 (11%) max: 2485 Samples/s
LuxMark v2.0 64Bit - LuxMark v2.0 Sala GPU
min: 6583 avg: 6592 median: 6591.5 (12%) max: 6600 Samples/s
4618 Samples/s (8%)
min: 3877 avg: 4445 median: 4444.5 (8%) max: 5012 Samples/s
ComputeMark v2.1 - ComputeMark v2.1 Result
min: 21646 avg: 21948 median: 21948 (24%) max: 22250 Points
min: 13701 avg: 13756 median: 13756 (15%) max: 13811 Points
min: 13121 avg: 13489 median: 13488.5 (15%) max: 13856 Points
PassMark PerformanceTest 9 - PerformanceTest 9.0 3D Graphics Mark
10968 Points (39%)
Power Consumption - Furmark Stress Test Power Consumption - external Monitor *
min: 319 avg: 347.6 median: 344.5 (49%) max: 378 Watt
min: 218.2 avg: 258.1 median: 253 (36%) max: 303 Watt
Power Consumption - The Witcher 3 Power Consumption - external Monitor *
min: 339 avg: 356 median: 355 (50%) max: 373 Watt
min: 243 avg: 252.9 median: 247.8 (35%) max: 268 Watt
Power Consumption - Witcher 3 Power Consumption *
min: 148 avg: 155.7 median: 159 (35%) max: 160 Watt
Power Consumption - Witcher 3 ultra Power Efficiency
min: 0.3931 avg: 0.4 median: 0.4 (40%) max: 0.4182 fps per Watt
Power Consumption - Witcher 3 ultra Power Efficiency - external Monitor
min: 0.2601 avg: 0.3 median: 0.3 (23%) max: 0.3068 fps per Watt
min: 0.255 avg: 0.3 median: 0.3 (21%) max: 0.2551 fps per Watt
Emissions Witcher 3 Fan Noise + NVIDIA GeForce GTX 1080 Max-Q Emissions - Witcher 3 Fan Noise
min: 42 avg: 44.3 median: 43 (69%) max: 48 dB(A)
Clock Speed - GPU Clock Witcher 3 ultra
min: 1780 avg: 1784 median: 1783.5 (70%) max: 1787 MHz
min: 1430 avg: 1473 median: 1470 (58%) max: 1520 MHz
Clock Speed - GPU Clock Speed Furmark
min: 1480 avg: 1506 median: 1500 (59%) max: 1538 MHz
Average Benchmarks NVIDIA GeForce GTX 1080 Ti (Desktop) → 100% n=26 Average Benchmarks NVIDIA GeForce GTX 1080 Max-Q → 77% n=26 Average Benchmarks NVIDIA GeForce GTX 1070 (Desktop) → 80% n=26
- Range of benchmark values for this graphics card
- Average benchmark values for this graphics card
* Smaller numbers mean a higher performance
1 This benchmark is not used for the average calculation
Game Benchmarks The following benchmarks stem from our benchmarks of review laptops. The performance depends on the used graphics memory, clock rate, processor, system settings, drivers, and operating systems. So the results don't have to be representative for all laptops with this GPU. For detailed information on the benchmark results, click on the fps number.
100%
GeForce GTX 1080 Ti:
59.9 [X] Asus Maximum XIII Hero Desktop MSI GTX 1080 Ti FE 2.02
Intel Core i9-11900K 3.5GHz
GeForce GTX 1080 Ti
min:
42.4 fps, max:
84 fps
fps
100%
GeForce GTX 1080 Ti:
36.7 [X] Asus Maximum XIII Hero Desktop MSI GTX 1080 Ti FE 2.02
Intel Core i9-11900K 3.5GHz
GeForce GTX 1080 Ti
min:
27.3 fps, max:
51.2 fps
fps
100%
GeForce GTX 1080 Ti:
16.3 [X] Asus Maximum XIII Hero Desktop MSI GTX 1080 Ti FE 2.02
Intel Core i9-11900K 3.5GHz
GeForce GTX 1080 Ti
min:
12.4 fps, max:
23.1 fps
fps
100%
GeForce GTX 1080 Ti:
72.9 [X] Asus Maximum XIII Hero Desktop MSI GTX 1080 Ti FE Intel Core i9-11900K 3.5GHz
GeForce GTX 1080 Ti
min:
47.3 fps, P0.1:
51.1 fps, P1:
62.8 fps, max:
168.4 fps
fps
100%
GeForce GTX 1080 Ti:
49.5 [X] Asus Maximum XIII Hero Desktop MSI GTX 1080 Ti FE Intel Core i9-11900K 3.5GHz
GeForce GTX 1080 Ti
min:
36.6 fps, P0.1:
37.3 fps, P1:
41.2 fps, max:
76.7 fps
fps
100%
GeForce GTX 1080 Ti:
25.6 [X] Asus Maximum XIII Hero Desktop MSI GTX 1080 Ti FE Intel Core i9-11900K 3.5GHz
GeForce GTX 1080 Ti
min:
19.7 fps, P0.1:
19.9 fps, P1:
22 fps, max:
37.4 fps
fps
100%
GeForce GTX 1080 Ti:
76 [X] Asus Maximum XIII Hero Desktop MSI GTX 1080 Ti FE Intel Core i9-11900K 3.5GHz
GeForce GTX 1080 Ti
min:
40 fps
fps
100%
GeForce GTX 1080 Ti:
53 [X] Asus Maximum XIII Hero Desktop MSI GTX 1080 Ti FE Intel Core i9-11900K 3.5GHz
GeForce GTX 1080 Ti
min:
25 fps
fps
100%
GeForce GTX 1080 Ti:
32 [X] Asus Maximum XIII Hero Desktop MSI GTX 1080 Ti FE Intel Core i9-11900K 3.5GHz
GeForce GTX 1080 Ti
min:
14 fps
fps
GeForce GTX 1080 Max-Q:
61.3 [X] Asus Zephyrus GX501 Intel Core i7-7700HQ 2.8GHz
GeForce GTX 1080 Max-Q
min:
33 fps, P0.1:
34.9 fps, P1:
39.3 fps, max:
156 fps
fps
GeForce GTX 1080 Max-Q:
53 [X] Asus Zephyrus GX501 Intel Core i7-7700HQ 2.8GHz
GeForce GTX 1080 Max-Q
min:
24.5 fps, P0.1:
31.6 fps, P1:
38.5 fps, max:
191 fps
fps
GeForce GTX 1080 Max-Q:
37.1 [X] Asus Zephyrus GX501 Intel Core i7-7700HQ 2.8GHz
GeForce GTX 1080 Max-Q
min:
12.6 fps, P0.1:
17.5 fps, P1:
24.2 fps, max:
82.5 fps
fps
GeForce GTX 1080 Max-Q:
72.7 [X] Asus Zephyrus GX501 Intel Core i7-7700HQ 2.8GHz
GeForce GTX 1080 Max-Q
min:
12.7 fps, P0.1:
21.2 fps, P1:
33.8 fps, max:
165 fps
fps
GeForce GTX 1080 Max-Q:
52.5 [X] Asus Zephyrus GX501 Intel Core i7-7700HQ 2.8GHz
GeForce GTX 1080 Max-Q
min:
6.28 fps, P0.1:
17.1 fps, P1:
24.3 fps, max:
110 fps
fps
GeForce GTX 1080 Max-Q:
60.2 [X] Asus Zephyrus GX501 Intel Core i7-7700HQ 2.8GHz
GeForce GTX 1080 Max-Q
min:
7.65 fps, P0.1:
12.9 fps, P1:
29.3 fps, max:
107 fps
fps
GeForce GTX 1080 Max-Q:
79.3 [X] Asus Zephyrus GX501 Intel Core i7-7700HQ 2.8GHz
GeForce GTX 1080 Max-Q
min:
14.6 fps, P0.1:
45.7 fps, P1:
54.7 fps, max:
131 fps
fps
GeForce GTX 1080 Max-Q:
56.2 [X] Asus Zephyrus GX501 Intel Core i7-7700HQ 2.8GHz
GeForce GTX 1080 Max-Q
min:
12.5 fps, P0.1:
36.2 fps, P1:
44.2 fps, max:
78.7 fps
fps
GeForce GTX 1080 Max-Q:
46.1 [X] Asus Zephyrus GX501 Intel Core i7-7700HQ 2.8GHz
GeForce GTX 1080 Max-Q
min:
13.6 fps, P0.1:
29.6 fps, P1:
36.4 fps, max:
65 fps
fps
100%
GeForce GTX 1080 Ti:
55.6 [X] Aorus Z370 Ultra Gaming Desktop DDR4-2666 Intel Core i7-8086K 3.7GHz
GeForce GTX 1080 Ti
min:
18.6 fps, P0.1:
33.7 fps, P1:
45.4 fps, max:
126 fps
fps
68%
GeForce GTX 1080 Max-Q:
38 [X] Asus Zephyrus GX501 Intel Core i7-7700HQ 2.8GHz
GeForce GTX 1080 Max-Q
min:
11.8 fps, P0.1:
26.4 fps, P1:
31.4 fps, max:
67.3 fps
fps
100%
GeForce GTX 1080 Ti:
36.9 [X] Aorus Z370 Ultra Gaming Desktop DDR4-2666 Intel Core i7-8086K 3.7GHz
GeForce GTX 1080 Ti
min:
17.7 fps, P0.1:
25.1 fps, P1:
32.3 fps, max:
67.9 fps
fps
64%
GeForce GTX 1080 Max-Q:
23.6 [X] Asus Zephyrus GX501 Intel Core i7-7700HQ 2.8GHz
GeForce GTX 1080 Max-Q
min:
13.4 fps, P0.1:
15.4 fps, P1:
20.5 fps, max:
69.2 fps
fps
100%
GeForce GTX 1080 Ti:
16.9 [X] Aorus Z370 Ultra Gaming Desktop DDR4-2666 Intel Core i7-8086K 3.7GHz
GeForce GTX 1080 Ti
min:
13 fps, P0.1:
13.4 fps, P1:
14.9 fps, max:
29.5 fps
fps
GeForce GTX 1080 Max-Q:
58 [X] Asus Zephyrus GX501 Intel Core i7-7700HQ 2.8GHz
GeForce GTX 1080 Max-Q
min:
28 fps, max:
94 fps
fps
GeForce GTX 1080 Max-Q:
48 [X] Asus Zephyrus GX501 Intel Core i7-7700HQ 2.8GHz
GeForce GTX 1080 Max-Q
min:
28 fps, max:
78 fps
fps
GeForce GTX 1080 Max-Q:
119 [X] Asus Zephyrus GX501 Intel Core i7-7700HQ 2.8GHz
GeForce GTX 1080 Max-Q
min:
9.5 fps, P0.1:
90.3 fps, P1:
107.5 fps, max:
142.9 fps
fps
GeForce GTX 1080 Max-Q:
78.7 [X] Asus Zephyrus GX501 Intel Core i7-7700HQ 2.8GHz
GeForce GTX 1080 Max-Q
min:
14.2 fps, P0.1:
56.4 fps, P1:
67.2 fps, max:
103.5 fps
fps
GeForce GTX 1080 Max-Q:
62.4 [X] Asus Zephyrus GX501 Intel Core i7-7700HQ 2.8GHz
GeForce GTX 1080 Max-Q
min:
10.2 fps, P0.1:
44.4 fps, P1:
54 fps, max:
92 fps
fps
GeForce GTX 1080 Max-Q:
37 [X] Asus Zephyrus GX501 Intel Core i7-7700HQ 2.8GHz
GeForce GTX 1080 Max-Q
min:
9.4 fps, P0.1:
30.9 fps, P1:
32.3 fps, max:
78.5 fps
fps
GeForce GTX 1080 Max-Q:
65.7 [X] Asus Zephyrus GX501 Intel Core i7-7700HQ 2.8GHz
GeForce GTX 1080 Max-Q
min:
33.1 fps, P1:
50.32 fps, max:
101.31 fps
fps
GeForce GTX 1080 Max-Q:
65.6 [X] Asus Zephyrus GX501 Intel Core i7-7700HQ 2.8GHz
GeForce GTX 1080 Max-Q
min:
37.55 fps, P1:
49.69 fps, max:
101.87 fps
fps
GeForce GTX 1080 Max-Q:
58.5 [X] Asus Zephyrus GX501 Intel Core i7-7700HQ 2.8GHz
GeForce GTX 1080 Max-Q
min:
28.28 fps, P1:
45.13 fps, max:
84.57 fps
fps
GeForce GTX 1080 Max-Q:
47.5 [X] Asus Zephyrus GX501 Intel Core i7-7700HQ 2.8GHz
GeForce GTX 1080 Max-Q
min:
28.97 fps, P1:
36.65 fps, max:
65.39 fps
fps
GeForce GTX 1080 Max-Q:
59 [X] Asus Zephyrus GX501 Intel Core i7-7700HQ 2.8GHz
GeForce GTX 1080 Max-Q
min:
25.8 fps, P1:
36.4 fps, max:
127 fps
fps
GeForce GTX 1080 Max-Q:
52.3 [X] Asus Zephyrus GX501 Intel Core i7-7700HQ 2.8GHz
GeForce GTX 1080 Max-Q
min:
1.714 fps, P1:
35.5 fps, max:
105 fps
fps
GeForce GTX 1080 Max-Q:
44.2 [X] Asus Zephyrus GX501 Intel Core i7-7700HQ 2.8GHz
GeForce GTX 1080 Max-Q
min:
1.846 fps, P1:
28.9 fps, max:
102 fps
fps
GeForce GTX 1080 Max-Q:
31 [X] Asus Zephyrus GX501 Intel Core i7-7700HQ 2.8GHz
GeForce GTX 1080 Max-Q
min:
1.905 fps, P1:
16.2 fps, max:
96.3 fps
fps
100%
GeForce GTX 1080 Ti:
75.9 [X] Aorus Z370 Ultra Gaming Desktop DDR4-2666 Intel Core i7-8086K 3.7GHz
GeForce GTX 1080 Ti
min:
9 fps, P1:
58 fps, max:
92 fps
fps
70%
GeForce GTX 1080 Max-Q:
53.4 [X] Asus Zephyrus GX501 Intel Core i7-7700HQ 2.8GHz
GeForce GTX 1080 Max-Q
min:
5 fps, P1:
39.1 fps, max:
65 fps
fps
100%
GeForce GTX 1080 Ti:
69.1 [X] Aorus Z370 Ultra Gaming Desktop DDR4-2666 Intel Core i7-8086K 3.7GHz
GeForce GTX 1080 Ti
min:
5 fps, P1:
50.7 fps, max:
82 fps
fps
72%
GeForce GTX 1080 Max-Q:
49.9 [X] Asus Zephyrus GX501 Intel Core i7-7700HQ 2.8GHz
GeForce GTX 1080 Max-Q
min:
5 fps, P1:
36.5 fps, max:
61 fps
fps
100%
GeForce GTX 1080 Ti:
54 [X] Aorus Z370 Ultra Gaming Desktop DDR4-2666 Intel Core i7-8086K 3.7GHz
GeForce GTX 1080 Ti
min:
6 fps, P1:
43.6 fps, max:
63 fps
fps
80%
GeForce GTX 1080 Max-Q:
43 [X] Asus Zephyrus GX501 Intel Core i7-7700HQ 2.8GHz
GeForce GTX 1080 Max-Q
min:
6 fps, P1:
32.3 fps, max:
52 fps
fps
100%
GeForce GTX 1080 Ti:
43.1 [X] Aorus Z370 Ultra Gaming Desktop DDR4-2666 Intel Core i7-8086K 3.7GHz
GeForce GTX 1080 Ti
min:
8 fps, P1:
36.7 fps, max:
53 fps
fps
72%
GeForce GTX 1080 Max-Q:
30.9 [X] Asus Zephyrus GX501 Intel Core i7-7700HQ 2.8GHz
GeForce GTX 1080 Max-Q
min:
8 fps, P1:
18.9 fps, max:
41.5 fps
fps
100%
GeForce GTX 1080 Ti:
34.7 [X] Aorus Z370 Ultra Gaming Desktop DDR4-2666 Intel Core i7-8086K 3.7GHz
GeForce GTX 1080 Ti
min:
7.5 fps, P1:
29.3 fps, max:
42.5 fps
fps
68%
GeForce GTX 1080 Max-Q:
23.7 [X] Asus Zephyrus GX501 Intel Core i7-7700HQ 2.8GHz
GeForce GTX 1080 Max-Q
min:
10 fps, P1:
12.8 fps, max:
39 fps
fps
100%
GeForce GTX 1080 Ti:
21.2 [X] Aorus Z370 Ultra Gaming Desktop DDR4-2666 Intel Core i7-8086K 3.7GHz
GeForce GTX 1080 Ti
min:
12 fps, P1:
17.5 fps, max:
39.7 fps
fps
62%
GeForce GTX 1080 Max-Q:
13.2 [X] Asus Zephyrus GX501 Intel Core i7-7700HQ 2.8GHz
GeForce GTX 1080 Max-Q
min:
7 fps, P1:
8 fps, max:
32 fps
fps
GeForce GTX 1080 Max-Q:
61 [X] Asus Zephyrus GX501 Intel Core i7-7700HQ 2.8GHz
GeForce GTX 1080 Max-Q
min:
21 fps, max:
118 fps
fps
GeForce GTX 1080 Max-Q:
94.6 [X] Asus Zephyrus GX501 Intel Core i7-7700HQ 2.8GHz
GeForce GTX 1080 Max-Q
P1:
69.4 fps
fps
GeForce GTX 1080 Max-Q:
67 [X] Asus Zephyrus GX501 Intel Core i7-7700HQ 2.8GHz
GeForce GTX 1080 Max-Q
P1:
34.1 fps
fps
GeForce GTX 1080 Max-Q:
36 [X] Asus Zephyrus GX501 Intel Core i7-7700HQ 2.8GHz
GeForce GTX 1080 Max-Q
P1:
19.7 fps
fps
100%
GeForce GTX 1080 Ti:
248 [X] Aorus Z370 Ultra Gaming Desktop DDR4-2666 670054
Intel Core i7-8086K 3.7GHz
GeForce GTX 1080 Ti
min:
203 fps, max:
272 fps
fps
100%
GeForce GTX 1080 Ti:
213 [X] Aorus Z370 Ultra Gaming Desktop DDR4-2666 670054
Intel Core i7-8086K 3.7GHz
GeForce GTX 1080 Ti
min:
171 fps, max:
241 fps
fps
100%
GeForce GTX 1080 Ti:
207 [X] Aorus Z370 Ultra Gaming Desktop DDR4-2666 670054
Intel Core i7-8086K 3.7GHz
GeForce GTX 1080 Ti
min:
171 fps, max:
233 fps
fps
100%
GeForce GTX 1080 Ti:
153 [X] Aorus Z370 Ultra Gaming Desktop DDR4-2666 670054
Intel Core i7-8086K 3.7GHz
GeForce GTX 1080 Ti
min:
120 fps, max:
186 fps
fps
70%
GeForce GTX 1080 Max-Q:
107 [X] Asus Zephyrus GX501 670054
Intel Core i7-7700HQ 2.8GHz
GeForce GTX 1080 Max-Q
min:
80 fps, max:
129 fps
fps
100%
GeForce GTX 1080 Ti:
118 [X] Aorus Z370 Ultra Gaming Desktop DDR4-2666 670054
Intel Core i7-8086K 3.7GHz
GeForce GTX 1080 Ti
min:
94 fps, max:
140 fps
fps
64%
GeForce GTX 1080 Max-Q:
76.1 [X] Asus Zephyrus GX501 670054
Intel Core i7-7700HQ 2.8GHz
GeForce GTX 1080 Max-Q
min:
61 fps, max:
92 fps
fps
100%
GeForce GTX 1080 Ti:
71.9 [X] Aorus Z370 Ultra Gaming Desktop DDR4-2666 670054
Intel Core i7-8086K 3.7GHz
GeForce GTX 1080 Ti
min:
59 fps, max:
86 fps
fps
65%
GeForce GTX 1080 Max-Q:
46.4 [X] Asus Zephyrus GX501 670054
Intel Core i7-7700HQ 2.8GHz
GeForce GTX 1080 Max-Q
min:
37 fps, max:
55 fps
fps
GeForce GTX 1080 Max-Q:
203 [X] Asus Zephyrus GX501 Intel Core i7-7700HQ 2.8GHz
GeForce GTX 1080 Max-Q
P1:
112.4 fps
fps
GeForce GTX 1080 Max-Q:
194 [X] Asus Zephyrus GX501 Intel Core i7-7700HQ 2.8GHz
GeForce GTX 1080 Max-Q
P1:
138.9 fps
fps
GeForce GTX 1080 Max-Q:
185 [X] Asus Zephyrus GX501 Intel Core i7-7700HQ 2.8GHz
GeForce GTX 1080 Max-Q
P1:
126.6 fps
fps
100%
GeForce GTX 1080 Ti:
253 [X] Aorus Z370 Ultra Gaming Desktop DDR4-2666 Intel Core i7-8086K 3.7GHz
GeForce GTX 1080 Ti
fps
100%
GeForce GTX 1080 Ti:
204 [X] Aorus Z370 Ultra Gaming Desktop DDR4-2666 Intel Core i7-8086K 3.7GHz
GeForce GTX 1080 Ti
fps
75%
GeForce GTX 1080 Max-Q:
153 [X] Asus Zephyrus GX501 Intel Core i7-7700HQ 2.8GHz
GeForce GTX 1080 Max-Q
fps
100%
GeForce GTX 1080 Ti:
137 [X] Aorus Z370 Ultra Gaming Desktop DDR4-2666 Intel Core i7-8086K 3.7GHz
GeForce GTX 1080 Ti
fps
69%
GeForce GTX 1080 Max-Q:
93.9 [X] Asus Zephyrus GX501 Intel Core i7-7700HQ 2.8GHz
GeForce GTX 1080 Max-Q
fps
100%
GeForce GTX 1080 Ti:
119 [X] Aorus Z370 Ultra Gaming Desktop DDR4-2666 Intel Core i7-8086K 3.7GHz
GeForce GTX 1080 Ti
fps
66%
GeForce GTX 1080 Max-Q:
78.7 [X] Asus Zephyrus GX501 Intel Core i7-7700HQ 2.8GHz
GeForce GTX 1080 Max-Q
fps
100%
GeForce GTX 1080 Ti:
88.6 □ [X] Aorus Z370 Ultra Gaming Desktop DDR4-2666 Intel Core i7-8086K 3.7GHz
GeForce GTX 1080 Ti
fps
100%
GeForce GTX 1080 Ti:
51.9 □ [X] Aorus Z370 Ultra Gaming Desktop DDR4-2666 Intel Core i7-8086K 3.7GHz
GeForce GTX 1080 Ti
fps
100%
GeForce GTX 1080 Ti:
179 [X] Aorus Z370 Ultra Gaming Desktop DDR4-2666 Intel Core i7-8086K 3.7GHz
GeForce GTX 1080 Ti
P1:
137 fps
fps
72%
GeForce GTX 1080 Max-Q:
128 [X] Asus Zephyrus GX501 Intel Core i7-7700HQ 2.8GHz
GeForce GTX 1080 Max-Q
P1:
82.6 fps
fps
100%
GeForce GTX 1080 Ti:
131 [X] Aorus Z370 Ultra Gaming Desktop DDR4-2666 Intel Core i7-8086K 3.7GHz
GeForce GTX 1080 Ti
P1:
96.2 fps
fps
74%
GeForce GTX 1080 Max-Q:
96.6 [X] Asus Zephyrus GX501 Intel Core i7-7700HQ 2.8GHz
GeForce GTX 1080 Max-Q
P1:
72.5 fps
fps
100%
GeForce GTX 1080 Ti:
67.6 [X] Aorus Z370 Ultra Gaming Desktop DDR4-2666 Intel Core i7-8086K 3.7GHz
GeForce GTX 1080 Ti
P1:
55.6 fps
fps
76%
GeForce GTX 1080 Max-Q:
51.6 [X] Asus Zephyrus GX501 Intel Core i7-7700HQ 2.8GHz
GeForce GTX 1080 Max-Q
P1:
42.9 fps
fps
100%
GeForce GTX 1080 Ti:
123 [X] Aorus Z370 Ultra Gaming Desktop DDR4-2666 Intel Core i7-8086K 3.7GHz
GeForce GTX 1080 Ti
min:
116 fps, max:
127 fps
fps
81%
GeForce GTX 1080 Max-Q:
100 [X] Asus Zephyrus GX501 Intel Core i7-7700HQ 2.8GHz
GeForce GTX 1080 Max-Q
min:
93 fps, max:
110 fps
fps
100%
GeForce GTX 1080 Ti:
79.7 [X] Aorus Z370 Ultra Gaming Desktop DDR4-2666 Intel Core i7-8086K 3.7GHz
GeForce GTX 1080 Ti
min:
70 fps, max:
90 fps
fps
64%
GeForce GTX 1080 Max-Q:
50.7 [X] Asus Zephyrus GX501 Intel Core i7-7700HQ 2.8GHz
GeForce GTX 1080 Max-Q
min:
48 fps, max:
54 fps
fps
100%
GeForce GTX 1080 Ti:
37.5 [X] Aorus Z370 Ultra Gaming Desktop DDR4-2666 Intel Core i7-8086K 3.7GHz
GeForce GTX 1080 Ti
min:
32 fps, max:
44 fps
fps
63%
GeForce GTX 1080 Max-Q:
23.8 [X] Asus Zephyrus GX501 Intel Core i7-7700HQ 2.8GHz
GeForce GTX 1080 Max-Q
min:
22 fps, max:
25 fps
fps
100%
GeForce GTX 1080 Ti:
116 [X] Aorus Z370 Ultra Gaming Desktop DDR4-2666 Intel Core i7-8086K 3.7GHz
GeForce GTX 1080 Ti
min:
102 fps, max:
122 fps
fps
100%
GeForce GTX 1080 Ti:
107 [X] Aorus Z370 Ultra Gaming Desktop DDR4-2666 Intel Core i7-8086K 3.7GHz
GeForce GTX 1080 Ti
min:
80 fps, max:
122 fps
fps
100%
GeForce GTX 1080 Ti:
52.8 [X] Aorus Z370 Ultra Gaming Desktop DDR4-2666 Intel Core i7-8086K 3.7GHz
GeForce GTX 1080 Ti
min:
38 fps, max:
64 fps
fps
GeForce GTX 1080 Max-Q:
119 [X] Asus Zephyrus GX501 Intel Core i7-7700HQ 2.8GHz
GeForce GTX 1080 Max-Q
min:
107 fps, max:
122 fps
fps
GeForce GTX 1080 Max-Q:
119 [X] Asus Zephyrus GX501 Intel Core i7-7700HQ 2.8GHz
GeForce GTX 1080 Max-Q
min:
102 fps, max:
122 fps
fps
GeForce GTX 1080 Max-Q:
59.5 [X] Asus Zephyrus GX501 Intel Core i7-7700HQ 2.8GHz
GeForce GTX 1080 Max-Q
min:
48.3 fps, P0.1:
50.7 fps, P1:
53.4 fps, max:
78.7 fps
fps
GeForce GTX 1080 Max-Q:
59.5 [X] Asus Zephyrus GX501 Intel Core i7-7700HQ 2.8GHz
GeForce GTX 1080 Max-Q
min:
17.9 fps, P0.1:
47.4 fps, P1:
51.8 fps, max:
87.7 fps
fps
GeForce GTX 1080 Max-Q:
59.4 [X] Asus Zephyrus GX501 Intel Core i7-7700HQ 2.8GHz
GeForce GTX 1080 Max-Q
min:
46.7 fps, P0.1:
47.3 fps, P1:
50.4 fps, max:
83.5 fps
fps
GeForce GTX 1070 (Desktop):
142 [X] MSI GeForce GTX 1070 Intel Core i9-9900K 3.6GHz
GeForce GTX 1070 (Desktop)
min:
22 fps
fps
GeForce GTX 1070 (Desktop):
79.8 [X] MSI GeForce GTX 1070 Intel Core i9-9900K 3.6GHz
GeForce GTX 1070 (Desktop)
min:
35 fps
fps
100%
GeForce GTX 1080 Ti:
79 [X] Nvidia GeForce GTX 1080 Ti Founders Edition Intel Core i7-7740X 4.3GHz
GeForce GTX 1080 Ti
min:
43.3 fps, P1:
66.7 fps, max:
128 fps
fps
67%
GeForce GTX 1070 (Desktop):
53 [X] MSI GeForce GTX 1070 Intel Core i9-9900K 3.6GHz
GeForce GTX 1070 (Desktop)
min:
11 fps
fps
100%
GeForce GTX 1080 Ti:
50.7 [X] Nvidia GeForce GTX 1080 Ti Founders Edition Intel Core i7-7740X 4.3GHz
GeForce GTX 1080 Ti
min:
6.87 fps, P1:
37 fps, max:
129 fps
50.9 [X] Asus X299 Prime Desktop DDR4-2666 Intel Core i9-9980XE 3GHz
GeForce GTX 1080 Ti
min:
33 fps, P1:
38.5 fps, max:
62.1 fps
~ 51 fps
62%
GeForce GTX 1080 Max-Q:
31.4 [X] Asus Zephyrus GX501 Intel Core i7-7700HQ 2.8GHz
GeForce GTX 1080 Max-Q
min:
13.5 fps, P1:
18.2 fps, max:
43.1 fps
fps
66%
GeForce GTX 1070 (Desktop):
33.8 [X] MSI GeForce GTX 1070 Intel Core i9-9900K 3.6GHz
GeForce GTX 1070 (Desktop)
min:
10 fps
fps
100%
GeForce GTX 1080 Ti:
40.9 [X] Nvidia GeForce GTX 1080 Ti Founders Edition Intel Core i7-7740X 4.3GHz
GeForce GTX 1080 Ti
min:
5.5 fps, P1:
32.3 fps, max:
129 fps
fps
67%
GeForce GTX 1070 (Desktop):
27.3 [X] MSI GeForce GTX 1070 Intel Core i9-9900K 3.6GHz
GeForce GTX 1070 (Desktop)
min:
8 fps
fps
100%
GeForce GTX 1080 Ti:
26.5 [X] Nvidia GeForce GTX 1080 Ti Founders Edition Intel Core i7-7740X 4.3GHz
GeForce GTX 1080 Ti
min:
21.4 fps, P1:
22.2 fps, max:
128 fps
fps
66%
GeForce GTX 1070 (Desktop):
17.5 [X] MSI GeForce GTX 1070 Intel Core i9-9900K 3.6GHz
GeForce GTX 1070 (Desktop)
min:
13 fps
fps
GeForce GTX 1070 (Desktop):
115 [X] MSI GeForce GTX 1070 Intel Core i9-9900K 3.6GHz
GeForce GTX 1070 (Desktop)
min:
70 fps
fps
GeForce GTX 1070 (Desktop):
103 [X] MSI GeForce GTX 1070 Intel Core i9-9900K 3.6GHz
GeForce GTX 1070 (Desktop)
min:
67 fps
fps
100%
GeForce GTX 1080 Ti:
121 [X] Asus X299 Prime Desktop DDR4-3200 Intel Core i9-10980XE 3GHz
GeForce GTX 1080 Ti
min:
68 fps, max:
145 fps
fps
77%
GeForce GTX 1070 (Desktop):
93.4 [X] MSI GeForce GTX 1070 Intel Core i9-9900K 3.6GHz
GeForce GTX 1070 (Desktop)
min:
66 fps
fps
100%
GeForce GTX 1080 Ti:
98 [X] Asus X299 Prime Desktop DDR4-3200 Intel Core i9-10980XE 3GHz
GeForce GTX 1080 Ti
min:
68 fps, max:
117 fps
fps
70%
GeForce GTX 1070 (Desktop):
69 [X] MSI GeForce GTX 1070 Intel Core i9-9900K 3.6GHz
GeForce GTX 1070 (Desktop)
min:
58 fps
fps
100%
GeForce GTX 1080 Ti:
49.4 [X] Asus X299 Prime Desktop DDR4-3200 Intel Core i9-10980XE 3GHz
GeForce GTX 1080 Ti
min:
43 fps, max:
62 fps
fps
69%
GeForce GTX 1070 (Desktop):
34.1 [X] MSI GeForce GTX 1070 Intel Core i9-9900K 3.6GHz
GeForce GTX 1070 (Desktop)
min:
30 fps
fps
GeForce GTX 1070 (Desktop):
123 [X] MSI GeForce GTX 1070 Intel Core i9-9900K 3.6GHz
GeForce GTX 1070 (Desktop)
min:
107 fps
fps
GeForce GTX 1070 (Desktop):
104 [X] MSI GeForce GTX 1070 Intel Core i9-9900K 3.6GHz
GeForce GTX 1070 (Desktop)
min:
92 fps
fps
GeForce GTX 1070 (Desktop):
93.9 [X] MSI GeForce GTX 1070 Intel Core i9-9900K 3.6GHz
GeForce GTX 1070 (Desktop)
min:
85 fps
fps
100%
GeForce GTX 1080 Ti:
97 [X] Nvidia GeForce GTX 1080 Ti Founders Edition Intel Core i7-7740X 4.3GHz
GeForce GTX 1080 Ti
min:
82 fps, max:
113 fps
fps
79%
GeForce GTX 1070 (Desktop):
76.4 [X] MSI GeForce GTX 1070 Intel Core i9-9900K 3.6GHz
GeForce GTX 1070 (Desktop)
min:
69 fps
fps
100%
GeForce GTX 1080 Ti:
80 [X] Nvidia GeForce GTX 1080 Ti Founders Edition Intel Core i7-7740X 4.3GHz
GeForce GTX 1080 Ti
min:
72 fps, max:
88 fps
fps
69%
GeForce GTX 1070 (Desktop):
55.4 [X] MSI GeForce GTX 1070 Intel Core i9-9900K 3.6GHz
GeForce GTX 1070 (Desktop)
min:
49 fps
fps
100%
GeForce GTX 1080 Ti:
47.4 [X] Nvidia GeForce GTX 1080 Ti Founders Edition Intel Core i7-7740X 4.3GHz
GeForce GTX 1080 Ti
min:
40 fps, max:
53 fps
fps
65%
GeForce GTX 1070 (Desktop):
30.8 [X] MSI GeForce GTX 1070 Intel Core i9-9900K 3.6GHz
GeForce GTX 1070 (Desktop)
min:
27 fps
fps
GeForce GTX 1070 (Desktop):
177 [X] MSI GeForce GTX 1070 Intel Core i9-9900K 3.6GHz
GeForce GTX 1070 (Desktop)
min:
135 fps
fps
GeForce GTX 1070 (Desktop):
113 [X] MSI GeForce GTX 1070 Intel Core i9-9900K 3.6GHz
GeForce GTX 1070 (Desktop)
min:
93 fps
fps
GeForce GTX 1070 (Desktop):
103 [X] MSI GeForce GTX 1070 Intel Core i9-9900K 3.6GHz
GeForce GTX 1070 (Desktop)
min:
82 fps
fps
100%
GeForce GTX 1080 Ti:
122 [X] Nvidia GeForce GTX 1080 Ti Founders Edition Intel Core i7-7740X 4.3GHz
GeForce GTX 1080 Ti
P1:
74.1 fps
fps
70%
GeForce GTX 1070 (Desktop):
85.5 [X] MSI GeForce GTX 1070 Intel Core i9-9900K 3.6GHz
GeForce GTX 1070 (Desktop)
min:
67 fps
fps
100%
GeForce GTX 1080 Ti:
91 [X] Nvidia GeForce GTX 1080 Ti Founders Edition Intel Core i7-7740X 4.3GHz
GeForce GTX 1080 Ti
P1:
62.1 fps
fps
68%
GeForce GTX 1070 (Desktop):
61.5 [X] MSI GeForce GTX 1070 Intel Core i9-9900K 3.6GHz
GeForce GTX 1070 (Desktop)
min:
51 fps
fps
100%
GeForce GTX 1080 Ti:
51.7 [X] Nvidia GeForce GTX 1080 Ti Founders Edition Intel Core i7-7740X 4.3GHz
GeForce GTX 1080 Ti
P1:
36.8 fps
fps
65%
GeForce GTX 1070 (Desktop):
33.8 [X] MSI GeForce GTX 1070 Intel Core i9-9900K 3.6GHz
GeForce GTX 1070 (Desktop)
min:
27 fps
fps
GeForce GTX 1070 (Desktop):
218 [X] MSI GeForce GTX 1070 Intel Core i9-9900K 3.6GHz
GeForce GTX 1070 (Desktop)
min:
172 fps
fps
GeForce GTX 1070 (Desktop):
134 [X] MSI GeForce GTX 1070 Intel Core i9-9900K 3.6GHz
GeForce GTX 1070 (Desktop)
min:
106 fps
fps
GeForce GTX 1070 (Desktop):
105 [X] MSI GeForce GTX 1070 Intel Core i9-9900K 3.6GHz
GeForce GTX 1070 (Desktop)
min:
85 fps
fps
100%
GeForce GTX 1080 Ti:
94 [X] Asus X299 Prime Desktop DDR4-3200 Intel Core i9-10980XE 3GHz
GeForce GTX 1080 Ti
P1:
61 fps
fps
62%
GeForce GTX 1080 Max-Q:
58 [X] Asus Zephyrus GX501 Intel Core i7-7700HQ 2.8GHz
GeForce GTX 1080 Max-Q
P1:
33.8 fps
fps
77%
GeForce GTX 1070 (Desktop):
72.8 [X] MSI GeForce GTX 1070 Intel Core i9-9900K 3.6GHz
GeForce GTX 1070 (Desktop)
min:
53 fps
fps
100%
GeForce GTX 1080 Ti:
78 [X] Asus X299 Prime Desktop DDR4-3200 Intel Core i9-10980XE 3GHz
GeForce GTX 1080 Ti
P1:
52.4 fps
fps
77%
GeForce GTX 1070 (Desktop):
59.9 [X] MSI GeForce GTX 1070 Intel Core i9-9900K 3.6GHz
GeForce GTX 1070 (Desktop)
min:
43 fps
fps
100%
GeForce GTX 1080 Ti:
52.8 [X] Asus X299 Prime Desktop DDR4-3200 Intel Core i9-10980XE 3GHz
GeForce GTX 1080 Ti
P1:
40.7 fps
fps
69%
GeForce GTX 1070 (Desktop):
36.3 [X] MSI GeForce GTX 1070 Intel Core i9-9900K 3.6GHz
GeForce GTX 1070 (Desktop)
min:
27 fps
fps
GeForce GTX 1070 (Desktop):
140 [X] MSI GeForce GTX 1070 Intel Core i9-9900K 3.6GHz
GeForce GTX 1070 (Desktop)
min:
61 fps
fps
GeForce GTX 1070 (Desktop):
91 [X] MSI GeForce GTX 1070 Intel Core i9-9900K 3.6GHz
GeForce GTX 1070 (Desktop)
min:
60 fps
fps
GeForce GTX 1070 (Desktop):
82 [X] MSI GeForce GTX 1070 Intel Core i9-9900K 3.6GHz
GeForce GTX 1070 (Desktop)
min:
59 fps
fps
100%
GeForce GTX 1080 Ti:
81 [X] Asus X299 Prime Desktop DDR4-3200 Intel Core i9-10980XE 3GHz
GeForce GTX 1080 Ti
min:
59 fps, max:
120 fps
fps
75%
GeForce GTX 1070 (Desktop):
61 [X] MSI GeForce GTX 1070 Intel Core i9-9900K 3.6GHz
GeForce GTX 1070 (Desktop)
min:
46 fps
fps
100%
GeForce GTX 1080 Ti:
62 [X] Asus X299 Prime Desktop DDR4-3200 Intel Core i9-10980XE 3GHz
GeForce GTX 1080 Ti
min:
49 fps, max:
88 fps
fps
69%
GeForce GTX 1070 (Desktop):
43 [X] MSI GeForce GTX 1070 Intel Core i9-9900K 3.6GHz
GeForce GTX 1070 (Desktop)
min:
34 fps
fps
100%
GeForce GTX 1080 Ti:
37 [X] Asus X299 Prime Desktop DDR4-3200 Intel Core i9-10980XE 3GHz
GeForce GTX 1080 Ti
min:
7 fps, max:
49 fps
fps
65%
GeForce GTX 1070 (Desktop):
24 [X] MSI GeForce GTX 1070 Intel Core i9-9900K 3.6GHz
GeForce GTX 1070 (Desktop)
min:
19 fps
fps
GeForce GTX 1070 (Desktop):
286 [X] MSI GeForce GTX 1070 Intel Core i9-9900K 3.6GHz
GeForce GTX 1070 (Desktop)
min:
217 fps
fps
GeForce GTX 1070 (Desktop):
285 [X] MSI GeForce GTX 1070 Intel Core i9-9900K 3.6GHz
GeForce GTX 1070 (Desktop)
min:
216 fps
fps
GeForce GTX 1070 (Desktop):
267 [X] MSI GeForce GTX 1070 Intel Core i9-9900K 3.6GHz
GeForce GTX 1070 (Desktop)
min:
208 fps
fps
GeForce GTX 1070 (Desktop):
257 [X] MSI GeForce GTX 1070 Intel Core i9-9900K 3.6GHz
GeForce GTX 1070 (Desktop)
min:
196 fps
fps
GeForce GTX 1080 Max-Q:
124 [X] Asus Zephyrus GX501 Intel Core i7-7700HQ 2.8GHz
GeForce GTX 1080 Max-Q
P1:
89.3 fps
fps
GeForce GTX 1070 (Desktop):
216 [X] MSI GeForce GTX 1070 Intel Core i9-9900K 3.6GHz
GeForce GTX 1070 (Desktop)
min:
164 fps
fps
100%
GeForce GTX 1080 Ti:
173 [X] Nvidia GeForce GTX 1080 Ti Founders Edition Intel Core i7-7740X 4.3GHz
GeForce GTX 1080 Ti
P1:
125 fps
fps
66%
GeForce GTX 1080 Max-Q:
114 [X] Asus Zephyrus GX501 Intel Core i7-7700HQ 2.8GHz
GeForce GTX 1080 Max-Q
P1:
81.3 fps
fps
84%
GeForce GTX 1070 (Desktop):
146 [X] MSI GeForce GTX 1070 Intel Core i9-9900K 3.6GHz
GeForce GTX 1070 (Desktop)
min:
122 fps
fps
100%
GeForce GTX 1080 Ti:
145 [X] Asus Prime X299 Deluxe XMP OC Intel Core i9-9980XE @4.4GHz
GeForce GTX 1080 Ti
fps
63%
GeForce GTX 1080 Max-Q:
91 [X] Asus Zephyrus GX501 Intel Core i7-7700HQ 2.8GHz
GeForce GTX 1080 Max-Q
fps
97%
GeForce GTX 1070 (Desktop):
141 [X] MSI GeForce GTX 1070 Intel Core i9-9900K 3.6GHz
GeForce GTX 1070 (Desktop)
fps
100%
GeForce GTX 1080 Ti:
128 [X] Asus Prime X299 Deluxe XMP OC Intel Core i9-9980XE @4.4GHz
GeForce GTX 1080 Ti
fps
64%
GeForce GTX 1080 Max-Q:
82 [X] Asus Zephyrus GX501 Intel Core i7-7700HQ 2.8GHz
GeForce GTX 1080 Max-Q
fps
83%
GeForce GTX 1070 (Desktop):
106 [X] MSI GeForce GTX 1070 Intel Core i9-9900K 3.6GHz
GeForce GTX 1070 (Desktop)
fps
100%
GeForce GTX 1080 Ti:
103 [X] Asus Prime X299 Deluxe XMP OC Intel Core i9-9980XE @4.4GHz
GeForce GTX 1080 Ti
fps
66%
GeForce GTX 1080 Max-Q:
68 [X] Asus Zephyrus GX501 Intel Core i7-7700HQ 2.8GHz
GeForce GTX 1080 Max-Q
fps
72%
GeForce GTX 1070 (Desktop):
74.6 [X] MSI GeForce GTX 1070 Intel Core i9-9900K 3.6GHz
GeForce GTX 1070 (Desktop)
fps
100%
GeForce GTX 1080 Ti:
85.4 [X] Asus Prime X299 Deluxe XMP OC Intel Core i9-9980XE @4.4GHz
GeForce GTX 1080 Ti
fps
65%
GeForce GTX 1080 Max-Q:
55.2 [X] Asus Zephyrus GX501 Intel Core i7-7700HQ 2.8GHz
GeForce GTX 1080 Max-Q
fps
68%
GeForce GTX 1070 (Desktop):
57.9 [X] MSI GeForce GTX 1070 Intel Core i9-9900K 3.6GHz
GeForce GTX 1070 (Desktop)
fps
100%
GeForce GTX 1080 Ti:
61.7 [X] Asus Prime X299 Deluxe XMP OC Intel Core i9-9980XE @4.4GHz
GeForce GTX 1080 Ti
fps
64%
GeForce GTX 1080 Max-Q:
39.2 [X] Asus Zephyrus GX501 Intel Core i7-7700HQ 2.8GHz
GeForce GTX 1080 Max-Q
fps
65%
GeForce GTX 1070 (Desktop):
40 [X] MSI GeForce GTX 1070 Intel Core i9-9900K 3.6GHz
GeForce GTX 1070 (Desktop)
fps
100%
GeForce GTX 1080 Ti:
34.1 [X] Asus Prime X299 Deluxe XMP OC Intel Core i9-9980XE @4.4GHz
GeForce GTX 1080 Ti
fps
61%
GeForce GTX 1080 Max-Q:
20.7 [X] Asus Zephyrus GX501 Intel Core i7-7700HQ 2.8GHz
GeForce GTX 1080 Max-Q
fps
63%
GeForce GTX 1070 (Desktop):
21.4 [X] MSI GeForce GTX 1070 Intel Core i9-9900K 3.6GHz
GeForce GTX 1070 (Desktop)
fps
100%
GeForce GTX 1080 Ti:
233 [X] Nvidia GeForce GTX 1080 Ti Founders Edition Intel Core i7-7740X 4.3GHz
GeForce GTX 1080 Ti
min:
206 fps, max:
242 fps
fps
86%
GeForce GTX 1080 Max-Q:
201 [X] Asus Zephyrus GX501 Intel Core i7-7700HQ 2.8GHz
GeForce GTX 1080 Max-Q
min:
159 fps, max:
237 fps
fps
89%
GeForce GTX 1070 (Desktop):
207 [X] MSI GeForce GTX 1070 Intel Core i9-9900K 3.6GHz
GeForce GTX 1070 (Desktop)
min:
188 fps
fps
100%
GeForce GTX 1080 Ti:
107 [X] Nvidia GeForce GTX 1080 Ti Founders Edition Intel Core i7-7740X 4.3GHz
GeForce GTX 1080 Ti
min:
93 fps, max:
122 fps
fps
66%
GeForce GTX 1080 Max-Q:
71 [X] Asus Zephyrus GX501 Intel Core i7-7700HQ 2.8GHz
GeForce GTX 1080 Max-Q
min:
62 fps, max:
80 fps
fps
70%
GeForce GTX 1070 (Desktop):
74.8 [X] MSI GeForce GTX 1070 Intel Core i9-9900K 3.6GHz
GeForce GTX 1070 (Desktop)
min:
65 fps
fps
100%
GeForce GTX 1080 Ti:
82 [X] Nvidia GeForce GTX 1080 Ti Founders Edition Intel Core i7-7740X 4.3GHz
GeForce GTX 1080 Ti
min:
71 fps, max:
92 fps
fps
65%
GeForce GTX 1080 Max-Q:
53.6 [X] Asus Zephyrus GX501 Intel Core i7-7700HQ 2.8GHz
GeForce GTX 1080 Max-Q
min:
48 fps, max:
59 fps
fps
68%
GeForce GTX 1070 (Desktop):
55.6 [X] MSI GeForce GTX 1070 Intel Core i9-9900K 3.6GHz
GeForce GTX 1070 (Desktop)
min:
48 fps
fps
100%
GeForce GTX 1080 Ti:
53.2 [X] Nvidia GeForce GTX 1080 Ti Founders Edition Intel Core i7-7740X 4.3GHz
GeForce GTX 1080 Ti
min:
46 fps, max:
60 fps
fps
61%
GeForce GTX 1080 Max-Q:
32.6 [X] Asus Zephyrus GX501 Intel Core i7-7700HQ 2.8GHz
GeForce GTX 1080 Max-Q
min:
28 fps, max:
37 fps
fps
66%
GeForce GTX 1070 (Desktop):
35.2 [X] MSI GeForce GTX 1070 Intel Core i9-9900K 3.6GHz
GeForce GTX 1070 (Desktop)
min:
30 fps
fps
100%
GeForce GTX 1080 Ti:
25.8 [X] Nvidia GeForce GTX 1080 Ti Founders Edition Intel Core i7-7740X 4.3GHz
GeForce GTX 1080 Ti
min:
22 fps, max:
30 fps
fps
62%
GeForce GTX 1080 Max-Q:
16 [X] Asus Zephyrus GX501 Intel Core i7-7700HQ 2.8GHz
GeForce GTX 1080 Max-Q
min:
14 fps, max:
19 fps
fps
67%
GeForce GTX 1070 (Desktop):
17.2 [X] MSI GeForce GTX 1070 Intel Core i9-9900K 3.6GHz
GeForce GTX 1070 (Desktop)
min:
14 fps
fps
GeForce GTX 1070 (Desktop):
248 [X] MSI GeForce GTX 1070 Intel Core i9-9900K 3.6GHz
GeForce GTX 1070 (Desktop)
min:
190 fps
fps
GeForce GTX 1070 (Desktop):
185 [X] MSI GeForce GTX 1070 Intel Core i9-9900K 3.6GHz
GeForce GTX 1070 (Desktop)
min:
165 fps
fps
GeForce GTX 1070 (Desktop):
152 [X] MSI GeForce GTX 1070 Intel Core i9-9900K 3.6GHz
GeForce GTX 1070 (Desktop)
min:
137 fps
fps
100%
GeForce GTX 1080 Ti:
125 [X] Nvidia GeForce GTX 1080 Ti Founders Edition Intel Core i7-7740X 4.3GHz
GeForce GTX 1080 Ti
min:
113 fps, max:
136 fps
fps
85%
GeForce GTX 1070 (Desktop):
106 [X] MSI GeForce GTX 1070 Intel Core i9-9900K 3.6GHz
GeForce GTX 1070 (Desktop)
min:
99 fps
fps
100%
GeForce GTX 1080 Ti:
122 [X] Nvidia GeForce GTX 1080 Ti Founders Edition Intel Core i7-7740X 4.3GHz
GeForce GTX 1080 Ti
min:
114 fps, max:
128 fps
fps
67%
GeForce GTX 1070 (Desktop):
82 [X] MSI GeForce GTX 1070 Intel Core i9-9900K 3.6GHz
GeForce GTX 1070 (Desktop)
min:
76 fps
fps
100%
GeForce GTX 1080 Ti:
71 [X] Nvidia GeForce GTX 1080 Ti Founders Edition Intel Core i7-7740X 4.3GHz
GeForce GTX 1080 Ti
min:
65 fps, max:
74 fps
fps
68%
GeForce GTX 1070 (Desktop):
48 [X] MSI GeForce GTX 1070 Intel Core i9-9900K 3.6GHz
GeForce GTX 1070 (Desktop)
min:
44 fps
fps
GeForce GTX 1080 Max-Q:
145 fps
GeForce GTX 1080 Max-Q:
144 fps
100%
GeForce GTX 1080 Ti:
249 [X] Nvidia GeForce GTX 1080 Ti Founders Edition Intel Core i7-7740X 4.3GHz
GeForce GTX 1080 Ti
min:
157 fps, max:
375 fps
318 [X] Asus Prime X299 Deluxe XMP OC Intel Core i9-9980XE @4.4GHz
GeForce GTX 1080 Ti
min:
197 fps, max:
443 fps
~ 284 fps
100%
GeForce GTX 1080 Ti:
151 [X] Nvidia GeForce GTX 1080 Ti Founders Edition Intel Core i7-7740X 4.3GHz
GeForce GTX 1080 Ti
min:
100 fps, max:
222 fps
fps
100%
GeForce GTX 1080 Ti:
109 [X] Nvidia GeForce GTX 1080 Ti Founders Edition Intel Core i7-7740X 4.3GHz
GeForce GTX 1080 Ti
min:
73 fps, max:
147 fps
fps
100%
GeForce GTX 1080 Ti:
82.8 [X] Asus Prime X299 Deluxe XMP OC Intel Core i9-9980XE @4.4GHz
GeForce GTX 1080 Ti
min:
73 fps, max:
102 fps
85.4 [X] Nvidia GeForce GTX 1080 Ti Founders Edition Intel Core i7-7740X 4.3GHz
GeForce GTX 1080 Ti
min:
65 fps, max:
108 fps
~ 84 fps
66%
GeForce GTX 1080 Max-Q:
55.5 [X] Asus Zephyrus GX501 Intel Core i7-7700HQ 2.8GHz
GeForce GTX 1080 Max-Q
min:
41 fps, max:
68 fps
fps
100%
GeForce GTX 1080 Ti:
59 [X] Nvidia GeForce GTX 1080 Ti Founders Edition Intel Core i7-7740X 4.3GHz
GeForce GTX 1080 Ti
min:
51 fps, max:
69 fps
fps
64%
GeForce GTX 1080 Max-Q:
38 [X] Asus Zephyrus GX501 Intel Core i7-7700HQ 2.8GHz
GeForce GTX 1080 Max-Q
min:
23 fps, max:
44 fps
fps
100%
GeForce GTX 1080 Ti:
30.6 [X] Nvidia GeForce GTX 1080 Ti Founders Edition Intel Core i7-7740X 4.3GHz
GeForce GTX 1080 Ti
min:
26 fps, max:
34 fps
fps
62%
GeForce GTX 1080 Max-Q:
18.9 [X] Asus Zephyrus GX501 Intel Core i7-7700HQ 2.8GHz
GeForce GTX 1080 Max-Q
min:
16 fps, max:
21 fps
fps
100%
GeForce GTX 1080 Ti:
265 [X] Nvidia GeForce GTX 1080 Ti Founders Edition Intel Core i7-7740X 4.3GHz
GeForce GTX 1080 Ti
P1:
178.6 fps
fps
76%
GeForce GTX 1080 Max-Q:
202 [X] Acer Predator Triton 700 Intel Core i7-7700HQ 2.8GHz
GeForce GTX 1080 Max-Q
min:
120 fps
fps
71%
GeForce GTX 1070 (Desktop):
188 [X] MSI GeForce GTX 1070 Intel Core i9-9900K 3.6GHz
GeForce GTX 1070 (Desktop)
min:
156 fps
fps
100%
GeForce GTX 1080 Ti:
142 [X] Nvidia GeForce GTX 1080 Ti Founders Edition Intel Core i7-7740X 4.3GHz
GeForce GTX 1080 Ti
P1:
115.2 fps
fps
69%
GeForce GTX 1080 Max-Q:
97.9 [X] Acer Predator Triton 700 Intel Core i7-7700HQ 2.8GHz
GeForce GTX 1080 Max-Q
min:
80 fps
fps
65%
GeForce GTX 1070 (Desktop):
93 [X] MSI GeForce GTX 1070 Intel Core i9-9900K 3.6GHz
GeForce GTX 1070 (Desktop)
min:
80 fps
fps
100%
GeForce GTX 1080 Ti:
124 [X] Nvidia GeForce GTX 1080 Ti Founders Edition Intel Core i7-7740X 4.3GHz
GeForce GTX 1080 Ti
P1:
100.9 fps
fps
67%
GeForce GTX 1080 Max-Q:
82.7 [X] Acer Predator Triton 700 Intel Core i7-7700HQ 2.8GHz
GeForce GTX 1080 Max-Q
min:
67 fps
fps
65%
GeForce GTX 1070 (Desktop):
81.1 [X] MSI GeForce GTX 1070 Intel Core i9-9900K 3.6GHz
GeForce GTX 1070 (Desktop)
min:
68 fps
fps
100%
GeForce GTX 1080 Ti:
121 [X] Nvidia GeForce GTX 1080 Ti Founders Edition Intel Core i7-7740X 4.3GHz
GeForce GTX 1080 Ti
P1:
98.5 fps
fps
67%
GeForce GTX 1080 Max-Q:
80.6 [X] Acer Predator Triton 700 Intel Core i7-7700HQ 2.8GHz
GeForce GTX 1080 Max-Q
min:
65 fps
fps
66%
GeForce GTX 1070 (Desktop):
80 [X] MSI GeForce GTX 1070 Intel Core i9-9900K 3.6GHz
GeForce GTX 1070 (Desktop)
min:
67 fps
fps
100%
GeForce GTX 1080 Ti:
80 [X] Nvidia GeForce GTX 1080 Ti Founders Edition Intel Core i7-7740X 4.3GHz
GeForce GTX 1080 Ti
P1:
67.2 fps
fps
64%
GeForce GTX 1080 Max-Q:
50.8 [X] Acer Predator Triton 700 Intel Core i7-7700HQ 2.8GHz
GeForce GTX 1080 Max-Q
min:
41 fps
fps
63%
GeForce GTX 1070 (Desktop):
50.3 [X] MSI GeForce GTX 1070 Intel Core i9-9900K 3.6GHz
GeForce GTX 1070 (Desktop)
min:
42 fps
fps
100%
GeForce GTX 1080 Ti:
38.9 [X] Nvidia GeForce GTX 1080 Ti Founders Edition Intel Core i7-7740X 4.3GHz
GeForce GTX 1080 Ti
P1:
34.5 fps
fps
62%
GeForce GTX 1080 Max-Q:
24.3 [X] Acer Predator Triton 700 Intel Core i7-7700HQ 2.8GHz
GeForce GTX 1080 Max-Q
min:
20 fps
fps
63%
GeForce GTX 1070 (Desktop):
24.5 [X] MSI GeForce GTX 1070 Intel Core i9-9900K 3.6GHz
GeForce GTX 1070 (Desktop)
min:
22 fps
fps
GeForce GTX 1080 Max-Q:
78.1 [X] Acer Predator Triton 700 Intel Core i7-7700HQ 2.8GHz
GeForce GTX 1080 Max-Q
min:
71 fps
fps
GeForce GTX 1070 (Desktop):
111 [X] MSI GeForce GTX 1070 Intel Core i9-9900K 3.6GHz
GeForce GTX 1070 (Desktop)
min:
103 fps
fps
GeForce GTX 1080 Max-Q:
73.8 [X] Acer Predator Triton 700 Intel Core i7-7700HQ 2.8GHz
GeForce GTX 1080 Max-Q
min:
66 fps
fps
GeForce GTX 1070 (Desktop):
109 [X] MSI GeForce GTX 1070 Intel Core i9-9900K 3.6GHz
GeForce GTX 1070 (Desktop)
min:
99 fps
fps
GeForce GTX 1080 Max-Q:
65 [X] Acer Predator Triton 700 Intel Core i7-7700HQ 2.8GHz
GeForce GTX 1080 Max-Q
min:
59 fps
fps
GeForce GTX 1070 (Desktop):
90 [X] MSI GeForce GTX 1070 Intel Core i9-9900K 3.6GHz
GeForce GTX 1070 (Desktop)
min:
75 fps
fps
100%
GeForce GTX 1080 Ti:
50.9 [X] Nvidia GeForce GTX 1080 Ti Founders Edition Intel Core i7-7740X 4.3GHz
GeForce GTX 1080 Ti
min:
47 fps, max:
57 fps
fps
67%
GeForce GTX 1080 Max-Q:
33.5 [X] Asus Zephyrus GX501 Intel Core i7-7700HQ 2.8GHz
GeForce GTX 1080 Max-Q
min:
28 fps, max:
40 fps
34.6 [X] Acer Predator Triton 700 Intel Core i7-7700HQ 2.8GHz
GeForce GTX 1080 Max-Q
min:
31 fps
~ 34 fps
85%
GeForce GTX 1070 (Desktop):
43.3 [X] MSI GeForce GTX 1070 Intel Core i9-9900K 3.6GHz
GeForce GTX 1070 (Desktop)
min:
40 fps
fps
100%
GeForce GTX 1080 Ti:
46.6 [X] Nvidia GeForce GTX 1080 Ti Founders Edition Intel Core i7-7740X 4.3GHz
GeForce GTX 1080 Ti
min:
42 fps, max:
53 fps
fps
63%
GeForce GTX 1080 Max-Q:
29.5 [X] Acer Predator Triton 700 Intel Core i7-7700HQ 2.8GHz
GeForce GTX 1080 Max-Q
min:
27 fps
fps
69%
GeForce GTX 1070 (Desktop):
32.1 [X] MSI GeForce GTX 1070 Intel Core i9-9900K 3.6GHz
GeForce GTX 1070 (Desktop)
min:
30 fps
fps
100%
GeForce GTX 1080 Ti:
37.7 [X] Nvidia GeForce GTX 1080 Ti Founders Edition Intel Core i7-7740X 4.3GHz
GeForce GTX 1080 Ti
min:
35 fps, max:
42 fps
fps
47%
GeForce GTX 1080 Max-Q:
17.6 [X] Acer Predator Triton 700 Intel Core i7-7700HQ 2.8GHz
GeForce GTX 1080 Max-Q
min:
15 fps
fps
50%
GeForce GTX 1070 (Desktop):
18.8 [X] MSI GeForce GTX 1070 Intel Core i9-9900K 3.6GHz
GeForce GTX 1070 (Desktop)
min:
16 fps
fps
100%
GeForce GTX 1080 Ti:
197 [X] Nvidia GeForce GTX 1080 Ti Founders Edition Intel Core i7-7740X 4.3GHz
GeForce GTX 1080 Ti
min:
53.1915 fps, P1:
114.943 fps, max:
322.581 fps
fps
73%
GeForce GTX 1080 Max-Q:
143 [X] Acer Predator Triton 700 Intel Core i7-7700HQ 2.8GHz
GeForce GTX 1080 Max-Q
fps
102%
GeForce GTX 1070 (Desktop):
200 [X] MSI GeForce GTX 1070 Intel Core i9-9900K 3.6GHz
GeForce GTX 1070 (Desktop)
fps
100%
GeForce GTX 1080 Ti:
154 [X] Nvidia GeForce GTX 1080 Ti Founders Edition Intel Core i7-7740X 4.3GHz
GeForce GTX 1080 Ti
min:
52.9101 fps, P1:
86.9565 fps, max:
333.333 fps
fps
73%
GeForce GTX 1080 Max-Q:
113 [X] Acer Predator Triton 700 Intel Core i7-7700HQ 2.8GHz
GeForce GTX 1080 Max-Q
fps
79%
GeForce GTX 1070 (Desktop):
122 [X] MSI GeForce GTX 1070 Intel Core i9-9900K 3.6GHz
GeForce GTX 1070 (Desktop)
fps
100%
GeForce GTX 1080 Ti:
127 [X] Nvidia GeForce GTX 1080 Ti Founders Edition Intel Core i7-7740X 4.3GHz
GeForce GTX 1080 Ti
min:
45.6621 fps, P1:
70.922 fps, max:
285.714 fps
fps
72%
GeForce GTX 1080 Max-Q:
91 [X] Acer Predator Triton 700 Intel Core i7-7700HQ 2.8GHz
GeForce GTX 1080 Max-Q
fps
76%
GeForce GTX 1070 (Desktop):
97 [X] MSI GeForce GTX 1070 Intel Core i9-9900K 3.6GHz
GeForce GTX 1070 (Desktop)
fps
100%
GeForce GTX 1080 Ti:
107 [X] Nvidia GeForce GTX 1080 Ti Founders Edition Intel Core i7-7740X 4.3GHz
GeForce GTX 1080 Ti
min:
44.0529 fps, P1:
64.9351 fps, max:
250 fps
fps
69%
GeForce GTX 1080 Max-Q:
73 [X] Acer Predator Triton 700 Intel Core i7-7700HQ 2.8GHz
GeForce GTX 1080 Max-Q
74 [X] Asus Zephyrus GX501 Intel Core i7-7700HQ 2.8GHz
GeForce GTX 1080 Max-Q
min:
35.1 fps, P1:
52.1 fps, max:
152 fps
~ 74 fps
72%
GeForce GTX 1070 (Desktop):
77 [X] MSI GeForce GTX 1070 Intel Core i9-9900K 3.6GHz
GeForce GTX 1070 (Desktop)
fps
100%
GeForce GTX 1080 Ti:
75 [X] Nvidia GeForce GTX 1080 Ti Founders Edition Intel Core i7-7740X 4.3GHz
GeForce GTX 1080 Ti
min:
29.0698 fps, P1:
49.4218 fps, max:
151.515 fps
fps
68%
GeForce GTX 1080 Max-Q:
51 [X] Acer Predator Triton 700 Intel Core i7-7700HQ 2.8GHz
GeForce GTX 1080 Max-Q
51.5 [X] Asus Zephyrus GX501 Intel Core i7-7700HQ 2.8GHz
GeForce GTX 1080 Max-Q
min:
23.9 fps, P1:
34.8 fps, max:
77.5 fps
~ 51 fps
71%
GeForce GTX 1070 (Desktop):
53 [X] MSI GeForce GTX 1070 Intel Core i9-9900K 3.6GHz
GeForce GTX 1070 (Desktop)
fps
100%
GeForce GTX 1080 Ti:
42.4 [X] Nvidia GeForce GTX 1080 Ti Founders Edition Intel Core i7-7740X 4.3GHz
GeForce GTX 1080 Ti
min:
15.1745 fps, P1:
22.7884 fps, max:
96.1538 fps
fps
64%
GeForce GTX 1080 Max-Q:
27 [X] Acer Predator Triton 700 Intel Core i7-7700HQ 2.8GHz
GeForce GTX 1080 Max-Q
27.8 [X] Asus Zephyrus GX501 Intel Core i7-7700HQ 2.8GHz
GeForce GTX 1080 Max-Q
min:
18 fps, P1:
22.4 fps, max:
48.8 fps
~ 27 fps
66%
GeForce GTX 1070 (Desktop):
28 [X] MSI GeForce GTX 1070 Intel Core i9-9900K 3.6GHz
GeForce GTX 1070 (Desktop)
fps
GeForce GTX 1080 Max-Q:
193 [X] Acer Predator Triton 700 Intel Core i7-7700HQ 2.8GHz
GeForce GTX 1080 Max-Q
min:
178 fps
fps
GeForce GTX 1070 (Desktop):
287 [X] MSI GeForce GTX 1070 Intel Core i9-9900K 3.6GHz
GeForce GTX 1070 (Desktop)
min:
266 fps
fps
GeForce GTX 1080 Max-Q:
131 [X] Acer Predator Triton 700 Intel Core i7-7700HQ 2.8GHz
GeForce GTX 1080 Max-Q
min:
115 fps
fps
GeForce GTX 1070 (Desktop):
139 [X] MSI GeForce GTX 1070 Intel Core i9-9900K 3.6GHz
GeForce GTX 1070 (Desktop)
min:
121 fps
fps
GeForce GTX 1080 Max-Q:
108 [X] Acer Predator Triton 700 Intel Core i7-7700HQ 2.8GHz
GeForce GTX 1080 Max-Q
min:
86 fps
fps
GeForce GTX 1070 (Desktop):
113 [X] MSI GeForce GTX 1070 Intel Core i9-9900K 3.6GHz
GeForce GTX 1070 (Desktop)
min:
86 fps
fps
100%
GeForce GTX 1080 Ti:
95 [X] Nvidia GeForce GTX 1080 Ti Founders Edition Intel Core i7-7740X 4.3GHz
GeForce GTX 1080 Ti
min:
73 fps, max:
113 fps
fps
77%
GeForce GTX 1080 Max-Q:
70.6 [X] Acer Predator Triton 700 Intel Core i7-7700HQ 2.8GHz
GeForce GTX 1080 Max-Q
min:
57 fps
75 ~ 73 fps
76%
GeForce GTX 1070 (Desktop):
72.6 [X] MSI GeForce GTX 1070 Intel Core i9-9900K 3.6GHz
GeForce GTX 1070 (Desktop)
min:
58 fps
fps
100%
GeForce GTX 1080 Ti:
75 [X] Nvidia GeForce GTX 1080 Ti Founders Edition Intel Core i7-7740X 4.3GHz
GeForce GTX 1080 Ti
min:
57 fps, max:
90 fps
fps
73%
GeForce GTX 1080 Max-Q:
54.9 [X] Acer Predator Triton 700 Intel Core i7-7700HQ 2.8GHz
GeForce GTX 1080 Max-Q
min:
47 fps
55.9 ~ 55 fps
72%
GeForce GTX 1070 (Desktop):
54.3 [X] MSI GeForce GTX 1070 Intel Core i9-9900K 3.6GHz
GeForce GTX 1070 (Desktop)
min:
46 fps
fps
100%
GeForce GTX 1080 Ti:
49.6 [X] Nvidia GeForce GTX 1080 Ti Founders Edition Intel Core i7-7740X 4.3GHz
GeForce GTX 1080 Ti
min:
43 fps, max:
57 fps
fps
68%
GeForce GTX 1080 Max-Q:
33.7 fps
67%
GeForce GTX 1070 (Desktop):
33.1 [X] MSI GeForce GTX 1070 Intel Core i9-9900K 3.6GHz
GeForce GTX 1070 (Desktop)
min:
29 fps
fps
100%
GeForce GTX 1080 Ti:
119 [X] Nvidia GeForce GTX 1080 Ti Founders Edition Intel Core i7-7740X 4.3GHz
GeForce GTX 1080 Ti
min:
98 fps, max:
148 fps
fps
78%
GeForce GTX 1080 Max-Q:
92.5 [X] Acer Predator Triton 700 Intel Core i7-7700HQ 2.8GHz
GeForce GTX 1080 Max-Q
min:
76 fps
fps
117%
GeForce GTX 1070 (Desktop):
139 [X] MSI GeForce GTX 1070 Intel Core i9-9900K 3.6GHz
GeForce GTX 1070 (Desktop)
min:
119 fps
fps
100%
GeForce GTX 1080 Ti:
116 [X] Nvidia GeForce GTX 1080 Ti Founders Edition Intel Core i7-7740X 4.3GHz
GeForce GTX 1080 Ti
min:
98 fps, max:
138 fps
fps
72%
GeForce GTX 1080 Max-Q:
83.3 [X] Acer Predator Triton 700 Intel Core i7-7700HQ 2.8GHz
GeForce GTX 1080 Max-Q
min:
70 fps
fps
86%
GeForce GTX 1070 (Desktop):
99.2 [X] MSI GeForce GTX 1070 Intel Core i9-9900K 3.6GHz
GeForce GTX 1070 (Desktop)
min:
82 fps
fps
100%
GeForce GTX 1080 Ti:
104 [X] Nvidia GeForce GTX 1080 Ti Founders Edition Intel Core i7-7740X 4.3GHz
GeForce GTX 1080 Ti
min:
71 fps, max:
125 fps
fps
75%
GeForce GTX 1080 Max-Q:
78.4 [X] Acer Predator Triton 700 Intel Core i7-7700HQ 2.8GHz
GeForce GTX 1080 Max-Q
min:
58 fps
fps
82%
GeForce GTX 1070 (Desktop):
85.2 [X] MSI GeForce GTX 1070 Intel Core i9-9900K 3.6GHz
GeForce GTX 1070 (Desktop)
min:
70 fps
fps
100%
GeForce GTX 1080 Ti:
99 [X] Nvidia GeForce GTX 1080 Ti Founders Edition Intel Core i7-7740X 4.3GHz
GeForce GTX 1080 Ti
min:
70 fps, max:
126 fps
fps
73%
GeForce GTX 1080 Max-Q:
72.3 [X] Acer Predator Triton 700 Intel Core i7-7700HQ 2.8GHz
GeForce GTX 1080 Max-Q
min:
53 fps
fps
79%
GeForce GTX 1070 (Desktop):
78.4 [X] MSI GeForce GTX 1070 Intel Core i9-9900K 3.6GHz
GeForce GTX 1070 (Desktop)
min:
61 fps
fps
100%
GeForce GTX 1080 Ti:
82 [X] Nvidia GeForce GTX 1080 Ti Founders Edition Intel Core i7-7740X 4.3GHz
GeForce GTX 1080 Ti
min:
71 fps, max:
92 fps
fps
66%
GeForce GTX 1080 Max-Q:
54.5 [X] Acer Predator Triton 700 Intel Core i7-7700HQ 2.8GHz
GeForce GTX 1080 Max-Q
min:
47 fps
fps
66%
GeForce GTX 1070 (Desktop):
54.4 [X] MSI GeForce GTX 1070 Intel Core i9-9900K 3.6GHz
GeForce GTX 1070 (Desktop)
min:
48 fps
fps
100%
GeForce GTX 1080 Ti:
45.9 [X] Nvidia GeForce GTX 1080 Ti Founders Edition Intel Core i7-7740X 4.3GHz
GeForce GTX 1080 Ti
min:
42 fps, max:
50 fps
fps
63%
GeForce GTX 1080 Max-Q:
29 [X] Acer Predator Triton 700 Intel Core i7-7700HQ 2.8GHz
GeForce GTX 1080 Max-Q
min:
26 fps
fps
64%
GeForce GTX 1070 (Desktop):
29.4 [X] MSI GeForce GTX 1070 Intel Core i9-9900K 3.6GHz
GeForce GTX 1070 (Desktop)
min:
27 fps
fps
100%
GeForce GTX 1080 Ti:
113 [X] Nvidia GeForce GTX 1080 Ti Founders Edition Intel Core i7-7740X 4.3GHz
GeForce GTX 1080 Ti
min:
87 fps, max:
163 fps
fps
87%
GeForce GTX 1080 Max-Q:
98 [X] Acer Predator Triton 700 Intel Core i7-7700HQ 2.8GHz
GeForce GTX 1080 Max-Q
min:
76 fps
fps
115%
GeForce GTX 1070 (Desktop):
130 [X] MSI GeForce GTX 1070 Intel Core i9-9900K 3.6GHz
GeForce GTX 1070 (Desktop)
min:
101 fps
fps
100%
GeForce GTX 1080 Ti:
104 [X] Nvidia GeForce GTX 1080 Ti Founders Edition Intel Core i7-7740X 4.3GHz
GeForce GTX 1080 Ti
min:
79 fps, max:
150 fps
fps
81%
GeForce GTX 1080 Max-Q:
84 [X] Acer Predator Triton 700 Intel Core i7-7700HQ 2.8GHz
GeForce GTX 1080 Max-Q
min:
67 fps
fps
103%
GeForce GTX 1070 (Desktop):
107 [X] MSI GeForce GTX 1070 Intel Core i9-9900K 3.6GHz
GeForce GTX 1070 (Desktop)
min:
87 fps
fps
100%
GeForce GTX 1080 Ti:
102 [X] Nvidia GeForce GTX 1080 Ti Founders Edition Intel Core i7-7740X 4.3GHz
GeForce GTX 1080 Ti
min:
77 fps, max:
146 fps
fps
79%
GeForce GTX 1080 Max-Q:
81 [X] Acer Predator Triton 700 Intel Core i7-7700HQ 2.8GHz
GeForce GTX 1080 Max-Q
min:
64 fps
fps
99%
GeForce GTX 1070 (Desktop):
101 [X] MSI GeForce GTX 1070 Intel Core i9-9900K 3.6GHz
GeForce GTX 1070 (Desktop)
min:
82 fps
fps
100%
GeForce GTX 1080 Ti:
94 [X] Nvidia GeForce GTX 1080 Ti Founders Edition Intel Core i7-7740X 4.3GHz
GeForce GTX 1080 Ti
min:
68 fps, max:
145 fps
fps
74%
GeForce GTX 1080 Max-Q:
66 74 [X] Acer Predator Triton 700 Intel Core i7-7700HQ 2.8GHz
GeForce GTX 1080 Max-Q
min:
54 fps
~ 70 fps
97%
GeForce GTX 1070 (Desktop):
91 [X] MSI GeForce GTX 1070 Intel Core i9-9900K 3.6GHz
GeForce GTX 1070 (Desktop)
min:
71 fps
fps
100%
GeForce GTX 1080 Ti:
88 [X] Nvidia GeForce GTX 1080 Ti Founders Edition Intel Core i7-7740X 4.3GHz
GeForce GTX 1080 Ti
min:
65 fps, max:
121 fps
fps
76%
GeForce GTX 1080 Max-Q:
67 [X] Acer Predator Triton 700 Intel Core i7-7700HQ 2.8GHz
GeForce GTX 1080 Max-Q
min:
52 fps
fps
81%
GeForce GTX 1070 (Desktop):
71 [X] MSI GeForce GTX 1070 Intel Core i9-9900K 3.6GHz
GeForce GTX 1070 (Desktop)
min:
56 fps
fps
100%
GeForce GTX 1080 Ti:
57 [X] Nvidia GeForce GTX 1080 Ti Founders Edition Intel Core i7-7740X 4.3GHz
GeForce GTX 1080 Ti
min:
47 fps, max:
69 fps
fps
67%
GeForce GTX 1080 Max-Q:
38 [X] Acer Predator Triton 700 Intel Core i7-7700HQ 2.8GHz
GeForce GTX 1080 Max-Q
min:
31 fps
38 ~ 38 fps
67%
GeForce GTX 1070 (Desktop):
38 [X] MSI GeForce GTX 1070 Intel Core i9-9900K 3.6GHz
GeForce GTX 1070 (Desktop)
min:
32 fps
fps
100%
GeForce GTX 1080 Ti:
137 [X] Nvidia GeForce GTX 1080 Ti Founders Edition Intel Core i7-7740X 4.3GHz
GeForce GTX 1080 Ti
min:
76 fps, max:
217 fps
fps
81%
GeForce GTX 1080 Max-Q:
111 [X] Acer Predator Triton 700 Intel Core i7-7700HQ 2.8GHz
GeForce GTX 1080 Max-Q
min:
60 fps
fps
108%
GeForce GTX 1070 (Desktop):
148 [X] MSI GeForce GTX 1070 Intel Core i9-9900K 3.6GHz
GeForce GTX 1070 (Desktop)
min:
79 fps
fps
100%
GeForce GTX 1080 Ti:
115 [X] Nvidia GeForce GTX 1080 Ti Founders Edition Intel Core i7-7740X 4.3GHz
GeForce GTX 1080 Ti
min:
54 fps, max:
188 fps
fps
71%
GeForce GTX 1080 Max-Q:
81.1 [X] Acer Predator Triton 700 Intel Core i7-7700HQ 2.8GHz
GeForce GTX 1080 Max-Q
min:
39 fps
fps
68%
GeForce GTX 1070 (Desktop):
77.9 [X] MSI GeForce GTX 1070 Intel Core i9-9900K 3.6GHz
GeForce GTX 1070 (Desktop)
min:
40 fps
fps
100%
GeForce GTX 1080 Ti:
86 [X] Nvidia GeForce GTX 1080 Ti Founders Edition Intel Core i7-7740X 4.3GHz
GeForce GTX 1080 Ti
min:
41 fps, max:
148 fps
fps
70%
GeForce GTX 1080 Max-Q:
60.2 [X] Acer Predator Triton 700 Intel Core i7-7700HQ 2.8GHz
GeForce GTX 1080 Max-Q
min:
30 fps
fps
68%
GeForce GTX 1070 (Desktop):
58.1 [X] MSI GeForce GTX 1070 Intel Core i9-9900K 3.6GHz
GeForce GTX 1070 (Desktop)
min:
32 fps
fps
100%
GeForce GTX 1080 Ti:
70 [X] Nvidia GeForce GTX 1080 Ti Founders Edition Intel Core i7-7740X 4.3GHz
GeForce GTX 1080 Ti
min:
36 fps, max:
118 fps
fps
70%
GeForce GTX 1080 Max-Q:
49.2 [X] Acer Predator Triton 700 Intel Core i7-7700HQ 2.8GHz
GeForce GTX 1080 Max-Q
min:
26 fps
fps
69%
GeForce GTX 1070 (Desktop):
48.5 [X] MSI GeForce GTX 1070 Intel Core i9-9900K 3.6GHz
GeForce GTX 1070 (Desktop)
min:
28 fps
fps
100%
GeForce GTX 1080 Ti:
55.7 [X] Nvidia GeForce GTX 1080 Ti Founders Edition Intel Core i7-7740X 4.3GHz
GeForce GTX 1080 Ti
min:
31 fps, max:
93 fps
fps
67%
GeForce GTX 1080 Max-Q:
37.3 [X] Acer Predator Triton 700 Intel Core i7-7700HQ 2.8GHz
GeForce GTX 1080 Max-Q
min:
22 fps
fps
68%
GeForce GTX 1070 (Desktop):
37.6 [X] MSI GeForce GTX 1070 Intel Core i9-9900K 3.6GHz
GeForce GTX 1070 (Desktop)
min:
23 fps
fps
100%
GeForce GTX 1080 Ti:
34.7 [X] Nvidia GeForce GTX 1080 Ti Founders Edition Intel Core i7-7740X 4.3GHz
GeForce GTX 1080 Ti
min:
22.5 fps, max:
51.7 fps
fps
65%
GeForce GTX 1080 Max-Q:
22.5 [X] Acer Predator Triton 700 Intel Core i7-7700HQ 2.8GHz
GeForce GTX 1080 Max-Q
min:
15 fps
fps
67%
GeForce GTX 1070 (Desktop):
23.4 [X] MSI GeForce GTX 1070 Intel Core i9-9900K 3.6GHz
GeForce GTX 1070 (Desktop)
min:
15 fps
fps
100%
GeForce GTX 1080 Ti:
144 [X] Nvidia GeForce GTX 1080 Ti Founders Edition Intel Core i7-7740X 4.3GHz
GeForce GTX 1080 Ti
min:
143 fps, max:
145 fps
fps
100%
GeForce GTX 1080 Max-Q:
144 [X] Acer Predator Triton 700 Intel Core i7-7700HQ 2.8GHz
GeForce GTX 1080 Max-Q
min:
143 fps
fps
100%
GeForce GTX 1070 (Desktop):
144 [X] MSI GeForce GTX 1070 Intel Core i9-9900K 3.6GHz
GeForce GTX 1070 (Desktop)
min:
143 fps
fps
100%
GeForce GTX 1080 Ti:
144 [X] Nvidia GeForce GTX 1080 Ti Founders Edition Intel Core i7-7740X 4.3GHz
GeForce GTX 1080 Ti
min:
143 fps, max:
145 fps
fps
92%
GeForce GTX 1080 Max-Q:
133 [X] Acer Predator Triton 700 Intel Core i7-7700HQ 2.8GHz
GeForce GTX 1080 Max-Q
min:
121 fps
fps
88%
GeForce GTX 1070 (Desktop):
127 [X] MSI GeForce GTX 1070 Intel Core i9-9900K 3.6GHz
GeForce GTX 1070 (Desktop)
min:
115 fps
fps
100%
GeForce GTX 1080 Ti:
144 [X] Nvidia GeForce GTX 1080 Ti Founders Edition Intel Core i7-7740X 4.3GHz
GeForce GTX 1080 Ti
min:
143 fps, max:
145 fps
fps
77%
GeForce GTX 1080 Max-Q:
111 [X] Acer Predator Triton 700 Intel Core i7-7700HQ 2.8GHz
GeForce GTX 1080 Max-Q
min:
98 fps
fps
78%
GeForce GTX 1070 (Desktop):
113 [X] MSI GeForce GTX 1070 Intel Core i9-9900K 3.6GHz
GeForce GTX 1070 (Desktop)
min:
101 fps
fps
100%
GeForce GTX 1080 Ti:
144 [X] Nvidia GeForce GTX 1080 Ti Founders Edition Intel Core i7-7740X 4.3GHz
GeForce GTX 1080 Ti
min:
143 fps, max:
145 fps
fps
76%
GeForce GTX 1080 Max-Q:
109 [X] Acer Predator Triton 700 Intel Core i7-7700HQ 2.8GHz
GeForce GTX 1080 Max-Q
min:
89 fps
fps
77%
GeForce GTX 1070 (Desktop):
111 [X] MSI GeForce GTX 1070 Intel Core i9-9900K 3.6GHz
GeForce GTX 1070 (Desktop)
min:
94 fps
fps
100%
GeForce GTX 1080 Ti:
112 [X] Nvidia GeForce GTX 1080 Ti Founders Edition Intel Core i7-7740X 4.3GHz
GeForce GTX 1080 Ti
min:
100 fps, max:
136 fps
fps
64%
GeForce GTX 1080 Max-Q:
71.6 [X] Acer Predator Triton 700 Intel Core i7-7700HQ 2.8GHz
GeForce GTX 1080 Max-Q
min:
57 fps
fps
66%
GeForce GTX 1070 (Desktop):
73.4 [X] MSI GeForce GTX 1070 Intel Core i9-9900K 3.6GHz
GeForce GTX 1070 (Desktop)
min:
56 fps
fps
100%
GeForce GTX 1080 Ti:
60 [X] Nvidia GeForce GTX 1080 Ti Founders Edition Intel Core i7-7740X 4.3GHz
GeForce GTX 1080 Ti
min:
53 fps, max:
74 fps
fps
61%
GeForce GTX 1080 Max-Q:
36.5 [X] Acer Predator Triton 700 Intel Core i7-7700HQ 2.8GHz
GeForce GTX 1080 Max-Q
min:
32 fps
fps
64%
GeForce GTX 1070 (Desktop):
38.4 [X] MSI GeForce GTX 1070 Intel Core i9-9900K 3.6GHz
GeForce GTX 1070 (Desktop)
min:
33 fps
fps
GeForce GTX 1080 Max-Q:
157 [X] Acer Predator Triton 700 Intel Core i7-7700HQ 2.8GHz
GeForce GTX 1080 Max-Q
min:
145 fps
fps
GeForce GTX 1070 (Desktop):
152 [X] MSI GeForce GTX 1070 Intel Core i9-9900K 3.6GHz
GeForce GTX 1070 (Desktop)
min:
142 fps
fps
GeForce GTX 1080 Max-Q:
118 [X] Acer Predator Triton 700 Intel Core i7-7700HQ 2.8GHz
GeForce GTX 1080 Max-Q
min:
108 fps
fps
GeForce GTX 1070 (Desktop):
110 [X] MSI GeForce GTX 1070 Intel Core i9-9900K 3.6GHz
GeForce GTX 1070 (Desktop)
min:
101 fps
fps
GeForce GTX 1080 Max-Q:
90 [X] Acer Predator Triton 700 Intel Core i7-7700HQ 2.8GHz
GeForce GTX 1080 Max-Q
min:
83 fps
fps
GeForce GTX 1070 (Desktop):
89.2 [X] MSI GeForce GTX 1070 Intel Core i9-9900K 3.6GHz
GeForce GTX 1070 (Desktop)
min:
83 fps
fps
100%
GeForce GTX 1080 Ti:
118 [X] Nvidia GeForce GTX 1080 Ti Founders Edition Intel Core i7-7740X 4.3GHz
GeForce GTX 1080 Ti
min:
111 fps, max:
125 fps
fps
74%
GeForce GTX 1080 Max-Q:
87.4 [X] Acer Predator Triton 700 Intel Core i7-7700HQ 2.8GHz
GeForce GTX 1080 Max-Q
min:
78 fps
fps
69%
GeForce GTX 1070 (Desktop):
77 [X] GTX 1070 Founders Edition Asus X299 Prime Intel Core i7-7740X 4.3GHz
GeForce GTX 1070 (Desktop)
min:
71 fps, max:
82 fps
86.6 [X] MSI GeForce GTX 1070 Intel Core i9-9900K 3.6GHz
GeForce GTX 1070 (Desktop)
min:
81 fps
~ 82 fps
100%
GeForce GTX 1080 Ti:
86 [X] Nvidia GeForce GTX 1080 Ti Founders Edition Intel Core i7-7740X 4.3GHz
GeForce GTX 1080 Ti
min:
80 fps, max:
91 fps
fps
68%
GeForce GTX 1080 Max-Q:
58.3 [X] Acer Predator Triton 700 Intel Core i7-7700HQ 2.8GHz
GeForce GTX 1080 Max-Q
min:
54 fps
fps
68%
GeForce GTX 1070 (Desktop):
58.1 [X] MSI GeForce GTX 1070 Intel Core i9-9900K 3.6GHz
GeForce GTX 1070 (Desktop)
min:
54 fps
fps
100%
GeForce GTX 1080 Ti:
69 [X] Nvidia GeForce GTX 1080 Ti Founders Edition Intel Core i7-7740X 4.3GHz
GeForce GTX 1080 Ti
min:
64 fps, max:
73 fps
fps
47%
GeForce GTX 1080 Max-Q:
32.1 [X] Acer Predator Triton 700 Intel Core i7-7700HQ 2.8GHz
GeForce GTX 1080 Max-Q
min:
27 fps
fps
43%
GeForce GTX 1070 (Desktop):
28.8 [X] GTX 1070 Founders Edition Asus X299 Prime Intel Core i7-7740X 4.3GHz
GeForce GTX 1070 (Desktop)
min:
21 fps, max:
33 fps
31.6 [X] MSI GeForce GTX 1070 Intel Core i9-9900K 3.6GHz
GeForce GTX 1070 (Desktop)
min:
29 fps
~ 30 fps
GeForce GTX 1080 Max-Q:
176 [X] Acer Predator Triton 700 Intel Core i7-7700HQ 2.8GHz
GeForce GTX 1080 Max-Q
min:
97 fps
fps
GeForce GTX 1070 (Desktop):
240 [X] MSI GeForce GTX 1070 Intel Core i9-9900K 3.6GHz
GeForce GTX 1070 (Desktop)
min:
158 fps
fps
GeForce GTX 1080 Max-Q:
108 [X] Acer Predator Triton 700 Intel Core i7-7700HQ 2.8GHz
GeForce GTX 1080 Max-Q
min:
72 fps
fps
GeForce GTX 1070 (Desktop):
149 [X] MSI GeForce GTX 1070 Intel Core i9-9900K 3.6GHz
GeForce GTX 1070 (Desktop)
min:
116 fps
fps
GeForce GTX 1080 Max-Q:
103 [X] Acer Predator Triton 700 Intel Core i7-7700HQ 2.8GHz
GeForce GTX 1080 Max-Q
min:
67 fps
fps
GeForce GTX 1070 (Desktop):
126 [X] MSI GeForce GTX 1070 Intel Core i9-9900K 3.6GHz
GeForce GTX 1070 (Desktop)
min:
104 fps
fps
100%
GeForce GTX 1080 Ti:
133 [X] Nvidia GeForce GTX 1080 Ti Founders Edition Intel Core i7-7740X 4.3GHz
GeForce GTX 1080 Ti
min:
86 fps, max:
154 fps
fps
70%
GeForce GTX 1080 Max-Q:
93.6 [X] Acer Predator Triton 700 Intel Core i7-7700HQ 2.8GHz
GeForce GTX 1080 Max-Q
min:
61 fps
fps
77%
GeForce GTX 1070 (Desktop):
98 [X] GTX 1070 Founders Edition Asus X299 Prime Intel Core i7-7740X 4.3GHz
GeForce GTX 1070 (Desktop)
min:
75 fps, max:
110 fps
108 [X] MSI GeForce GTX 1070 Intel Core i9-9900K 3.6GHz
GeForce GTX 1070 (Desktop)
min:
95 fps
~ 103 fps
100%
GeForce GTX 1080 Ti:
103 [X] Nvidia GeForce GTX 1080 Ti Founders Edition Intel Core i7-7740X 4.3GHz
GeForce GTX 1080 Ti
min:
79 fps, max:
118 fps
fps
67%
GeForce GTX 1080 Max-Q:
68.9 [X] Acer Predator Triton 700 Intel Core i7-7700HQ 2.8GHz
GeForce GTX 1080 Max-Q
min:
57 fps
fps
66%
GeForce GTX 1070 (Desktop):
64 [X] GTX 1070 Founders Edition Asus X299 Prime Intel Core i7-7740X 4.3GHz
GeForce GTX 1070 (Desktop)
min:
57 fps, max:
71 fps
71.2 [X] MSI GeForce GTX 1070 Intel Core i9-9900K 3.6GHz
GeForce GTX 1070 (Desktop)
min:
63 fps
~ 68 fps
100%
GeForce GTX 1080 Ti:
52.6 [X] Nvidia GeForce GTX 1080 Ti Founders Edition Intel Core i7-7740X 4.3GHz
GeForce GTX 1080 Ti
min:
47 fps, max:
59 fps
fps
64%
GeForce GTX 1080 Max-Q:
33.6 [X] Acer Predator Triton 700 Intel Core i7-7700HQ 2.8GHz
GeForce GTX 1080 Max-Q
min:
29 fps
fps
65%
GeForce GTX 1070 (Desktop):
31.9 [X] GTX 1070 Founders Edition Asus X299 Prime Intel Core i7-7740X 4.3GHz
GeForce GTX 1070 (Desktop)
min:
28 fps, max:
36 fps
35.1 [X] MSI GeForce GTX 1070 Intel Core i9-9900K 3.6GHz
GeForce GTX 1070 (Desktop)
min:
31 fps
~ 34 fps
100%
GeForce GTX 1080 Ti:
181 [X] Nvidia GeForce GTX 1080 Ti Founders Edition Intel Core i7-7740X 4.3GHz
GeForce GTX 1080 Ti
min:
145 fps, max:
201 fps
fps
92%
GeForce GTX 1080 Max-Q:
167 [X] Acer Predator Triton 700 Intel Core i7-7700HQ 2.8GHz
GeForce GTX 1080 Max-Q
min:
113 fps
fps
102%
GeForce GTX 1070 (Desktop):
177.3 [X] MSI Aegis 3 8RD Intel Core i7-8700 3.2GHz
GeForce GTX 1070 (Desktop)
min:
142 fps, max:
201 fps
190 [X] MSI GeForce GTX 1070 Intel Core i9-9900K 3.6GHz
GeForce GTX 1070 (Desktop)
min:
158 fps
~ 184 fps
100%
GeForce GTX 1080 Ti:
166 [X] Nvidia GeForce GTX 1080 Ti Founders Edition Intel Core i7-7740X 4.3GHz
GeForce GTX 1080 Ti
min:
124 fps, max:
196 fps
fps
80%
GeForce GTX 1080 Max-Q:
133 [X] Acer Predator Triton 700 Intel Core i7-7700HQ 2.8GHz
GeForce GTX 1080 Max-Q
min:
86 fps
fps
85%
GeForce GTX 1070 (Desktop):
136.6 [X] MSI Aegis 3 8RD Intel Core i7-8700 3.2GHz
GeForce GTX 1070 (Desktop)
min:
102 fps, max:
172 fps
146 [X] MSI GeForce GTX 1070 Intel Core i9-9900K 3.6GHz
GeForce GTX 1070 (Desktop)
min:
119 fps
~ 141 fps
100%
GeForce GTX 1080 Ti:
154 [X] Nvidia GeForce GTX 1080 Ti Founders Edition Intel Core i7-7740X 4.3GHz
GeForce GTX 1080 Ti
min:
132 fps, max:
191 fps
fps
79%
GeForce GTX 1080 Max-Q:
121 [X] Acer Predator Triton 700 Intel Core i7-7700HQ 2.8GHz
GeForce GTX 1080 Max-Q
min:
81 fps
fps
77%
GeForce GTX 1070 (Desktop):
117.5 [X] MSI Aegis 3 8RD Intel Core i7-8700 3.2GHz
GeForce GTX 1070 (Desktop)
min:
98 fps, max:
164 fps
121 [X] MSI GeForce GTX 1070 Intel Core i9-9900K 3.6GHz
GeForce GTX 1070 (Desktop)
min:
99 fps
~ 119 fps
100%
GeForce GTX 1080 Ti:
149 [X] Nvidia GeForce GTX 1080 Ti Founders Edition Intel Core i7-7740X 4.3GHz
GeForce GTX 1080 Ti
min:
120 fps, max:
198 fps
fps
72%
GeForce GTX 1080 Max-Q:
108 [X] Acer Predator Triton 700 Intel Core i7-7700HQ 2.8GHz
GeForce GTX 1080 Max-Q
min:
77 fps
fps
70%
GeForce GTX 1070 (Desktop):
97 [X] GTX 1070 Founders Edition Asus X299 Prime Intel Core i7-7740X 4.3GHz
GeForce GTX 1070 (Desktop)
min:
77 fps, max:
139 fps
106.7 [X] MSI Aegis 3 8RD Intel Core i7-8700 3.2GHz
GeForce GTX 1070 (Desktop)
min:
86 fps, max:
152 fps
110 [X] MSI GeForce GTX 1070 Intel Core i9-9900K 3.6GHz
GeForce GTX 1070 (Desktop)
min:
87 fps
~ 105 fps
100%
GeForce GTX 1080 Ti:
118 [X] Nvidia GeForce GTX 1080 Ti Founders Edition Intel Core i7-7740X 4.3GHz
GeForce GTX 1080 Ti
min:
95 fps, max:
165 fps
fps
69%
GeForce GTX 1080 Max-Q:
81.7 [X] Acer Predator Triton 700 Intel Core i7-7700HQ 2.8GHz
GeForce GTX 1080 Max-Q
min:
65 fps
fps
71%
GeForce GTX 1070 (Desktop):
83.6 [X] MSI GeForce GTX 1070 Intel Core i9-9900K 3.6GHz
GeForce GTX 1070 (Desktop)
min:
66 fps
fps
100%
GeForce GTX 1080 Ti:
70 [X] Nvidia GeForce GTX 1080 Ti Founders Edition Intel Core i7-7740X 4.3GHz
GeForce GTX 1080 Ti
min:
54 fps, max:
110 fps
fps
64%
GeForce GTX 1080 Max-Q:
44.8 [X] Acer Predator Triton 700 Intel Core i7-7700HQ 2.8GHz
GeForce GTX 1080 Max-Q
min:
36 fps
fps
63%
GeForce GTX 1070 (Desktop):
39.7 [X] GTX 1070 Founders Edition Asus X299 Prime Intel Core i7-7740X 4.3GHz
GeForce GTX 1070 (Desktop)
min:
32 fps, max:
58 fps
44.9 [X] MSI Aegis 3 8RD Intel Core i7-8700 3.2GHz
GeForce GTX 1070 (Desktop)
min:
36 fps, max:
69 fps
46.7 [X] MSI GeForce GTX 1070 Intel Core i9-9900K 3.6GHz
GeForce GTX 1070 (Desktop)
min:
37 fps
~ 44 fps
GeForce GTX 1080 Max-Q:
167 [X] Acer Predator Triton 700 Intel Core i7-7700HQ 2.8GHz
GeForce GTX 1080 Max-Q
min:
142 fps
fps
GeForce GTX 1070 (Desktop):
313 [X] MSI GeForce GTX 1070 Intel Core i9-9900K 3.6GHz
GeForce GTX 1070 (Desktop)
min:
268 fps
fps
GeForce GTX 1080 Max-Q:
130 [X] Acer Predator Triton 700 Intel Core i7-7700HQ 2.8GHz
GeForce GTX 1080 Max-Q
min:
119 fps
fps
GeForce GTX 1070 (Desktop):
231 [X] MSI GeForce GTX 1070 Intel Core i9-9900K 3.6GHz
GeForce GTX 1070 (Desktop)
min:
197 fps
fps
GeForce GTX 1080 Max-Q:
114 [X] Acer Predator Triton 700 Intel Core i7-7700HQ 2.8GHz
GeForce GTX 1080 Max-Q
min:
102 fps
fps
GeForce GTX 1070 (Desktop):
185 [X] MSI GeForce GTX 1070 Intel Core i9-9900K 3.6GHz
GeForce GTX 1070 (Desktop)
min:
165 fps
fps
100%
GeForce GTX 1080 Ti:
144 [X] Nvidia GeForce GTX 1080 Ti Founders Edition Intel Core i7-7740X 4.3GHz
GeForce GTX 1080 Ti
min:
123 fps, max:
195 fps
fps
71%
GeForce GTX 1080 Max-Q:
102 [X] Acer Predator Triton 700 Intel Core i7-7700HQ 2.8GHz
GeForce GTX 1080 Max-Q
min:
93 fps
fps
100%
GeForce GTX 1070 (Desktop):
144 [X] MSI GeForce GTX 1070 Intel Core i9-9900K 3.6GHz
GeForce GTX 1070 (Desktop)
min:
125 fps
fps
GeForce GTX 1080 Max-Q:
97 [X] Acer Predator Triton 700 Intel Core i7-7700HQ 2.8GHz
GeForce GTX 1080 Max-Q
min:
84 fps
fps
GeForce GTX 1070 (Desktop):
102 [X] MSI GeForce GTX 1070 Intel Core i9-9900K 3.6GHz
GeForce GTX 1070 (Desktop)
min:
86 fps
fps
100%
GeForce GTX 1080 Ti:
85 [X] Nvidia GeForce GTX 1080 Ti Founders Edition Intel Core i7-7740X 4.3GHz
GeForce GTX 1080 Ti
min:
69 fps, max:
131 fps
fps
64%
GeForce GTX 1070 (Desktop):
51 [X] GTX 1070 Founders Edition Asus X299 Prime Intel Core i7-7740X 4.3GHz
GeForce GTX 1070 (Desktop)
min:
40 fps, max:
86 fps
57 [X] MSI GeForce GTX 1070 Intel Core i9-9900K 3.6GHz
GeForce GTX 1070 (Desktop)
min:
46 fps
~ 54 fps
100%
GeForce GTX 1080 Ti:
59.9 [X] Nvidia GeForce GTX 1080 Ti Founders Edition Intel Core i7-7740X 4.3GHz
GeForce GTX 1080 Ti
fps
100%
GeForce GTX 1080 Max-Q:
60 [X] Acer Predator Triton 700 Intel Core i7-7700HQ 2.8GHz
GeForce GTX 1080 Max-Q
min:
57 fps
fps
100%
GeForce GTX 1070 (Desktop):
60 [X] Nvidia GeForce GTX 1070 Intel Core i7-6700K 4GHz
GeForce GTX 1070 (Desktop)
min:
57 fps
60 ~ 60 fps
100%
GeForce GTX 1080 Ti:
59.9 [X] Nvidia GeForce GTX 1080 Ti Founders Edition Intel Core i7-7740X 4.3GHz
GeForce GTX 1080 Ti
fps
100%
GeForce GTX 1080 Max-Q:
59.9 [X] Acer Predator Triton 700 Intel Core i7-7700HQ 2.8GHz
GeForce GTX 1080 Max-Q
min:
55 fps
fps
100%
GeForce GTX 1070 (Desktop):
60 [X] Nvidia GeForce GTX 1070 Intel Core i7-6700K 4GHz
GeForce GTX 1070 (Desktop)
min:
57 fps
60 ~ 60 fps
100%
GeForce GTX 1080 Ti:
59.9 [X] Nvidia GeForce GTX 1080 Ti Founders Edition Intel Core i7-7740X 4.3GHz
GeForce GTX 1080 Ti
fps
100%
GeForce GTX 1080 Max-Q:
59.9 [X] Acer Predator Triton 700 Intel Core i7-7700HQ 2.8GHz
GeForce GTX 1080 Max-Q
min:
54 fps
fps
100%
GeForce GTX 1070 (Desktop):
59.9 [X] Nvidia GeForce GTX 1070 Intel Core i7-6700K 4GHz
GeForce GTX 1070 (Desktop)
min:
56 fps
59.9 ~ 60 fps
100%
GeForce GTX 1080 Ti:
59.9 [X] Nvidia GeForce GTX 1080 Ti Founders Edition Intel Core i7-7740X 4.3GHz
GeForce GTX 1080 Ti
fps
100%
GeForce GTX 1080 Max-Q:
59.8 [X] Acer Predator Triton 700 Intel Core i7-7700HQ 2.8GHz
GeForce GTX 1080 Max-Q
min:
54 fps
fps
100%
GeForce GTX 1070 (Desktop):
59.9 [X] Nvidia GeForce GTX 1070 Intel Core i7-6700K 4GHz
GeForce GTX 1070 (Desktop)
min:
56 fps
59.9 ~ 60 fps
GeForce GTX 1080 Max-Q:
59.8 [X] Acer Predator Triton 700 Intel Core i7-7700HQ 2.8GHz
GeForce GTX 1080 Max-Q
min:
53 fps
fps
GeForce GTX 1070 (Desktop):
59.8 [X] Nvidia GeForce GTX 1070 Intel Core i7-6700K 4GHz
GeForce GTX 1070 (Desktop)
min:
53 fps
fps
100%
GeForce GTX 1080 Ti:
59.9 [X] Nvidia GeForce GTX 1080 Ti Founders Edition Intel Core i7-7740X 4.3GHz
GeForce GTX 1080 Ti
min:
56 fps, max:
63 fps
fps
74%
GeForce GTX 1080 Max-Q:
44.6 [X] Acer Predator Triton 700 Intel Core i7-7700HQ 2.8GHz
GeForce GTX 1080 Max-Q
min:
38 fps
fps
73%
GeForce GTX 1070 (Desktop):
43.3 45.6 [X] Nvidia GeForce GTX 1070 Intel Core i7-6700K 4GHz
GeForce GTX 1070 (Desktop)
min:
39 fps
~ 44 fps
100%
GeForce GTX 1080 Ti:
81 [X] Nvidia GeForce GTX 1080 Ti Founders Edition Intel Core i7-7740X 4.3GHz
GeForce GTX 1080 Ti
min:
45 fps, max:
104 fps
92 [X] Nvidia GeForce GTX 1080 Ti Founders Edition Intel Core i7-7740X 4.3GHz
GeForce GTX 1080 Ti
min:
72 fps, max:
121 fps
~ 87 fps
87%
GeForce GTX 1080 Max-Q:
75.7 [X] Acer Predator Triton 700 Intel Core i7-7700HQ 2.8GHz
GeForce GTX 1080 Max-Q
min:
57 fps
fps
102%
GeForce GTX 1070 (Desktop):
85.9 [X] Nvidia GeForce GTX 1070 Intel Core i7-6700K 4GHz
GeForce GTX 1070 (Desktop)
min:
67 fps
92.7 [X] MSI Aegis 3 8RD Intel Core i7-8700 3.2GHz
GeForce GTX 1070 (Desktop)
min:
72 fps, max:
125 fps
~ 89 fps
100%
GeForce GTX 1080 Ti:
82 [X] Nvidia GeForce GTX 1080 Ti Founders Edition Intel Core i7-7740X 4.3GHz
GeForce GTX 1080 Ti
min:
66 fps, max:
105 fps
fps
91%
GeForce GTX 1080 Max-Q:
74.3 [X] Acer Predator Triton 700 Intel Core i7-7700HQ 2.8GHz
GeForce GTX 1080 Max-Q
min:
52 fps
fps
106%
GeForce GTX 1070 (Desktop):
83 [X] Nvidia GeForce GTX 1070 Intel Core i7-6700K 4GHz
GeForce GTX 1070 (Desktop)
min:
65 fps
91.4 [X] MSI Aegis 3 8RD Intel Core i7-8700 3.2GHz
GeForce GTX 1070 (Desktop)
min:
72 fps, max:
124 fps
~ 87 fps
100%
GeForce GTX 1080 Ti:
75 [X] Nvidia GeForce GTX 1080 Ti Founders Edition Intel Core i7-7740X 4.3GHz
GeForce GTX 1080 Ti
fps
91%
GeForce GTX 1080 Max-Q:
68.5 [X] Acer Predator Triton 700 Intel Core i7-7700HQ 2.8GHz
GeForce GTX 1080 Max-Q
min:
51 fps
fps
107%
GeForce GTX 1070 (Desktop):
76.4 [X] Nvidia GeForce GTX 1070 Intel Core i7-6700K 4GHz
GeForce GTX 1070 (Desktop)
min:
58 fps
83.2 [X] MSI Aegis 3 8RD Intel Core i7-8700 3.2GHz
GeForce GTX 1070 (Desktop)
min:
65 fps, max:
116 fps
~ 80 fps
100%
GeForce GTX 1080 Ti:
74 [X] Nvidia GeForce GTX 1080 Ti Founders Edition Intel Core i7-7740X 4.3GHz
GeForce GTX 1080 Ti
fps
92%
GeForce GTX 1080 Max-Q:
68.1 [X] Acer Predator Triton 700 Intel Core i7-7700HQ 2.8GHz
GeForce GTX 1080 Max-Q
min:
50 fps
fps
103%
GeForce GTX 1070 (Desktop):
73 [X] GTX 1070 Founders Edition Asus X299 Prime Intel Core i7-7740X 4.3GHz
GeForce GTX 1070 (Desktop)
min:
55 fps, max:
99 fps
74 [X] Nvidia GeForce GTX 1070 Intel Core i7-6700K 4GHz
GeForce GTX 1070 (Desktop)
min:
56 fps
80.2 [X] MSI Aegis 3 8RD Intel Core i7-8700 3.2GHz
GeForce GTX 1070 (Desktop)
min:
61 fps, max:
113 fps
~ 76 fps
100%
GeForce GTX 1080 Ti:
72 [X] Nvidia GeForce GTX 1080 Ti Founders Edition Intel Core i7-7740X 4.3GHz
GeForce GTX 1080 Ti
min:
55 fps, max:
97 fps
fps
87%
GeForce GTX 1080 Max-Q:
62.8 [X] Acer Predator Triton 700 Intel Core i7-7700HQ 2.8GHz
GeForce GTX 1080 Max-Q
min:
48 fps
fps
94%
GeForce GTX 1070 (Desktop):
67.4 [X] Nvidia GeForce GTX 1070 Intel Core i7-6700K 4GHz
GeForce GTX 1070 (Desktop)
min:
56 fps
fps
100%
GeForce GTX 1080 Ti:
51.9 [X] Nvidia GeForce GTX 1080 Ti Founders Edition Intel Core i7-7740X 4.3GHz
GeForce GTX 1080 Ti
min:
45 fps, max:
59 fps
fps
68%
GeForce GTX 1080 Max-Q:
35.2 [X] Acer Predator Triton 700 Intel Core i7-7700HQ 2.8GHz
GeForce GTX 1080 Max-Q
min:
29 fps
fps
69%
GeForce GTX 1070 (Desktop):
30.8 [X] GTX 1070 Founders Edition Asus X299 Prime Intel Core i7-7740X 4.3GHz
GeForce GTX 1070 (Desktop)
min:
26 fps, max:
37 fps
37 [X] Nvidia GeForce GTX 1070 Intel Core i7-6700K 4GHz
GeForce GTX 1070 (Desktop)
min:
32 fps
39.7 [X] MSI Aegis 3 8RD Intel Core i7-8700 3.2GHz
GeForce GTX 1070 (Desktop)
min:
33 fps, max:
48 fps
~ 36 fps
100%
GeForce GTX 1080 Ti:
191 [X] Nvidia GeForce GTX 1080 Ti Founders Edition Intel Core i7-7740X 4.3GHz
GeForce GTX 1080 Ti
min:
159 fps, max:
213 fps
fps
71%
GeForce GTX 1080 Max-Q:
136 [X] Acer Predator Triton 700 Intel Core i7-7700HQ 2.8GHz
GeForce GTX 1080 Max-Q
min:
121 fps
fps
102%
GeForce GTX 1070 (Desktop):
164 [X] Nvidia GeForce GTX 1070 Intel Core i7-6700K 4GHz
GeForce GTX 1070 (Desktop)
min:
142 fps
224.7 [X] MSI Aegis 3 8RD Intel Core i7-8700 3.2GHz
GeForce GTX 1070 (Desktop)
min:
190 fps, max:
248 fps
~ 194 fps
100%
GeForce GTX 1080 Ti:
162 [X] Nvidia GeForce GTX 1080 Ti Founders Edition Intel Core i7-7740X 4.3GHz
GeForce GTX 1080 Ti
min:
135 fps, max:
201 fps
fps
72%
GeForce GTX 1080 Max-Q:
116 [X] Acer Predator Triton 700 Intel Core i7-7700HQ 2.8GHz
GeForce GTX 1080 Max-Q
min:
95 fps
fps
101%
GeForce GTX 1070 (Desktop):
128 [X] Nvidia GeForce GTX 1070 Intel Core i7-6700K 4GHz
GeForce GTX 1070 (Desktop)
min:
91 fps
199.5 [X] MSI Aegis 3 8RD Intel Core i7-8700 3.2GHz
GeForce GTX 1070 (Desktop)
min:
164 fps, max:
237 fps
~ 164 fps
100%
GeForce GTX 1080 Ti:
149 [X] Nvidia GeForce GTX 1080 Ti Founders Edition Intel Core i7-7740X 4.3GHz
GeForce GTX 1080 Ti
min:
130 fps, max:
180 fps
fps
71%
GeForce GTX 1080 Max-Q:
106 [X] Acer Predator Triton 700 Intel Core i7-7700HQ 2.8GHz
GeForce GTX 1080 Max-Q
min:
87 fps
fps
105%
GeForce GTX 1070 (Desktop):
116 [X] Nvidia GeForce GTX 1070 Intel Core i7-6700K 4GHz
GeForce GTX 1070 (Desktop)
min:
86 fps
196.7 [X] MSI Aegis 3 8RD Intel Core i7-8700 3.2GHz
GeForce GTX 1070 (Desktop)
min:
153 fps, max:
238 fps
~ 156 fps
100%
GeForce GTX 1080 Ti:
145 [X] Nvidia GeForce GTX 1080 Ti Founders Edition Intel Core i7-7740X 4.3GHz
GeForce GTX 1080 Ti
min:
128 fps, max:
171 fps
fps
70%
GeForce GTX 1080 Max-Q:
102 [X] Acer Predator Triton 700 Intel Core i7-7700HQ 2.8GHz
GeForce GTX 1080 Max-Q
min:
80 fps
fps
101%
GeForce GTX 1070 (Desktop):
109 [X] Nvidia GeForce GTX 1070 Intel Core i7-6700K 4GHz
GeForce GTX 1070 (Desktop)
min:
84 fps
184.5 [X] MSI Aegis 3 8RD Intel Core i7-8700 3.2GHz
GeForce GTX 1070 (Desktop)
min:
151 fps, max:
213 fps
~ 147 fps
100%
GeForce GTX 1080 Ti:
108 [X] Nvidia GeForce GTX 1080 Ti Founders Edition Intel Core i7-7740X 4.3GHz
GeForce GTX 1080 Ti
min:
75 fps, max:
138 fps
fps
67%
GeForce GTX 1080 Max-Q:
72.4 [X] Acer Predator Triton 700 Intel Core i7-7700HQ 2.8GHz
GeForce GTX 1080 Max-Q
min:
55 fps
fps
66%
GeForce GTX 1070 (Desktop):
71.3 [X] Nvidia GeForce GTX 1070 Intel Core i7-6700K 4GHz
GeForce GTX 1070 (Desktop)
min:
54 fps
fps
100%
GeForce GTX 1080 Ti:
56.1 [X] Nvidia GeForce GTX 1080 Ti Founders Edition Intel Core i7-7740X 4.3GHz
GeForce GTX 1080 Ti
min:
37 fps, max:
73 fps
fps
63%
GeForce GTX 1080 Max-Q:
35.4 [X] Acer Predator Triton 700 Intel Core i7-7700HQ 2.8GHz
GeForce GTX 1080 Max-Q
min:
24 fps
fps
89%
GeForce GTX 1070 (Desktop):
34.4 [X] Nvidia GeForce GTX 1070 Intel Core i7-6700K 4GHz
GeForce GTX 1070 (Desktop)
min:
22 fps
64.6 ~ 50 fps
100%
GeForce GTX 1080 Ti:
109 [X] Nvidia GeForce GTX 1080 Ti Founders Edition Intel Core i7-7740X 4.3GHz
GeForce GTX 1080 Ti
min:
53 fps, max:
150 fps
fps
79%
GeForce GTX 1080 Max-Q:
86 [X] Acer Predator Triton 700 Intel Core i7-7700HQ 2.8GHz
GeForce GTX 1080 Max-Q
min:
44 fps
fps
98%
GeForce GTX 1070 (Desktop):
101 [X] Nvidia GeForce GTX 1070 Intel Core i7-6700K 4GHz
GeForce GTX 1070 (Desktop)
min:
43 fps
113 [X] MSI Aegis 3 8RD Intel Core i7-8700 3.2GHz
GeForce GTX 1070 (Desktop)
min:
59 fps, max:
169 fps
~ 107 fps
100%
GeForce GTX 1080 Ti:
100 [X] Nvidia GeForce GTX 1080 Ti Founders Edition Intel Core i7-7740X 4.3GHz
GeForce GTX 1080 Ti
min:
55 fps, max:
144 fps
fps
78%
GeForce GTX 1080 Max-Q:
78 [X] Acer Predator Triton 700 Intel Core i7-7700HQ 2.8GHz
GeForce GTX 1080 Max-Q
min:
42 fps
fps
89%
GeForce GTX 1070 (Desktop):
88 [X] Nvidia GeForce GTX 1070 Intel Core i7-6700K 4GHz
GeForce GTX 1070 (Desktop)
min:
36 fps
89 [X] MSI Aegis 3 8RD Intel Core i7-8700 3.2GHz
GeForce GTX 1070 (Desktop)
min:
36 fps, max:
150 fps
~ 89 fps
100%
GeForce GTX 1080 Ti:
90 [X] Nvidia GeForce GTX 1080 Ti Founders Edition Intel Core i7-7740X 4.3GHz
GeForce GTX 1080 Ti
min:
55 fps, max:
133 fps
fps
79%
GeForce GTX 1080 Max-Q:
71 [X] Acer Predator Triton 700 Intel Core i7-7700HQ 2.8GHz
GeForce GTX 1080 Max-Q
min:
38 fps
fps
84%
GeForce GTX 1070 (Desktop):
76 [X] Nvidia GeForce GTX 1070 Intel Core i7-6700K 4GHz
GeForce GTX 1070 (Desktop)
min:
34 fps
76 [X] MSI Aegis 3 8RD Intel Core i7-8700 3.2GHz
GeForce GTX 1070 (Desktop)
min:
37 fps, max:
139 fps
~ 76 fps
100%
GeForce GTX 1080 Ti:
71 [X] Nvidia GeForce GTX 1080 Ti Founders Edition Intel Core i7-7740X 4.3GHz
GeForce GTX 1080 Ti
min:
34 fps, max:
113 fps
fps
76%
GeForce GTX 1080 Max-Q:
54 [X] Acer Predator Triton 700 Intel Core i7-7700HQ 2.8GHz
GeForce GTX 1080 Max-Q
min:
30 fps
fps
76%
GeForce GTX 1070 (Desktop):
50 [X] GTX 1070 Founders Edition Asus X299 Prime Intel Core i7-7740X 4.3GHz
GeForce GTX 1070 (Desktop)
min:
18 fps, max:
89 fps
55 [X] MSI Aegis 3 8RD Intel Core i7-8700 3.2GHz
GeForce GTX 1070 (Desktop)
min:
11 fps, max:
101 fps
57 [X] Nvidia GeForce GTX 1070 Intel Core i7-6700K 4GHz
GeForce GTX 1070 (Desktop)
min:
33 fps
~ 54 fps
100%
GeForce GTX 1080 Ti:
62 [X] Nvidia GeForce GTX 1080 Ti Founders Edition Intel Core i7-7740X 4.3GHz
GeForce GTX 1080 Ti
min:
34 fps, max:
107 fps
fps
69%
GeForce GTX 1080 Max-Q:
43 [X] Acer Predator Triton 700 Intel Core i7-7700HQ 2.8GHz
GeForce GTX 1080 Max-Q
min:
24 fps
fps
73%
GeForce GTX 1070 (Desktop):
45 [X] Nvidia GeForce GTX 1070 Intel Core i7-6700K 4GHz
GeForce GTX 1070 (Desktop)
min:
30 fps
fps
100%
GeForce GTX 1080 Ti:
40 [X] Nvidia GeForce GTX 1080 Ti Founders Edition Intel Core i7-7740X 4.3GHz
GeForce GTX 1080 Ti
min:
19 fps, max:
83 fps
fps
65%
GeForce GTX 1080 Max-Q:
26 [X] Acer Predator Triton 700 Intel Core i7-7700HQ 2.8GHz
GeForce GTX 1080 Max-Q
min:
17 fps
fps
65%
GeForce GTX 1070 (Desktop):
25 [X] GTX 1070 Founders Edition Asus X299 Prime Intel Core i7-7740X 4.3GHz
GeForce GTX 1070 (Desktop)
min:
12 fps, max:
81 fps
26 [X] MSI Aegis 3 8RD Intel Core i7-8700 3.2GHz
GeForce GTX 1070 (Desktop)
min:
12 fps, max:
69 fps
27 [X] Nvidia GeForce GTX 1070 Intel Core i7-6700K 4GHz
GeForce GTX 1070 (Desktop)
min:
20 fps
~ 26 fps
100%
GeForce GTX 1080 Ti:
178 [X] Nvidia GeForce GTX 1080 Ti Founders Edition Intel Core i7-7740X 4.3GHz
GeForce GTX 1080 Ti
min:
165 fps, max:
213 fps
fps
81%
GeForce GTX 1080 Max-Q:
144 [X] Acer Predator Triton 700 Intel Core i7-7700HQ 2.8GHz
GeForce GTX 1080 Max-Q
min:
129 fps
fps
98%
GeForce GTX 1070 (Desktop):
170 [X] Nvidia GeForce GTX 1070 Intel Core i7-6700K 4GHz
GeForce GTX 1070 (Desktop)
min:
155 fps
180 ~ 175 fps
100%
GeForce GTX 1080 Ti:
147 [X] Nvidia GeForce GTX 1080 Ti Founders Edition Intel Core i7-7740X 4.3GHz
GeForce GTX 1080 Ti
min:
130 fps, max:
181 fps
fps
84%
GeForce GTX 1080 Max-Q:
124 [X] Acer Predator Triton 700 Intel Core i7-7700HQ 2.8GHz
GeForce GTX 1080 Max-Q
min:
105 fps
fps
88%
GeForce GTX 1070 (Desktop):
127 131 [X] Nvidia GeForce GTX 1070 Intel Core i7-6700K 4GHz
GeForce GTX 1070 (Desktop)
min:
111 fps
~ 129 fps
100%
GeForce GTX 1080 Ti:
145 [X] Nvidia GeForce GTX 1080 Ti Founders Edition Intel Core i7-7740X 4.3GHz
GeForce GTX 1080 Ti
min:
126 fps, max:
180 fps
fps
84%
GeForce GTX 1080 Max-Q:
122 [X] Acer Predator Triton 700 Intel Core i7-7700HQ 2.8GHz
GeForce GTX 1080 Max-Q
min:
103 fps
fps
83%
GeForce GTX 1070 (Desktop):
118 123 [X] Nvidia GeForce GTX 1070 Intel Core i7-6700K 4GHz
GeForce GTX 1070 (Desktop)
min:
102 fps
~ 121 fps
100%
GeForce GTX 1080 Ti:
120 [X] Nvidia GeForce GTX 1080 Ti Founders Edition Intel Core i7-7740X 4.3GHz
GeForce GTX 1080 Ti
min:
102 fps, max:
158 fps
fps
88%
GeForce GTX 1080 Max-Q:
106 [X] Acer Predator Triton 700 Intel Core i7-7700HQ 2.8GHz
GeForce GTX 1080 Max-Q
min:
92 fps
fps
78%
GeForce GTX 1070 (Desktop):
89 [X] GTX 1070 Founders Edition Asus X299 Prime Intel Core i7-7740X 4.3GHz
GeForce GTX 1070 (Desktop)
94 98 [X] Nvidia GeForce GTX 1070 Intel Core i7-6700K 4GHz
GeForce GTX 1070 (Desktop)
min:
84 fps
~ 94 fps
100%
GeForce GTX 1080 Ti:
102 [X] Nvidia GeForce GTX 1080 Ti Founders Edition Intel Core i7-7740X 4.3GHz
GeForce GTX 1080 Ti
min:
90 fps, max:
131 fps
fps
82%
GeForce GTX 1080 Max-Q:
84 [X] Acer Predator Triton 700 Intel Core i7-7700HQ 2.8GHz
GeForce GTX 1080 Max-Q
min:
74 fps
fps
77%
GeForce GTX 1070 (Desktop):
79 [X] Nvidia GeForce GTX 1070 Intel Core i7-6700K 4GHz
GeForce GTX 1070 (Desktop)
min:
70 fps
fps
100%
GeForce GTX 1080 Ti:
75 [X] Nvidia GeForce GTX 1080 Ti Founders Edition Intel Core i7-7740X 4.3GHz
GeForce GTX 1080 Ti
min:
67 fps, max:
93 fps
fps
73%
GeForce GTX 1080 Max-Q:
55 [X] Acer Predator Triton 700 Intel Core i7-7700HQ 2.8GHz
GeForce GTX 1080 Max-Q
min:
47 fps
fps
68%
GeForce GTX 1070 (Desktop):
47 [X] GTX 1070 Founders Edition Asus X299 Prime Intel Core i7-7740X 4.3GHz
GeForce GTX 1070 (Desktop)
52 54 [X] Nvidia GeForce GTX 1070 Intel Core i7-6700K 4GHz
GeForce GTX 1070 (Desktop)
min:
47 fps
~ 51 fps
100%
GeForce GTX 1080 Ti:
311 [X] Nvidia GeForce GTX 1080 Ti Founders Edition Intel Core i7-7740X 4.3GHz
GeForce GTX 1080 Ti
min:
295 fps, max:
337 fps
fps
92%
GeForce GTX 1080 Max-Q:
286 [X] Acer Predator Triton 700 Intel Core i7-7700HQ 2.8GHz
GeForce GTX 1080 Max-Q
min:
263 fps
fps
96%
GeForce GTX 1070 (Desktop):
273.3 [X] MSI Aegis 3 8RD Intel Core i7-8700 3.2GHz
GeForce GTX 1070 (Desktop)
min:
259 fps, max:
285 fps
326 [X] Nvidia GeForce GTX 1070 Intel Core i7-6700K 4GHz
GeForce GTX 1070 (Desktop)
min:
302 fps
~ 300 fps
100%
GeForce GTX 1080 Ti:
293 [X] Nvidia GeForce GTX 1080 Ti Founders Edition Intel Core i7-7740X 4.3GHz
GeForce GTX 1080 Ti
min:
28 fps, max:
345 fps
fps
89%
GeForce GTX 1080 Max-Q:
260 [X] Acer Predator Triton 700 Intel Core i7-7700HQ 2.8GHz
GeForce GTX 1080 Max-Q
min:
238 fps
fps
97%
GeForce GTX 1070 (Desktop):
248.7 [X] MSI Aegis 3 8RD Intel Core i7-8700 3.2GHz
GeForce GTX 1070 (Desktop)
min:
237 fps, max:
261 fps
320 [X] Nvidia GeForce GTX 1070 Intel Core i7-6700K 4GHz
GeForce GTX 1070 (Desktop)
min:
302 fps
~ 284 fps
100%
GeForce GTX 1080 Ti:
284 [X] Nvidia GeForce GTX 1080 Ti Founders Edition Intel Core i7-7740X 4.3GHz
GeForce GTX 1080 Ti
min:
268 fps, max:
322 fps
fps
85%
GeForce GTX 1080 Max-Q:
240 [X] Acer Predator Triton 700 Intel Core i7-7700HQ 2.8GHz
GeForce GTX 1080 Max-Q
min:
216 fps
fps
92%
GeForce GTX 1070 (Desktop):
232.1 [X] MSI Aegis 3 8RD Intel Core i7-8700 3.2GHz
GeForce GTX 1070 (Desktop)
min:
219 fps, max:
265 fps
290 [X] Nvidia GeForce GTX 1070 Intel Core i7-6700K 4GHz
GeForce GTX 1070 (Desktop)
min:
264 fps
~ 261 fps
100%
GeForce GTX 1080 Ti:
281 [X] Nvidia GeForce GTX 1080 Ti Founders Edition Intel Core i7-7740X 4.3GHz
GeForce GTX 1080 Ti
min:
265 fps, max:
318 fps
fps
85%
GeForce GTX 1080 Max-Q:
239 [X] Acer Predator Triton 700 Intel Core i7-7700HQ 2.8GHz
GeForce GTX 1080 Max-Q
min:
212 fps
fps
92%
GeForce GTX 1070 (Desktop):
229.3 [X] MSI Aegis 3 8RD Intel Core i7-8700 3.2GHz
GeForce GTX 1070 (Desktop)
min:
223 fps, max:
245 fps
288 [X] Nvidia GeForce GTX 1070 Intel Core i7-6700K 4GHz
GeForce GTX 1070 (Desktop)
min:
260 fps
~ 259 fps
100%
GeForce GTX 1080 Ti:
265 [X] Nvidia GeForce GTX 1080 Ti Founders Edition Intel Core i7-7740X 4.3GHz
GeForce GTX 1080 Ti
min:
231 fps, max:
301 fps
fps
90%
GeForce GTX 1080 Max-Q:
238 [X] Acer Predator Triton 700 Intel Core i7-7700HQ 2.8GHz
GeForce GTX 1080 Max-Q
min:
210 fps
fps
94%
GeForce GTX 1070 (Desktop):
248 [X] Nvidia GeForce GTX 1070 Intel Core i7-6700K 4GHz
GeForce GTX 1070 (Desktop)
min:
200 fps
fps
100%
GeForce GTX 1080 Ti:
173 [X] Nvidia GeForce GTX 1080 Ti Founders Edition Intel Core i7-7740X 4.3GHz
GeForce GTX 1080 Ti
min:
146 fps, max:
192 fps
fps
81%
GeForce GTX 1080 Max-Q:
140 [X] Acer Predator Triton 700 Intel Core i7-7700HQ 2.8GHz
GeForce GTX 1080 Max-Q
min:
113 fps
fps
74%
GeForce GTX 1070 (Desktop):
112 [X] GTX 1070 Founders Edition Asus X299 Prime Intel Core i7-7740X 4.3GHz
GeForce GTX 1070 (Desktop)
min:
88 fps, max:
134 fps
117.4 [X] MSI Aegis 3 8RD Intel Core i7-8700 3.2GHz
GeForce GTX 1070 (Desktop)
min:
113 fps, max:
123 fps
154 [X] Nvidia GeForce GTX 1070 Intel Core i7-6700K 4GHz
GeForce GTX 1070 (Desktop)
min:
140 fps
~ 128 fps
100%
GeForce GTX 1080 Ti:
143 [X] Nvidia GeForce GTX 1080 Ti Founders Edition Intel Core i7-7740X 4.3GHz
GeForce GTX 1080 Ti
min:
99 fps, max:
198 fps
177 [X] Asus Prime X299 Deluxe XMP OC Intel Core i9-9980XE @4.4GHz
GeForce GTX 1080 Ti
~ 160 fps
73%
GeForce GTX 1080 Max-Q:
117 [X] Acer Predator Triton 700 Intel Core i7-7700HQ 2.8GHz
GeForce GTX 1080 Max-Q
min:
85 fps
fps
91%
GeForce GTX 1070 (Desktop):
137 [X] Nvidia GeForce GTX 1070 Intel Core i7-6700K 4GHz
GeForce GTX 1070 (Desktop)
min:
99 fps
155 ~ 146 fps
100%
GeForce GTX 1080 Ti:
120 [X] Nvidia GeForce GTX 1080 Ti Founders Edition Intel Core i7-7740X 4.3GHz
GeForce GTX 1080 Ti
min:
113 fps, max:
253 fps
fps
78%
GeForce GTX 1080 Max-Q:
93 [X] Acer Predator Triton 700 Intel Core i7-7700HQ 2.8GHz
GeForce GTX 1080 Max-Q
min:
79 fps
fps
80%
GeForce GTX 1070 (Desktop):
93 99 [X] Nvidia GeForce GTX 1070 Intel Core i7-6700K 4GHz
GeForce GTX 1070 (Desktop)
min:
80 fps
~ 96 fps
100%
GeForce GTX 1080 Ti:
116 [X] Nvidia GeForce GTX 1080 Ti Founders Edition Intel Core i7-7740X 4.3GHz
GeForce GTX 1080 Ti
min:
107 fps, max:
226 fps
fps
76%
GeForce GTX 1080 Max-Q:
88 [X] Acer Predator Triton 700 Intel Core i7-7700HQ 2.8GHz
GeForce GTX 1080 Max-Q
min:
76 fps
fps
76%
GeForce GTX 1070 (Desktop):
86 90 [X] Nvidia GeForce GTX 1070 Intel Core i7-6700K 4GHz
GeForce GTX 1070 (Desktop)
min:
75 fps
~ 88 fps
100%
GeForce GTX 1080 Ti:
107 [X] Nvidia GeForce GTX 1080 Ti Founders Edition Intel Core i7-7740X 4.3GHz
GeForce GTX 1080 Ti
min:
92 fps, max:
210 fps
113 [X] Asus Prime X299 Deluxe XMP OC Intel Core i9-9980XE @4.4GHz
GeForce GTX 1080 Ti
~ 110 fps
71%
GeForce GTX 1080 Max-Q:
78 [X] Acer Predator Triton 700 Intel Core i7-7700HQ 2.8GHz
GeForce GTX 1080 Max-Q
min:
64 fps
fps
70%
GeForce GTX 1070 (Desktop):
75 79 [X] Nvidia GeForce GTX 1070 Intel Core i7-6700K 4GHz
GeForce GTX 1070 (Desktop)
min:
63 fps
~ 77 fps
100%
GeForce GTX 1080 Ti:
73 [X] Nvidia GeForce GTX 1080 Ti Founders Edition Intel Core i7-7740X 4.3GHz
GeForce GTX 1080 Ti
min:
65 fps, max:
132 fps
fps
62%
GeForce GTX 1080 Max-Q:
40.3 [X] Asus Zephyrus GX501 Intel Core i7-7700HQ 2.8GHz
GeForce GTX 1080 Max-Q
max:
85.8 fps
50 [X] Acer Predator Triton 700 Intel Core i7-7700HQ 2.8GHz
GeForce GTX 1080 Max-Q
min:
43 fps
~ 45 fps
71%
GeForce GTX 1070 (Desktop):
52 [X] Nvidia GeForce GTX 1070 Intel Core i7-6700K 4GHz
GeForce GTX 1070 (Desktop)
min:
43 fps
fps
100%
GeForce GTX 1080 Ti:
41 [X] Nvidia GeForce GTX 1080 Ti Founders Edition Intel Core i7-7740X 4.3GHz
GeForce GTX 1080 Ti
min:
36 fps, max:
66 fps
41 [X] Asus Prime X299 Deluxe XMP OC Intel Core i9-9980XE @4.4GHz
GeForce GTX 1080 Ti
~ 41 fps
66%
GeForce GTX 1080 Max-Q:
27 [X] Acer Predator Triton 700 Intel Core i7-7700HQ 2.8GHz
GeForce GTX 1080 Max-Q
min:
22 fps
fps
63%
GeForce GTX 1070 (Desktop):
25 27 [X] Nvidia GeForce GTX 1070 Intel Core i7-6700K 4GHz
GeForce GTX 1070 (Desktop)
min:
23 fps
~ 26 fps
100%
GeForce GTX 1080 Ti:
319 [X] Aorus Z370 Ultra Gaming Desktop DDR4-2666 1.47.22.14 D3D12
Intel Core i7-8086K 3.7GHz
GeForce GTX 1080 Ti
min:
177 fps, P1:
234 fps, max:
526 fps
fps
71%
GeForce GTX 1080 Max-Q:
226 [X] Asus Zephyrus GX501 1.47.22.14 D3D12
Intel Core i7-7700HQ 2.8GHz
GeForce GTX 1080 Max-Q
min:
121 fps, P1:
143 fps, max:
348 fps
fps
100%
GeForce GTX 1080 Ti:
247 [X] Aorus Z370 Ultra Gaming Desktop DDR4-2666 1.47.22.14 D3D12
Intel Core i7-8086K 3.7GHz
GeForce GTX 1080 Ti
min:
159 fps, P1:
198 fps, max:
341 fps
fps
69%
GeForce GTX 1080 Max-Q:
171 [X] Asus Zephyrus GX501 1.47.22.14 D3D12
Intel Core i7-7700HQ 2.8GHz
GeForce GTX 1080 Max-Q
min:
59.2 fps, P1:
102 fps, max:
290 fps
fps
100%
GeForce GTX 1080 Ti:
196 [X] Aorus Z370 Ultra Gaming Desktop DDR4-2666 1.47.22.14 D3D12
Intel Core i7-8086K 3.7GHz
GeForce GTX 1080 Ti
min:
133 fps, P1:
152 fps, max:
309 fps
fps
67%
GeForce GTX 1080 Max-Q:
132 [X] Asus Zephyrus GX501 1.47.22.14 D3D12
Intel Core i7-7700HQ 2.8GHz
GeForce GTX 1080 Max-Q
min:
41.1 fps, P1:
56.3 fps, max:
275 fps
fps
100%
GeForce GTX 1080 Ti:
167 [X] Aorus Z370 Ultra Gaming Desktop DDR4-2666 1.47.22.14 D3D12
Intel Core i7-8086K 3.7GHz
GeForce GTX 1080 Ti
min:
115 fps, P1:
132 fps, max:
301 fps
fps
67%
GeForce GTX 1080 Max-Q:
112 [X] Asus Zephyrus GX501 1.47.22.14 D3D12
Intel Core i7-7700HQ 2.8GHz
GeForce GTX 1080 Max-Q
min:
41 fps, P1:
56.7 fps, max:
216 fps
fps
100%
GeForce GTX 1080 Ti:
123 [X] Aorus Z370 Ultra Gaming Desktop DDR4-2666 1.47.22.14 D3D12
Intel Core i7-8086K 3.7GHz
GeForce GTX 1080 Ti
min:
99 fps, P1:
101 fps, max:
176 fps
fps
66%
GeForce GTX 1080 Max-Q:
81 [X] Asus Zephyrus GX501 1.47.22.14 D3D12
Intel Core i7-7700HQ 2.8GHz
GeForce GTX 1080 Max-Q
min:
49 fps, P1:
66.7 fps, max:
170 fps
fps
100%
GeForce GTX 1080 Ti:
71.5 [X] Aorus Z370 Ultra Gaming Desktop DDR4-2666 1.47.22.14 D3D12
Intel Core i7-8086K 3.7GHz
GeForce GTX 1080 Ti
min:
61.3 fps, P1:
62.5 fps, max:
95.2 fps
fps
65%
GeForce GTX 1080 Max-Q:
46.4 [X] Asus Zephyrus GX501 1.47.22.14 D3D12
Intel Core i7-7700HQ 2.8GHz
GeForce GTX 1080 Max-Q
min:
37.5 fps, P1:
39.4 fps, max:
63.1 fps
fps
100%
GeForce GTX 1080 Ti:
248 [X] Nvidia GeForce GTX 1080 Ti Founders Edition Intel Core i7-7740X 4.3GHz
GeForce GTX 1080 Ti
min:
200 fps, max:
274 fps
fps
82%
GeForce GTX 1080 Max-Q:
204 [X] Acer Predator Triton 700 Intel Core i7-7700HQ 2.8GHz
GeForce GTX 1080 Max-Q
min:
156 fps
fps
93%
GeForce GTX 1070 (Desktop):
212 [X] Nvidia GeForce GTX 1070 Intel Core i7-6700K 4GHz
GeForce GTX 1070 (Desktop)
min:
171 fps
249 [X] MSI Aegis 3 8RD Intel Core i7-8700 3.2GHz
GeForce GTX 1070 (Desktop)
min:
197 fps, max:
282 fps
~ 231 fps
100%
GeForce GTX 1080 Ti:
215 [X] Nvidia GeForce GTX 1080 Ti Founders Edition Intel Core i7-7740X 4.3GHz
GeForce GTX 1080 Ti
min:
180 fps, max:
232 fps
fps
80%
GeForce GTX 1080 Max-Q:
173 [X] Acer Predator Triton 700 Intel Core i7-7700HQ 2.8GHz
GeForce GTX 1080 Max-Q
min:
148 fps
fps
82%
GeForce GTX 1070 (Desktop):
175 [X] Nvidia GeForce GTX 1070 Intel Core i7-6700K 4GHz
GeForce GTX 1070 (Desktop)
min:
153 fps
177 [X] MSI Aegis 3 8RD Intel Core i7-8700 3.2GHz
GeForce GTX 1070 (Desktop)
min:
156 fps, max:
194 fps
~ 176 fps
100%
GeForce GTX 1080 Ti:
168 [X] Nvidia GeForce GTX 1080 Ti Founders Edition Intel Core i7-7740X 4.3GHz
GeForce GTX 1080 Ti
min:
144 fps, max:
185 fps
fps
82%
GeForce GTX 1080 Max-Q:
138 [X] Acer Predator Triton 700 Intel Core i7-7700HQ 2.8GHz
GeForce GTX 1080 Max-Q
min:
118 fps
fps
84%
GeForce GTX 1070 (Desktop):
139 [X] Nvidia GeForce GTX 1070 Intel Core i7-6700K 4GHz
GeForce GTX 1070 (Desktop)
min:
122 fps
142 [X] MSI Aegis 3 8RD Intel Core i7-8700 3.2GHz
GeForce GTX 1070 (Desktop)
min:
127 fps, max:
155 fps
~ 141 fps
100%
GeForce GTX 1080 Ti:
129 [X] Nvidia GeForce GTX 1080 Ti Founders Edition Intel Core i7-7740X 4.3GHz
GeForce GTX 1080 Ti
min:
113 fps, max:
138 fps
fps
74%
GeForce GTX 1080 Max-Q:
95 [X] Acer Predator Triton 700 Intel Core i7-7700HQ 2.8GHz
GeForce GTX 1080 Max-Q
min:
78 fps
fps
71%
GeForce GTX 1070 (Desktop):
84 [X] GTX 1070 Founders Edition Asus X299 Prime Intel Core i7-7740X 4.3GHz
GeForce GTX 1070 (Desktop)
min:
72 fps, max:
90 fps
95 [X] MSI Aegis 3 8RD Intel Core i7-8700 3.2GHz
GeForce GTX 1070 (Desktop)
min:
86 fps, max:
110 fps
97 [X] Nvidia GeForce GTX 1070 Intel Core i7-6700K 4GHz
GeForce GTX 1070 (Desktop)
min:
82 fps
~ 92 fps
100%
GeForce GTX 1080 Ti:
108 [X] Nvidia GeForce GTX 1080 Ti Founders Edition Intel Core i7-7740X 4.3GHz
GeForce GTX 1080 Ti
min:
95 fps, max:
117 fps
fps
69%
GeForce GTX 1080 Max-Q:
74 [X] Acer Predator Triton 700 Intel Core i7-7700HQ 2.8GHz
GeForce GTX 1080 Max-Q
min:
67 fps
fps
69%
GeForce GTX 1070 (Desktop):
75 [X] Nvidia GeForce GTX 1070 Intel Core i7-6700K 4GHz
GeForce GTX 1070 (Desktop)
min:
66 fps
fps
100%
GeForce GTX 1080 Ti:
69 [X] Nvidia GeForce GTX 1080 Ti Founders Edition Intel Core i7-7740X 4.3GHz
GeForce GTX 1080 Ti
min:
64 fps, max:
72 fps
fps
65%
GeForce GTX 1070 (Desktop):
41 [X] GTX 1070 Founders Edition Asus X299 Prime Intel Core i7-7740X 4.3GHz
GeForce GTX 1070 (Desktop)
min:
37 fps, max:
43 fps
47 [X] Nvidia GeForce GTX 1070 Intel Core i7-6700K 4GHz
GeForce GTX 1070 (Desktop)
min:
43 fps
47 [X] MSI Aegis 3 8RD Intel Core i7-8700 3.2GHz
GeForce GTX 1070 (Desktop)
min:
42 fps, max:
52 fps
~ 45 fps
100%
GeForce GTX 1080 Ti:
114 [X] Nvidia GeForce GTX 1080 Ti Founders Edition Intel Core i7-7740X 4.3GHz
GeForce GTX 1080 Ti
min:
104 fps, max:
122 fps
fps
86%
GeForce GTX 1080 Max-Q:
97.8 [X] Acer Predator Triton 700 Intel Core i7-7700HQ 2.8GHz
GeForce GTX 1080 Max-Q
min:
91 fps
fps
120%
GeForce GTX 1070 (Desktop):
108 [X] Nvidia GeForce GTX 1070 Intel Core i7-6700K 4GHz
GeForce GTX 1070 (Desktop)
min:
99 fps
166.8 [X] MSI Aegis 3 8RD Intel Core i7-8700 3.2GHz
GeForce GTX 1070 (Desktop)
min:
133 fps, max:
183 fps
~ 137 fps
100%
GeForce GTX 1080 Ti:
110 [X] Nvidia GeForce GTX 1080 Ti Founders Edition Intel Core i7-7740X 4.3GHz
GeForce GTX 1080 Ti
min:
101 fps, max:
119 fps
fps
83%
GeForce GTX 1080 Max-Q:
91.8 [X] Acer Predator Triton 700 Intel Core i7-7700HQ 2.8GHz
GeForce GTX 1080 Max-Q
min:
80 fps
fps
91%
GeForce GTX 1070 (Desktop):
98.6 [X] Nvidia GeForce GTX 1070 Intel Core i7-6700K 4GHz
GeForce GTX 1070 (Desktop)
min:
90 fps
102.3 [X] MSI Aegis 3 8RD Intel Core i7-8700 3.2GHz
GeForce GTX 1070 (Desktop)
min:
78 fps, max:
117 fps
~ 100 fps
100%
GeForce GTX 1080 Ti:
108 [X] Nvidia GeForce GTX 1080 Ti Founders Edition Intel Core i7-7740X 4.3GHz
GeForce GTX 1080 Ti
min:
98 fps, max:
117 fps
fps
81%
GeForce GTX 1080 Max-Q:
87.1 [X] Acer Predator Triton 700 Intel Core i7-7700HQ 2.8GHz
GeForce GTX 1080 Max-Q
min:
71 fps
fps
86%
GeForce GTX 1070 (Desktop):
92.9 [X] Nvidia GeForce GTX 1070 Intel Core i7-6700K 4GHz
GeForce GTX 1070 (Desktop)
min:
74 fps
93.5 [X] MSI Aegis 3 8RD Intel Core i7-8700 3.2GHz
GeForce GTX 1070 (Desktop)
min:
78 fps, max:
110 fps
~ 93 fps
100%
GeForce GTX 1080 Ti:
102 [X] Nvidia GeForce GTX 1080 Ti Founders Edition Intel Core i7-7740X 4.3GHz
GeForce GTX 1080 Ti
min:
83 fps, max:
115 fps
fps
73%
GeForce GTX 1080 Max-Q:
74.1 [X] Acer Predator Triton 700 Intel Core i7-7700HQ 2.8GHz
GeForce GTX 1080 Max-Q
min:
60 fps
fps
73%
GeForce GTX 1070 (Desktop):
72.2 [X] MSI Aegis 3 8RD Intel Core i7-8700 3.2GHz
GeForce GTX 1070 (Desktop)
min:
58 fps, max:
89 fps
75.9 [X] Nvidia GeForce GTX 1070 Intel Core i7-6700K 4GHz
GeForce GTX 1070 (Desktop)
min:
62 fps
~ 74 fps
100%
GeForce GTX 1080 Ti:
70 [X] Nvidia GeForce GTX 1080 Ti Founders Edition Intel Core i7-7740X 4.3GHz
GeForce GTX 1080 Ti
min:
61 fps, max:
79 fps
fps
64%
GeForce GTX 1080 Max-Q:
44.8 [X] Acer Predator Triton 700 Intel Core i7-7700HQ 2.8GHz
GeForce GTX 1080 Max-Q
min:
38 fps
fps
68%
GeForce GTX 1070 (Desktop):
47.8 [X] Nvidia GeForce GTX 1070 Intel Core i7-6700K 4GHz
GeForce GTX 1070 (Desktop)
min:
41 fps
fps
100%
GeForce GTX 1080 Ti:
32.3 [X] Nvidia GeForce GTX 1080 Ti Founders Edition Intel Core i7-7740X 4.3GHz
GeForce GTX 1080 Ti
min:
29 fps, max:
38 fps
fps
66%
GeForce GTX 1080 Max-Q:
21.3 [X] Acer Predator Triton 700 Intel Core i7-7700HQ 2.8GHz
GeForce GTX 1080 Max-Q
min:
18 fps
fps
71%
GeForce GTX 1070 (Desktop):
22.4 [X] MSI Aegis 3 8RD Intel Core i7-8700 3.2GHz
GeForce GTX 1070 (Desktop)
min:
19 fps, max:
27 fps
23.3 [X] Nvidia GeForce GTX 1070 Intel Core i7-6700K 4GHz
GeForce GTX 1070 (Desktop)
min:
20 fps
~ 23 fps
100%
GeForce GTX 1080 Ti:
60 [X] Nvidia GeForce GTX 1080 Ti Founders Edition Intel Core i7-7740X 4.3GHz
GeForce GTX 1080 Ti
fps
100%
GeForce GTX 1080 Max-Q:
60 [X] Asus Zephyrus GX501 Intel Core i7-7700HQ 2.8GHz
GeForce GTX 1080 Max-Q
fps
100%
GeForce GTX 1070 (Desktop):
60 [X] Nvidia GeForce GTX 1070 Intel Core i7-6700K 4GHz
GeForce GTX 1070 (Desktop)
min:
59 fps
60 ~ 60 fps
100%
GeForce GTX 1080 Ti:
60 [X] Nvidia GeForce GTX 1080 Ti Founders Edition Intel Core i7-7740X 4.3GHz
GeForce GTX 1080 Ti
min:
59 fps, max:
61 fps
fps
100%
GeForce GTX 1080 Max-Q:
60 [X] Asus Zephyrus GX501 Intel Core i7-7700HQ 2.8GHz
GeForce GTX 1080 Max-Q
min:
59 fps, max:
62 fps
fps
100%
GeForce GTX 1070 (Desktop):
60 [X] Nvidia GeForce GTX 1070 Intel Core i7-6700K 4GHz
GeForce GTX 1070 (Desktop)
min:
59 fps
60 ~ 60 fps
100%
GeForce GTX 1080 Ti:
60 [X] Nvidia GeForce GTX 1080 Ti Founders Edition Intel Core i7-7740X 4.3GHz
GeForce GTX 1080 Ti
min:
58 fps, max:
62 fps
fps
100%
GeForce GTX 1080 Max-Q:
60 [X] Asus Zephyrus GX501 Intel Core i7-7700HQ 2.8GHz
GeForce GTX 1080 Max-Q
min:
58 fps, max:
61 fps
fps
100%
GeForce GTX 1070 (Desktop):
60 [X] Nvidia GeForce GTX 1070 Intel Core i7-6700K 4GHz
GeForce GTX 1070 (Desktop)
min:
59 fps
fps
100%
GeForce GTX 1080 Ti:
46.3 [X] Nvidia GeForce GTX 1080 Ti Founders Edition Intel Core i7-7740X 4.3GHz
GeForce GTX 1080 Ti
min:
42 fps, max:
51 fps
fps
79%
GeForce GTX 1080 Max-Q:
36.4 [X] Asus Zephyrus GX501 Intel Core i7-7700HQ 2.8GHz
GeForce GTX 1080 Max-Q
min:
30 fps, max:
40 fps
fps
86%
GeForce GTX 1070 (Desktop):
39.2 [X] Nvidia GeForce GTX 1070 Intel Core i7-6700K 4GHz
GeForce GTX 1070 (Desktop)
min:
35 fps
41.3 ~ 40 fps
100%
GeForce GTX 1080 Ti:
115 [X] Nvidia GeForce GTX 1080 Ti FE Asus Prime B350-PLUS AMD Ryzen 7 1800X 3.6GHz
GeForce GTX 1080 Ti
min:
90 fps, max:
157 fps
129 [X] Asus X299 Prime Desktop DDR4-2666 Intel Core i9-9980XE 3GHz
GeForce GTX 1080 Ti
min:
100 fps, max:
178 fps
142 [X] Asus X299 Prime Desktop Intel Core i9-10980XE 3GHz
GeForce GTX 1080 Ti
min:
110 fps, max:
197 fps
155 [X] Nvidia GeForce GTX 1080 Ti Founders Edition Intel Core i7-7740X 4.3GHz
GeForce GTX 1080 Ti
min:
122 fps, max:
98 fps
~ 135 fps
76%
GeForce GTX 1080 Max-Q:
103 [X] Asus Zephyrus GX501 Intel Core i7-7700HQ 2.8GHz
GeForce GTX 1080 Max-Q
min:
82 fps, max:
135 fps
fps
102%
GeForce GTX 1070 (Desktop):
134 [X] Nvidia GeForce GTX 1070 Intel Core i7-6700K 4GHz
GeForce GTX 1070 (Desktop)
min:
101 fps
141 [X] MSI Aegis 3 8RD Intel Core i7-8700 3.2GHz
GeForce GTX 1070 (Desktop)
min:
110 fps, max:
179 fps
~ 138 fps
100%
GeForce GTX 1080 Ti:
105 [X] Nvidia GeForce GTX 1080 Ti FE Asus Prime B350-PLUS AMD Ryzen 7 1800X 3.6GHz
GeForce GTX 1080 Ti
min:
83 fps, max:
143 fps
135 [X] Nvidia GeForce GTX 1080 Ti Founders Edition Intel Core i7-7740X 4.3GHz
GeForce GTX 1080 Ti
min:
110 fps, max:
172 fps
~ 120 fps
76%
GeForce GTX 1080 Max-Q:
91 [X] Asus Zephyrus GX501 Intel Core i7-7700HQ 2.8GHz
GeForce GTX 1080 Max-Q
min:
76 fps, max:
111 fps
fps
88%
GeForce GTX 1070 (Desktop):
103 [X] MSI Aegis 3 8RD Intel Core i7-8700 3.2GHz
GeForce GTX 1070 (Desktop)
min:
83 fps, max:
115 fps
108 [X] Nvidia GeForce GTX 1070 Intel Core i7-6700K 4GHz
GeForce GTX 1070 (Desktop)
min:
85 fps
~ 106 fps
100%
GeForce GTX 1080 Ti:
103 [X] Nvidia GeForce GTX 1080 Ti FE Asus Prime B350-PLUS AMD Ryzen 7 1800X 3.6GHz
GeForce GTX 1080 Ti
min:
80 fps, max:
148 fps
131 [X] Nvidia GeForce GTX 1080 Ti Founders Edition Intel Core i7-7740X 4.3GHz
GeForce GTX 1080 Ti
min:
108 fps, max:
161 fps
~ 117 fps
76%
GeForce GTX 1080 Max-Q:
89 [X] Asus Zephyrus GX501 Intel Core i7-7700HQ 2.8GHz
GeForce GTX 1080 Max-Q
min:
73 fps, max:
108 fps
fps
85%
GeForce GTX 1070 (Desktop):
96 [X] MSI Aegis 3 8RD Intel Core i7-8700 3.2GHz
GeForce GTX 1070 (Desktop)
min:
82 fps, max:
113 fps
103 [X] Nvidia GeForce GTX 1070 Intel Core i7-6700K 4GHz
GeForce GTX 1070 (Desktop)
min:
83 fps
~ 100 fps
100%
GeForce GTX 1080 Ti:
98 [X] Nvidia GeForce GTX 1080 Ti FE Asus Prime B350-PLUS AMD Ryzen 7 1800X 3.6GHz
GeForce GTX 1080 Ti
min:
70 fps, max:
132 fps
106 [X] Asus X299 Prime Desktop DDR4-2666 Intel Core i9-9980XE 3GHz
GeForce GTX 1080 Ti
min:
80 fps, max:
146 fps
112 [X] Asus X299 Prime Desktop Intel Core i9-10980XE 3GHz
GeForce GTX 1080 Ti
min:
86 fps, max:
156 fps
124 [X] Nvidia GeForce GTX 1080 Ti Founders Edition Intel Core i7-7740X 4.3GHz
GeForce GTX 1080 Ti
min:
96 fps, max:
153 fps
~ 110 fps
77%
GeForce GTX 1080 Max-Q:
85 [X] Asus Zephyrus GX501 Intel Core i7-7700HQ 2.8GHz
GeForce GTX 1080 Max-Q
min:
67 fps, max:
104 fps
fps
83%
GeForce GTX 1070 (Desktop):
87 [X] GTX 1070 Founders Edition Asus X299 Prime Intel Core i7-7740X 4.3GHz
GeForce GTX 1070 (Desktop)
min:
73 fps, max:
101 fps
90 [X] MSI Aegis 3 8RD Intel Core i7-8700 3.2GHz
GeForce GTX 1070 (Desktop)
min:
78 fps, max:
103 fps
96 [X] Nvidia GeForce GTX 1070 Intel Core i7-6700K 4GHz
GeForce GTX 1070 (Desktop)
min:
82 fps
~ 91 fps
100%
GeForce GTX 1080 Ti:
97 [X] Nvidia GeForce GTX 1080 Ti Founders Edition Intel Core i7-7740X 4.3GHz
GeForce GTX 1080 Ti
min:
85 fps, max:
116 fps
fps
68%
GeForce GTX 1080 Max-Q:
66 [X] Asus Zephyrus GX501 Intel Core i7-7700HQ 2.8GHz
GeForce GTX 1080 Max-Q
min:
58 fps, max:
77 fps
fps
70%
GeForce GTX 1070 (Desktop):
68 [X] Nvidia GeForce GTX 1070 Intel Core i7-6700K 4GHz
GeForce GTX 1070 (Desktop)
min:
58 fps
fps
100%
GeForce GTX 1080 Ti:
51 [X] Nvidia GeForce GTX 1080 Ti FE Asus Prime B350-PLUS AMD Ryzen 7 1800X 3.6GHz
GeForce GTX 1080 Ti
min:
44 fps, max:
61 fps
53 [X] Nvidia GeForce GTX 1080 Ti Founders Edition Intel Core i7-7740X 4.3GHz
GeForce GTX 1080 Ti
min:
45 fps, max:
67 fps
56 [X] Asus X299 Prime Desktop DDR4-2666 Intel Core i9-9980XE 3GHz
GeForce GTX 1080 Ti
min:
49 fps, max:
65 fps
56 [X] Asus X299 Prime Desktop Intel Core i9-10980XE 3GHz
GeForce GTX 1080 Ti
min:
50 fps, max:
67 fps
~ 54 fps
63%
GeForce GTX 1080 Max-Q:
34 [X] Asus Zephyrus GX501 Intel Core i7-7700HQ 2.8GHz
GeForce GTX 1080 Max-Q
min:
28 fps, max:
42 fps
fps
63%
GeForce GTX 1070 (Desktop):
33 [X] GTX 1070 Founders Edition Asus X299 Prime Intel Core i7-7740X 4.3GHz
GeForce GTX 1070 (Desktop)
min:
28 fps, max:
39 fps
35 [X] Nvidia GeForce GTX 1070 Intel Core i7-6700K 4GHz
GeForce GTX 1070 (Desktop)
min:
30 fps
35 [X] MSI Aegis 3 8RD Intel Core i7-8700 3.2GHz
GeForce GTX 1070 (Desktop)
min:
30 fps, max:
43 fps
~ 34 fps
100%
GeForce GTX 1080 Ti:
77 [X] Asus Prime X299 Deluxe XMP OC Intel Core i9-9980XE @4.4GHz
GeForce GTX 1080 Ti
max:
105 fps
fps
100%
GeForce GTX 1080 Ti:
68.4 [X] AMD Ryzen 3 1200 3.1GHz
GeForce GTX 1080 Ti
81 [X] Asus Crosshair VI Hero AMD Ryzen 5 1600 3.2GHz
GeForce GTX 1080 Ti
98 [X] Nvidia GeForce GTX 1080 Ti FE Asus Prime B350-PLUS AMD Ryzen 7 1800X 3.6GHz
GeForce GTX 1080 Ti
101 [X] Intel Core i7-4790K 4GHz
GeForce GTX 1080 Ti
110 [X] Asus X299 Prime Desktop DDR4-3200 Intel Core i9-9980XE 3GHz
GeForce GTX 1080 Ti
111 [X] Asus X299 Prime Desktop DDR4-2666 Intel Core i9-9980XE 3GHz
GeForce GTX 1080 Ti
117 [X] Nvidia GeForce GTX 1080 Ti Founders Edition Intel Core i7-7740X 4.3GHz
GeForce GTX 1080 Ti
119 [X] Asus X299 Prime Desktop Intel Core i9-10980XE 3GHz
GeForce GTX 1080 Ti
120 [X] Asus X299 Prime Desktop DDR4-3200 Intel Core i9-10980XE 3GHz
GeForce GTX 1080 Ti
125 [X] Aorus Z370 Ultra Gaming Desktop DDR4-2666 Intel Core i7-8086K 3.7GHz
GeForce GTX 1080 Ti
~ 105 fps
82%
GeForce GTX 1080 Max-Q:
82.3 89.5 [X] Asus Zephyrus GX501 Intel Core i7-7700HQ 2.8GHz
GeForce GTX 1080 Max-Q
~ 86 fps
93%
GeForce GTX 1070 (Desktop):
98 [X] Intel Core i7-4790K 4GHz
GeForce GTX 1070 (Desktop)
fps
100%
GeForce GTX 1080 Ti:
61.6 [X] AMD Ryzen 3 1200 3.1GHz
GeForce GTX 1080 Ti
72.8 [X] Asus Crosshair VI Hero AMD Ryzen 5 1600 3.2GHz
GeForce GTX 1080 Ti
88 [X] Nvidia GeForce GTX 1080 Ti FE Asus Prime B350-PLUS AMD Ryzen 7 1800X 3.6GHz
GeForce GTX 1080 Ti
90 [X] Intel Core i7-4790K 4GHz
GeForce GTX 1080 Ti
103 [X] Asus X299 Prime Desktop DDR4-3200 Intel Core i9-9980XE 3GHz
GeForce GTX 1080 Ti
103 [X] Asus X299 Prime Desktop DDR4-2666 Intel Core i9-9980XE 3GHz
GeForce GTX 1080 Ti
104 [X] Nvidia GeForce GTX 1080 Ti Founders Edition Intel Core i7-7740X 4.3GHz
GeForce GTX 1080 Ti
108 [X] Asus X299 Prime Desktop Intel Core i9-10980XE 3GHz
GeForce GTX 1080 Ti
110 [X] Asus X299 Prime Desktop DDR4-3200 Intel Core i9-10980XE 3GHz
GeForce GTX 1080 Ti
113 [X] Aorus Z370 Ultra Gaming Desktop DDR4-2666 Intel Core i7-8086K 3.7GHz
GeForce GTX 1080 Ti
~ 95 fps
84%
GeForce GTX 1080 Max-Q:
79.2 80 [X] Asus Zephyrus GX501 Intel Core i7-7700HQ 2.8GHz
GeForce GTX 1080 Max-Q
~ 80 fps
95%
GeForce GTX 1070 (Desktop):
90 [X] Intel Core i7-4790K 4GHz
GeForce GTX 1070 (Desktop)
fps
100%
GeForce GTX 1080 Ti:
52.2 [X] AMD Ryzen 3 1200 3.1GHz
GeForce GTX 1080 Ti
60.1 [X] Asus Crosshair VI Hero AMD Ryzen 5 1600 3.2GHz
GeForce GTX 1080 Ti
71 [X] Nvidia GeForce GTX 1080 Ti FE Asus Prime B350-PLUS AMD Ryzen 7 1800X 3.6GHz
GeForce GTX 1080 Ti
74.5 [X] Intel Core i7-4790K 4GHz
GeForce GTX 1080 Ti
85 [X] Asus X299 Prime Desktop DDR4-3200 Intel Core i9-9980XE 3GHz
GeForce GTX 1080 Ti
86 [X] Asus X299 Prime Desktop DDR4-2666 Intel Core i9-9980XE 3GHz
GeForce GTX 1080 Ti
86.8 [X] Nvidia GeForce GTX 1080 Ti Founders Edition Intel Core i7-7740X 4.3GHz
GeForce GTX 1080 Ti
89 [X] Asus X299 Prime Desktop Intel Core i9-10980XE 3GHz
GeForce GTX 1080 Ti
90 [X] Asus X299 Prime Desktop DDR4-3200 Intel Core i9-10980XE 3GHz
GeForce GTX 1080 Ti
93 [X] Aorus Z370 Ultra Gaming Desktop DDR4-2666 Intel Core i7-8086K 3.7GHz
GeForce GTX 1080 Ti
~ 79 fps
86%
GeForce GTX 1080 Max-Q:
66.9 [X] Asus Zephyrus GX501 Intel Core i7-7700HQ 2.8GHz
GeForce GTX 1080 Max-Q
68.8 ~ 68 fps
94%
GeForce GTX 1070 (Desktop):
74.6 [X] Intel Core i7-4790K 4GHz
GeForce GTX 1070 (Desktop)
fps
100%
GeForce GTX 1080 Ti:
45.7 [X] AMD Ryzen 3 1200 3.1GHz
GeForce GTX 1080 Ti
52.5 [X] Asus Crosshair VI Hero AMD Ryzen 5 1600 3.2GHz
GeForce GTX 1080 Ti
61.7 [X] Nvidia GeForce GTX 1080 Ti FE Asus Prime B350-PLUS AMD Ryzen 7 1800X 3.6GHz
GeForce GTX 1080 Ti
67.6 [X] Intel Core i7-4790K 4GHz
GeForce GTX 1080 Ti
72 [X] Asus X299 Prime Desktop DDR4-3200 Intel Core i9-9980XE 3GHz
GeForce GTX 1080 Ti
72 [X] Asus X299 Prime Desktop DDR4-2666 Intel Core i9-9980XE 3GHz
GeForce GTX 1080 Ti
75 [X] Asus X299 Prime Desktop Intel Core i9-10980XE 3GHz
GeForce GTX 1080 Ti
75.6 [X] Nvidia GeForce GTX 1080 Ti Founders Edition Intel Core i7-7740X 4.3GHz
GeForce GTX 1080 Ti
77 [X] Asus X299 Prime Desktop DDR4-3200 Intel Core i9-10980XE 3GHz
GeForce GTX 1080 Ti
81 [X] Aorus Z370 Ultra Gaming Desktop DDR4-2666 Intel Core i7-8086K 3.7GHz
GeForce GTX 1080 Ti
~ 68 fps
88%
GeForce GTX 1080 Max-Q:
58.7 [X] Asus Zephyrus GX501 Intel Core i7-7700HQ 2.8GHz
GeForce GTX 1080 Max-Q
60.4 ~ 60 fps
98%
GeForce GTX 1070 (Desktop):
66.4 [X] Intel Core i7-4790K 4GHz
GeForce GTX 1070 (Desktop)
fps
100%
GeForce GTX 1080 Ti:
155 [X] Intel Core i7-4790K 4GHz
GeForce GTX 1080 Ti
min:
131 fps, max:
182 fps
fps
78%
GeForce GTX 1080 Max-Q:
121 [X] Asus Zephyrus GX501 Intel Core i7-7700HQ 2.8GHz
GeForce GTX 1080 Max-Q
min:
103 fps, max:
145 fps
fps
92%
GeForce GTX 1070 (Desktop):
138.8 [X] MSI Aegis 3 8RD Intel Core i7-8700 3.2GHz
GeForce GTX 1070 (Desktop)
min:
61 fps, max:
170 fps
145 [X] Nvidia GeForce GTX 1070 Intel Core i7-6700K 4GHz
GeForce GTX 1070 (Desktop)
min:
116 fps
~ 142 fps
100%
GeForce GTX 1080 Ti:
122 [X] Intel Core i7-4790K 4GHz
GeForce GTX 1080 Ti
min:
102 fps, max:
146 fps
fps
78%
GeForce GTX 1080 Max-Q:
95 [X] Asus Zephyrus GX501 Intel Core i7-7700HQ 2.8GHz
GeForce GTX 1080 Max-Q
min:
74 fps, max:
115 fps
fps
89%
GeForce GTX 1070 (Desktop):
103.2 [X] MSI Aegis 3 8RD Intel Core i7-8700 3.2GHz
GeForce GTX 1070 (Desktop)
min:
61 fps, max:
121 fps
114 [X] Nvidia GeForce GTX 1070 Intel Core i7-6700K 4GHz
GeForce GTX 1070 (Desktop)
min:
91 fps
~ 109 fps
100%
GeForce GTX 1080 Ti:
96 [X] Intel Core i7-4790K 4GHz
GeForce GTX 1080 Ti
min:
65 fps, max:
123 fps
fps
80%
GeForce GTX 1080 Max-Q:
77 [X] Asus Zephyrus GX501 Intel Core i7-7700HQ 2.8GHz
GeForce GTX 1080 Max-Q
min:
56 fps, max:
103 fps
fps
92%
GeForce GTX 1070 (Desktop):
82.8 [X] MSI Aegis 3 8RD Intel Core i7-8700 3.2GHz
GeForce GTX 1070 (Desktop)
min:
61 fps, max:
99 fps
92.7 [X] Nvidia GeForce GTX 1070 Intel Core i7-6700K 4GHz
GeForce GTX 1070 (Desktop)
min:
74 fps
~ 88 fps
100%
GeForce GTX 1080 Ti:
73 [X] Intel Core i7-4790K 4GHz
GeForce GTX 1080 Ti
min:
53 fps, max:
92 fps
fps
85%
GeForce GTX 1080 Max-Q:
62 [X] Asus Zephyrus GX501 Intel Core i7-7700HQ 2.8GHz
GeForce GTX 1080 Max-Q
min:
49 fps, max:
73 fps
fps
90%
GeForce GTX 1070 (Desktop):
63.2 [X] MSI Aegis 3 8RD Intel Core i7-8700 3.2GHz
GeForce GTX 1070 (Desktop)
min:
47 fps, max:
76 fps
68.9 [X] Nvidia GeForce GTX 1070 Intel Core i7-6700K 4GHz
GeForce GTX 1070 (Desktop)
min:
57 fps
~ 66 fps
100%
GeForce GTX 1080 Ti:
55.3 [X] Intel Core i7-4790K 4GHz
GeForce GTX 1080 Ti
min:
42 fps, max:
68 fps
fps
76%
GeForce GTX 1080 Max-Q:
42 [X] Asus Zephyrus GX501 Intel Core i7-7700HQ 2.8GHz
GeForce GTX 1080 Max-Q
min:
35 fps, max:
49 fps
fps
85%
GeForce GTX 1070 (Desktop):
47.1 [X] Nvidia GeForce GTX 1070 Intel Core i7-6700K 4GHz
GeForce GTX 1070 (Desktop)
min:
37 fps
fps
100%
GeForce GTX 1080 Ti:
31 [X] Intel Core i7-4790K 4GHz
GeForce GTX 1080 Ti
min:
24 fps, max:
36 fps
fps
65%
GeForce GTX 1080 Max-Q:
20.2 [X] Asus Zephyrus GX501 Intel Core i7-7700HQ 2.8GHz
GeForce GTX 1080 Max-Q
min:
16 fps, max:
24 fps
fps
74%
GeForce GTX 1070 (Desktop):
22 [X] MSI Aegis 3 8RD Intel Core i7-8700 3.2GHz
GeForce GTX 1070 (Desktop)
min:
18 fps, max:
25 fps
23.1 [X] Nvidia GeForce GTX 1070 Intel Core i7-6700K 4GHz
GeForce GTX 1070 (Desktop)
min:
18 fps
~ 23 fps
100%
GeForce GTX 1080 Ti:
160 [X] Aorus Z370 Ultra Gaming Desktop DDR4-2666 1.3
Intel Core i7-8086K 3.7GHz
GeForce GTX 1080 Ti
173 [X] Intel Core i7-4790K 4GHz
GeForce GTX 1080 Ti
min:
112 fps, max:
218 fps
~ 167 fps
72%
GeForce GTX 1080 Max-Q:
110 [X] Asus Zephyrus GX501 1.3
Intel Core i7-7700HQ 2.8GHz
GeForce GTX 1080 Max-Q
130 ~ 120 fps
88%
GeForce GTX 1070 (Desktop):
145.4 [X] MSI Aegis 3 8RD Intel Core i7-8700 3.2GHz
GeForce GTX 1070 (Desktop)
min:
95 fps, max:
203 fps
149 [X] Nvidia GeForce GTX 1070 Intel Core i7-6700K 4GHz
GeForce GTX 1070 (Desktop)
min:
106 fps
~ 147 fps
100%
GeForce GTX 1080 Ti:
129 [X] Intel Core i7-4790K 4GHz
GeForce GTX 1080 Ti
min:
89 fps, max:
169 fps
131 [X] Aorus Z370 Ultra Gaming Desktop DDR4-2666 1.3
Intel Core i7-8086K 3.7GHz
GeForce GTX 1080 Ti
~ 130 fps
68%
GeForce GTX 1080 Max-Q:
86 89.6 [X] Asus Zephyrus GX501 1.3
Intel Core i7-7700HQ 2.8GHz
GeForce GTX 1080 Max-Q
~ 88 fps
67%
GeForce GTX 1070 (Desktop):
85 [X] MSI Aegis 3 8RD Intel Core i7-8700 3.2GHz
GeForce GTX 1070 (Desktop)
min:
59 fps, max:
108 fps
89.9 [X] Nvidia GeForce GTX 1070 Intel Core i7-6700K 4GHz
GeForce GTX 1070 (Desktop)
min:
68 fps
~ 87 fps
100%
GeForce GTX 1080 Ti:
92 [X] Intel Core i7-4790K 4GHz
GeForce GTX 1080 Ti
max:
131 fps
101 [X] Aorus Z370 Ultra Gaming Desktop DDR4-2666 1.3
Intel Core i7-8086K 3.7GHz
GeForce GTX 1080 Ti
~ 97 fps
69%
GeForce GTX 1080 Max-Q:
64 70.8 [X] Asus Zephyrus GX501 1.3
Intel Core i7-7700HQ 2.8GHz
GeForce GTX 1080 Max-Q
~ 67 fps
63%
GeForce GTX 1070 (Desktop):
59.6 [X] MSI Aegis 3 8RD Intel Core i7-8700 3.2GHz
GeForce GTX 1070 (Desktop)
min:
35 fps, max:
90 fps
63 [X] Nvidia GeForce GTX 1070 Intel Core i7-6700K 4GHz
GeForce GTX 1070 (Desktop)
min:
19 fps
~ 61 fps
100%
GeForce GTX 1080 Ti:
76.3 [X] Aorus Z370 Ultra Gaming Desktop DDR4-2666 1.3
Intel Core i7-8086K 3.7GHz
GeForce GTX 1080 Ti
fps
71%
GeForce GTX 1080 Max-Q:
54 [X] Asus Zephyrus GX501 1.3
Intel Core i7-7700HQ 2.8GHz
GeForce GTX 1080 Max-Q
fps
100%
GeForce GTX 1080 Ti:
41 [X] Nvidia GeForce GTX 1080 Ti FE Asus Prime B350-PLUS AMD Ryzen 7 1800X 3.6GHz
GeForce GTX 1080 Ti
max:
59 fps
42.3 [X] Intel Core i7-4790K 4GHz
GeForce GTX 1080 Ti
min:
31 fps, max:
64 fps
43.5 [X] Nvidia GeForce GTX 1080 Ti Founders Edition Intel Core i7-7740X 4.3GHz
GeForce GTX 1080 Ti
min:
28 fps, max:
64 fps
45.8 [X] Aorus Z370 Ultra Gaming Desktop DDR4-2666 1.3
Intel Core i7-8086K 3.7GHz
GeForce GTX 1080 Ti
~ 43 fps
67%
GeForce GTX 1080 Max-Q:
27.2 29.9 [X] Asus Zephyrus GX501 1.3
Intel Core i7-7700HQ 2.8GHz
GeForce GTX 1080 Max-Q
~ 29 fps
65%
GeForce GTX 1070 (Desktop):
27 [X] MSI Aegis 3 8RD Intel Core i7-8700 3.2GHz
GeForce GTX 1070 (Desktop)
min:
18 fps, max:
41 fps
28.1 [X] Nvidia GeForce GTX 1070 Intel Core i7-6700K 4GHz
GeForce GTX 1070 (Desktop)
~ 28 fps
GeForce GTX 1080 Max-Q:
258 [X] Asus Zephyrus GX501 Intel Core i7-7700HQ 2.8GHz
GeForce GTX 1080 Max-Q
min:
189 fps, max:
335 fps
fps
GeForce GTX 1070 (Desktop):
247 [X] MSI Aegis 3 8RD Intel Core i7-8700 3.2GHz
GeForce GTX 1070 (Desktop)
min:
176 fps, max:
301 fps
317 [X] Nvidia GeForce GTX 1070 Intel Core i7-6700K 4GHz
GeForce GTX 1070 (Desktop)
min:
281 fps
~ 282 fps
GeForce GTX 1080 Max-Q:
188 [X] Asus Zephyrus GX501 Intel Core i7-7700HQ 2.8GHz
GeForce GTX 1080 Max-Q
min:
157 fps, max:
257 fps
fps
GeForce GTX 1070 (Desktop):
226.5 [X] MSI Aegis 3 8RD Intel Core i7-8700 3.2GHz
GeForce GTX 1070 (Desktop)
min:
160 fps, max:
288 fps
286 [X] Nvidia GeForce GTX 1070 Intel Core i7-6700K 4GHz
GeForce GTX 1070 (Desktop)
min:
202 fps
~ 256 fps
100%
GeForce GTX 1080 Ti:
203 [X] Intel Core i7-4790K 4GHz
GeForce GTX 1080 Ti
min:
181 fps, max:
226 fps
fps
63%
GeForce GTX 1080 Max-Q:
127 [X] Asus Zephyrus GX501 Intel Core i7-7700HQ 2.8GHz
GeForce GTX 1080 Max-Q
min:
110 fps, max:
155 fps
fps
86%
GeForce GTX 1070 (Desktop):
169.2 [X] MSI Aegis 3 8RD Intel Core i7-8700 3.2GHz
GeForce GTX 1070 (Desktop)
min:
118 fps, max:
194 fps
181 [X] Nvidia GeForce GTX 1070 Intel Core i7-6700K 4GHz
GeForce GTX 1070 (Desktop)
min:
170 fps
~ 175 fps
100%
GeForce GTX 1080 Ti:
163 [X] Intel Core i7-4790K 4GHz
GeForce GTX 1080 Ti
min:
148 fps, max:
180 fps
fps
67%
GeForce GTX 1080 Max-Q:
109 [X] Asus Zephyrus GX501 Intel Core i7-7700HQ 2.8GHz
GeForce GTX 1080 Max-Q
min:
98 fps, max:
126 fps
fps
78%
GeForce GTX 1070 (Desktop):
124.9 [X] MSI Aegis 3 8RD Intel Core i7-8700 3.2GHz
GeForce GTX 1070 (Desktop)
min:
113 fps, max:
134 fps
129 [X] Nvidia GeForce GTX 1070 Intel Core i7-6700K 4GHz
GeForce GTX 1070 (Desktop)
min:
122 fps
~ 127 fps
100%
GeForce GTX 1080 Ti:
107 [X] Intel Core i7-4790K 4GHz
GeForce GTX 1080 Ti
min:
99 fps, max:
117 fps
fps
60%
GeForce GTX 1080 Max-Q:
64 [X] Asus Zephyrus GX501 Intel Core i7-7700HQ 2.8GHz
GeForce GTX 1080 Max-Q
min:
59 fps, max:
71 fps
fps
74%
GeForce GTX 1070 (Desktop):
78.8 [X] Nvidia GeForce GTX 1070 Intel Core i7-6700K 4GHz
GeForce GTX 1070 (Desktop)
min:
74 fps
fps
100%
GeForce GTX 1080 Ti:
51.4 [X] Intel Core i7-4790K 4GHz
GeForce GTX 1080 Ti
min:
49 fps, max:
54 fps
fps
65%
GeForce GTX 1080 Max-Q:
33.5 [X] Asus Zephyrus GX501 Intel Core i7-7700HQ 2.8GHz
GeForce GTX 1080 Max-Q
min:
31 fps, max:
36 fps
fps
76%
GeForce GTX 1070 (Desktop):
38.4 [X] MSI Aegis 3 8RD Intel Core i7-8700 3.2GHz
GeForce GTX 1070 (Desktop)
min:
35 fps, max:
41 fps
39.3 [X] Nvidia GeForce GTX 1070 Intel Core i7-6700K 4GHz
GeForce GTX 1070 (Desktop)
min:
37 fps
~ 39 fps
100%
GeForce GTX 1080 Ti:
179 [X] Intel Core i7-4790K 4GHz
GeForce GTX 1080 Ti
min:
148 fps, max:
212 fps
fps
115%
GeForce GTX 1080 Max-Q:
206 [X] Asus Zephyrus GX501 Intel Core i7-7700HQ 2.8GHz
GeForce GTX 1080 Max-Q
min:
170 fps, max:
237 fps
fps
112%
GeForce GTX 1070 (Desktop):
200 [X] Nvidia GeForce GTX 1070 Intel Core i7-6700K 4GHz
GeForce GTX 1070 (Desktop)
min:
163 fps
fps
100%
GeForce GTX 1080 Ti:
167 [X] Intel Core i7-4790K 4GHz
GeForce GTX 1080 Ti
min:
130 fps, max:
196 fps
fps
86%
GeForce GTX 1080 Max-Q:
144 [X] Asus Zephyrus GX501 Intel Core i7-7700HQ 2.8GHz
GeForce GTX 1080 Max-Q
min:
128 fps, max:
159 fps
fps
87%
GeForce GTX 1070 (Desktop):
146 [X] Nvidia GeForce GTX 1070 Intel Core i7-6700K 4GHz
GeForce GTX 1070 (Desktop)
min:
128 fps
fps
100%
GeForce GTX 1080 Ti:
142 [X] Intel Core i7-4790K 4GHz
GeForce GTX 1080 Ti
min:
112 fps, max:
164 fps
fps
90%
GeForce GTX 1080 Max-Q:
128 [X] Asus Zephyrus GX501 Intel Core i7-7700HQ 2.8GHz
GeForce GTX 1080 Max-Q
min:
113 fps, max:
142 fps
fps
92%
GeForce GTX 1070 (Desktop):
130 [X] Nvidia GeForce GTX 1070 Intel Core i7-6700K 4GHz
GeForce GTX 1070 (Desktop)
min:
114 fps
fps
100%
GeForce GTX 1080 Ti:
155 [X] Intel Core i7-4790K 4GHz
GeForce GTX 1080 Ti
min:
121 fps, max:
177 fps
fps
69%
GeForce GTX 1080 Max-Q:
107 [X] Asus Zephyrus GX501 Intel Core i7-7700HQ 2.8GHz
GeForce GTX 1080 Max-Q
min:
92 fps, max:
119 fps
fps
74%
GeForce GTX 1070 (Desktop):
114 [X] Nvidia GeForce GTX 1070 Intel Core i7-6700K 4GHz
GeForce GTX 1070 (Desktop)
min:
97 fps
fps
100%
GeForce GTX 1080 Ti:
110 [X] Intel Core i7-4790K 4GHz
GeForce GTX 1080 Ti
min:
100 fps, max:
122 fps
fps
65%
GeForce GTX 1080 Max-Q:
71 [X] Asus Zephyrus GX501 Intel Core i7-7700HQ 2.8GHz
GeForce GTX 1080 Max-Q
min:
63 fps, max:
79 fps
fps
69%
GeForce GTX 1070 (Desktop):
76.2 [X] Nvidia GeForce GTX 1070 Intel Core i7-6700K 4GHz
GeForce GTX 1070 (Desktop)
min:
69 fps
fps
100%
GeForce GTX 1080 Ti:
56.4 [X] Intel Core i7-4790K 4GHz
GeForce GTX 1080 Ti
min:
52 fps, max:
62 fps
fps
63%
GeForce GTX 1080 Max-Q:
35.5 [X] Asus Zephyrus GX501 Intel Core i7-7700HQ 2.8GHz
GeForce GTX 1080 Max-Q
min:
31 fps, max:
41 fps
fps
68%
GeForce GTX 1070 (Desktop):
38.1 [X] Nvidia GeForce GTX 1070 Intel Core i7-6700K 4GHz
GeForce GTX 1070 (Desktop)
min:
35 fps
fps
GeForce GTX 1070 (Desktop):
161 [X] Nvidia GeForce GTX 1070 Intel Core i7-6700K 4GHz
GeForce GTX 1070 (Desktop)
min:
125 fps
fps
GeForce GTX 1070 (Desktop):
141 [X] Nvidia GeForce GTX 1070 Intel Core i7-6700K 4GHz
GeForce GTX 1070 (Desktop)
min:
98 fps
fps
GeForce GTX 1070 (Desktop):
129 [X] Nvidia GeForce GTX 1070 Intel Core i7-6700K 4GHz
GeForce GTX 1070 (Desktop)
min:
84 fps
fps
100%
GeForce GTX 1080 Ti:
134 [X] Intel Core i7-4790K 4GHz
GeForce GTX 1080 Ti
min:
93 fps, max:
171 fps
fps
83%
GeForce GTX 1080 Max-Q:
111 [X] Asus Zephyrus GX501 Intel Core i7-7700HQ 2.8GHz
GeForce GTX 1080 Max-Q
min:
74 fps, max:
143 fps
fps
90%
GeForce GTX 1070 (Desktop):
120 [X] Nvidia GeForce GTX 1070 Intel Core i7-6700K 4GHz
GeForce GTX 1070 (Desktop)
min:
80 fps
fps
100%
GeForce GTX 1080 Ti:
117 [X] Intel Core i7-4790K 4GHz
GeForce GTX 1080 Ti
min:
78 fps, max:
137 fps
fps
73%
GeForce GTX 1070 (Desktop):
85.1 [X] Nvidia GeForce GTX 1070 Intel Core i7-6700K 4GHz
GeForce GTX 1070 (Desktop)
min:
57 fps
fps
100%
GeForce GTX 1080 Ti:
65 [X] Intel Core i7-4790K 4GHz
GeForce GTX 1080 Ti
min:
44 fps, max:
76 fps
fps
65%
GeForce GTX 1080 Max-Q:
42.1 [X] Asus Zephyrus GX501 Intel Core i7-7700HQ 2.8GHz
GeForce GTX 1080 Max-Q
min:
27 fps, max:
51 fps
fps
68%
GeForce GTX 1070 (Desktop):
44.3 [X] Nvidia GeForce GTX 1070 Intel Core i7-6700K 4GHz
GeForce GTX 1070 (Desktop)
min:
29 fps
fps
GeForce GTX 1080 Max-Q:
190 [X] Asus Zephyrus GX501 Intel Core i7-7700HQ 2.8GHz
GeForce GTX 1080 Max-Q
min:
121 fps, max:
280 fps
fps
GeForce GTX 1070 (Desktop):
256.8 [X] MSI Aegis 3 8RD Intel Core i7-8700 3.2GHz
GeForce GTX 1070 (Desktop)
min:
162 fps, max:
378 fps
259 [X] Nvidia GeForce GTX 1070 Intel Core i7-6700K 4GHz
GeForce GTX 1070 (Desktop)
min:
166 fps
~ 258 fps
GeForce GTX 1080 Max-Q:
199 [X] Asus Zephyrus GX501 Intel Core i7-7700HQ 2.8GHz
GeForce GTX 1080 Max-Q
min:
121 fps, max:
262 fps
fps
GeForce GTX 1070 (Desktop):
242 [X] Nvidia GeForce GTX 1070 Intel Core i7-6700K 4GHz
GeForce GTX 1070 (Desktop)
min:
159 fps
249 [X] MSI Aegis 3 8RD Intel Core i7-8700 3.2GHz
GeForce GTX 1070 (Desktop)
min:
161 fps, max:
350 fps
~ 246 fps
GeForce GTX 1080 Max-Q:
134 [X] Asus Zephyrus GX501 Intel Core i7-7700HQ 2.8GHz
GeForce GTX 1080 Max-Q
min:
85 fps, max:
166 fps
fps
GeForce GTX 1070 (Desktop):
144 [X] Nvidia GeForce GTX 1070 Intel Core i7-6700K 4GHz
GeForce GTX 1070 (Desktop)
min:
110 fps
156 [X] MSI Aegis 3 8RD Intel Core i7-8700 3.2GHz
GeForce GTX 1070 (Desktop)
min:
103 fps, max:
205 fps
~ 150 fps
100%
GeForce GTX 1080 Ti:
160 [X] Intel Core i7-4790K 4GHz
GeForce GTX 1080 Ti
min:
118 fps, max:
196 fps
fps
69%
GeForce GTX 1080 Max-Q:
111 [X] Asus Zephyrus GX501 Intel Core i7-7700HQ 2.8GHz
GeForce GTX 1080 Max-Q
min:
74 fps, max:
145 fps
fps
74%
GeForce GTX 1070 (Desktop):
115 [X] Nvidia GeForce GTX 1070 Intel Core i7-6700K 4GHz
GeForce GTX 1070 (Desktop)
min:
91 fps
120.2 [X] MSI Aegis 3 8RD Intel Core i7-8700 3.2GHz
GeForce GTX 1070 (Desktop)
min:
80 fps, max:
144 fps
~ 118 fps
100%
GeForce GTX 1080 Ti:
131 [X] Intel Core i7-4790K 4GHz
GeForce GTX 1080 Ti
min:
106 fps, max:
153 fps
fps
67%
GeForce GTX 1080 Max-Q:
88 [X] Asus Zephyrus GX501 Intel Core i7-7700HQ 2.8GHz
GeForce GTX 1080 Max-Q
min:
71 fps, max:
105 fps
fps
68%
GeForce GTX 1070 (Desktop):
89 [X] Nvidia GeForce GTX 1070 Intel Core i7-6700K 4GHz
GeForce GTX 1070 (Desktop)
min:
73 fps
fps
100%
GeForce GTX 1080 Ti:
82 [X] Intel Core i7-4790K 4GHz
GeForce GTX 1080 Ti
min:
68 fps, max:
96 fps
fps
65%
GeForce GTX 1080 Max-Q:
53.3 [X] Asus Zephyrus GX501 Intel Core i7-7700HQ 2.8GHz
GeForce GTX 1080 Max-Q
min:
43 fps, max:
63 fps
fps
71%
GeForce GTX 1070 (Desktop):
55.8 [X] Nvidia GeForce GTX 1070 Intel Core i7-6700K 4GHz
GeForce GTX 1070 (Desktop)
min:
46 fps
60.4 [X] MSI Aegis 3 8RD Intel Core i7-8700 3.2GHz
GeForce GTX 1070 (Desktop)
min:
47 fps, max:
71 fps
~ 58 fps
GeForce GTX 1070 (Desktop):
238 [X] Nvidia GeForce GTX 1070 Intel Core i7-6700K 4GHz
GeForce GTX 1070 (Desktop)
min:
167 fps
fps
GeForce GTX 1070 (Desktop):
152 [X] Nvidia GeForce GTX 1070 Intel Core i7-6700K 4GHz
GeForce GTX 1070 (Desktop)
min:
113 fps
fps
GeForce GTX 1070 (Desktop):
119 [X] Nvidia GeForce GTX 1070 Intel Core i7-6700K 4GHz
GeForce GTX 1070 (Desktop)
min:
97 fps
fps
100%
GeForce GTX 1080 Ti:
160 [X] Intel Core i7-4790K 4GHz
GeForce GTX 1080 Ti
fps
67%
GeForce GTX 1070 (Desktop):
107 [X] Nvidia GeForce GTX 1070 Intel Core i7-6700K 4GHz
GeForce GTX 1070 (Desktop)
min:
82 fps
fps
GeForce GTX 1070 (Desktop):
73.7 [X] Nvidia GeForce GTX 1070 Intel Core i7-6700K 4GHz
GeForce GTX 1070 (Desktop)
min:
64 fps
fps
100%
GeForce GTX 1080 Ti:
65.2 [X] Intel Core i7-4790K 4GHz
GeForce GTX 1080 Ti
fps
61%
GeForce GTX 1080 Max-Q:
39.7 [X] Asus Zephyrus GX501 Intel Core i7-7700HQ 2.8GHz
GeForce GTX 1080 Max-Q
fps
66%
GeForce GTX 1070 (Desktop):
43 [X] Nvidia GeForce GTX 1070 Intel Core i7-6700K 4GHz
GeForce GTX 1070 (Desktop)
min:
38 fps
fps
GeForce GTX 1080 Max-Q:
71 [X] Asus Zephyrus GX501 Intel Core i7-7700HQ 2.8GHz
GeForce GTX 1080 Max-Q
min:
37 fps, max:
91 fps
fps
GeForce GTX 1070 (Desktop):
103 [X] Nvidia GeForce GTX 1070 Intel Core i7-6700K 4GHz
GeForce GTX 1070 (Desktop)
min:
63 fps
111 ~ 107 fps
GeForce GTX 1080 Max-Q:
66 [X] Asus Zephyrus GX501 Intel Core i7-7700HQ 2.8GHz
GeForce GTX 1080 Max-Q
min:
35 fps, max:
84 fps
fps
GeForce GTX 1070 (Desktop):
91 [X] Nvidia GeForce GTX 1070 Intel Core i7-6700K 4GHz
GeForce GTX 1070 (Desktop)
min:
40 fps
94 ~ 93 fps
GeForce GTX 1080 Max-Q:
62 [X] Asus Zephyrus GX501 Intel Core i7-7700HQ 2.8GHz
GeForce GTX 1080 Max-Q
min:
30 fps, max:
97 fps
fps
GeForce GTX 1070 (Desktop):
86 87 [X] Nvidia GeForce GTX 1070 Intel Core i7-6700K 4GHz
GeForce GTX 1070 (Desktop)
min:
35 fps
~ 87 fps
100%
GeForce GTX 1080 Ti:
79 [X] Intel Core i7-4790K 4GHz
GeForce GTX 1080 Ti
min:
42 fps, max:
124 fps
fps
73%
GeForce GTX 1080 Max-Q:
58 [X] Asus Zephyrus GX501 Intel Core i7-7700HQ 2.8GHz
GeForce GTX 1080 Max-Q
min:
30 fps, max:
98 fps
fps
90%
GeForce GTX 1070 (Desktop):
68 [X] GTX 1070 Founders Edition Asus X299 Prime Intel Core i7-7740X 4.3GHz
GeForce GTX 1070 (Desktop)
72 73 [X] Nvidia GeForce GTX 1070 Intel Core i7-6700K 4GHz
GeForce GTX 1070 (Desktop)
min:
32 fps
~ 71 fps
GeForce GTX 1080 Max-Q:
52 [X] Asus Zephyrus GX501 Intel Core i7-7700HQ 2.8GHz
GeForce GTX 1080 Max-Q
min:
21 fps, max:
79 fps
fps
GeForce GTX 1070 (Desktop):
57 [X] Nvidia GeForce GTX 1070 Intel Core i7-6700K 4GHz
GeForce GTX 1070 (Desktop)
min:
31 fps
fps
100%
GeForce GTX 1080 Ti:
49 [X] Intel Core i7-4790K 4GHz
GeForce GTX 1080 Ti
min:
31 fps, max:
84 fps
fps
71%
GeForce GTX 1080 Max-Q:
35 [X] Asus Zephyrus GX501 Intel Core i7-7700HQ 2.8GHz
GeForce GTX 1080 Max-Q
min:
11 fps, max:
65 fps
fps
65%
GeForce GTX 1070 (Desktop):
30 [X] GTX 1070 Founders Edition Asus X299 Prime Intel Core i7-7740X 4.3GHz
GeForce GTX 1070 (Desktop)
32 33 [X] Nvidia GeForce GTX 1070 Intel Core i7-6700K 4GHz
GeForce GTX 1070 (Desktop)
min:
10 fps
~ 32 fps
GeForce GTX 1080 Max-Q:
124 [X] Asus Zephyrus GX501 Intel Core i7-7700HQ 2.8GHz
GeForce GTX 1080 Max-Q
fps
GeForce GTX 1070 (Desktop):
166 [X] Nvidia GeForce GTX 1070 Intel Core i7-6700K 4GHz
GeForce GTX 1070 (Desktop)
min:
134 fps
183.5 ~ 175 fps
GeForce GTX 1080 Max-Q:
122 [X] Asus Zephyrus GX501 Intel Core i7-7700HQ 2.8GHz
GeForce GTX 1080 Max-Q
fps
GeForce GTX 1070 (Desktop):
156.8 162 [X] Nvidia GeForce GTX 1070 Intel Core i7-6700K 4GHz
GeForce GTX 1070 (Desktop)
min:
122 fps
~ 159 fps
100%
GeForce GTX 1080 Ti:
156 [X] Intel Core i7-4790K 4GHz
GeForce GTX 1080 Ti
P1:
8.3 fps
fps
78%
GeForce GTX 1080 Max-Q:
122 [X] Asus Zephyrus GX501 Intel Core i7-7700HQ 2.8GHz
GeForce GTX 1080 Max-Q
fps
95%
GeForce GTX 1070 (Desktop):
147 [X] Nvidia GeForce GTX 1070 Intel Core i7-6700K 4GHz
GeForce GTX 1070 (Desktop)
min:
110 fps
148.7 ~ 148 fps
100%
GeForce GTX 1080 Ti:
158 [X] Intel Core i7-4790K 4GHz
GeForce GTX 1080 Ti
P1:
8.3 fps
fps
73%
GeForce GTX 1080 Max-Q:
115 [X] Asus Zephyrus GX501 Intel Core i7-7700HQ 2.8GHz
GeForce GTX 1080 Max-Q
fps
80%
GeForce GTX 1070 (Desktop):
123 [X] Nvidia GeForce GTX 1070 Intel Core i7-6700K 4GHz
GeForce GTX 1070 (Desktop)
min:
94 fps
129.2 ~ 126 fps
GeForce GTX 1070 (Desktop):
65.3 [X] Nvidia GeForce GTX 1070 Intel Core i7-6700K 4GHz
GeForce GTX 1070 (Desktop)
min:
54 fps
fps
100%
GeForce GTX 1080 Ti:
51.5 [X] Intel Core i7-4790K 4GHz
GeForce GTX 1080 Ti
P1:
22.8 fps
fps
62%
GeForce GTX 1080 Max-Q:
32 [X] Asus Zephyrus GX501 Intel Core i7-7700HQ 2.8GHz
GeForce GTX 1080 Max-Q
fps
76%
GeForce GTX 1070 (Desktop):
32.9 [X] Nvidia GeForce GTX 1070 Intel Core i7-6700K 4GHz
GeForce GTX 1070 (Desktop)
min:
29 fps
45.8 ~ 39 fps
GeForce GTX 1080 Max-Q:
109 [X] Asus Zephyrus GX501 Intel Core i7-7700HQ 2.8GHz
GeForce GTX 1080 Max-Q
min:
96 fps, max:
121 fps
fps
GeForce GTX 1070 (Desktop):
122 [X] Nvidia GeForce GTX 1070 Intel Core i7-6700K 4GHz
GeForce GTX 1070 (Desktop)
min:
121 fps
fps
GeForce GTX 1080 Max-Q:
110 [X] Asus Zephyrus GX501 Intel Core i7-7700HQ 2.8GHz
GeForce GTX 1080 Max-Q
min:
100 fps, max:
121 fps
fps
GeForce GTX 1070 (Desktop):
122 [X] Nvidia GeForce GTX 1070 Intel Core i7-6700K 4GHz
GeForce GTX 1070 (Desktop)
min:
119 fps
fps
GeForce GTX 1080 Max-Q:
112 [X] Asus Zephyrus GX501 Intel Core i7-7700HQ 2.8GHz
GeForce GTX 1080 Max-Q
min:
104 fps, max:
122 fps
fps
GeForce GTX 1070 (Desktop):
106 [X] Nvidia GeForce GTX 1070 Intel Core i7-6700K 4GHz
GeForce GTX 1070 (Desktop)
min:
100 fps
fps
100%
GeForce GTX 1080 Ti:
120 [X] Intel Core i7-4790K 4GHz
GeForce GTX 1080 Ti
min:
110 fps, max:
123 fps
fps
73%
GeForce GTX 1080 Max-Q:
87 [X] Asus Zephyrus GX501 Intel Core i7-7700HQ 2.8GHz
GeForce GTX 1080 Max-Q
min:
79 fps, max:
98 fps
fps
69%
GeForce GTX 1070 (Desktop):
82.6 [X] Nvidia GeForce GTX 1070 Intel Core i7-6700K 4GHz
GeForce GTX 1070 (Desktop)
min:
76 fps
fps
GeForce GTX 1080 Max-Q:
54.6 [X] Asus Zephyrus GX501 Intel Core i7-7700HQ 2.8GHz
GeForce GTX 1080 Max-Q
min:
51 fps, max:
59 fps
fps
GeForce GTX 1070 (Desktop):
54.1 [X] Nvidia GeForce GTX 1070 Intel Core i7-6700K 4GHz
GeForce GTX 1070 (Desktop)
min:
50 fps
fps
100%
GeForce GTX 1080 Ti:
44.4 [X] Intel Core i7-4790K 4GHz
GeForce GTX 1080 Ti
min:
42 fps, max:
48 fps
fps
64%
GeForce GTX 1080 Max-Q:
28.6 [X] Asus Zephyrus GX501 Intel Core i7-7700HQ 2.8GHz
GeForce GTX 1080 Max-Q
min:
26 fps, max:
32 fps
fps
63%
GeForce GTX 1070 (Desktop):
28 [X] Nvidia GeForce GTX 1070 Intel Core i7-6700K 4GHz
GeForce GTX 1070 (Desktop)
min:
25 fps
fps
GeForce GTX 1080 Max-Q:
78 [X] Asus Zephyrus GX501 Intel Core i7-7700HQ 2.8GHz
GeForce GTX 1080 Max-Q
min:
63 fps, max:
95 fps
90.1 ~ 84 fps
GeForce GTX 1070 (Desktop):
103 [X] Nvidia GeForce GTX 1070 Intel Core i7-6700K 4GHz
GeForce GTX 1070 (Desktop)
min:
85 fps
fps
GeForce GTX 1080 Max-Q:
66 [X] Asus Zephyrus GX501 Intel Core i7-7700HQ 2.8GHz
GeForce GTX 1080 Max-Q
min:
54 fps, max:
75 fps
66.6 ~ 66 fps
GeForce GTX 1070 (Desktop):
59.3 [X] Nvidia GeForce GTX 1070 Intel Core i7-6700K 4GHz
GeForce GTX 1070 (Desktop)
min:
56 fps
fps
GeForce GTX 1080 Max-Q:
62.3 [X] Asus Zephyrus GX501 Intel Core i7-7700HQ 2.8GHz
GeForce GTX 1080 Max-Q
min:
53 fps, max:
70 fps
64 ~ 63 fps
GeForce GTX 1070 (Desktop):
59.1 [X] Nvidia GeForce GTX 1070 Intel Core i7-6700K 4GHz
GeForce GTX 1070 (Desktop)
min:
55 fps
fps
100%
GeForce GTX 1080 Ti:
87 [X] Intel Core i7-4790K 4GHz
GeForce GTX 1080 Ti
87 [X] Intel Core i7-4790K 4GHz
GeForce GTX 1080 Ti
min:
67 fps, max:
99 fps
~ 87 fps
71%
GeForce GTX 1080 Max-Q:
61.4 [X] Asus Zephyrus GX501 Intel Core i7-7700HQ 2.8GHz
GeForce GTX 1080 Max-Q
min:
51 fps, max:
71 fps
62.6 ~ 62 fps
68%
GeForce GTX 1070 (Desktop):
58.9 [X] Nvidia GeForce GTX 1070 Intel Core i7-6700K 4GHz
GeForce GTX 1070 (Desktop)
min:
55 fps
fps
100%
GeForce GTX 1080 Ti:
40.6 [X] Intel Core i7-4790K 4GHz
GeForce GTX 1080 Ti
min:
34 fps, max:
44 fps
fps
63%
GeForce GTX 1080 Max-Q:
25.5 [X] Asus Zephyrus GX501 Intel Core i7-7700HQ 2.8GHz
GeForce GTX 1080 Max-Q
min:
23 fps, max:
28 fps
fps
67%
GeForce GTX 1070 (Desktop):
27.1 [X] Nvidia GeForce GTX 1070 Intel Core i7-6700K 4GHz
GeForce GTX 1070 (Desktop)
min:
24 fps
fps
100%
GeForce GTX 1080 Ti:
167 [X] Intel Core i7-4790K 4GHz
GeForce GTX 1080 Ti
min:
72 fps, max:
207 fps
fps
83%
GeForce GTX 1080 Max-Q:
130 [X] Asus Zephyrus GX501 Intel Core i7-7700HQ 2.8GHz
GeForce GTX 1080 Max-Q
min:
75 fps, max:
161 fps
146 ~ 138 fps
101%
GeForce GTX 1070 (Desktop):
168 [X] Nvidia GeForce GTX 1070 Intel Core i7-6700K 4GHz
GeForce GTX 1070 (Desktop)
min:
90 fps
fps
100%
GeForce GTX 1080 Ti:
155 [X] Intel Core i7-4790K 4GHz
GeForce GTX 1080 Ti
min:
73 fps, max:
196 fps
fps
82%
GeForce GTX 1080 Max-Q:
122 [X] Asus Zephyrus GX501 Intel Core i7-7700HQ 2.8GHz
GeForce GTX 1080 Max-Q
min:
62 fps, max:
170 fps
132 ~ 127 fps
90%
GeForce GTX 1070 (Desktop):
140 [X] Nvidia GeForce GTX 1070 Intel Core i7-6700K 4GHz
GeForce GTX 1070 (Desktop)
min:
60 fps
fps
100%
GeForce GTX 1080 Ti:
138 [X] Intel Core i7-4790K 4GHz
GeForce GTX 1080 Ti
min:
64 fps, max:
194 fps
fps
78%
GeForce GTX 1080 Max-Q:
105 [X] Asus Zephyrus GX501 Intel Core i7-7700HQ 2.8GHz
GeForce GTX 1080 Max-Q
min:
38 fps, max:
153 fps
111 ~ 108 fps
81%
GeForce GTX 1070 (Desktop):
112 [X] Nvidia GeForce GTX 1070 Intel Core i7-6700K 4GHz
GeForce GTX 1070 (Desktop)
min:
51 fps
fps
100%
GeForce GTX 1080 Ti:
117 [X] Intel Core i7-4790K 4GHz
GeForce GTX 1080 Ti
min:
52 fps, max:
182 fps
fps
74%
GeForce GTX 1080 Max-Q:
85 [X] Asus Zephyrus GX501 Intel Core i7-7700HQ 2.8GHz
GeForce GTX 1080 Max-Q
min:
27 fps, max:
149 fps
88 ~ 87 fps
69%
GeForce GTX 1070 (Desktop):
76 [X] Intel Core i7-4790K 4GHz
GeForce GTX 1070 (Desktop)
min:
34 fps, max:
123 fps
86 [X] Nvidia GeForce GTX 1070 Intel Core i7-6700K 4GHz
GeForce GTX 1070 (Desktop)
min:
29 fps
~ 81 fps
100%
GeForce GTX 1080 Ti:
51 [X] Intel Core i7-4790K 4GHz
GeForce GTX 1080 Ti
min:
22 fps, max:
171 fps
fps
65%
GeForce GTX 1080 Max-Q:
33 [X] Asus Zephyrus GX501 Intel Core i7-7700HQ 2.8GHz
GeForce GTX 1080 Max-Q
min:
16 fps, max:
84 fps
fps
63%
GeForce GTX 1070 (Desktop):
30 [X] Intel Core i7-4790K 4GHz
GeForce GTX 1070 (Desktop)
min:
17 fps, max:
97 fps
34 [X] Nvidia GeForce GTX 1070 Intel Core i7-6700K 4GHz
GeForce GTX 1070 (Desktop)
min:
20 fps
~ 32 fps
GeForce GTX 1080 Max-Q:
284 [X] Asus Zephyrus GX501 Intel Core i7-7700HQ 2.8GHz
GeForce GTX 1080 Max-Q
min:
260 fps, max:
320 fps
fps
GeForce GTX 1070 (Desktop):
356 [X] Nvidia GeForce GTX 1070 Intel Core i7-6700K 4GHz
GeForce GTX 1070 (Desktop)
min:
326 fps
fps
GeForce GTX 1080 Max-Q:
279 [X] Asus Zephyrus GX501 Intel Core i7-7700HQ 2.8GHz
GeForce GTX 1080 Max-Q
min:
254 fps, max:
301 fps
fps
GeForce GTX 1070 (Desktop):
344 [X] Nvidia GeForce GTX 1070 Intel Core i7-6700K 4GHz
GeForce GTX 1070 (Desktop)
min:
309 fps
fps
GeForce GTX 1080 Max-Q:
253 [X] Asus Zephyrus GX501 Intel Core i7-7700HQ 2.8GHz
GeForce GTX 1080 Max-Q
fps
GeForce GTX 1070 (Desktop):
312 [X] Nvidia GeForce GTX 1070 Intel Core i7-6700K 4GHz
GeForce GTX 1070 (Desktop)
min:
284 fps
fps
GeForce GTX 1080 Max-Q:
240 [X] Asus Zephyrus GX501 Intel Core i7-7700HQ 2.8GHz
GeForce GTX 1080 Max-Q
min:
224 fps, max:
263 fps
fps
GeForce GTX 1070 (Desktop):
298 [X] Nvidia GeForce GTX 1070 Intel Core i7-6700K 4GHz
GeForce GTX 1070 (Desktop)
min:
264 fps
fps
GeForce GTX 1080 Max-Q:
166 [X] Asus Zephyrus GX501 Intel Core i7-7700HQ 2.8GHz
GeForce GTX 1080 Max-Q
min:
145 fps, max:
175 fps
fps
GeForce GTX 1070 (Desktop):
171 [X] Nvidia GeForce GTX 1070 Intel Core i7-6700K 4GHz
GeForce GTX 1070 (Desktop)
min:
142 fps
fps
GeForce GTX 1070 (Desktop):
130 [X] Nvidia GeForce GTX 1070 Intel Core i7-6700K 4GHz
GeForce GTX 1070 (Desktop)
min:
85 fps
fps
GeForce GTX 1070 (Desktop):
82.6 [X] Nvidia GeForce GTX 1070 Intel Core i7-6700K 4GHz
GeForce GTX 1070 (Desktop)
min:
73 fps
fps
GeForce GTX 1080 Max-Q:
56.6 fps
GeForce GTX 1070 (Desktop):
59.4 [X] Nvidia GeForce GTX 1070 Intel Core i7-6700K 4GHz
GeForce GTX 1070 (Desktop)
min:
56 fps
fps
100%
GeForce GTX 1080 Ti:
58.5 [X] Intel Core i7-4790K 4GHz
GeForce GTX 1080 Ti
min:
54 fps, max:
64 fps
fps
66%
GeForce GTX 1080 Max-Q:
38.6 fps
69%
GeForce GTX 1070 (Desktop):
40.4 [X] Nvidia GeForce GTX 1070 Intel Core i7-6700K 4GHz
GeForce GTX 1070 (Desktop)
min:
38 fps
fps
100%
GeForce GTX 1080 Ti:
22.5 [X] Intel Core i7-4790K 4GHz
GeForce GTX 1080 Ti
min:
21 fps, max:
24 fps
fps
67%
GeForce GTX 1070 (Desktop):
15.1 [X] Nvidia GeForce GTX 1070 Intel Core i7-6700K 4GHz
GeForce GTX 1070 (Desktop)
min:
14 fps
fps
GeForce GTX 1070 (Desktop):
231 [X] Nvidia GeForce GTX 1070 Intel Core i7-6700K 4GHz
GeForce GTX 1070 (Desktop)
min:
180 fps
fps
GeForce GTX 1070 (Desktop):
173 [X] Nvidia GeForce GTX 1070 Intel Core i7-6700K 4GHz
GeForce GTX 1070 (Desktop)
min:
138 fps
fps
GeForce GTX 1080 Max-Q:
104 [X] Asus Zephyrus GX501 Intel Core i7-7700HQ 2.8GHz
GeForce GTX 1080 Max-Q
min:
89 fps, max:
114 fps
135 ~ 120 fps
GeForce GTX 1070 (Desktop):
146 [X] Nvidia GeForce GTX 1070 Intel Core i7-6700K 4GHz
GeForce GTX 1070 (Desktop)
min:
123 fps
fps
GeForce GTX 1080 Max-Q:
92 [X] Asus Zephyrus GX501 Intel Core i7-7700HQ 2.8GHz
GeForce GTX 1080 Max-Q
min:
76 fps, max:
101 fps
101 ~ 97 fps
GeForce GTX 1070 (Desktop):
104 [X] Nvidia GeForce GTX 1070 Intel Core i7-6700K 4GHz
GeForce GTX 1070 (Desktop)
min:
89 fps
fps
GeForce GTX 1080 Max-Q:
48 [X] Asus Zephyrus GX501 Intel Core i7-7700HQ 2.8GHz
GeForce GTX 1080 Max-Q
min:
43 fps, max:
51 fps
fps
GeForce GTX 1070 (Desktop):
50 [X] Nvidia GeForce GTX 1070 Intel Core i7-6700K 4GHz
GeForce GTX 1070 (Desktop)
min:
45 fps
fps
100%
GeForce GTX 1080 Ti:
127 [X] Intel Core i7-4790K 4GHz
GeForce GTX 1080 Ti
min:
80 fps, max:
145 fps
fps
98%
GeForce GTX 1080 Max-Q:
125 fps
121%
GeForce GTX 1070 (Desktop):
126 [X] Nvidia GeForce GTX 1070 Intel Core i7-6700K 4GHz
GeForce GTX 1070 (Desktop)
min:
78 fps
182.8 [X] MSI Aegis 3 8RD Intel Core i7-8700 3.2GHz
GeForce GTX 1070 (Desktop)
min:
154 fps, max:
211 fps
~ 154 fps
100%
GeForce GTX 1080 Ti:
125 [X] Intel Core i7-4790K 4GHz
GeForce GTX 1080 Ti
min:
80 fps, max:
144 fps
fps
89%
GeForce GTX 1080 Max-Q:
111 fps
108%
GeForce GTX 1070 (Desktop):
117 [X] Nvidia GeForce GTX 1070 Intel Core i7-6700K 4GHz
GeForce GTX 1070 (Desktop)
min:
78 fps
153.3 [X] MSI Aegis 3 8RD Intel Core i7-8700 3.2GHz
GeForce GTX 1070 (Desktop)
min:
122 fps, max:
189 fps
~ 135 fps
100%
GeForce GTX 1080 Ti:
115 [X] Intel Core i7-4790K 4GHz
GeForce GTX 1080 Ti
min:
52 fps, max:
142 fps
fps
90%
GeForce GTX 1080 Max-Q:
103 104 ~ 104 fps
106%
GeForce GTX 1070 (Desktop):
107 [X] Nvidia GeForce GTX 1070 Intel Core i7-6700K 4GHz
GeForce GTX 1070 (Desktop)
min:
70 fps
136.9 [X] MSI Aegis 3 8RD Intel Core i7-8700 3.2GHz
GeForce GTX 1070 (Desktop)
min:
112 fps, max:
153 fps
~ 122 fps
100%
GeForce GTX 1080 Ti:
93 [X] AMD Ryzen 7 1800X 3.6GHz
GeForce GTX 1080 Ti
min:
60 fps, max:
115 fps
110 [X] Intel Core i7-4790K 4GHz
GeForce GTX 1080 Ti
min:
78 fps, max:
137 fps
~ 102 fps
78%
GeForce GTX 1080 Max-Q:
79 81.8 ~ 80 fps
88%
GeForce GTX 1070 (Desktop):
77.8 [X] Intel Core i7-4790K 4GHz
GeForce GTX 1070 (Desktop)
min:
54 fps, max:
88 fps
80.5 [X] Nvidia GeForce GTX 1070 Intel Core i7-6700K 4GHz
GeForce GTX 1070 (Desktop)
min:
58 fps
110.6 [X] MSI Aegis 3 8RD Intel Core i7-8700 3.2GHz
GeForce GTX 1070 (Desktop)
min:
95 fps, max:
132 fps
~ 90 fps
100%
GeForce GTX 1080 Ti:
44.8 [X] AMD Ryzen 7 1800X 3.6GHz
GeForce GTX 1080 Ti
min:
36 fps, max:
51 fps
46 [X] Intel Core i7-4790K 4GHz
GeForce GTX 1080 Ti
min:
36 fps, max:
51 fps
~ 45 fps
60%
GeForce GTX 1080 Max-Q:
27.1 fps
78%
GeForce GTX 1070 (Desktop):
28.2 [X] Nvidia GeForce GTX 1070 Intel Core i7-6700K 4GHz
GeForce GTX 1070 (Desktop)
min:
18 fps
41.8 [X] MSI Aegis 3 8RD Intel Core i7-8700 3.2GHz
GeForce GTX 1070 (Desktop)
min:
37 fps, max:
47 fps
~ 35 fps
100%
GeForce GTX 1080 Ti:
149 [X] Nvidia GeForce GTX 1080 Ti FE Asus Prime B350-PLUS AMD Ryzen 7 1800X 3.6GHz
GeForce GTX 1080 Ti
min:
129 fps
fps
91%
GeForce GTX 1080 Max-Q:
133 [X] Asus Zephyrus GX501 Intel Core i7-7700HQ 2.8GHz
GeForce GTX 1080 Max-Q
min:
115.2 fps
137 ~ 135 fps
100%
GeForce GTX 1080 Ti:
140 [X] Nvidia GeForce GTX 1080 Ti FE Asus Prime B350-PLUS AMD Ryzen 7 1800X 3.6GHz
GeForce GTX 1080 Ti
min:
122 fps
fps
96%
GeForce GTX 1080 Max-Q:
131 [X] Asus Zephyrus GX501 Intel Core i7-7700HQ 2.8GHz
GeForce GTX 1080 Max-Q
min:
112.1 fps
136 ~ 134 fps
100%
GeForce GTX 1080 Ti:
136 [X] Nvidia GeForce GTX 1080 Ti FE Asus Prime B350-PLUS AMD Ryzen 7 1800X 3.6GHz
GeForce GTX 1080 Ti
min:
119 fps
fps
96%
GeForce GTX 1080 Max-Q:
128 [X] Asus Zephyrus GX501 Intel Core i7-7700HQ 2.8GHz
GeForce GTX 1080 Max-Q
min:
108.4 fps
132 ~ 130 fps
100%
GeForce GTX 1080 Ti:
136 [X] Nvidia GeForce GTX 1080 Ti FE Asus Prime B350-PLUS AMD Ryzen 7 1800X 3.6GHz
GeForce GTX 1080 Ti
min:
117 fps
171 [X] Intel Core i7-4790K 4GHz
GeForce GTX 1080 Ti
min:
146 fps
~ 154 fps
82%
GeForce GTX 1080 Max-Q:
124 125 [X] Asus Zephyrus GX501 Intel Core i7-7700HQ 2.8GHz
GeForce GTX 1080 Max-Q
min:
105.4 fps
132 ~ 127 fps
100%
GeForce GTX 1080 Ti:
134 [X] Nvidia GeForce GTX 1080 Ti FE Asus Prime B350-PLUS AMD Ryzen 7 1800X 3.6GHz
GeForce GTX 1080 Ti
min:
122 fps
166 [X] Intel Core i7-4790K 4GHz
GeForce GTX 1080 Ti
min:
137 fps
~ 150 fps
81%
GeForce GTX 1080 Max-Q:
111 [X] Asus Zephyrus GX501 Intel Core i7-7700HQ 2.8GHz
GeForce GTX 1080 Max-Q
min:
96 fps
125 130 ~ 122 fps
101%
GeForce GTX 1070 (Desktop):
152 [X] Intel Core i7-4790K 4GHz
GeForce GTX 1070 (Desktop)
min:
128 fps
fps
GeForce GTX 1070 (Desktop):
308.9 [X] MSI Aegis 3 8RD Intel Core i7-8700 3.2GHz
GeForce GTX 1070 (Desktop)
min:
282 fps, max:
328 fps
338 [X] Nvidia GeForce GTX 1070 Intel Core i7-6700K 4GHz
GeForce GTX 1070 (Desktop)
min:
327 fps
~ 323 fps
GeForce GTX 1070 (Desktop):
217 [X] Nvidia GeForce GTX 1070 Intel Core i7-6700K 4GHz
GeForce GTX 1070 (Desktop)
min:
176 fps
234.5 [X] MSI Aegis 3 8RD Intel Core i7-8700 3.2GHz
GeForce GTX 1070 (Desktop)
min:
219 fps, max:
250 fps
~ 226 fps
100%
GeForce GTX 1080 Ti:
177 [X] Intel Core i7-4790K 4GHz
GeForce GTX 1080 Ti
min:
79 fps, max:
211 fps
fps
81%
GeForce GTX 1080 Max-Q:
136 149 ~ 143 fps
94%
GeForce GTX 1070 (Desktop):
162 [X] Nvidia GeForce GTX 1070 Intel Core i7-6700K 4GHz
GeForce GTX 1070 (Desktop)
min:
103 fps
171 [X] MSI Aegis 3 8RD Intel Core i7-8700 3.2GHz
GeForce GTX 1070 (Desktop)
min:
156 fps, max:
195 fps
~ 167 fps
100%
GeForce GTX 1080 Ti:
109 [X] Intel Core i7-4790K 4GHz
GeForce GTX 1080 Ti
min:
60 fps, max:
135 fps
fps
80%
GeForce GTX 1080 Max-Q:
85.3 88.4 ~ 87 fps
86%
GeForce GTX 1070 (Desktop):
92.9 [X] Nvidia GeForce GTX 1070 Intel Core i7-6700K 4GHz
GeForce GTX 1070 (Desktop)
min:
73 fps
95.9 [X] MSI Aegis 3 8RD Intel Core i7-8700 3.2GHz
GeForce GTX 1070 (Desktop)
min:
82 fps, max:
120 fps
~ 94 fps
100%
GeForce GTX 1080 Ti:
77 [X] Intel Core i7-4790K 4GHz
GeForce GTX 1080 Ti
fps
73%
GeForce GTX 1070 (Desktop):
55 [X] Nvidia GeForce GTX 1070 Intel Core i7-6700K 4GHz
GeForce GTX 1070 (Desktop)
min:
49 fps
56.3 [X] MSI Aegis 3 8RD Intel Core i7-8700 3.2GHz
GeForce GTX 1070 (Desktop)
min:
48 fps, max:
68 fps
~ 56 fps
100%
GeForce GTX 1080 Ti:
250 [X] Intel Core i7-4790K 4GHz
GeForce GTX 1080 Ti
min:
244 fps, max:
252 fps
fps
98%
GeForce GTX 1070 (Desktop):
242.5 [X] MSI Aegis 3 8RD Intel Core i7-8700 3.2GHz
GeForce GTX 1070 (Desktop)
min:
239 fps, max:
252 fps
250 [X] Nvidia GeForce GTX 1070 Intel Core i7-6700K 4GHz
GeForce GTX 1070 (Desktop)
min:
244 fps
~ 246 fps
100%
GeForce GTX 1080 Ti:
244 [X] Intel Core i7-4790K 4GHz
GeForce GTX 1080 Ti
min:
185 fps, max:
252 fps
fps
102%
GeForce GTX 1070 (Desktop):
248 [X] MSI Aegis 3 8RD Intel Core i7-8700 3.2GHz
GeForce GTX 1070 (Desktop)
min:
235 fps, max:
252 fps
249 [X] Nvidia GeForce GTX 1070 Intel Core i7-6700K 4GHz
GeForce GTX 1070 (Desktop)
min:
229 fps
~ 249 fps
100%
GeForce GTX 1080 Ti:
214 [X] Intel Core i7-4790K 4GHz
GeForce GTX 1080 Ti
min:
144 fps, max:
252 fps
fps
108%
GeForce GTX 1080 Max-Q:
228 235 ~ 232 fps
94%
GeForce GTX 1070 (Desktop):
196 [X] Nvidia GeForce GTX 1070 Intel Core i7-6700K 4GHz
GeForce GTX 1070 (Desktop)
min:
158 fps
205.9 [X] MSI Aegis 3 8RD Intel Core i7-8700 3.2GHz
GeForce GTX 1070 (Desktop)
min:
161 fps, max:
251 fps
~ 201 fps
100%
GeForce GTX 1080 Ti:
132 [X] Intel Core i7-4790K 4GHz
GeForce GTX 1080 Ti
min:
98 fps, max:
188 fps
fps
78%
GeForce GTX 1080 Max-Q:
103 fps
72%
GeForce GTX 1070 (Desktop):
94.4 [X] Nvidia GeForce GTX 1070 Intel Core i7-6700K 4GHz
GeForce GTX 1070 (Desktop)
min:
81 fps
95.4 [X] Intel Core i7-4790K 4GHz
GeForce GTX 1070 (Desktop)
min:
78 fps, max:
140 fps
96.1 [X] MSI Aegis 3 8RD Intel Core i7-8700 3.2GHz
GeForce GTX 1070 (Desktop)
min:
76 fps, max:
138 fps
~ 95 fps
100%
GeForce GTX 1080 Ti:
144 [X] Intel Core i7-4790K 4GHz
GeForce GTX 1080 Ti
min:
139 fps, max:
146 fps
fps
98%
GeForce GTX 1080 Max-Q:
141.7 fps
100%
GeForce GTX 1070 (Desktop):
144 [X] Nvidia GeForce GTX 1070 Intel Core i7-6700K 4GHz
GeForce GTX 1070 (Desktop)
min:
141 fps
fps
100%
GeForce GTX 1080 Ti:
143 [X] Intel Core i7-4790K 4GHz
GeForce GTX 1080 Ti
min:
137 fps, max:
145 fps
fps
99%
GeForce GTX 1080 Max-Q:
142 fps
100%
GeForce GTX 1070 (Desktop):
143 [X] Nvidia GeForce GTX 1070 Intel Core i7-6700K 4GHz
GeForce GTX 1070 (Desktop)
min:
137 fps
fps
100%
GeForce GTX 1080 Ti:
142 [X] Intel Core i7-4790K 4GHz
GeForce GTX 1080 Ti
min:
134 fps, max:
146 fps
fps
100%
GeForce GTX 1070 (Desktop):
142 [X] Nvidia GeForce GTX 1070 Intel Core i7-6700K 4GHz
GeForce GTX 1070 (Desktop)
min:
129 fps
fps
100%
GeForce GTX 1080 Ti:
139 [X] Intel Core i7-4790K 4GHz
GeForce GTX 1080 Ti
min:
129 fps, max:
145 fps
fps
101%
GeForce GTX 1070 (Desktop):
141 [X] Nvidia GeForce GTX 1070 Intel Core i7-6700K 4GHz
GeForce GTX 1070 (Desktop)
min:
117 fps
fps
100%
GeForce GTX 1080 Ti:
95 [X] Intel Core i7-4790K 4GHz
GeForce GTX 1080 Ti
min:
68 fps, max:
115 fps
fps
53%
GeForce GTX 1080 Max-Q:
50.5 fps
60%
GeForce GTX 1070 (Desktop):
56 [X] Intel Core i7-4790K 4GHz
GeForce GTX 1070 (Desktop)
58 [X] Nvidia GeForce GTX 1070 Intel Core i7-6700K 4GHz
GeForce GTX 1070 (Desktop)
min:
48 fps
~ 57 fps
100%
GeForce GTX 1080 Ti:
192 [X] Intel Core i7-4790K 4GHz
GeForce GTX 1080 Ti
min:
139 fps, max:
322 fps
fps
90%
GeForce GTX 1070 (Desktop):
172 [X] Nvidia GeForce GTX 1070 Intel Core i7-6700K 4GHz
GeForce GTX 1070 (Desktop)
min:
127 fps
fps
100%
GeForce GTX 1080 Ti:
120 [X] Intel Core i7-4790K 4GHz
GeForce GTX 1080 Ti
min:
96 fps, max:
216 fps
fps
76%
GeForce GTX 1070 (Desktop):
91.3 [X] Nvidia GeForce GTX 1070 Intel Core i7-6700K 4GHz
GeForce GTX 1070 (Desktop)
min:
73 fps
fps
100%
GeForce GTX 1080 Ti:
98 [X] Intel Core i7-4790K 4GHz
GeForce GTX 1080 Ti
min:
76 fps, max:
164 fps
fps
90%
GeForce GTX 1080 Max-Q:
88 fps
65%
GeForce GTX 1070 (Desktop):
63.6 [X] Nvidia GeForce GTX 1070 Intel Core i7-6700K 4GHz
GeForce GTX 1070 (Desktop)
min:
51 fps
fps
100%
GeForce GTX 1080 Ti:
89 [X] Intel Core i7-4790K 4GHz
GeForce GTX 1080 Ti
min:
72 fps, max:
139 fps
fps
97%
GeForce GTX 1080 Max-Q:
86 fps
64%
GeForce GTX 1070 (Desktop):
56.4 [X] Intel Core i7-4790K 4GHz
GeForce GTX 1070 (Desktop)
min:
45 fps, max:
84 fps
57 [X] Nvidia GeForce GTX 1070 Intel Core i7-6700K 4GHz
GeForce GTX 1070 (Desktop)
min:
47 fps
~ 57 fps
100%
GeForce GTX 1080 Ti:
33.8 [X] Intel Core i7-4790K 4GHz
GeForce GTX 1080 Ti
min:
26 fps, max:
48 fps
fps
124%
GeForce GTX 1080 Max-Q:
41.9 fps
61%
GeForce GTX 1070 (Desktop):
20.7 [X] Nvidia GeForce GTX 1070 Intel Core i7-6700K 4GHz
GeForce GTX 1070 (Desktop)
min:
16 fps
fps
100%
GeForce GTX 1080 Ti:
140 [X] AMD Ryzen 7 1800X 3.6GHz
GeForce GTX 1080 Ti
min:
112 fps, max:
182 fps
144 [X] Intel Core i7-4790K 4GHz
GeForce GTX 1080 Ti
min:
111 fps, max:
194 fps
~ 142 fps
115%
GeForce GTX 1070 (Desktop):
163 [X] Nvidia GeForce GTX 1070 Intel Core i7-6700K 4GHz
GeForce GTX 1070 (Desktop)
min:
131 fps
fps
100%
GeForce GTX 1080 Ti:
124 [X] AMD Ryzen 7 1800X 3.6GHz
GeForce GTX 1080 Ti
min:
99 fps, max:
171 fps
125 [X] Intel Core i7-4790K 4GHz
GeForce GTX 1080 Ti
min:
95 fps, max:
174 fps
~ 125 fps
101%
GeForce GTX 1070 (Desktop):
126 [X] Nvidia GeForce GTX 1070 Intel Core i7-6700K 4GHz
GeForce GTX 1070 (Desktop)
min:
92 fps
fps
100%
GeForce GTX 1080 Ti:
100 [X] AMD Ryzen 7 1800X 3.6GHz
GeForce GTX 1080 Ti
min:
78 fps, max:
131 fps
102 [X] Intel Core i7-4790K 4GHz
GeForce GTX 1080 Ti
min:
86 fps, max:
137 fps
~ 101 fps
81%
GeForce GTX 1080 Max-Q:
81.4 fps
88%
GeForce GTX 1070 (Desktop):
89 [X] Nvidia GeForce GTX 1070 Intel Core i7-6700K 4GHz
GeForce GTX 1070 (Desktop)
min:
74 fps
fps
100%
GeForce GTX 1080 Ti:
94 [X] AMD Ryzen 7 1800X 3.6GHz
GeForce GTX 1080 Ti
min:
82 fps, max:
124 fps
95 [X] Intel Core i7-4790K 4GHz
GeForce GTX 1080 Ti
min:
80 fps, max:
127 fps
~ 95 fps
77%
GeForce GTX 1080 Max-Q:
73.2 fps
77%
GeForce GTX 1070 (Desktop):
72.9 [X] Nvidia GeForce GTX 1070 Intel Core i7-6700K 4GHz
GeForce GTX 1070 (Desktop)
min:
57 fps
fps
100%
GeForce GTX 1080 Ti:
53.4 [X] Intel Core i7-4790K 4GHz
GeForce GTX 1080 Ti
min:
48 fps, max:
67 fps
54.6 [X] AMD Ryzen 7 1800X 3.6GHz
GeForce GTX 1080 Ti
min:
48 fps, max:
67 fps
~ 54 fps
65%
GeForce GTX 1080 Max-Q:
35.1 fps
68%
GeForce GTX 1070 (Desktop):
36.6 [X] Nvidia GeForce GTX 1070 Intel Core i7-6700K 4GHz
GeForce GTX 1070 (Desktop)
min:
33 fps
fps
100%
GeForce GTX 1080 Ti:
203 [X] Intel Core i7-4790K 4GHz
GeForce GTX 1080 Ti
min:
175 fps, max:
232 fps
fps
65%
GeForce GTX 1080 Max-Q:
131.7 fps
90%
GeForce GTX 1070 (Desktop):
174.1 [X] MSI Aegis 3 8RD Intel Core i7-8700 3.2GHz
GeForce GTX 1070 (Desktop)
min:
151 fps, max:
195 fps
190 [X] Nvidia GeForce GTX 1070 Intel Core i7-6700K 4GHz
GeForce GTX 1070 (Desktop)
min:
167 fps
~ 182 fps
100%
GeForce GTX 1080 Ti:
133 [X] Intel Core i7-4790K 4GHz
GeForce GTX 1080 Ti
min:
121 fps, max:
150 fps
fps
76%
GeForce GTX 1080 Max-Q:
101.4 fps
77%
GeForce GTX 1070 (Desktop):
99.8 [X] MSI Aegis 3 8RD Intel Core i7-8700 3.2GHz
GeForce GTX 1070 (Desktop)
min:
86 fps, max:
112 fps
104 [X] Nvidia GeForce GTX 1070 Intel Core i7-6700K 4GHz
GeForce GTX 1070 (Desktop)
min:
90 fps
~ 102 fps
100%
GeForce GTX 1080 Ti:
125 [X] Intel Core i7-4790K 4GHz
GeForce GTX 1080 Ti
min:
113 fps, max:
139 fps
fps
73%
GeForce GTX 1080 Max-Q:
86.7 90 [X] Asus Zephyrus GX501 Intel Core i7-7700HQ 2.8GHz
GeForce GTX 1080 Max-Q
min:
82 fps, max:
102 fps
92.1 94.9 ~ 91 fps
75%
GeForce GTX 1070 (Desktop):
92 [X] MSI Aegis 3 8RD Intel Core i7-8700 3.2GHz
GeForce GTX 1070 (Desktop)
min:
80 fps, max:
104 fps
95.4 [X] Nvidia GeForce GTX 1070 Intel Core i7-6700K 4GHz
GeForce GTX 1070 (Desktop)
min:
83 fps
~ 94 fps
100%
GeForce GTX 1080 Ti:
70.3 [X] Intel Core i7-4790K 4GHz
GeForce GTX 1080 Ti
min:
62 fps, max:
78 fps
fps
77%
GeForce GTX 1080 Max-Q:
51.9 54.5 54.6 54.9 [X] Asus Zephyrus GX501 Intel Core i7-7700HQ 2.8GHz
GeForce GTX 1080 Max-Q
min:
41 fps, max:
63 fps
~ 54 fps
74%
GeForce GTX 1070 (Desktop):
50.2 [X] Intel Core i7-4790K 4GHz
GeForce GTX 1070 (Desktop)
min:
43 fps, max:
58 fps
51.1 [X] GTX 1070 Founders Edition Asus X299 Prime Intel Core i7-7740X 4.3GHz
GeForce GTX 1070 (Desktop)
min:
44 fps, max:
56 fps
53.2 [X] MSI Aegis 3 8RD Intel Core i7-8700 3.2GHz
GeForce GTX 1070 (Desktop)
min:
48 fps, max:
60 fps
53.8 [X] Nvidia GeForce GTX 1070 Intel Core i7-6700K 4GHz
GeForce GTX 1070 (Desktop)
min:
47 fps
~ 52 fps
100%
GeForce GTX 1080 Ti:
52.2 [X] Intel Core i7-4790K 4GHz
GeForce GTX 1080 Ti
min:
41 fps, max:
58 fps
fps
65%
GeForce GTX 1080 Max-Q:
34.1 fps
65%
GeForce GTX 1070 (Desktop):
32 [X] Intel Core i7-4790K 4GHz
GeForce GTX 1070 (Desktop)
min:
24 fps, max:
37 fps
32.2 [X] GTX 1070 Founders Edition Asus X299 Prime Intel Core i7-7740X 4.3GHz
GeForce GTX 1070 (Desktop)
min:
24 fps, max:
37 fps
34.4 [X] MSI Aegis 3 8RD Intel Core i7-8700 3.2GHz
GeForce GTX 1070 (Desktop)
min:
27 fps, max:
39 fps
35.4 [X] Nvidia GeForce GTX 1070 Intel Core i7-6700K 4GHz
GeForce GTX 1070 (Desktop)
min:
27 fps
~ 34 fps
100%
GeForce GTX 1080 Ti:
155 [X] Intel Core i9-7900X 3.3GHz
GeForce GTX 1080 Ti
min:
129 fps, max:
180 fps
161 [X] i7-6950X Asus X99-E Intel Core i7-6950X 3GHz
GeForce GTX 1080 Ti
min:
125 fps, max:
187 fps
166 [X] Nvidia GeForce GTX 1080 Ti Founders Edition Asus Crosshair VI Hero AMD Ryzen 5 1400 3.2GHz
GeForce GTX 1080 Ti
min:
110 fps, max:
220 fps
173 [X] AMD Ryzen 3 1200 3.1GHz
GeForce GTX 1080 Ti
min:
126 fps, max:
242 fps
184 [X] AMD Ryzen 3 1300X 3.5GHz
GeForce GTX 1080 Ti
min:
129 fps, max:
262 fps
185 [X] AMD Ryzen 7 1700X 3.4GHz
GeForce GTX 1080 Ti
min:
149 fps, max:
230 fps
191 [X] AMD Ryzen 7 1800X 3.6GHz
GeForce GTX 1080 Ti
min:
134 fps, max:
240 fps
198 [X] AMD Ryzen 7 1700 3GHz
GeForce GTX 1080 Ti
min:
162 fps, max:
240 fps
208 [X] Nvidia GeForce GTX 1080 Ti FE Asus Prime B350-PLUS AMD Ryzen 7 1700 3GHz
GeForce GTX 1080 Ti
min:
159 fps, max:
273 fps
224 [X] i7-5960X Asus X99-E Intel Core i7-5960X 3GHz
GeForce GTX 1080 Ti
min:
168 fps, max:
283 fps
230 [X] Nvidia GeForce GTX 1080 Ti FE Asus Prime B350-PLUS AMD Ryzen 7 1800X 3.6GHz
GeForce GTX 1080 Ti
min:
187 fps, max:
300 fps
233 [X] AMD Ryzen 5 1400 3.2GHz
GeForce GTX 1080 Ti
min:
145 fps, max:
317 fps
250 [X] AMD Ryzen 5 1600 3.2GHz
GeForce GTX 1080 Ti
min:
187 fps, max:
317 fps
252 [X] no SMT
AMD Ryzen 7 1800X 3.6GHz
GeForce GTX 1080 Ti
min:
180 fps, max:
350 fps
263 [X] i5-7600K Gigabyte Z270-Gaming K3 Intel Core i5-7600K 3.8GHz
GeForce GTX 1080 Ti
min:
17 fps, max:
383 fps
271 [X] 1500X Nvidia GeForce GTX 1080 Ti FE Asus Prime B350-PLUS AMD Ryzen 5 1500X 3.5GHz
GeForce GTX 1080 Ti
min:
193 fps, max:
400 fps
286 [X] Intel Core i5-8400 2.8GHz
GeForce GTX 1080 Ti
min:
141 fps, max:
414 fps
318 [X] Intel Core i7-4790K 4GHz
GeForce GTX 1080 Ti
min:
198 fps, max:
467 fps
328 [X] Intel Core i7-8700K 3.7GHz
GeForce GTX 1080 Ti
min:
184 fps, max:
429 fps
333 [X] i7-7700K Gigabyte Z270-Gaming K3 Intel Core i7-7700K 4.2GHz
GeForce GTX 1080 Ti
min:
184 fps, max:
467 fps
347 [X] Intel Core i7-7740X 4.3GHz
GeForce GTX 1080 Ti
min:
240 fps, max:
500 fps
~ 236 fps
97%
GeForce GTX 1080 Max-Q:
229.6 fps
127%
GeForce GTX 1070 (Desktop):
298.6 [X] MSI Aegis 3 8RD Intel Core i7-8700 3.2GHz
GeForce GTX 1070 (Desktop)
min:
82.4 fps, max:
446.3 fps
302 [X] Nvidia GeForce GTX 1070 Intel Core i7-6700K 4GHz
GeForce GTX 1070 (Desktop)
min:
170 fps
~ 300 fps
100%
GeForce GTX 1080 Ti:
161 [X] i7-6950X Asus X99-E Intel Core i7-6950X 3GHz
GeForce GTX 1080 Ti
min:
47 fps, max:
187 fps
184 [X] AMD Ryzen 7 1700X 3.4GHz
GeForce GTX 1080 Ti
min:
154 fps, max:
230 fps
195 [X] AMD Ryzen 7 1700 3GHz
GeForce GTX 1080 Ti
min:
154 fps, max:
240 fps
217 [X] AMD Ryzen 7 1800X 3.6GHz
GeForce GTX 1080 Ti
min:
167 fps, max:
300 fps
231 [X] i5-7600K Gigabyte Z270-Gaming K3 Intel Core i5-7600K 3.8GHz
GeForce GTX 1080 Ti
min:
36 fps, max:
323 fps
239 [X] Intel Core i7-4790K 4GHz
GeForce GTX 1080 Ti
min:
143 fps, max:
317 fps
251 [X] i7-7700K Gigabyte Z270-Gaming K3 Intel Core i7-7700K 4.2GHz
GeForce GTX 1080 Ti
min:
31 fps, max:
340 fps
~ 211 fps
76%
GeForce GTX 1080 Max-Q:
161.2 fps
75%
GeForce GTX 1070 (Desktop):
151.7 [X] MSI Aegis 3 8RD Intel Core i7-8700 3.2GHz
GeForce GTX 1070 (Desktop)
min:
123 fps, max:
181 fps
166 [X] Nvidia GeForce GTX 1070 Intel Core i7-6700K 4GHz
GeForce GTX 1070 (Desktop)
min:
129 fps
~ 159 fps
100%
GeForce GTX 1080 Ti:
184 [X] AMD Ryzen 7 1700X 3.4GHz
GeForce GTX 1080 Ti
min:
147 fps, max:
230 fps
194 [X] AMD Ryzen 7 1700 3GHz
GeForce GTX 1080 Ti
min:
149 fps, max:
240 fps
211 [X] AMD Ryzen 7 1800X 3.6GHz
GeForce GTX 1080 Ti
min:
159 fps, max:
290 fps
223 [X] i5-7600K Gigabyte Z270-Gaming K3 Intel Core i5-7600K 3.8GHz
GeForce GTX 1080 Ti
min:
121 fps, max:
307 fps
229 [X] Intel Core i7-4790K 4GHz
GeForce GTX 1080 Ti
min:
182 fps, max:
317 fps
240 [X] i7-7700K Gigabyte Z270-Gaming K3 Intel Core i7-7700K 4.2GHz
GeForce GTX 1080 Ti
min:
126 fps, max:
307 fps
~ 214 fps
70%
GeForce GTX 1070 (Desktop):
143.4 [X] MSI Aegis 3 8RD Intel Core i7-8700 3.2GHz
GeForce GTX 1070 (Desktop)
min:
61 fps, max:
174.1 fps
157 [X] Nvidia GeForce GTX 1070 Intel Core i7-6700K 4GHz
GeForce GTX 1070 (Desktop)
min:
117 fps
~ 150 fps
100%
GeForce GTX 1080 Ti:
172 [X] AMD Ryzen 7 1700X 3.4GHz
GeForce GTX 1080 Ti
min:
136 fps, max:
213 fps
173 [X] Intel Core i7-4790K 4GHz
GeForce GTX 1080 Ti
min:
115 fps, max:
240 fps
174 [X] AMD Ryzen 7 1800X 3.6GHz
GeForce GTX 1080 Ti
min:
132 fps, max:
240 fps
174 [X] AMD Ryzen 7 1700 3GHz
GeForce GTX 1080 Ti
min:
136 fps, max:
220 fps
178 [X] i5-7600K Gigabyte Z270-Gaming K3 Intel Core i5-7600K 3.8GHz
GeForce GTX 1080 Ti
min:
129 fps, max:
257 fps
179 [X] i7-7700K Gigabyte Z270-Gaming K3 Intel Core i7-7700K 4.2GHz
GeForce GTX 1080 Ti
min:
139 fps, max:
250 fps
~ 175 fps
65%
GeForce GTX 1070 (Desktop):
111 [X] Intel Core i7-4790K 4GHz
GeForce GTX 1070 (Desktop)
min:
50 fps, max:
148 fps
115 [X] Nvidia GeForce GTX 1070 Intel Core i7-6700K 4GHz
GeForce GTX 1070 (Desktop)
min:
74 fps
115.7 [X] MSI Aegis 3 8RD Intel Core i7-8700 3.2GHz
GeForce GTX 1070 (Desktop)
min:
87 fps, max:
149 fps
~ 114 fps
100%
GeForce GTX 1080 Ti:
76 [X] i7-5960X Asus X99-E Intel Core i7-5960X 3GHz
GeForce GTX 1080 Ti
min:
30 fps, max:
107 fps
77 [X] Intel Core i7-4790K 4GHz
GeForce GTX 1080 Ti
min:
58 fps, max:
131 fps
77 [X] Nvidia GeForce GTX 1080 Ti Founders Edition Asus Crosshair VI Hero AMD Ryzen 5 1400 3.2GHz
GeForce GTX 1080 Ti
min:
63 fps, max:
91 fps
77 [X] Nvidia GeForce GTX 1080 Ti FE Asus Prime B350-PLUS AMD Ryzen 7 1800X 3.6GHz
GeForce GTX 1080 Ti
min:
62 fps, max:
91 fps
77.1 [X] AMD Ryzen 5 1600 3.2GHz
GeForce GTX 1080 Ti
min:
62 fps, max:
89 fps
77.3 [X] Intel Core i7-8700K 3.7GHz
GeForce GTX 1080 Ti
min:
63 fps, max:
97 fps
77.4 [X] AMD Ryzen 3 1300X 3.5GHz
GeForce GTX 1080 Ti
min:
56 fps, max:
90 fps
77.6 [X] AMD Ryzen 5 1400 3.2GHz
GeForce GTX 1080 Ti
min:
63 fps, max:
91 fps
77.6 [X] Intel Core i5-8400 2.8GHz
GeForce GTX 1080 Ti
min:
60 fps, max:
100 fps
77.7 [X] AMD Ryzen 7 1700 3GHz
GeForce GTX 1080 Ti
min:
63 fps, max:
91 fps
77.7 [X] AMD Ryzen 3 1200 3.1GHz
GeForce GTX 1080 Ti
min:
63 fps, max:
90 fps
77.8 [X] 1500X Nvidia GeForce GTX 1080 Ti FE Asus Prime B350-PLUS AMD Ryzen 5 1500X 3.5GHz
GeForce GTX 1080 Ti
min:
63 fps, max:
89 fps
77.9 [X] i5-7600K Gigabyte Z270-Gaming K3 Intel Core i5-7600K 3.8GHz
GeForce GTX 1080 Ti
min:
23 fps, max:
105 fps
78 [X] i7-6950X Asus X99-E Intel Core i7-6950X 3GHz
GeForce GTX 1080 Ti
min:
50 fps, max:
93 fps
78 [X] Nvidia GeForce GTX 1080 Ti FE Asus Prime B350-PLUS AMD Ryzen 7 1700 3GHz
GeForce GTX 1080 Ti
min:
63 fps, max:
91 fps
78 [X] Intel Core i9-7900X 3.3GHz
GeForce GTX 1080 Ti
min:
62 fps, max:
105 fps
78.1 [X] AMD Ryzen 7 1800X 3.6GHz
GeForce GTX 1080 Ti
min:
63 fps, max:
91 fps
78.2 [X] AMD Ryzen 7 1700X 3.4GHz
GeForce GTX 1080 Ti
min:
63 fps, max:
91 fps
79 [X] i7-7700K Gigabyte Z270-Gaming K3 Intel Core i7-7700K 4.2GHz
GeForce GTX 1080 Ti
min:
46 fps, max:
117 fps
79 [X] Intel Core i7-7740X 4.3GHz
GeForce GTX 1080 Ti
min:
63 fps, max:
135 fps
~ 78 fps
61%
GeForce GTX 1080 Max-Q:
47.9 fps
60%
GeForce GTX 1070 (Desktop):
43.9 [X] Intel Core i7-4790K 4GHz
GeForce GTX 1070 (Desktop)
min:
36 fps, max:
56 fps
47 [X] MSI Aegis 3 8RD Intel Core i7-8700 3.2GHz
GeForce GTX 1070 (Desktop)
min:
37 fps, max:
56 fps
49.5 [X] Nvidia GeForce GTX 1070 Intel Core i7-6700K 4GHz
GeForce GTX 1070 (Desktop)
min:
31 fps
~ 47 fps
GeForce GTX 1070 (Desktop):
517 [X] Nvidia GeForce GTX 1070 Intel Core i7-6700K 4GHz
GeForce GTX 1070 (Desktop)
min:
455 fps
fps
GeForce GTX 1070 (Desktop):
281 [X] Nvidia GeForce GTX 1070 Intel Core i7-6700K 4GHz
GeForce GTX 1070 (Desktop)
min:
244 fps
fps
GeForce GTX 1080 Max-Q:
166 171 ~ 169 fps
GeForce GTX 1070 (Desktop):
171 [X] Nvidia GeForce GTX 1070 Intel Core i7-6700K 4GHz
GeForce GTX 1070 (Desktop)
min:
144 fps
fps
100%
GeForce GTX 1080 Ti:
222 [X] Intel Core i7-4790K 4GHz
GeForce GTX 1080 Ti
min:
190 fps, max:
257 fps
fps
64%
GeForce GTX 1080 Max-Q:
140 142 ~ 141 fps
64%
GeForce GTX 1070 (Desktop):
141 [X] Nvidia GeForce GTX 1070 Intel Core i7-6700K 4GHz
GeForce GTX 1070 (Desktop)
min:
124 fps
fps
100%
GeForce GTX 1080 Ti:
76 [X] Intel Core i7-4790K 4GHz
GeForce GTX 1080 Ti
min:
62 fps, max:
87 fps
fps
62%
GeForce GTX 1080 Max-Q:
47.4 fps
64%
GeForce GTX 1070 (Desktop):
48.7 [X] Nvidia GeForce GTX 1070 Intel Core i7-6700K 4GHz
GeForce GTX 1070 (Desktop)
min:
40 fps
fps
GeForce GTX 1070 (Desktop):
166.5 [X] MSI Aegis 3 8RD Intel Core i7-8700 3.2GHz
GeForce GTX 1070 (Desktop)
min:
113 fps, max:
209 fps
fps
GeForce GTX 1070 (Desktop):
120.8 [X] MSI Aegis 3 8RD Intel Core i7-8700 3.2GHz
GeForce GTX 1070 (Desktop)
min:
96 fps, max:
137 fps
fps
GeForce GTX 1080 Max-Q:
86.7 fps
GeForce GTX 1070 (Desktop):
88.1 [X] MSI Aegis 3 8RD Intel Core i7-8700 3.2GHz
GeForce GTX 1070 (Desktop)
min:
74 fps, max:
99 fps
95.3 [X] Intel Core i7-4790K 4GHz
GeForce GTX 1070 (Desktop)
min:
77 fps, max:
107 fps
~ 92 fps
100%
GeForce GTX 1080 Ti:
93 [X] Intel Core i7-4790K 4GHz
GeForce GTX 1080 Ti
min:
71 fps, max:
107 fps
fps
72%
GeForce GTX 1080 Max-Q:
66.7 fps
69%
GeForce GTX 1070 (Desktop):
63.3 [X] Intel Core i7-4790K 4GHz
GeForce GTX 1070 (Desktop)
min:
51 fps, max:
76 fps
64 [X] MSI Aegis 3 8RD Intel Core i7-8700 3.2GHz
GeForce GTX 1070 (Desktop)
min:
53 fps, max:
72 fps
~ 64 fps
100%
GeForce GTX 1080 Ti:
56.1 [X] Intel Core i7-4790K 4GHz
GeForce GTX 1080 Ti
min:
50 fps, max:
62 fps
fps
62%
GeForce GTX 1080 Max-Q:
34.9 fps
62%
GeForce GTX 1070 (Desktop):
33.8 [X] MSI Aegis 3 8RD Intel Core i7-8700 3.2GHz
GeForce GTX 1070 (Desktop)
min:
30 fps, max:
38 fps
37.1 [X] Intel Core i7-4790K 4GHz
GeForce GTX 1070 (Desktop)
min:
33 fps, max:
41 fps
~ 35 fps
GeForce GTX 1070 (Desktop):
118.8 [X] MSI Aegis 3 8RD Intel Core i7-8700 3.2GHz
GeForce GTX 1070 (Desktop)
min:
104 fps, max:
120 fps
fps
GeForce GTX 1070 (Desktop):
118.4 [X] MSI Aegis 3 8RD Intel Core i7-8700 3.2GHz
GeForce GTX 1070 (Desktop)
min:
108 fps, max:
120 fps
fps
GeForce GTX 1080 Max-Q:
78.2 fps
GeForce GTX 1070 (Desktop):
91 [X] Intel Core i7-4790K 4GHz
GeForce GTX 1070 (Desktop)
min:
57 fps, max:
118 fps
111.4 [X] MSI Aegis 3 8RD Intel Core i7-8700 3.2GHz
GeForce GTX 1070 (Desktop)
min:
75 fps, max:
120 fps
~ 101 fps
100%
GeForce GTX 1080 Ti:
99 [X] Intel Core i7-4790K 4GHz
GeForce GTX 1080 Ti
min:
70 fps, max:
118 fps
fps
67%
GeForce GTX 1080 Max-Q:
66.5 fps
93%
GeForce GTX 1070 (Desktop):
81 [X] Intel Core i7-4790K 4GHz
GeForce GTX 1070 (Desktop)
min:
51 fps, max:
109 fps
102.1 [X] MSI Aegis 3 8RD Intel Core i7-8700 3.2GHz
GeForce GTX 1070 (Desktop)
min:
70 fps, max:
120 fps
~ 92 fps
100%
GeForce GTX 1080 Ti:
72 [X] Intel Core i7-4790K 4GHz
GeForce GTX 1080 Ti
min:
58 fps, max:
83 fps
fps
60%
GeForce GTX 1080 Max-Q:
43.4 fps
58%
GeForce GTX 1070 (Desktop):
38.4 [X] Intel Core i7-4790K 4GHz
GeForce GTX 1070 (Desktop)
min:
32 fps, max:
44 fps
45.2 [X] MSI Aegis 3 8RD Intel Core i7-8700 3.2GHz
GeForce GTX 1070 (Desktop)
min:
18 fps, max:
54 fps
~ 42 fps
100%
GeForce GTX 1080 Ti:
125 [X] Intel Core i7-4790K 4GHz
GeForce GTX 1080 Ti
min:
120 fps, max:
127 fps
fps
98%
GeForce GTX 1080 Max-Q:
123 fps
GeForce GTX 1080 Max-Q:
118 fps
GeForce GTX 1070 (Desktop):
119 [X] Intel Core i7-4790K 4GHz
GeForce GTX 1070 (Desktop)
min:
101 fps, max:
127 fps
fps
100%
GeForce GTX 1080 Ti:
99 [X] Intel Core i7-4790K 4GHz
GeForce GTX 1080 Ti
min:
75 fps, max:
127 fps
fps
64%
GeForce GTX 1080 Max-Q:
63.7 fps
66%
GeForce GTX 1070 (Desktop):
65.4 [X] Intel Core i7-4790K 4GHz
GeForce GTX 1070 (Desktop)
min:
46 fps, max:
96 fps
fps
GeForce GTX 1080 Max-Q:
131 fps
100%
GeForce GTX 1080 Ti:
144 [X] Intel Core i7-4790K 4GHz
GeForce GTX 1080 Ti
fps
78%
GeForce GTX 1080 Max-Q:
113 fps
85%
GeForce GTX 1070 (Desktop):
122 [X] Intel Core i7-4790K 4GHz
GeForce GTX 1070 (Desktop)
min:
103 fps, max:
145 fps
fps
100%
GeForce GTX 1080 Ti:
78 [X] Intel Core i7-4790K 4GHz
GeForce GTX 1080 Ti
fps
60%
GeForce GTX 1080 Max-Q:
46.6 fps
59%
GeForce GTX 1070 (Desktop):
45.8 [X] Intel Core i7-4790K 4GHz
GeForce GTX 1070 (Desktop)
min:
37 fps, max:
56 fps
fps
100%
GeForce GTX 1080 Ti:
238 [X] Intel Core i7-4790K 4GHz
GeForce GTX 1080 Ti
min:
228 fps, max:
250 fps
fps
82%
GeForce GTX 1080 Max-Q:
195 fps
98%
GeForce GTX 1070 (Desktop):
233 [X] Intel Core i7-4790K 4GHz
GeForce GTX 1070 (Desktop)
min:
224 fps, max:
242 fps
fps
100%
GeForce GTX 1080 Ti:
140 [X] Nvidia GeForce GTX 1080 Ti Founders Edition Asus Crosshair VI Hero AMD Ryzen 5 1400 3.2GHz
GeForce GTX 1080 Ti
min:
136 fps, max:
145 fps
160 [X] AMD Ryzen 7 1700 3GHz
GeForce GTX 1080 Ti
min:
149 fps, max:
171 fps
162 [X] AMD Ryzen 7 1700X 3.4GHz
GeForce GTX 1080 Ti
min:
155 fps, max:
171 fps
162 [X] AMD Ryzen 3 1200 3.1GHz
GeForce GTX 1080 Ti
min:
157 fps, max:
167 fps
170 [X] AMD Ryzen 7 1800X 3.6GHz
GeForce GTX 1080 Ti
min:
163 fps, max:
179 fps
170 [X] AMD Ryzen 5 1400 3.2GHz
GeForce GTX 1080 Ti
min:
164 fps, max:
177 fps
172 [X] no SMT
AMD Ryzen 7 1700 3GHz
GeForce GTX 1080 Ti
173 [X] AMD Ryzen 3 1300X 3.5GHz
GeForce GTX 1080 Ti
min:
155 fps, max:
180 fps
181 [X] Nvidia GeForce GTX 1080 Ti FE Asus Prime B350-PLUS AMD Ryzen 7 1700 3GHz
GeForce GTX 1080 Ti
min:
172 fps, max:
189 fps
188 [X] no SMT
AMD Ryzen 7 1800X 3.6GHz
GeForce GTX 1080 Ti
min:
182 fps, max:
199 fps
188 [X] AMD Ryzen 5 1600 3.2GHz
GeForce GTX 1080 Ti
min:
177 fps, max:
194 fps
191 [X] i7-5960X Asus X99-E Intel Core i7-5960X 3GHz
GeForce GTX 1080 Ti
min:
175 fps, max:
228 fps
191 [X] Nvidia GeForce GTX 1080 Ti FE Asus Prime B350-PLUS AMD Ryzen 7 1800X 3.6GHz
GeForce GTX 1080 Ti
min:
180 fps, max:
203 fps
192 [X] Intel Core i5-8400 2.8GHz
GeForce GTX 1080 Ti
min:
178 fps, max:
231 fps
194 [X] Intel Core i7-8700K 3.7GHz
GeForce GTX 1080 Ti
min:
179 fps, max:
234 fps
195 [X] 1500X Nvidia GeForce GTX 1080 Ti FE Asus Prime B350-PLUS AMD Ryzen 5 1500X 3.5GHz
GeForce GTX 1080 Ti
min:
188 fps, max:
203 fps
201 [X] Intel Core i9-7900X 3.3GHz
GeForce GTX 1080 Ti
min:
186 fps, max:
242 fps
204 [X] Intel Core i7-4790K 4GHz
GeForce GTX 1080 Ti
min:
190 fps, max:
250 fps
204 [X] i7-7700K Gigabyte Z270-Gaming K3 Intel Core i7-7700K 4.2GHz
GeForce GTX 1080 Ti
min:
188 fps, max:
248 fps
205 [X] i5-7600K Gigabyte Z270-Gaming K3 Intel Core i5-7600K 3.8GHz
GeForce GTX 1080 Ti
min:
191 fps, max:
241 fps
211 [X] i7-6950X Asus X99-E Intel Core i7-6950X 3GHz
GeForce GTX 1080 Ti
min:
195 fps, max:
258 fps
213 [X] Intel Core i7-7740X 4.3GHz
GeForce GTX 1080 Ti
min:
195 fps, max:
262 fps
~ 185 fps
68%
GeForce GTX 1080 Max-Q:
126 fps
68%
GeForce GTX 1070 (Desktop):
126 [X] Intel Core i7-4790K 4GHz
GeForce GTX 1070 (Desktop)
min:
117 fps, max:
157 fps
fps
100%
GeForce GTX 1080 Ti:
200 [X] DX11
Intel Core i7-4790K 4GHz
GeForce GTX 1080 Ti
min:
197 fps, max:
201 fps
fps
96%
GeForce GTX 1070 (Desktop):
184.2 [X] MSI Aegis 3 8RD Intel Core i7-8700 3.2GHz
GeForce GTX 1070 (Desktop)
min:
135 fps, max:
199 fps
200 [X] Intel Core i7-4790K 4GHz
GeForce GTX 1070 (Desktop)
min:
197 fps, max:
201 fps
~ 192 fps
100%
GeForce GTX 1080 Ti:
196 [X] DX11
Intel Core i7-4790K 4GHz
GeForce GTX 1080 Ti
min:
184 fps, max:
201 fps
fps
92%
GeForce GTX 1070 (Desktop):
164.2 [X] MSI Aegis 3 8RD Intel Core i7-8700 3.2GHz
GeForce GTX 1070 (Desktop)
min:
143 fps, max:
177 fps
195 [X] Intel Core i7-4790K 4GHz
GeForce GTX 1070 (Desktop)
min:
184 fps, max:
201 fps
~ 180 fps
100%
GeForce GTX 1080 Ti:
169 [X] DX11
Intel Core i7-4790K 4GHz
GeForce GTX 1080 Ti
min:
146 fps, max:
177 fps
fps
77%
GeForce GTX 1080 Max-Q:
130 fps
81%
GeForce GTX 1070 (Desktop):
134.5 [X] MSI Aegis 3 8RD Intel Core i7-8700 3.2GHz
GeForce GTX 1070 (Desktop)
min:
118 fps, max:
145 fps
139 [X] Intel Core i7-4790K 4GHz
GeForce GTX 1070 (Desktop)
min:
129 fps, max:
146 fps
~ 137 fps
100%
GeForce GTX 1080 Ti:
158 [X] DX11
Intel Core i7-4790K 4GHz
GeForce GTX 1080 Ti
min:
141 fps, max:
166 fps
fps
72%
GeForce GTX 1080 Max-Q:
113 fps
77%
GeForce GTX 1070 (Desktop):
122 [X] Intel Core i7-4790K 4GHz
GeForce GTX 1070 (Desktop)
min:
106 fps, max:
129 fps
122.1 [X] MSI Aegis 3 8RD Intel Core i7-8700 3.2GHz
GeForce GTX 1070 (Desktop)
min:
108 fps, max:
131 fps
~ 122 fps
100%
GeForce GTX 1080 Ti:
76.7 [X] DX12
Intel Core i7-4790K 4GHz
GeForce GTX 1080 Ti
min:
69 fps, max:
80 fps
fps
64%
GeForce GTX 1080 Max-Q:
49 fps
68%
GeForce GTX 1070 (Desktop):
47.7 [X] MSI Aegis 3 8RD Intel Core i7-8700 3.2GHz
GeForce GTX 1070 (Desktop)
min:
41 fps, max:
51 fps
57.1 [X] Intel Core i7-4790K 4GHz
GeForce GTX 1070 (Desktop)
min:
49 fps, max:
60 fps
~ 52 fps
GeForce GTX 1070 (Desktop):
90.1 [X] Nvidia GeForce GTX 1070 Intel Core i7-6700K 4GHz
GeForce GTX 1070 (Desktop)
min:
75 fps
fps
GeForce GTX 1070 (Desktop):
73.7 [X] Nvidia GeForce GTX 1070 Intel Core i7-6700K 4GHz
GeForce GTX 1070 (Desktop)
min:
61 fps
fps
GeForce GTX 1070 (Desktop):
66.2 [X] Nvidia GeForce GTX 1070 Intel Core i7-6700K 4GHz
GeForce GTX 1070 (Desktop)
min:
54 fps
fps
100%
GeForce GTX 1080 Ti:
88 [X] DX12
Intel Core i7-4790K 4GHz
GeForce GTX 1080 Ti
min:
67 fps, max:
155 fps
93 [X] DX11
Intel Core i7-4790K 4GHz
GeForce GTX 1080 Ti
min:
71 fps, max:
169 fps
~ 91 fps
73%
GeForce GTX 1070 (Desktop):
66.7 [X] Nvidia GeForce GTX 1070 Intel Core i7-6700K 4GHz
GeForce GTX 1070 (Desktop)
min:
54 fps
fps
100%
GeForce GTX 1080 Ti:
88 [X] DX12
Intel Core i7-4790K 4GHz
GeForce GTX 1080 Ti
min:
68 fps, max:
153 fps
91 [X] DX11
Intel Core i7-4790K 4GHz
GeForce GTX 1080 Ti
min:
67 fps, max:
167 fps
~ 90 fps
72%
GeForce GTX 1070 (Desktop):
65.1 [X] Nvidia GeForce GTX 1070 Intel Core i7-6700K 4GHz
GeForce GTX 1070 (Desktop)
min:
52 fps
fps
100%
GeForce GTX 1080 Ti:
91 [X] Intel Core i7-4790K 4GHz
GeForce GTX 1080 Ti
min:
73 fps, max:
112 fps
fps
56%
GeForce GTX 1070 (Desktop):
50.6 [X] Intel Core i7-4790K 4GHz
GeForce GTX 1070 (Desktop)
min:
46 fps, max:
56 fps
fps
100%
GeForce GTX 1080 Ti:
36.7 [X] Intel Core i7-4790K 4GHz
GeForce GTX 1080 Ti
min:
34 fps, max:
40 fps
fps
60%
GeForce GTX 1070 (Desktop):
22.2 [X] Intel Core i7-4790K 4GHz
GeForce GTX 1070 (Desktop)
min:
19 fps, max:
25 fps
fps
GeForce GTX 1080 Max-Q:
0 (!) [X] Asus Zephyrus GX501 Intel Core i7-7700HQ 2.8GHz
GeForce GTX 1080 Max-Q
fps
GeForce GTX 1080 Max-Q:
300 [X] Asus Zephyrus GX501 Intel Core i7-7700HQ 2.8GHz
GeForce GTX 1080 Max-Q
min:
90 fps, max:
128 fps
fps
GeForce GTX 1070 (Desktop):
355 [X] Intel Core i7-4790K 4GHz
GeForce GTX 1070 (Desktop)
min:
318 fps, max:
420 fps
fps
100%
GeForce GTX 1080 Ti:
279 [X] Intel Core i7-4790K 4GHz
GeForce GTX 1080 Ti
fps
64%
GeForce GTX 1080 Max-Q:
178 [X] Asus Zephyrus GX501 Intel Core i7-7700HQ 2.8GHz
GeForce GTX 1080 Max-Q
min:
143 fps, max:
196 fps
fps
66%
GeForce GTX 1070 (Desktop):
183 [X] Intel Core i7-4790K 4GHz
GeForce GTX 1070 (Desktop)
min:
170 fps, max:
189 fps
fps
100%
GeForce GTX 1080 Ti:
102 [X] DX12
AMD Ryzen 7 1700 3GHz
GeForce GTX 1080 Ti
min:
76 fps, max:
146 fps
105 [X] DX12
AMD Ryzen 7 1800X 3.6GHz
GeForce GTX 1080 Ti
min:
78 fps, max:
146 fps
121 [X] DX12 no SMT
AMD Ryzen 7 1700 3GHz
GeForce GTX 1080 Ti
min:
85 fps, max:
168 fps
124 [X] DX12 no SMT
AMD Ryzen 7 1800X 3.6GHz
GeForce GTX 1080 Ti
min:
92 fps, max:
173 fps
135 [X] i7-5960X Asus X99-E Intel Core i7-5960X 3GHz
GeForce GTX 1080 Ti
min:
101 fps, max:
194 fps
136 [X] i5-7600K Gigabyte Z270-Gaming K3 Intel Core i5-7600K 3.8GHz
GeForce GTX 1080 Ti
min:
97 fps, max:
186 fps
141 [X] i7-6950X Asus X99-E Intel Core i7-6950X 3GHz
GeForce GTX 1080 Ti
min:
103 fps, max:
201 fps
151 [X] Intel Core i7-4790K 4GHz
GeForce GTX 1080 Ti
min:
111 fps, max:
208 fps
157 [X] i7-7700K Gigabyte Z270-Gaming K3 Intel Core i7-7700K 4.2GHz
GeForce GTX 1080 Ti
min:
119 fps, max:
219 fps
~ 130 fps
122%
GeForce GTX 1070 (Desktop):
155 [X] Intel Core i7-4790K 4GHz
GeForce GTX 1070 (Desktop)
min:
111 fps, max:
209 fps
160.7 [X] MSI Aegis 3 8RD Intel Core i7-8700 3.2GHz
GeForce GTX 1070 (Desktop)
min:
113 fps, max:
228 fps
~ 158 fps
100%
GeForce GTX 1080 Ti:
93 [X] DX12
AMD Ryzen 7 1700 3GHz
GeForce GTX 1080 Ti
min:
70 fps, max:
133 fps
108 [X] DX12 no SMT
AMD Ryzen 7 1700 3GHz
GeForce GTX 1080 Ti
min:
79 fps, max:
154 fps
114 [X] DX12 no SMT
AMD Ryzen 7 1800X 3.6GHz
GeForce GTX 1080 Ti
min:
84 fps, max:
159 fps
131 [X] i7-6950X Asus X99-E Intel Core i7-6950X 3GHz
GeForce GTX 1080 Ti
min:
96 fps, max:
189 fps
139 [X] DX12
Intel Core i7-4790K 4GHz
GeForce GTX 1080 Ti
min:
101 fps, max:
199 fps
142 [X] i7-7700K Gigabyte Z270-Gaming K3 Intel Core i7-7700K 4.2GHz
GeForce GTX 1080 Ti
min:
107 fps, max:
200 fps
~ 121 fps
115%
GeForce GTX 1070 (Desktop):
134 [X] Intel Core i7-4790K 4GHz
GeForce GTX 1070 (Desktop)
min:
98 fps, max:
174 fps
144 [X] MSI Aegis 3 8RD Intel Core i7-8700 3.2GHz
GeForce GTX 1070 (Desktop)
min:
99 fps, max:
200 fps
~ 139 fps
100%
GeForce GTX 1080 Ti:
87 [X] DX12
AMD Ryzen 7 1700 3GHz
GeForce GTX 1080 Ti
min:
64 fps, max:
123 fps
98 [X] DX12 no SMT
AMD Ryzen 7 1700 3GHz
GeForce GTX 1080 Ti
min:
71 fps, max:
134 fps
105 [X] DX12 no SMT
AMD Ryzen 7 1800X 3.6GHz
GeForce GTX 1080 Ti
min:
77 fps, max:
142 fps
121 [X] DX12
Intel Core i7-4790K 4GHz
GeForce GTX 1080 Ti
min:
87 fps, max:
165 fps
129 [X] i7-7700K Gigabyte Z270-Gaming K3 Intel Core i7-7700K 4.2GHz
GeForce GTX 1080 Ti
min:
92 fps, max:
170 fps
~ 108 fps
82%
GeForce GTX 1080 Max-Q:
87.3 90.3 [X] Asus Zephyrus GX501 DX11
Intel Core i7-7700HQ 2.8GHz
GeForce GTX 1080 Max-Q
min:
70 fps, max:
114 fps
~ 89 fps
76%
GeForce GTX 1070 (Desktop):
77.5 [X] Intel Core i7-4790K 4GHz
GeForce GTX 1070 (Desktop)
min:
64 fps, max:
95 fps
87.2 [X] MSI Aegis 3 8RD Intel Core i7-8700 3.2GHz
GeForce GTX 1070 (Desktop)
min:
62 fps, max:
110 fps
~ 82 fps
100%
GeForce GTX 1080 Ti:
72.6 [X] DX12 no SMT
AMD Ryzen 7 1700 3GHz
GeForce GTX 1080 Ti
min:
57 fps, max:
92 fps
73 [X] DX12
Intel Core i7-4790K 4GHz
GeForce GTX 1080 Ti
min:
57 fps, max:
94 fps
73.9 [X] DX12
AMD Ryzen 7 1700 3GHz
GeForce GTX 1080 Ti
min:
57 fps, max:
95 fps
73.9 [X] i7-7700K Gigabyte Z270-Gaming K3 Intel Core i7-7700K 4.2GHz
GeForce GTX 1080 Ti
min:
57 fps, max:
93 fps
74.5 [X] DX12 no SMT
AMD Ryzen 7 1800X 3.6GHz
GeForce GTX 1080 Ti
min:
58 fps, max:
94 fps
75.1 [X] i5-7600K Gigabyte Z270-Gaming K3 Intel Core i5-7600K 3.8GHz
GeForce GTX 1080 Ti
min:
58 fps, max:
95 fps
~ 74 fps
66%
GeForce GTX 1080 Max-Q:
47.9 49 [X] Asus Zephyrus GX501 Intel Core i7-7700HQ 2.8GHz
GeForce GTX 1080 Max-Q
min:
38 fps, max:
63 fps
50.4 [X] Asus Zephyrus GX501 DX11
Intel Core i7-7700HQ 2.8GHz
GeForce GTX 1080 Max-Q
min:
39 fps, max:
64 fps
~ 49 fps
72%
GeForce GTX 1070 (Desktop):
43.4 [X] Intel Core i7-4790K 4GHz
GeForce GTX 1070 (Desktop)
min:
34 fps, max:
54 fps
62.9 [X] MSI Aegis 3 8RD Intel Core i7-8700 3.2GHz
GeForce GTX 1070 (Desktop)
min:
47 fps, max:
82 fps
~ 53 fps
100%
GeForce GTX 1080 Ti:
46 [X] DX12
Intel Core i7-4790K 4GHz
GeForce GTX 1080 Ti
min:
40 fps, max:
55 fps
46 [X] DX11
Intel Core i7-4790K 4GHz
GeForce GTX 1080 Ti
min:
39 fps, max:
55 fps
46.8 [X] i7-6950X Asus X99-E Intel Core i7-6950X 3GHz
GeForce GTX 1080 Ti
min:
37 fps, max:
55 fps
47 [X] i7-5960X Asus X99-E Intel Core i7-5960X 3GHz
GeForce GTX 1080 Ti
min:
40 fps, max:
56 fps
47.3 [X] DX12 no SMT
AMD Ryzen 7 1700 3GHz
GeForce GTX 1080 Ti
min:
40 fps, max:
56 fps
47.3 [X] DX 12
AMD Ryzen 7 1800X 3.6GHz
GeForce GTX 1080 Ti
min:
40 fps, max:
56 fps
47.6 [X] i5-7600K Gigabyte Z270-Gaming K3 Intel Core i5-7600K 3.8GHz
GeForce GTX 1080 Ti
min:
40 fps, max:
56 fps
47.7 [X] DX12
AMD Ryzen 7 1700 3GHz
GeForce GTX 1080 Ti
min:
41 fps, max:
56 fps
48.1 [X] i7-7700K Gigabyte Z270-Gaming K3 Intel Core i7-7700K 4.2GHz
GeForce GTX 1080 Ti
min:
41 fps, max:
57 fps
~ 47 fps
64%
GeForce GTX 1080 Max-Q:
29.3 [X] Asus Zephyrus GX501 DX12
Intel Core i7-7700HQ 2.8GHz
GeForce GTX 1080 Max-Q
min:
25 fps, max:
35 fps
29.6 30.6 [X] Asus Zephyrus GX501 DX11
Intel Core i7-7700HQ 2.8GHz
GeForce GTX 1080 Max-Q
min:
26 fps, max:
36 fps
~ 30 fps
60%
GeForce GTX 1070 (Desktop):
26.2 [X] Intel Core i7-4790K 4GHz
GeForce GTX 1070 (Desktop)
min:
23 fps, max:
30 fps
28.3 [X] Intel Core i7-4790K 4GHz
GeForce GTX 1070 (Desktop)
min:
24 fps, max:
34 fps
29.6 [X] MSI Aegis 3 8RD Intel Core i7-8700 3.2GHz
GeForce GTX 1070 (Desktop)
min:
24 fps, max:
35 fps
~ 28 fps
GeForce GTX 1080 Max-Q:
106 fps
GeForce GTX 1070 (Desktop):
114 [X] Intel Core i7-4790K 4GHz
GeForce GTX 1070 (Desktop)
min:
103 fps, max:
124 fps
fps
GeForce GTX 1080 Max-Q:
97.8 fps
GeForce GTX 1070 (Desktop):
101 [X] Intel Core i7-4790K 4GHz
GeForce GTX 1070 (Desktop)
min:
88 fps, max:
108 fps
103 [X] Intel Core i7-4790K 4GHz
GeForce GTX 1070 (Desktop)
min:
93 fps, max:
110 fps
~ 102 fps
GeForce GTX 1080 Max-Q:
38.8 fps
GeForce GTX 1070 (Desktop):
38.2 [X] Intel Core i7-4790K 4GHz
GeForce GTX 1070 (Desktop)
min:
35 fps, max:
41 fps
39.8 [X] Intel Core i7-4790K 4GHz
GeForce GTX 1070 (Desktop)
min:
37 fps, max:
42 fps
~ 39 fps
GeForce GTX 1070 (Desktop):
300 [X] MSI Aegis 3 8RD Intel Core i7-8700 3.2GHz
GeForce GTX 1070 (Desktop)
min:
296 fps, max:
301 fps
fps
GeForce GTX 1070 (Desktop):
297.2 [X] MSI Aegis 3 8RD Intel Core i7-8700 3.2GHz
GeForce GTX 1070 (Desktop)
min:
267 fps, max:
302 fps
fps
GeForce GTX 1070 (Desktop):
266 [X] MSI Gaming Z GeForce GTX 1070 Desktop PC 1.0.5.1
Intel Core i7-4790K 4GHz
GeForce GTX 1070 (Desktop)
min:
218 fps, max:
302 fps
272 [X] 1.0.5.1
Intel Core i7-4790K 4GHz
GeForce GTX 1070 (Desktop)
min:
223 fps, max:
302 fps
279.7 [X] MSI Aegis 3 8RD Intel Core i7-8700 3.2GHz
GeForce GTX 1070 (Desktop)
min:
226 fps, max:
302 fps
~ 273 fps
100%
GeForce GTX 1080 Ti:
263 [X] Intel Core i7-4790K 4GHz
GeForce GTX 1080 Ti
min:
210 fps, max:
302 fps
fps
65%
GeForce GTX 1080 Max-Q:
172 [X] Asus Zephyrus GX501 Intel Core i7-7700HQ 2.8GHz
GeForce GTX 1080 Max-Q
min:
142 fps, max:
207 fps
fps
64%
GeForce GTX 1070 (Desktop):
161 [X] Intel Core i7-4790K 4GHz
GeForce GTX 1070 (Desktop)
min:
135 fps, max:
187 fps
167 [X] MSI Gaming Z GeForce GTX 1070 Desktop PC 1.0.5.1
Intel Core i7-4790K 4GHz
GeForce GTX 1070 (Desktop)
min:
141 fps, max:
198 fps
171 [X] 1.0.5.1
Intel Core i7-4790K 4GHz
GeForce GTX 1070 (Desktop)
min:
144 fps, max:
202 fps
176.8 [X] MSI Aegis 3 8RD Intel Core i7-8700 3.2GHz
GeForce GTX 1070 (Desktop)
min:
142 fps, max:
204 fps
~ 169 fps
100%
GeForce GTX 1080 Ti:
143 [X] Intel Core i7-4790K 4GHz
GeForce GTX 1080 Ti
min:
122 fps, max:
164 fps
fps
57%
GeForce GTX 1070 (Desktop):
60.8 [X] MSI Aegis 3 8RD Intel Core i7-8700 3.2GHz
GeForce GTX 1070 (Desktop)
min:
51 fps, max:
70 fps
85.5 [X] Intel Core i7-4790K 4GHz
GeForce GTX 1070 (Desktop)
min:
74 fps, max:
98 fps
88 [X] MSI Gaming Z GeForce GTX 1070 Desktop PC 1.0.5.1
Intel Core i7-4790K 4GHz
GeForce GTX 1070 (Desktop)
min:
77 fps, max:
101 fps
91 [X] Intel Core i7-4790K 4GHz
GeForce GTX 1070 (Desktop)
min:
78 fps, max:
104 fps
~ 81 fps
GeForce GTX 1080 Max-Q:
134 fps
100%
GeForce GTX 1080 Ti:
162 [X] Intel Core i7-4790K 4GHz
GeForce GTX 1080 Ti
200 [X] Vulkan
Intel Core i7-4790K 4GHz
GeForce GTX 1080 Ti
~ 181 fps
71%
GeForce GTX 1080 Max-Q:
128 fps
73%
GeForce GTX 1070 (Desktop):
130 [X] OGL
Intel Core i7-4790K 4GHz
GeForce GTX 1070 (Desktop)
min:
108 fps, max:
188 fps
134 [X] Intel Core i7-4790K 4GHz
GeForce GTX 1070 (Desktop)
min:
111 fps, max:
173 fps
~ 132 fps
100%
GeForce GTX 1080 Ti:
96 [X] OGL
Intel Core i7-4790K 4GHz
GeForce GTX 1080 Ti
99 [X] Vulkan
Intel Core i7-4790K 4GHz
GeForce GTX 1080 Ti
~ 98 fps
55%
GeForce GTX 1080 Max-Q:
53.9 fps
52%
GeForce GTX 1070 (Desktop):
48.6 [X] Intel Core i7-4790K 4GHz
GeForce GTX 1070 (Desktop)
min:
42 fps, max:
60 fps
52.6 [X] OGL
Intel Core i7-4790K 4GHz
GeForce GTX 1070 (Desktop)
min:
46 fps, max:
66 fps
~ 51 fps
100%
GeForce GTX 1080 Ti:
87.5 [X] Intel Core i7-4790K 4GHz
GeForce GTX 1080 Ti
fps
88%
GeForce GTX 1070 (Desktop):
76.5 [X] Intel Core i7-4790K 4GHz
GeForce GTX 1070 (Desktop)
77.6 [X] Intel Core i7-4790K 4GHz
GeForce GTX 1070 (Desktop)
~ 77 fps
100%
GeForce GTX 1080 Ti:
58.4 [X] Intel Core i7-4790K 4GHz
GeForce GTX 1080 Ti
fps
60%
GeForce GTX 1070 (Desktop):
33 [X] Intel Core i7-4790K 4GHz
GeForce GTX 1070 (Desktop)
36.5 [X] Intel Core i7-4790K 4GHz
GeForce GTX 1070 (Desktop)
~ 35 fps
GeForce GTX 1070 (Desktop):
97 [X] Intel Core i7-4790K 4GHz
GeForce GTX 1070 (Desktop)
min:
70 fps, max:
127 fps
98 [X] Intel Core i7-4790K 4GHz
GeForce GTX 1070 (Desktop)
~ 98 fps
GeForce GTX 1070 (Desktop):
46.9 [X] Intel Core i7-4790K 4GHz
GeForce GTX 1070 (Desktop)
min:
37 fps, max:
56 fps
55 [X] Intel Core i7-4790K 4GHz
GeForce GTX 1070 (Desktop)
min:
43 fps, max:
66 fps
~ 51 fps
100%
GeForce GTX 1080 Ti:
95 [X] DX11
Intel Core i7-4790K 4GHz
GeForce GTX 1080 Ti
min:
69 fps, max:
122 fps
fps
111%
GeForce GTX 1080 Max-Q:
105.3 [X] NVIDIA GeForce GTX 1080 Max-Q (Nvidia Reference GX501) DX12
Intel Core i7-7700HQ 2.8GHz
GeForce GTX 1080 Max-Q
fps
79%
GeForce GTX 1070 (Desktop):
75.2 [X] DX12
Intel Core i7-4790K 4GHz
GeForce GTX 1070 (Desktop)
min:
56 fps, max:
97 fps
75.5 [X] DX 11
Intel Core i7-4790K 4GHz
GeForce GTX 1070 (Desktop)
min:
59 fps, max:
91 fps
~ 75 fps
100%
GeForce GTX 1080 Ti:
70 [X] DX11
Intel Core i7-4790K 4GHz
GeForce GTX 1080 Ti
min:
57 fps, max:
82 fps
72 [X] DX12
Intel Core i7-4790K 4GHz
GeForce GTX 1080 Ti
min:
58 fps, max:
84 fps
~ 71 fps
54%
GeForce GTX 1070 (Desktop):
35.6 [X] DX12
Intel Core i7-4790K 4GHz
GeForce GTX 1070 (Desktop)
min:
30 fps, max:
43 fps
39.8 [X] DX 11
Intel Core i7-4790K 4GHz
GeForce GTX 1070 (Desktop)
min:
33 fps, max:
48 fps
~ 38 fps
100%
GeForce GTX 1080 Ti:
280 [X] Intel Core i7-4790K 4GHz
GeForce GTX 1080 Ti
min:
204 fps, max:
356 fps
fps
88%
GeForce GTX 1070 (Desktop):
245.9 fps
100%
GeForce GTX 1080 Ti:
254 [X] Intel Core i7-4790K 4GHz
GeForce GTX 1080 Ti
min:
190 fps, max:
357 fps
fps
76%
GeForce GTX 1070 (Desktop):
192.1 fps
100%
GeForce GTX 1080 Ti:
160 [X] Intel Core i7-4790K 4GHz
GeForce GTX 1080 Ti
min:
107 fps, max:
217 fps
fps
68%
GeForce GTX 1080 Max-Q:
107 110 [X] Asus Zephyrus GX501 Intel Core i7-7700HQ 2.8GHz
GeForce GTX 1080 Max-Q
min:
74 fps
~ 109 fps
68%
GeForce GTX 1070 (Desktop):
109.3 fps
100%
GeForce GTX 1080 Ti:
130 [X] Intel Core i7-4790K 4GHz
GeForce GTX 1080 Ti
min:
75 fps, max:
180 fps
fps
66%
GeForce GTX 1080 Max-Q:
83.8 85.4 [X] NVIDIA GeForce GTX 1080 Max-Q (Nvidia Reference GX501) DX12, Very High Preset
Intel Core i7-7700HQ 2.8GHz
GeForce GTX 1080 Max-Q
87.8 [X] Asus Zephyrus GX501 Intel Core i7-7700HQ 2.8GHz
GeForce GTX 1080 Max-Q
min:
58 fps
~ 86 fps
65%
GeForce GTX 1070 (Desktop):
80.6 [X] Intel Core i7-4790K 4GHz
GeForce GTX 1070 (Desktop)
min:
41 fps, max:
108 fps
86 [X] Intel Core i7-4790K 4GHz
GeForce GTX 1070 (Desktop)
86.5 ~ 84 fps
100%
GeForce GTX 1080 Ti:
65 [X] Intel Core i7-4790K 4GHz
GeForce GTX 1080 Ti
min:
31 fps, max:
89 fps
fps
65%
GeForce GTX 1080 Max-Q:
40.8 42.5 [X] Asus Zephyrus GX501 Intel Core i7-7700HQ 2.8GHz
GeForce GTX 1080 Max-Q
min:
18 fps, max:
54 fps
~ 42 fps
65%
GeForce GTX 1070 (Desktop):
39.7 [X] Intel Core i7-4790K 4GHz
GeForce GTX 1070 (Desktop)
min:
17 fps, max:
52 fps
42.2 43 [X] Intel Core i7-4790K 4GHz
GeForce GTX 1070 (Desktop)
~ 42 fps
100%
GeForce GTX 1080 Ti:
157 [X] Intel Core i7-4790K 4GHz
GeForce GTX 1080 Ti
min:
116 fps, max:
191 fps
fps
99%
GeForce GTX 1070 (Desktop):
154 [X] MSI Aegis 3 8RD Intel Core i7-8700 3.2GHz
GeForce GTX 1070 (Desktop)
min:
115 fps, max:
181 fps
156 [X] Intel Core i7-4790K 4GHz
GeForce GTX 1070 (Desktop)
min:
112 fps, max:
188 fps
159 [X] Intel Core i7-4790K 4GHz
GeForce GTX 1070 (Desktop)
min:
117 fps, max:
191 fps
~ 156 fps
100%
GeForce GTX 1080 Ti:
136 [X] Intel Core i7-4790K 4GHz
GeForce GTX 1080 Ti
min:
93 fps, max:
173 fps
fps
95%
GeForce GTX 1070 (Desktop):
126 [X] Intel Core i7-4790K 4GHz
GeForce GTX 1070 (Desktop)
min:
102 fps, max:
142 fps
131 [X] Intel Core i7-4790K 4GHz
GeForce GTX 1070 (Desktop)
131 [X] MSI Aegis 3 8RD Intel Core i7-8700 3.2GHz
GeForce GTX 1070 (Desktop)
min:
100 fps, max:
151 fps
~ 129 fps
100%
GeForce GTX 1080 Ti:
129 [X] Intel Core i7-4790K 4GHz
GeForce GTX 1080 Ti
min:
93 fps, max:
154 fps
fps
71%
GeForce GTX 1080 Max-Q:
92 fps
88%
GeForce GTX 1070 (Desktop):
110 [X] Intel Core i7-4790K 4GHz
GeForce GTX 1070 (Desktop)
min:
85 fps, max:
128 fps
116 [X] MSI Aegis 3 8RD Intel Core i7-8700 3.2GHz
GeForce GTX 1070 (Desktop)
min:
85 fps, max:
138 fps
117 [X] Intel Core i7-4790K 4GHz
GeForce GTX 1070 (Desktop)
~ 114 fps
100%
GeForce GTX 1080 Ti:
121 [X] Intel Core i7-4790K 4GHz
GeForce GTX 1080 Ti
min:
81 fps, max:
149 fps
fps
72%
GeForce GTX 1080 Max-Q:
87 fps
77%
GeForce GTX 1070 (Desktop):
90 [X] Intel Core i7-4790K 4GHz
GeForce GTX 1070 (Desktop)
min:
72 fps, max:
105 fps
94 [X] Intel Core i7-4790K 4GHz
GeForce GTX 1070 (Desktop)
min:
75 fps, max:
109 fps
94 [X] MSI Aegis 3 8RD Intel Core i7-8700 3.2GHz
GeForce GTX 1070 (Desktop)
min:
75 fps, max:
111 fps
~ 93 fps
100%
GeForce GTX 1080 Ti:
64 [X] Intel Core i7-4790K 4GHz
GeForce GTX 1080 Ti
min:
59 fps, max:
70 fps
fps
64%
GeForce GTX 1080 Max-Q:
41 fps
63%
GeForce GTX 1070 (Desktop):
38 [X] Intel Core i7-4790K 4GHz
GeForce GTX 1070 (Desktop)
min:
36 fps, max:
42 fps
41 [X] Intel Core i7-4790K 4GHz
GeForce GTX 1070 (Desktop)
min:
38 fps, max:
44 fps
41 [X] MSI Aegis 3 8RD Intel Core i7-8700 3.2GHz
GeForce GTX 1070 (Desktop)
min:
38 fps, max:
44 fps
~ 40 fps
GeForce GTX 1070 (Desktop):
43.4 [X] Intel Core i7-4790K 4GHz
GeForce GTX 1070 (Desktop)
min:
39 fps, max:
47 fps
45 [X] Intel Core i7-4790K 4GHz
GeForce GTX 1070 (Desktop)
~ 44 fps
GeForce GTX 1070 (Desktop):
25.6 [X] Intel Core i7-4790K 4GHz
GeForce GTX 1070 (Desktop)
min:
39 fps, max:
47 fps
27 [X] Intel Core i7-4790K 4GHz
GeForce GTX 1070 (Desktop)
~ 26 fps
GeForce GTX 1070 (Desktop):
271.4 [X] MSI Aegis 3 8RD Intel Core i7-8700 3.2GHz
GeForce GTX 1070 (Desktop)
min:
263 fps, max:
279 fps
fps
GeForce GTX 1070 (Desktop):
195.4 [X] MSI Aegis 3 8RD Intel Core i7-8700 3.2GHz
GeForce GTX 1070 (Desktop)
min:
180 fps, max:
210 fps
fps
100%
GeForce GTX 1080 Ti:
180 [X] DX12
Intel Core i7-4790K 4GHz
GeForce GTX 1080 Ti
min:
165 fps, max:
192 fps
fps
69%
GeForce GTX 1080 Max-Q:
125 fps
66%
GeForce GTX 1070 (Desktop):
119 [X] MSI Aegis 3 8RD Intel Core i7-8700 3.2GHz
GeForce GTX 1070 (Desktop)
min:
108 fps, max:
129 fps
fps
100%
GeForce GTX 1080 Ti:
161 [X] DX12
Intel Core i7-4790K 4GHz
GeForce GTX 1080 Ti
min:
148 fps, max:
173 fps
fps
68%
GeForce GTX 1080 Max-Q:
105 114.2 [X] NVIDIA GeForce GTX 1080 Max-Q (Nvidia Reference GX501) DX12, Very High Preset, FXAA
Intel Core i7-7700HQ 2.8GHz
GeForce GTX 1080 Max-Q
~ 110 fps
61%
GeForce GTX 1070 (Desktop):
94 [X] DX12
Intel Core i7-4790K 4GHz
GeForce GTX 1070 (Desktop)
min:
85 fps, max:
104 fps
99.7 [X] MSI Aegis 3 8RD Intel Core i7-8700 3.2GHz
GeForce GTX 1070 (Desktop)
min:
90 fps, max:
108 fps
102 [X] DX12
Intel Core i7-4790K 4GHz
GeForce GTX 1070 (Desktop)
min:
95 fps, max:
107 fps
~ 99 fps
100%
GeForce GTX 1080 Ti:
68.4 [X] DX12
Intel Core i7-4790K 4GHz
GeForce GTX 1080 Ti
min:
61 fps, max:
75 fps
70.9 [X] DX11
Intel Core i7-4790K 4GHz
GeForce GTX 1080 Ti
min:
63 fps, max:
78 fps
~ 70 fps
62%
GeForce GTX 1080 Max-Q:
43.6 fps
59%
GeForce GTX 1070 (Desktop):
38.9 [X] DX12
Intel Core i7-4790K 4GHz
GeForce GTX 1070 (Desktop)
min:
35 fps, max:
44 fps
42 [X] MSI Aegis 3 8RD Intel Core i7-8700 3.2GHz
GeForce GTX 1070 (Desktop)
min:
38 fps, max:
46 fps
43 [X] DX12
Intel Core i7-4790K 4GHz
GeForce GTX 1070 (Desktop)
min:
39 fps, max:
47 fps
~ 41 fps
100%
GeForce GTX 1080 Ti:
338 [X] Intel Core i7-4790K 4GHz
GeForce GTX 1080 Ti
min:
163 fps, max:
580 fps
fps
98%
GeForce GTX 1070 (Desktop):
322.9 [X] MSI Aegis 3 8RD Intel Core i7-8700 3.2GHz
GeForce GTX 1070 (Desktop)
min:
14 fps, max:
553 fps
334 [X] Intel Core i7-4790K 4GHz
GeForce GTX 1070 (Desktop)
338 [X] Intel Core i7-4790K 4GHz
GeForce GTX 1070 (Desktop)
~ 332 fps
100%
GeForce GTX 1080 Ti:
301 [X] Intel Core i7-4790K 4GHz
GeForce GTX 1080 Ti
min:
148 fps, max:
541 fps
fps
94%
GeForce GTX 1070 (Desktop):
279 [X] Intel Core i7-4790K 4GHz
GeForce GTX 1070 (Desktop)
279.7 [X] MSI Aegis 3 8RD Intel Core i7-8700 3.2GHz
GeForce GTX 1070 (Desktop)
min:
24 fps, max:
502 fps
286 [X] Intel Core i7-4790K 4GHz
GeForce GTX 1070 (Desktop)
~ 282 fps
100%
GeForce GTX 1080 Ti:
274 [X] Intel Core i7-4790K 4GHz
GeForce GTX 1080 Ti
min:
144 fps, max:
474 fps
fps
74%
GeForce GTX 1080 Max-Q:
197 206 [X] Asus Zephyrus GX501 Intel Core i7-7700HQ 2.8GHz
GeForce GTX 1080 Max-Q
min:
122 fps, max:
331 fps
~ 202 fps
76%
GeForce GTX 1070 (Desktop):
205 [X] Intel Core i7-4790K 4GHz
GeForce GTX 1070 (Desktop)
207.2 [X] MSI Aegis 3 8RD Intel Core i7-8700 3.2GHz
GeForce GTX 1070 (Desktop)
min:
83 fps, max:
487 fps
214 [X] Intel Core i7-4790K 4GHz
GeForce GTX 1070 (Desktop)
~ 209 fps
100%
GeForce GTX 1080 Ti:
247 [X] Intel Core i7-4790K 4GHz
GeForce GTX 1080 Ti
min:
125 fps, max:
391 fps
fps
70%
GeForce GTX 1080 Max-Q:
172 176 [X] Asus Zephyrus GX501 Intel Core i7-7700HQ 2.8GHz
GeForce GTX 1080 Max-Q
min:
108 fps, max:
270 fps
~ 174 fps
74%
GeForce GTX 1070 (Desktop):
176 [X] Intel Core i7-4790K 4GHz
GeForce GTX 1070 (Desktop)
min:
115 fps, max:
279 fps
178 [X] GTX 1070 Founders Edition Asus X299 Prime Intel Core i7-7740X 4.3GHz
GeForce GTX 1070 (Desktop)
min:
53 fps, max:
296 fps
185 [X] Intel Core i7-4790K 4GHz
GeForce GTX 1070 (Desktop)
min:
121 fps
189 [X] MSI Aegis 3 8RD Intel Core i7-8700 3.2GHz
GeForce GTX 1070 (Desktop)
min:
96 fps, max:
471 fps
~ 182 fps
100%
GeForce GTX 1080 Ti:
109 [X] Intel Core i7-4790K 4GHz
GeForce GTX 1080 Ti
min:
74 fps, max:
202 fps
fps
62%
GeForce GTX 1080 Max-Q:
65.7 70 [X] Asus Zephyrus GX501 Intel Core i7-7700HQ 2.8GHz
GeForce GTX 1080 Max-Q
min:
46 fps, max:
141 fps
~ 68 fps
65%
GeForce GTX 1070 (Desktop):
67.4 [X] Intel Core i7-4790K 4GHz
GeForce GTX 1070 (Desktop)
min:
52 fps, max:
88 fps
70 [X] GTX 1070 Founders Edition Asus X299 Prime Intel Core i7-7740X 4.3GHz
GeForce GTX 1070 (Desktop)
min:
45 fps, max:
92 fps
71.4 [X] Intel Core i7-4790K 4GHz
GeForce GTX 1070 (Desktop)
min:
54 fps
74.9 [X] MSI Aegis 3 8RD Intel Core i7-8700 3.2GHz
GeForce GTX 1070 (Desktop)
min:
58 fps, max:
98 fps
~ 71 fps
GeForce GTX 1070 (Desktop):
133 [X] Intel Core i7-4790K 4GHz
GeForce GTX 1070 (Desktop)
min:
118 fps, max:
149 fps
fps
GeForce GTX 1070 (Desktop):
110 [X] Intel Core i7-4790K 4GHz
GeForce GTX 1070 (Desktop)
min:
97 fps, max:
123 fps
118 [X] Intel Core i7-4790K 4GHz
GeForce GTX 1070 (Desktop)
min:
108 fps, max:
131 fps
~ 114 fps
GeForce GTX 1070 (Desktop):
49.6 [X] Intel Core i7-4790K 4GHz
GeForce GTX 1070 (Desktop)
min:
44 fps, max:
53 fps
53.3 [X] Intel Core i7-4790K 4GHz
GeForce GTX 1070 (Desktop)
min:
46 fps, max:
58 fps
~ 51 fps
GeForce GTX 1080 Max-Q:
164 fps
GeForce GTX 1080 Max-Q:
144 fps
GeForce GTX 1070 (Desktop):
140 [X] Intel Core i7-4790K 4GHz
GeForce GTX 1070 (Desktop)
min:
127 fps, max:
163 fps
146 [X] Intel Core i7-4790K 4GHz
GeForce GTX 1070 (Desktop)
min:
124 fps, max:
174 fps
~ 143 fps
GeForce GTX 1080 Max-Q:
55.6 fps
GeForce GTX 1070 (Desktop):
52.7 [X] Intel Core i7-4790K 4GHz
GeForce GTX 1070 (Desktop)
min:
45 fps, max:
63 fps
57 [X] Intel Core i7-4790K 4GHz
GeForce GTX 1070 (Desktop)
min:
49 fps, max:
68 fps
~ 55 fps
GeForce GTX 1080 Max-Q:
74.4 fps
GeForce GTX 1080 Max-Q:
50.3 fps
GeForce GTX 1070 (Desktop):
47.9 [X] Intel Core i7-4790K 4GHz
GeForce GTX 1070 (Desktop)
min:
39 fps, max:
56 fps
51.9 [X] Intel Core i7-4790K 4GHz
GeForce GTX 1070 (Desktop)
min:
43 fps, max:
61 fps
~ 50 fps
GeForce GTX 1080 Max-Q:
40 fps
GeForce GTX 1070 (Desktop):
38 [X] Intel Core i7-4790K 4GHz
GeForce GTX 1070 (Desktop)
min:
35 fps, max:
42 fps
41 [X] Intel Core i7-4790K 4GHz
GeForce GTX 1070 (Desktop)
min:
37 fps, max:
44 fps
~ 40 fps
100%
GeForce GTX 1080 Ti:
149 [X] Intel Core i7-4790K 4GHz
GeForce GTX 1080 Ti
min:
121 fps, max:
211 fps
fps
74%
GeForce GTX 1070 (Desktop):
109 [X] Intel Core i7-4790K 4GHz
GeForce GTX 1070 (Desktop)
113 [X] Intel Core i7-4790K 4GHz
GeForce GTX 1070 (Desktop)
min:
92 fps, max:
145 fps
~ 111 fps
100%
GeForce GTX 1080 Ti:
74 [X] Intel Core i7-4790K 4GHz
GeForce GTX 1080 Ti
min:
58 fps, max:
92 fps
fps
62%
GeForce GTX 1070 (Desktop):
45.2 [X] Intel Core i7-4790K 4GHz
GeForce GTX 1070 (Desktop)
min:
35 fps, max:
55 fps
47.1 [X] Intel Core i7-4790K 4GHz
GeForce GTX 1070 (Desktop)
min:
37 fps, max:
58 fps
~ 46 fps
GeForce GTX 1070 (Desktop):
118 [X] Intel Core i7-4790K 4GHz
GeForce GTX 1070 (Desktop)
min:
101 fps, max:
143 fps
130 [X] Intel Core i7-4790K 4GHz
GeForce GTX 1070 (Desktop)
min:
109 fps, max:
159 fps
~ 124 fps
GeForce GTX 1070 (Desktop):
45.5 [X] Intel Core i7-4790K 4GHz
GeForce GTX 1070 (Desktop)
min:
36 fps, max:
52 fps
50 [X] Intel Core i7-4790K 4GHz
GeForce GTX 1070 (Desktop)
min:
41 fps, max:
57 fps
~ 48 fps
GeForce GTX 1070 (Desktop):
140 [X] Intel Core i7-4790K 4GHz
GeForce GTX 1070 (Desktop)
fps
GeForce GTX 1070 (Desktop):
45 [X] Intel Core i7-4790K 4GHz
GeForce GTX 1070 (Desktop)
49 [X] Intel Core i7-4790K 4GHz
GeForce GTX 1070 (Desktop)
~ 47 fps
GeForce GTX 1070 (Desktop):
54 [X] Intel Core i7-4790K 4GHz
GeForce GTX 1070 (Desktop)
61 [X] Intel Core i7-4790K 4GHz
GeForce GTX 1070 (Desktop)
~ 58 fps
100%
GeForce GTX 1080 Ti:
162 [X] Intel Core i7-4790K 4GHz
GeForce GTX 1080 Ti
min:
99 fps, max:
248 fps
fps
101%
GeForce GTX 1070 (Desktop):
161 [X] Intel Core i7-4790K 4GHz
GeForce GTX 1070 (Desktop)
165 [X] Intel Core i7-4790K 4GHz
GeForce GTX 1070 (Desktop)
min:
100 fps, max:
247 fps
~ 163 fps
100%
GeForce GTX 1080 Ti:
124 [X] Intel Core i7-4790K 4GHz
GeForce GTX 1080 Ti
min:
95 fps, max:
177 fps
fps
81%
GeForce GTX 1070 (Desktop):
100 [X] Intel Core i7-4790K 4GHz
GeForce GTX 1070 (Desktop)
min:
75 fps, max:
142 fps
100 [X] Intel Core i7-4790K 4GHz
GeForce GTX 1070 (Desktop)
min:
53 fps, max:
133 fps
~ 100 fps
GeForce GTX 1070 (Desktop):
60 [X] Intel Core i7-4790K 4GHz
GeForce GTX 1070 (Desktop)
60 [X] Intel Core i7-4790K 4GHz
GeForce GTX 1070 (Desktop)
~ 60 fps
GeForce GTX 1070 (Desktop):
60 [X] Intel Core i7-4790K 4GHz
GeForce GTX 1070 (Desktop)
60 [X] Intel Core i7-4790K 4GHz
GeForce GTX 1070 (Desktop)
~ 60 fps
GeForce GTX 1070 (Desktop):
60 [X] Intel Core i7-4790K 4GHz
GeForce GTX 1070 (Desktop)
60 [X] Intel Core i7-4790K 4GHz
GeForce GTX 1070 (Desktop)
~ 60 fps
GeForce GTX 1070 (Desktop):
60 [X] Intel Core i7-4790K 4GHz
GeForce GTX 1070 (Desktop)
60 [X] Intel Core i7-4790K 4GHz
GeForce GTX 1070 (Desktop)
~ 60 fps
GeForce GTX 1070 (Desktop):
59.9 [X] Intel Core i7-4790K 4GHz
GeForce GTX 1070 (Desktop)
min:
59 fps, max:
61 fps
60 [X] Intel Core i7-4790K 4GHz
GeForce GTX 1070 (Desktop)
min:
59 fps, max:
61 fps
~ 60 fps
GeForce GTX 1070 (Desktop):
181 [X] Intel Core i7-4790K 4GHz
GeForce GTX 1070 (Desktop)
193 [X] Intel Core i7-4790K 4GHz
GeForce GTX 1070 (Desktop)
min:
175 fps, max:
211 fps
~ 187 fps
GeForce GTX 1070 (Desktop):
65 [X] Intel Core i7-4790K 4GHz
GeForce GTX 1070 (Desktop)
70.5 [X] Intel Core i7-4790K 4GHz
GeForce GTX 1070 (Desktop)
min:
65 fps, max:
78 fps
~ 68 fps
100%
GeForce GTX 1080 Ti:
34.5 [X] Gigabyte AX-370 Gaming 5 AMD Ryzen 5 1400 3.2GHz
GeForce GTX 1080 Ti
min:
33.1 fps
110 [X] Asus Crosshair VI Hero AMD Ryzen 5 1600 3.2GHz
GeForce GTX 1080 Ti
min:
96.4 fps
143 [X] Asus X299 Prime Desktop DDR4-3200 Intel Core i9-9980XE 3GHz
GeForce GTX 1080 Ti
min:
126.2 fps
145 [X] Asus X299 Prime Desktop DDR4-2666 Intel Core i9-9980XE 3GHz
GeForce GTX 1080 Ti
min:
128.3 fps
154 [X] Asus X299 Prime Desktop DDR4-3200 Intel Core i9-10980XE 3GHz
GeForce GTX 1080 Ti
min:
135 fps
154 [X] Aorus Z370 Ultra Gaming Desktop DDR4-2666 Intel Core i7-8086K 3.7GHz
GeForce GTX 1080 Ti
min:
136.6 fps
158 [X] Asus X299 Prime Desktop Intel Core i9-10980XE 3GHz
GeForce GTX 1080 Ti
min:
138.5 fps
220 [X] Intel Core i7-4790K 4GHz
GeForce GTX 1080 Ti
min:
198 fps
~ 140 fps
84%
GeForce GTX 1080 Max-Q:
116.9 [X] Asus Zephyrus GX501 Intel Core i7-7700HQ 2.8GHz
GeForce GTX 1080 Max-Q
min:
100.9 fps
fps
100%
GeForce GTX 1080 Ti:
33.8 [X] Gigabyte AX-370 Gaming 5 AMD Ryzen 5 1400 3.2GHz
GeForce GTX 1080 Ti
min:
32.4 fps
102 [X] Asus Crosshair VI Hero AMD Ryzen 5 1600 3.2GHz
GeForce GTX 1080 Ti
min:
87.9 fps
131 [X] Asus X299 Prime Desktop DDR4-3200 Intel Core i9-9980XE 3GHz
GeForce GTX 1080 Ti
min:
116.1 fps
133 [X] Asus X299 Prime Desktop DDR4-2666 Intel Core i9-9980XE 3GHz
GeForce GTX 1080 Ti
min:
115 fps
142 [X] Asus X299 Prime Desktop DDR4-3200 Intel Core i9-10980XE 3GHz
GeForce GTX 1080 Ti
min:
124.8 fps
142 [X] Aorus Z370 Ultra Gaming Desktop DDR4-2666 Intel Core i7-8086K 3.7GHz
GeForce GTX 1080 Ti
min:
125.5 fps
144 [X] Asus X299 Prime Desktop Intel Core i9-10980XE 3GHz
GeForce GTX 1080 Ti
min:
126.5 fps
193 [X] Intel Core i7-4790K 4GHz
GeForce GTX 1080 Ti
min:
173 fps
~ 128 fps
86%
GeForce GTX 1080 Max-Q:
110.2 [X] Asus Zephyrus GX501 Intel Core i7-7700HQ 2.8GHz
GeForce GTX 1080 Max-Q
min:
95.1 fps
fps
100%
GeForce GTX 1080 Ti:
33.5 [X] Gigabyte AX-370 Gaming 5 AMD Ryzen 5 1400 3.2GHz
GeForce GTX 1080 Ti
min:
32.1 fps
99.3 [X] Asus Crosshair VI Hero AMD Ryzen 5 1600 3.2GHz
GeForce GTX 1080 Ti
min:
85.6 fps
126 [X] Asus X299 Prime Desktop DDR4-3200 Intel Core i9-9980XE 3GHz
GeForce GTX 1080 Ti
min:
111.2 fps
127 [X] Asus X299 Prime Desktop DDR4-2666 Intel Core i9-9980XE 3GHz
GeForce GTX 1080 Ti
min:
112 fps
138 [X] Asus X299 Prime Desktop Intel Core i9-10980XE 3GHz
GeForce GTX 1080 Ti
min:
121.3 fps
139 [X] Asus X299 Prime Desktop DDR4-3200 Intel Core i9-10980XE 3GHz
GeForce GTX 1080 Ti
min:
119.4 fps
139 [X] Aorus Z370 Ultra Gaming Desktop DDR4-2666 Intel Core i7-8086K 3.7GHz
GeForce GTX 1080 Ti
min:
123 fps
191 [X] Intel Core i7-4790K 4GHz
GeForce GTX 1080 Ti
min:
171 fps
~ 124 fps
85%
GeForce GTX 1080 Max-Q:
106 [X] Asus Zephyrus GX501 Intel Core i7-7700HQ 2.8GHz
GeForce GTX 1080 Max-Q
min:
91.2 fps
fps
100%
GeForce GTX 1080 Ti:
32.8 [X] Gigabyte AX-370 Gaming 5 AMD Ryzen 5 1400 3.2GHz
GeForce GTX 1080 Ti
min:
31.5 fps
94.1 [X] Asus Crosshair VI Hero AMD Ryzen 5 1600 3.2GHz
GeForce GTX 1080 Ti
min:
80.1 fps
120 [X] Asus X299 Prime Desktop DDR4-3200 Intel Core i9-9980XE 3GHz
GeForce GTX 1080 Ti
min:
104.8 fps
121 [X] Asus X299 Prime Desktop DDR4-2666 Intel Core i9-9980XE 3GHz
GeForce GTX 1080 Ti
min:
106.6 fps
128 [X] Asus X299 Prime Desktop DDR4-3200 Intel Core i9-10980XE 3GHz
GeForce GTX 1080 Ti
min:
112.9 fps
130 [X] Asus X299 Prime Desktop Intel Core i9-10980XE 3GHz
GeForce GTX 1080 Ti
min:
114 fps
132 [X] Aorus Z370 Ultra Gaming Desktop DDR4-2666 Intel Core i7-8086K 3.7GHz
GeForce GTX 1080 Ti
min:
114.4 fps
173 [X] Intel Core i7-4790K 4GHz
GeForce GTX 1080 Ti
min:
156 fps
~ 116 fps
88%
GeForce GTX 1080 Max-Q:
102.4 [X] Asus Zephyrus GX501 Intel Core i7-7700HQ 2.8GHz
GeForce GTX 1080 Max-Q
min:
88.9 fps
fps
100%
GeForce GTX 1080 Ti:
32.6 [X] Gigabyte AX-370 Gaming 5 AMD Ryzen 5 1400 3.2GHz
GeForce GTX 1080 Ti
min:
31.2 fps
92.2 [X] Asus Crosshair VI Hero AMD Ryzen 5 1600 3.2GHz
GeForce GTX 1080 Ti
min:
79.1 fps
117 [X] Asus X299 Prime Desktop DDR4-2666 Intel Core i9-9980XE 3GHz
GeForce GTX 1080 Ti
min:
100 fps
118 [X] Asus X299 Prime Desktop DDR4-3200 Intel Core i9-9980XE 3GHz
GeForce GTX 1080 Ti
min:
102.9 fps
125 [X] Asus X299 Prime Desktop Intel Core i9-10980XE 3GHz
GeForce GTX 1080 Ti
min:
108.2 fps
126 [X] Asus X299 Prime Desktop DDR4-3200 Intel Core i9-10980XE 3GHz
GeForce GTX 1080 Ti
min:
109.5 fps
126 [X] Aorus Z370 Ultra Gaming Desktop DDR4-2666 Intel Core i7-8086K 3.7GHz
GeForce GTX 1080 Ti
min:
109.2 fps
143 [X] AMD Ryzen 7 1800X 3.6GHz
GeForce GTX 1080 Ti
min:
124 fps
169 [X] Intel Core i7-4790K 4GHz
GeForce GTX 1080 Ti
min:
148 fps
~ 117 fps
GeForce GTX 1080 Max-Q:
124 fps
GeForce GTX 1080 Max-Q:
88 fps
GeForce GTX 1080 Max-Q:
48 fps
100%
GeForce GTX 1080 Ti:
150 [X] Nvidia GeForce GTX 1080 Ti Founders Edition Asus Crosshair VI Hero AMD Ryzen 5 1400 3.2GHz
GeForce GTX 1080 Ti
min:
105 fps, max:
173 fps
185 [X] AMD Ryzen 3 1200 3.1GHz
GeForce GTX 1080 Ti
min:
160 fps, max:
211 fps
202 [X] AMD Ryzen 3 1300X 3.5GHz
GeForce GTX 1080 Ti
min:
180 fps, max:
227 fps
225 [X] AMD Ryzen 5 1400 3.2GHz
GeForce GTX 1080 Ti
min:
202 fps, max:
256 fps
247 [X] AMD Ryzen 7 1700X 3.4GHz
GeForce GTX 1080 Ti
min:
226 fps, max:
273 fps
250 [X] 1500X Nvidia GeForce GTX 1080 Ti FE Asus Prime B350-PLUS AMD Ryzen 5 1500X 3.5GHz
GeForce GTX 1080 Ti
min:
226 fps, max:
287 fps
254 [X] AMD Ryzen 5 1600 3.2GHz
GeForce GTX 1080 Ti
min:
237 fps, max:
292 fps
261 [X] AMD Ryzen 7 1700 3GHz
GeForce GTX 1080 Ti
min:
238 fps, max:
293 fps
274 [X] Nvidia GeForce GTX 1080 Ti FE Asus Prime B350-PLUS AMD Ryzen 7 1700 3GHz
GeForce GTX 1080 Ti
min:
243 fps, max:
310 fps
283 [X] AMD Ryzen 7 1800X 3.6GHz
GeForce GTX 1080 Ti
min:
255 fps, max:
312 fps
297 [X] Nvidia GeForce GTX 1080 Ti FE Asus Prime B350-PLUS AMD Ryzen 7 1800X 3.6GHz
GeForce GTX 1080 Ti
min:
267 fps, max:
336 fps
303 [X] Intel Core i5-8400 2.8GHz
GeForce GTX 1080 Ti
min:
277 fps, max:
338 fps
313 [X] i7-7700K Gigabyte Z270-Gaming K3 Intel Core i7-7700K 4.2GHz
GeForce GTX 1080 Ti
min:
284 fps, max:
344 fps
313 [X] Aorus Z370 Ultra Gaming Desktop DDR4-2666 Intel Core i7-8086K 3.7GHz
GeForce GTX 1080 Ti
min:
286 fps, max:
354 fps
317 [X] i7-6950X Asus X99-E Intel Core i7-6950X 3GHz
GeForce GTX 1080 Ti
min:
279 fps, max:
360 fps
322 [X] Intel Core i7-4790K 4GHz
GeForce GTX 1080 Ti
min:
297 fps, max:
348 fps
327 [X] Intel Core i7-7740X 4.3GHz
GeForce GTX 1080 Ti
min:
258 fps, max:
363 fps
330 [X] Nvidia GeForce GTX 1080 Ti Founders Edition Intel Core i7-7740X 4.3GHz
GeForce GTX 1080 Ti
min:
285 fps, max:
374 fps
338 [X] Intel Core i7-8700K 3.7GHz
GeForce GTX 1080 Ti
min:
307 fps, max:
390 fps
349 [X] Intel Core i9-7900X 3.3GHz
GeForce GTX 1080 Ti
min:
260 fps, max:
392 fps
352 [X] Asus X299 Prime Desktop DDR4-2666 Intel Core i9-9980XE 3GHz
GeForce GTX 1080 Ti
min:
307 fps, max:
393 fps
393 [X] Asus X299 Prime Desktop Intel Core i9-10980XE 3GHz
GeForce GTX 1080 Ti
min:
363 fps, max:
418 fps
~ 286 fps
97%
GeForce GTX 1080 Max-Q:
278.6 fps
96%
GeForce GTX 1070 (Desktop):
273.3 fps
GeForce GTX 1080 Max-Q:
201.6 fps
GeForce GTX 1070 (Desktop):
194.4 fps
GeForce GTX 1070 (Desktop):
116 123 [X] MSI Gaming Z GeForce GTX 1070 Desktop PC Intel Core i7-4790K 4GHz
GeForce GTX 1070 (Desktop)
min:
102 fps, max:
138 fps
~ 120 fps
100%
GeForce GTX 1080 Ti:
87 [X] Nvidia GeForce GTX 1080 Ti Founders Edition Asus Crosshair VI Hero AMD Ryzen 5 1400 3.2GHz
GeForce GTX 1080 Ti
min:
28 fps, max:
101 fps
95 [X] AMD Ryzen 5 1600 3.2GHz
GeForce GTX 1080 Ti
min:
80 fps, max:
108 fps
96.3 [X] AMD Ryzen 5 1400 3.2GHz
GeForce GTX 1080 Ti
min:
83 fps, max:
110 fps
96.4 [X] AMD Ryzen 7 1700X 3.4GHz
GeForce GTX 1080 Ti
min:
83 fps, max:
111 fps
96.4 [X] 1500X Nvidia GeForce GTX 1080 Ti FE Asus Prime B350-PLUS AMD Ryzen 5 1500X 3.5GHz
GeForce GTX 1080 Ti
min:
84 fps, max:
110 fps
97 [X] Nvidia GeForce GTX 1080 Ti FE Asus Prime B350-PLUS AMD Ryzen 7 1800X 3.6GHz
GeForce GTX 1080 Ti
min:
83 fps, max:
110 fps
97 [X] Intel Core i9-7900X 3.3GHz
GeForce GTX 1080 Ti
min:
80 fps, max:
112 fps
97 [X] AMD Ryzen 3 1200 3.1GHz
GeForce GTX 1080 Ti
min:
84 fps, max:
112 fps
98 [X] Intel Core i7-4790K 4GHz
GeForce GTX 1080 Ti
min:
83 fps, max:
112 fps
98 [X] AMD Ryzen 7 1700 3GHz
GeForce GTX 1080 Ti
min:
86 fps, max:
111 fps
98 [X] Nvidia GeForce GTX 1080 Ti FE Asus Prime B350-PLUS AMD Ryzen 7 1700 3GHz
GeForce GTX 1080 Ti
98 [X] Aorus Z370 Ultra Gaming Desktop DDR4-2666 Intel Core i7-8086K 3.7GHz
GeForce GTX 1080 Ti
min:
85 fps, max:
110 fps
99 [X] AMD Ryzen 7 1800X 3.6GHz
GeForce GTX 1080 Ti
min:
85 fps, max:
110 fps
99 [X] i7-6950X Asus X99-E Intel Core i7-6950X 3GHz
GeForce GTX 1080 Ti
min:
85 fps, max:
114 fps
99 [X] Asus X299 Prime Desktop Intel Core i9-10980XE 3GHz
GeForce GTX 1080 Ti
min:
88 fps, max:
111 fps
100 [X] i7-7700K Gigabyte Z270-Gaming K3 Intel Core i7-7700K 4.2GHz
GeForce GTX 1080 Ti
min:
86 fps, max:
113 fps
101 [X] Intel Core i5-8400 2.8GHz
GeForce GTX 1080 Ti
min:
87 fps, max:
113 fps
102 [X] Intel Core i7-7740X 4.3GHz
GeForce GTX 1080 Ti
min:
87 fps, max:
116 fps
102 [X] Intel Core i7-8700K 3.7GHz
GeForce GTX 1080 Ti
min:
86 fps, max:
115 fps
102 [X] Asus X299 Prime Desktop DDR4-2666 Intel Core i9-9980XE 3GHz
GeForce GTX 1080 Ti
min:
88 fps, max:
118 fps
104 [X] Nvidia GeForce GTX 1080 Ti Founders Edition Intel Core i7-7740X 4.3GHz
GeForce GTX 1080 Ti
min:
87 fps, max:
118 fps
~ 98 fps
65%
GeForce GTX 1080 Max-Q:
61.9 62.9 64.2 68.1 [X] Asus Zephyrus GX501 Intel Core i7-7700HQ 2.8GHz
GeForce GTX 1080 Max-Q
min:
56 fps, max:
77 fps
~ 64 fps
64%
GeForce GTX 1070 (Desktop):
62 [X] Intel Core i7-4790K 4GHz
GeForce GTX 1070 (Desktop)
63.2 65 [X] MSI Gaming Z GeForce GTX 1070 Desktop PC Intel Core i7-4790K 4GHz
GeForce GTX 1070 (Desktop)
min:
54 fps, max:
73 fps
~ 63 fps
100%
GeForce GTX 1080 Ti:
72 [X] Intel Core i7-4790K 4GHz
GeForce GTX 1080 Ti
min:
61 fps, max:
79 fps
fps
63%
GeForce GTX 1080 Max-Q:
43.7 45.3 [X] Asus Zephyrus GX501 Intel Core i7-7700HQ 2.8GHz
GeForce GTX 1080 Max-Q
min:
40 fps, max:
50 fps
~ 45 fps
61%
GeForce GTX 1070 (Desktop):
42.3 43 [X] MSI Gaming Z GeForce GTX 1070 Desktop PC Intel Core i7-4790K 4GHz
GeForce GTX 1070 (Desktop)
min:
38 fps, max:
47 fps
43 [X] Intel Core i7-4790K 4GHz
GeForce GTX 1070 (Desktop)
45 [X] Intel Core i7-4790K 4GHz
GeForce GTX 1070 (Desktop)
min:
40 fps, max:
49 fps
46 [X] MSI Gaming Z GeForce GTX 1070 Desktop PC Intel Core i7-4790K 4GHz
GeForce GTX 1070 (Desktop)
~ 44 fps
100%
GeForce GTX 1080 Ti:
129 [X] Intel Core i7-4790K 4GHz
GeForce GTX 1080 Ti
min:
98 fps, max:
204 fps
fps
104%
GeForce GTX 1070 (Desktop):
132 [X] Intel Core i7-4790K 4GHz
GeForce GTX 1070 (Desktop)
136 [X] Intel Core i7-4790K 4GHz
GeForce GTX 1070 (Desktop)
min:
109 fps, max:
179 fps
~ 134 fps
100%
GeForce GTX 1080 Ti:
135 [X] Intel Core i7-4790K 4GHz
GeForce GTX 1080 Ti
min:
102 fps, max:
215 fps
fps
108%
GeForce GTX 1070 (Desktop):
137 [X] Intel Core i7-4790K 4GHz
GeForce GTX 1070 (Desktop)
min:
110 fps, max:
143 fps
155 [X] Intel Core i7-4790K 4GHz
GeForce GTX 1070 (Desktop)
min:
117 fps, max:
236 fps
~ 146 fps
100%
GeForce GTX 1080 Ti:
174 [X] Aorus Z370 Ultra Gaming Desktop DDR4-2666 Intel Core i7-8086K 3.7GHz
GeForce GTX 1080 Ti
min:
4.22 fps, P1:
111 fps, max:
291 fps
fps
91%
GeForce GTX 1080 Max-Q:
151 [X] Asus Zephyrus GX501 Intel Core i7-7700HQ 2.8GHz
GeForce GTX 1080 Max-Q
min:
4.15 fps, P1:
90.9 fps, max:
290 fps
167 ~ 159 fps
100%
GeForce GTX 1070 (Desktop):
174.1 fps
100%
GeForce GTX 1080 Ti:
170 [X] Aorus Z370 Ultra Gaming Desktop DDR4-2666 Intel Core i7-8086K 3.7GHz
GeForce GTX 1080 Ti
min:
30 fps, P1:
111 fps, max:
250 fps
fps
89%
GeForce GTX 1080 Max-Q:
144 [X] Asus Zephyrus GX501 Intel Core i7-7700HQ 2.8GHz
GeForce GTX 1080 Max-Q
min:
5.01 fps, P1:
83.3 fps, max:
266 fps
159 ~ 152 fps
99%
GeForce GTX 1070 (Desktop):
168.6 fps
100%
GeForce GTX 1080 Ti:
153 [X] Aorus Z370 Ultra Gaming Desktop DDR4-2666 Intel Core i7-8086K 3.7GHz
GeForce GTX 1080 Ti
min:
5.66 fps, P1:
100 fps, max:
265 fps
fps
79%
GeForce GTX 1080 Max-Q:
112 [X] Asus Zephyrus GX501 Intel Core i7-7700HQ 2.8GHz
GeForce GTX 1080 Max-Q
min:
10.1 fps, P1:
71.4 fps, max:
172 fps
129 ~ 121 fps
97%
GeForce GTX 1070 (Desktop):
148 fps
100%
GeForce GTX 1080 Ti:
85 [X] Intel Core i7-4790K 4GHz
GeForce GTX 1080 Ti
89.7 [X] Aorus Z370 Ultra Gaming Desktop DDR4-2666 Intel Core i7-8086K 3.7GHz
GeForce GTX 1080 Ti
min:
6.36 fps, P1:
62.5 fps, max:
175 fps
~ 87 fps
78%
GeForce GTX 1080 Max-Q:
63.9 [X] Asus Zephyrus GX501 Intel Core i7-7700HQ 2.8GHz
GeForce GTX 1080 Max-Q
min:
9.58 fps, P1:
43.5 fps, max:
137 fps
72 ~ 68 fps
95%
GeForce GTX 1070 (Desktop):
73 [X] Intel Core i7-4790K 4GHz
GeForce GTX 1070 (Desktop)
74 [X] Intel Core i7-4790K 4GHz
GeForce GTX 1070 (Desktop)
101.4 ~ 83 fps
100%
GeForce GTX 1080 Ti:
83.7 [X] Aorus Z370 Ultra Gaming Desktop DDR4-2666 Intel Core i7-8086K 3.7GHz
GeForce GTX 1080 Ti
min:
9.49 fps, P1:
52.6 fps, max:
164 fps
fps
73%
GeForce GTX 1080 Max-Q:
61.1 [X] Asus Zephyrus GX501 Intel Core i7-7700HQ 2.8GHz
GeForce GTX 1080 Max-Q
min:
5.32 fps, P1:
40 fps, max:
133 fps
fps
100%
GeForce GTX 1080 Ti:
97.7 [X] Aorus Z370 Ultra Gaming Desktop DDR4-2666 Intel Core i7-8086K 3.7GHz
GeForce GTX 1080 Ti
min:
9.82 fps, P1:
71.4 fps, max:
172 fps
97.8 [X] Intel Core i7-4790K 4GHz
GeForce GTX 1080 Ti
~ 98 fps
65%
GeForce GTX 1080 Max-Q:
64 64.1 [X] Asus Zephyrus GX501 Intel Core i7-7700HQ 2.8GHz
GeForce GTX 1080 Max-Q
min:
20.8 fps, P1:
47.6 fps, max:
112 fps
~ 64 fps
71%
GeForce GTX 1070 (Desktop):
59.1 [X] Intel Core i7-4790K 4GHz
GeForce GTX 1070 (Desktop)
62 [X] Intel Core i7-4790K 4GHz
GeForce GTX 1070 (Desktop)
89.5 ~ 70 fps
100%
GeForce GTX 1080 Ti:
170 [X] Intel Core i7-4790K 4GHz
GeForce GTX 1080 Ti
min:
126 fps
fps
62%
GeForce GTX 1070 (Desktop):
102 [X] Intel Core i7-4790K 4GHz
GeForce GTX 1070 (Desktop)
min:
77 fps
107 [X] Intel Core i7-4790K 4GHz
GeForce GTX 1070 (Desktop)
min:
81 fps
~ 105 fps
GeForce GTX 1070 (Desktop):
186 [X] Intel Core i7-4790K 4GHz
GeForce GTX 1070 (Desktop)
195 [X] Intel Core i7-4790K 4GHz
GeForce GTX 1070 (Desktop)
~ 191 fps
GeForce GTX 1070 (Desktop):
124 [X] Intel Core i7-4790K 4GHz
GeForce GTX 1070 (Desktop)
min:
79 fps, max:
183 fps
134 [X] Intel Core i7-4790K 4GHz
GeForce GTX 1070 (Desktop)
min:
94 fps, max:
187 fps
~ 129 fps
GeForce GTX 1070 (Desktop):
200 [X] MSI Aegis 3 8RD Intel Core i7-8700 3.2GHz
GeForce GTX 1070 (Desktop)
min:
195 fps, max:
202 fps
fps
GeForce GTX 1070 (Desktop):
200 [X] MSI Aegis 3 8RD Intel Core i7-8700 3.2GHz
GeForce GTX 1070 (Desktop)
min:
178 fps, max:
201 fps
fps
GeForce GTX 1070 (Desktop):
200 [X] MSI Aegis 3 8RD Intel Core i7-8700 3.2GHz
GeForce GTX 1070 (Desktop)
min:
199 fps, max:
201 fps
fps
100%
GeForce GTX 1080 Ti:
200 [X] Intel Core i7-4790K 4GHz
GeForce GTX 1080 Ti
min:
196 fps, max:
201 fps
fps
77%
GeForce GTX 1070 (Desktop):
148 [X] Intel Core i7-4790K 4GHz
GeForce GTX 1070 (Desktop)
min:
131 fps, max:
175 fps
152 [X] Intel Core i7-4790K 4GHz
GeForce GTX 1070 (Desktop)
min:
137 fps, max:
183 fps
158.4 [X] MSI Aegis 3 8RD Intel Core i7-8700 3.2GHz
GeForce GTX 1070 (Desktop)
min:
144 fps, max:
192 fps
~ 153 fps
100%
GeForce GTX 1080 Ti:
117 [X] Intel Core i7-4790K 4GHz
GeForce GTX 1080 Ti
min:
105 fps, max:
137 fps
fps
63%
GeForce GTX 1070 (Desktop):
69.8 [X] Intel Core i7-4790K 4GHz
GeForce GTX 1070 (Desktop)
min:
61 fps, max:
83 fps
75 [X] Intel Core i7-4790K 4GHz
GeForce GTX 1070 (Desktop)
min:
66 fps, max:
90 fps
78 [X] MSI Aegis 3 8RD Intel Core i7-8700 3.2GHz
GeForce GTX 1070 (Desktop)
min:
68 fps, max:
94 fps
~ 74 fps
100%
GeForce GTX 1080 Ti:
167 [X] Intel Core i7-4790K 4GHz
GeForce GTX 1080 Ti
fps
100%
GeForce GTX 1080 Ti:
149 [X] Intel Core i7-4790K 4GHz
GeForce GTX 1080 Ti
min:
38 fps, max:
254 fps
fps
83%
GeForce GTX 1070 (Desktop):
120 [X] Intel Core i7-4790K 4GHz
GeForce GTX 1070 (Desktop)
126 [X] Intel Core i7-4790K 4GHz
GeForce GTX 1070 (Desktop)
~ 123 fps
GeForce GTX 1080 Max-Q:
272.3 fps
GeForce GTX 1080 Max-Q:
243.6 fps
GeForce GTX 1080 Max-Q:
232 fps
100%
GeForce GTX 1080 Ti:
215 [X] Intel Core i7-4790K 4GHz
GeForce GTX 1080 Ti
fps
76%
GeForce GTX 1080 Max-Q:
151.7 175 [X] Asus Zephyrus GX501 Intel Core i7-7700HQ 2.8GHz
GeForce GTX 1080 Max-Q
~ 163 fps
72%
GeForce GTX 1070 (Desktop):
152 [X] Intel Core i7-4790K 4GHz
GeForce GTX 1070 (Desktop)
157 [X] Intel Core i7-4790K 4GHz
GeForce GTX 1070 (Desktop)
~ 155 fps
GeForce GTX 1080 Max-Q:
486.5 fps
GeForce GTX 1080 Max-Q:
461.9 fps
GeForce GTX 1080 Max-Q:
419.2 fps
GeForce GTX 1080 Max-Q:
230.4 fps
GeForce GTX 1070 (Desktop):
213 [X] Intel Core i7-4790K 4GHz
GeForce GTX 1070 (Desktop)
min:
174 fps, max:
250 fps
fps
100%
GeForce GTX 1080 Ti:
122 [X] Intel Core i7-4790K 4GHz
GeForce GTX 1080 Ti
min:
95 fps, max:
156 fps
fps
67%
GeForce GTX 1070 (Desktop):
80 [X] Intel Core i7-4790K 4GHz
GeForce GTX 1070 (Desktop)
min:
65 fps, max:
124 fps
83 [X] Intel Core i7-4790K 4GHz
GeForce GTX 1070 (Desktop)
min:
69 fps, max:
135 fps
~ 82 fps
Average Gaming NVIDIA GeForce GTX 1080 Ti (Desktop) → 100% Average Gaming 30-70 fps → 100%
Average Gaming NVIDIA GeForce GTX 1080 Max-Q → 75% Average Gaming 30-70 fps → 71%
Average Gaming NVIDIA GeForce GTX 1070 (Desktop) → 80% Average Gaming 30-70 fps → 71%
For more games that might be playable and a list of all games and graphics cards visit our Gaming List
v1.26
log 25. 07:35:17
#0 checking url part for id 7700 +0s ... 0s
#1 checking url part for id 8006 +0s ... 0s
#2 checking url part for id 7323 +0s ... 0s
#3 not redirecting to Ajax server +0s ... 0s
#4 did not recreate cache, as it is less than 5 days old! Created at Thu, 25 Apr 2024 05:40:10 +0200 +0.001s ... 0.001s
#5 composed specs +0.189s ... 0.19s
#6 did output specs +0s ... 0.19s
#7 start showIntegratedCPUs +0s ... 0.19s
#8 getting avg benchmarks for device 7700 +0.047s ... 0.237s
#9 got single benchmarks 7700 +0.052s ... 0.29s
#10 getting avg benchmarks for device 8006 +0.019s ... 0.309s
#11 got single benchmarks 8006 +0.021s ... 0.33s
#12 getting avg benchmarks for device 7323 +0.015s ... 0.346s
#13 got single benchmarks 7323 +0.02s ... 0.366s
#14 got avg benchmarks for devices +0s ... 0.366s
#15 min, max, avg, median took s +0.674s ... 1.04s
#16 before gaming benchmark output +0s ... 1.04s
#17 Got 1827 rows for game benchmarks. +0.201s ... 1.241s
#18 composed SQL query for gamebenchmarks +0s ... 1.241s
#19 got data and put it in $dataArray +0.114s ... 1.356s
#20 benchmarks composed for output. +0.333s ... 1.689s
#21 calculated avg scores. +0s ... 1.689s
#22 return log +0.007s ... 1.695s
Please share our article, every link counts!
Redaktion, 2017-09- 8 (Update: 2023-07- 1)
 Deutsch
 English
 Español
 Français
 Italiano
 Nederlands
 Polski
 Português
 Русский
 Türkçe
 Svenska
 Chinese
 Magyar