NVIDIA GeForce GTX 1060 Mobile vs NVIDIA GeForce GTX 1050 Max-Q vs NVIDIA GeForce GTX 1080 Ti (Desktop)
NVIDIA GeForce GTX 1060 Mobile ► remove from comparison
The mobile Nvidia GeForce GTX 1060 is a graphics card for high end laptops . It is based on the Pascal architecture and manufactured in 16 nm FinFET at TSMC. The GPU is using the smaller GP106 chip. Compared to the desktop version of the GTX 1060, the laptop version offers the same amount of shaders but slightly lower clock rates. The TDP is slightly less than the old GTX 970M (predecessor) .
For thin and light laptops Nvidia offer a Max-Q called version of the GTX 1060
The performance of the mobile GTX 1060 is a few percent below a reference GTX 1060 desktop card. In our benchmark so far (no max-Q version) the mobile GTX 1060 was somewhere between -1 and -16% slower than a desktop variant. A comprehensive review of the dekstop GeForce GTX 1060 Founders Edition with 6 GB GDDR5 can be found here . Therefore, the card is most suited for Full HD or WQHD gaming in high to maximum details (see benchmarks below).
The GP106 chip is produced in 16nm FinFET at TSMC and offers a range of new features, like DisplayPort 1.4 (ready), HDMI 2.0b, HDR, Simultaneous Multi-Projection (SMP) and improved H.265 video de- and encoding (PlayReady 3.0). A list of improvements and features can be found in our article on the Pascal architecture .
The power consumption is specified with a TGP of 80 Watt and therefore slightly below the old GTX 970M . Since summer 2017 a low power variant (Max-Q) is available for thin and light laptops with reduced performance and a lower TGP of 60 - 70 Watt.
NVIDIA GeForce GTX 1050 Max-Q ► remove from comparison
The Nvidia GeForce GTX 1050 with Max-Q design is a mainstream GPU based on the Pascal architecture and was announced in January 2018. Contrary to the faster models, the GTX 1050 uses the GP107 chip, which is manufactured in a 14 nm process at Samsung.
The clock is not the only difference compared to the regular GTX 1050 though. The drivers for the Max-Q version were optimized for efficiency (and not performance; only for Max-Q models), there are optimized voltage converters for 1V operation, high-end cooling methods, and a 40 dB limit for the fan noise (with clock adjustments to ensure this at all times).
Features
The GP107 chip is manufactured in a 14 nm FinFET process at Samsung and offers a number of new features, including support for DisplayPort 1.4 (ready), HDMI 2.0b, HDR, Simultaneous Multi-Projection (SMP) as well as improved H.265 video de- and encoding (PlayReady 3.0). A full list of improvements and the new Pascal desktop GPUs is available in our dedicated Pascal architecture article .
Performance
The performance of the GeForce GTX 1050 Max-Q should be around 10-15 % below a regular GTX 1050 for laptops. This means the GPU is most suited for full HD gaming at high settings (not maximum).
Power Consumption
The power consumption of the GeForce GTX 1050 Max-Q is rated at 34 to 40 Watt and therefore significantly lower than the normal laptop GTX 1050 (53 Watt). Therefore, the Max-Q variant is also suited for thin and light laptops.
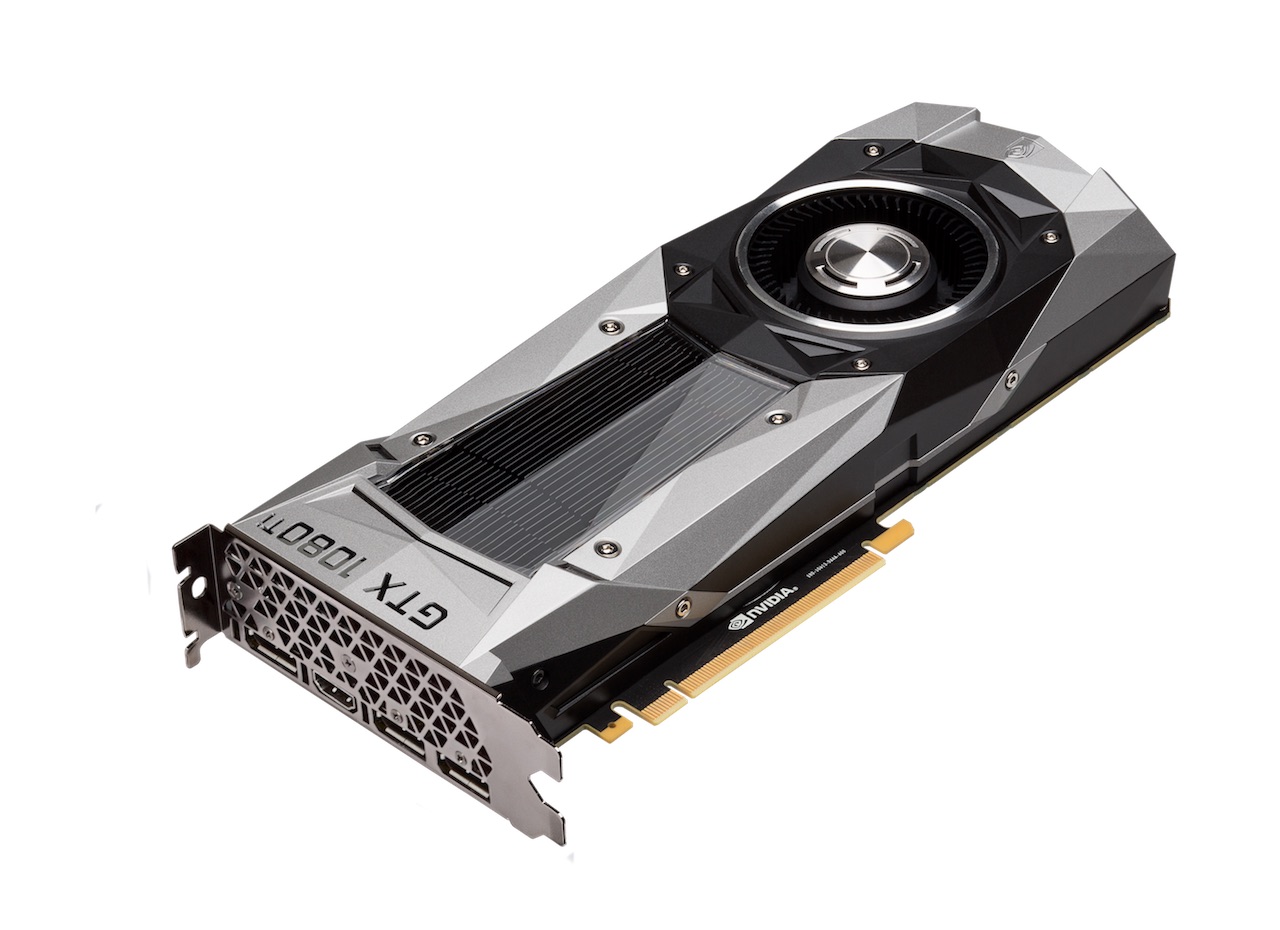
NVIDIA GeForce GTX 1080 Ti (Desktop) ► remove from comparison
The Nvidia GeForce GTX 1080 Ti is the fastest desktop consumer graphics card (beginning 2017). It is based on the same GP107 chip as the Titan X but with slightly higher clock speeds and a different memory configuration. It offers one memory controller less (and 11 instead of 12 GB), but the GDDR5X memory is faster clocked (11 GHz) leading to a comparable memory bandwidth. Due to the higher boost clock, the 1080Ti should be around 5 % faster compared to the Pascal Titan X and about 35 % faster compared to the GTX 1080 . The TDP is equal to the Titan X with 250 Watt. A new cooler of the Founders Edition should be more efficient and quieter.
NVIDIA GeForce GTX 1060 Mobile NVIDIA GeForce GTX 1050 Max-Q NVIDIA GeForce GTX 1080 Ti (Desktop) GeForce GTX 1000 Series Codename N17E-G1 N17P-G0 Max-Q GP102 Architecture Pascal Pascal Pascal Pipelines 1280 - unified 640 - unified 3584 - unified TMUs 80 ROPs 48 Core Speed 1404 - 1670 (Boost) MHz 999 - 1189 - 1139 - 1328 (Boost) MHz 1481 - 1600 (Boost) MHz Memory Speed 8000 effective = 2002 MHz 7000 MHz 11000 MHz Memory Bus Width 192 Bit 128 Bit 352 Bit Memory Type GDDR5 GDDR5 GDDR5X Max. Amount of Memory 6 GB 4 GB 11 GB Shared Memory no no no Memory Bandwidth 192 GB/s API DirectX 12_1, OpenGL 4.5 DirectX 12_1, OpenGL 4.5 DirectX 12_1, OpenGL 4.5 / Vulkan Power Consumption 80 Watt 34 - 40 Watt 250 Watt Transistors 4.4 Billion 12 Billion technology 16 nm 14 nm 16 nm PCIe 3.0 Features Multi-Projection, VR Ready, G-SYNC, Vulkan, Multi Monitor DP 1.4, HDMI 2.0b, HDCP 2.2, CUDA, PCIe 3.0, GPU Boost 3.0, G-SYNC Notebook Size large large Date of Announcement 18.08.2016 03.01.2018 28.02.2017 Link to Manufacturer Page www.nvidia.de www.nvidia.com
Benchmarks Performance Rating - 3DMark 11 + Fire Strike + Time Spy - GeForce GTX 1060 Mobile
5.3 pt (16%)
...
NVIDIA GeForce GTX 1060 Mobile
...
max:
Performance Rating - 3DMark 11 + Fire Strike + Time Spy - GeForce GTX 1050 Max-Q
2.6 pt (8%)
...
NVIDIA GeForce GTX 1050 Max-Q
...
max:
3DMark - 3DMark Time Spy Score
min: 3339 avg: 3631 median: 3618 (10%) max: 4027 Points
min: 1709 avg: 1754 median: 1753.5 (5%) max: 1798 Points
min: 6978 avg: 8628 median: 8684.5 (25%) max: 9806 Points
3DMark - 3DMark Time Spy Graphics
min: 3396 avg: 3601 median: 3580.5 (9%) max: 3790 Points
min: 1596 avg: 1615 median: 1615 (4%) max: 1634 Points
min: 9024 avg: 9372 median: 9401 (25%) max: 9608 Points
3DMark - 3DMark Ice Storm Unlimited Graphics
min: 235897 avg: 303665 median: 298378 (34%) max: 389909 Points
318811 Points (36%)
min: 350317 avg: 408298 median: 394694 (45%) max: 493486 Points
3DMark - 3DMark Ice Storm Extreme Graphics
min: 33205 avg: 152262 median: 158427 (20%) max: 257260 Points
22530 Points (3%)
3DMark - 3DMark Cloud Gate Score
min: 15234 avg: 25037 median: 24326.5 (26%) max: 36010 Points
min: 14739 avg: 17501 median: 18259.5 (20%) max: 18746 Points
min: 28990 avg: 41126 median: 43370.5 (46%) max: 49475 Points
3DMark - 3DMark Cloud Gate Graphics
min: 26770 avg: 71237 median: 74604.5 (20%) max: 86193 Points
min: 27059 avg: 33618 median: 35392 (9%) max: 36630 Points
min: 105276 avg: 136458 median: 142490 (37%) max: 157012 Points
3DMark - 3DMark Fire Strike Standard Score
min: 8563 avg: 9799 median: 9739 (17%) max: 10794 Points
min: 5114 avg: 5213 median: 5223 (9%) max: 5292 Points
min: 14936 avg: 19343 median: 19615.5 (35%) max: 22823 Points
3DMark - 3DMark Fire Strike Standard Graphics
min: 10708 avg: 11547 median: 11558 (13%) max: 12298 Points
min: 5616 avg: 5677 median: 5649.5 (6%) max: 5792 Points
min: 25771 avg: 27531 median: 27564 (31%) max: 28476 Points
3DMark - 3DMark Ice Storm Graphics
min: 26301 avg: 177989 median: 191586 (23%) max: 295848 Points
min: 36552 avg: 43792 median: 43792 (5%) max: 51032 Points
3DMark 11 - 3DM11 Performance Score
min: 10386 avg: 12450 median: 12449 (17%) max: 14618 Points
min: 7116 avg: 7354 median: 7347.5 (10%) max: 7603 Points
min: 16074 avg: 24293 median: 24935 (35%) max: 29827 Points
3DMark 11 - 3DM11 Performance GPU
min: 12620 avg: 14692 median: 14693 (13%) max: 15607 Points
min: 6874 avg: 7142 median: 7153.5 (6%) max: 7385 Points
min: 34761 avg: 37470 median: 37671.5 (32%) max: 39241 Points
3DMark Vantage + NVIDIA GeForce GTX 1060 Mobile 3DMark Vantage - 3DM Vant. Perf. total
min: 33893 avg: 34127 median: 34127 (10%) max: 34361 Points
3DM Vant. Perf. total + NVIDIA GeForce GTX 1050 Max-Q
min: 26044 avg: 26081 median: 26080.5 (8%) max: 26117 Points
3DM Vant. Perf. GPU no PhysX + NVIDIA GeForce GTX 1060 Mobile 3DMark Vantage - 3DM Vant. Perf. GPU no PhysX
min: 38563 avg: 38910 median: 38910 (22%) max: 39257 Points
3DM Vant. Perf. GPU no PhysX + NVIDIA GeForce GTX 1050 Max-Q
min: 25008 avg: 25293 median: 25292.5 (14%) max: 25577 Points
3DMark 03 - 3DMark 03 - Standard
87152 Points (46%)
3DMark 05 - 3DMark 05 - Standard
23823 Points (26%)
3DMark 06 3DMark 06 - Standard 1280x1024 + NVIDIA GeForce GTX 1060 Mobile
min: 19244 avg: 26381 median: 26152 (34%) max: 33570 Points
3DMark 06 - Standard 1280x1024 + NVIDIA GeForce GTX 1050 Max-Q
min: 9694 avg: 19691 median: 19690.5 (26%) max: 29687 Points
3DMark 06 - Standard 1280x1024 + NVIDIA GeForce GTX 1080 Ti (Desktop)
min: 23535 avg: 34281 median: 33610 (44%) max: 44272 Points
Unigine Valley 1.0 - Unigine Valley 1.0 DX
81.7 fps (27%)
30.8 fps (10%)
min: 88.8 avg: 117.1 median: 114.5 (38%) max: 144 fps
Unigine Heaven 3.0 - Unigine Heaven 3.0 DX 11
70.2 fps (23%)
Unigine Heaven 3.0 - Unigine Heaven 3.0 OpenGL
65 fps (29%)
Unigine Heaven 2.1 - Heaven 2.1 high
min: 100.9 avg: 101.2 median: 101.2 (19%) max: 101.4 fps
SPECviewperf 11 + NVIDIA GeForce GTX 1060 Mobile SPECviewperf 11 - specvp11 snx-01
min: 9.51 avg: 10.1 median: 9.9 (6%) max: 11.16 fps
specvp11 tcvis-02 + NVIDIA GeForce GTX 1060 Mobile SPECviewperf 11 - specvp11 tcvis-02
min: 2.96 avg: 3.2 median: 3.2 (2%) max: 3.46 fps
specvp11 sw-02 + NVIDIA GeForce GTX 1060 Mobile SPECviewperf 11 - specvp11 sw-02
min: 16.81 avg: 19.7 median: 18.4 (14%) max: 26.26 fps
specvp11 proe-05 + NVIDIA GeForce GTX 1060 Mobile SPECviewperf 11 - specvp11 proe-05
min: 2.64 avg: 2.9 median: 2.7 (3%) max: 3.48 fps
specvp11 maya-03 + NVIDIA GeForce GTX 1060 Mobile SPECviewperf 11 - specvp11 maya-03
min: 15.93 avg: 21.3 median: 21.9 (17%) max: 27.01 fps
specvp11 lightwave-01 + NVIDIA GeForce GTX 1060 Mobile SPECviewperf 11 - specvp11 lightwave-01
min: 20.37 avg: 22.8 median: 21.8 (23%) max: 28.64 fps
specvp11 ensight-04 + NVIDIA GeForce GTX 1060 Mobile SPECviewperf 11 - specvp11 ensight-04
min: 56.2 avg: 100.2 median: 122.3 (58%) max: 137.4 fps
specvp11 catia-03 + NVIDIA GeForce GTX 1060 Mobile SPECviewperf 11 - specvp11 catia-03
min: 18.41 avg: 20.6 median: 20.3 (11%) max: 24.15 fps
SPECviewperf 12 + NVIDIA GeForce GTX 1060 Mobile SPECviewperf 12 - specvp12 sw-03
min: 38.47 avg: 41.1 median: 41.1 (10%) max: 43.77 fps
specvp12 sw-03 + NVIDIA GeForce GTX 1080 Ti (Desktop)
min: 59.6 avg: 67.5 median: 67.5 (17%) max: 75.4 fps
specvp12 snx-02 + NVIDIA GeForce GTX 1060 Mobile SPECviewperf 12 - specvp12 snx-02
min: 5.71 avg: 5.7 median: 5.7 (1%) max: 5.72 fps
specvp12 snx-02 + NVIDIA GeForce GTX 1080 Ti (Desktop)
min: 9.77 avg: 10 median: 10 (1%) max: 10.2 fps
specvp12 showcase-01 + NVIDIA GeForce GTX 1060 Mobile SPECviewperf 12 - specvp12 showcase-01
min: 59.2 avg: 60.9 median: 60.9 (13%) max: 62.6 fps
specvp12 showcase-01 + NVIDIA GeForce GTX 1080 Ti (Desktop)
min: 143.1 avg: 149.2 median: 149.2 (32%) max: 155.2 fps
specvp12 mediacal-01 + NVIDIA GeForce GTX 1060 Mobile SPECviewperf 12 - specvp12 mediacal-01
min: 26.61 avg: 28.2 median: 28.2 (7%) max: 29.7 fps
specvp12 mediacal-01 + NVIDIA GeForce GTX 1080 Ti (Desktop)
min: 56.7 avg: 58.3 median: 58.3 (15%) max: 59.8 fps
specvp12 maya-04 + NVIDIA GeForce GTX 1060 Mobile SPECviewperf 12 - specvp12 maya-04
min: 73.4 avg: 80.6 median: 80.6 (22%) max: 87.8 fps
specvp12 maya-04 + NVIDIA GeForce GTX 1080 Ti (Desktop)
min: 154.5 avg: 174.5 median: 174.5 (48%) max: 194.5 fps
specvp12 energy-01 + NVIDIA GeForce GTX 1060 Mobile SPECviewperf 12 - specvp12 energy-01
min: 1.2 avg: 3.5 median: 3.5 (3%) max: 5.75 fps
specvp12 energy-01 + NVIDIA GeForce GTX 1080 Ti (Desktop)
14.8 fps (13%)
specvp12 creo-01 + NVIDIA GeForce GTX 1060 Mobile SPECviewperf 12 - specvp12 creo-01
min: 34.73 avg: 35.2 median: 35.2 (14%) max: 35.65 fps
specvp12 creo-01 + NVIDIA GeForce GTX 1080 Ti (Desktop)
min: 52.5 avg: 60.1 median: 60.1 (24%) max: 67.7 fps
specvp12 catia-04 + NVIDIA GeForce GTX 1060 Mobile SPECviewperf 12 - specvp12 catia-04
min: 48.08 avg: 49 median: 49 (8%) max: 49.93 fps
specvp12 catia-04 + NVIDIA GeForce GTX 1080 Ti (Desktop)
min: 100.7 avg: 104.9 median: 104.9 (17%) max: 109.1 fps
specvp12 3dsmax-05 + NVIDIA GeForce GTX 1080 Ti (Desktop) SPECviewperf 12 - specvp12 3dsmax-05
min: 128.2 avg: 147.7 median: 147.7 (26%) max: 167.1 fps
Cinebench R10 Cinebench R10 Shading (32bit) + NVIDIA GeForce GTX 1060 Mobile Cinebench R10 - Cinebench R10 Shading (32bit)
min: 3866 avg: 7837 median: 6838 (5%) max: 12130 Points
Cinebench R10 Shading (32bit) + NVIDIA GeForce GTX 1050 Max-Q
min: 1803 avg: 5147 median: 6811 (5%) max: 6828 Points
Cinebench R10 Shading (32bit) + NVIDIA GeForce GTX 1080 Ti (Desktop)
min: 3420 avg: 6309 median: 6805.5 (5%) max: 6829 Points
Cinebench R11.5 Cinebench R11.5 OpenGL 64 Bit + NVIDIA GeForce GTX 1060 Mobile Cinebench R11.5 - Cinebench R11.5 OpenGL 64 Bit
min: 52.4 avg: 64.2 median: 63.3 (22%) max: 76 fps
Cinebench R11.5 OpenGL 64 Bit + NVIDIA GeForce GTX 1050 Max-Q
min: 20.54 avg: 47.4 median: 47.4 (16%) max: 74.3 fps
Cinebench R11.5 OpenGL 64 Bit + NVIDIA GeForce GTX 1080 Ti (Desktop)
min: 58.2 avg: 60.7 median: 60.7 (21%) max: 63.1 fps
Cinebench R15 + NVIDIA GeForce GTX 1060 Mobile Cinebench R15 - Cinebench R15 OpenGL 64 Bit
min: 53.4 avg: 99.6 median: 102.1 (6%) max: 149.9 fps
Cinebench R15 OpenGL 64 Bit + NVIDIA GeForce GTX 1050 Max-Q
min: 64.5 avg: 100.9 median: 109.5 (6%) max: 119.9 fps
Cinebench R15 OpenGL 64 Bit + NVIDIA GeForce GTX 1080 Ti (Desktop)
min: 87.7 avg: 142.8 median: 160 (9%) max: 185 fps
Cinebench R15 OpenGL Ref. Match 64 Bit + NVIDIA GeForce GTX 1060 Mobile Cinebench R15 - Cinebench R15 OpenGL Ref. Match 64 Bit
99.6 % (100%)
Cinebench R15 OpenGL Ref. Match 64 Bit + NVIDIA GeForce GTX 1050 Max-Q
99.6 % (100%)
Cinebench R15 OpenGL Ref. Match 64 Bit + NVIDIA GeForce GTX 1080 Ti (Desktop)
min: 99.6 avg: 99.8 median: 99.6 (100%) max: 100 %
GFXBench - GFXBench 5.0 Aztec Ruins High Tier Offscreen
48.1 fps (9%)
GFXBench - GFXBench 5.0 Aztec Ruins Normal Tier Offscreen
128.3 fps (10%)
GFXBench - GFXBench Car Chase Offscreen
108.1 fps (12%)
min: 352 avg: 373 median: 373 (42%) max: 394 fps
GFXBench 3.1 - GFXBench Manhattan ES 3.1 Offscreen
165.2 fps (3%)
min: 419 avg: 480.5 median: 480.5 (10%) max: 542 fps
GFXBench 3.0 - GFXBench 3.0 Manhattan Offscreen
223 fps (13%)
min: 399 avg: 475.5 median: 475.5 (28%) max: 552 fps
GFXBench (DX / GLBenchmark) 2.7 + NVIDIA GeForce GTX 1050 Max-Q GFXBench (DX / GLBenchmark) 2.7 - GFXBench T-Rex HD Offscreen C24Z16
441.6 fps (4%)
GFXBench T-Rex HD Offscreen C24Z16 + NVIDIA GeForce GTX 1080 Ti (Desktop)
min: 1324 avg: 1521 median: 1521 (12%) max: 1718 fps
Basemark GPU 1.2 - Basemark GPU 1.2 Vulkan Official Medium Offscreen 1080
1135 fps (7%)
Basemark GPU 1.2 - Basemark GPU 1.2 Vulkan Official High Offscreen 2160
102 fps (23%)
LuxMark v2.0 64Bit - LuxMark v2.0 Room GPU
min: 1889 avg: 1934 median: 1934 (9%) max: 1979 Samples/s
min: 967 avg: 968 median: 967.5 (4%) max: 968 Samples/s
min: 3050 avg: 3055 median: 3054.5 (14%) max: 3059 Samples/s
LuxMark v2.0 64Bit - LuxMark v2.0 Sala GPU
min: 3039 avg: 3427 median: 3426.5 (6%) max: 3814 Samples/s
min: 1692 avg: 1702 median: 1702 (3%) max: 1712 Samples/s
min: 6583 avg: 6592 median: 6591.5 (12%) max: 6600 Samples/s
ComputeMark v2.1 - ComputeMark v2.1 Result
min: 7970 avg: 8461 median: 8538.5 (9%) max: 9165 Points
min: 4236 avg: 4343 median: 4342.5 (5%) max: 4449 Points
min: 21646 avg: 21948 median: 21948 (24%) max: 22250 Points
Power Consumption - Furmark Stress Test Power Consumption - external Monitor *
min: 103 avg: 106.5 median: 106.5 (15%) max: 110 Watt
min: 319 avg: 347.6 median: 344.5 (49%) max: 378 Watt
Power Consumption - The Witcher 3 Power Consumption - external Monitor *
min: 101 avg: 106.3 median: 105 (15%) max: 113 Watt
min: 339 avg: 356 median: 355 (50%) max: 373 Watt
Power Consumption - Witcher 3 Power Consumption *
min: 102 avg: 123.6 median: 124 (27%) max: 156.1 Watt
68 Watt (15%)
Power Consumption - Witcher 3 ultra Power Efficiency
min: 0.2417 avg: 0.3 median: 0.3 (32%) max: 0.3664 fps per Watt
0.3 fps per Watt (30%)
Power Consumption - Witcher 3 ultra Power Efficiency - external Monitor
min: 0.3381 avg: 0.3 median: 0.3 (28%) max: 0.3663 fps per Watt
min: 0.2601 avg: 0.3 median: 0.3 (23%) max: 0.3068 fps per Watt
Emissions Witcher 3 Fan Noise + NVIDIA GeForce GTX 1060 Mobile Emissions - Witcher 3 Fan Noise
min: 39 avg: 47.1 median: 46.1 (74%) max: 56.7 dB(A)
Witcher 3 Fan Noise + NVIDIA GeForce GTX 1050 Max-Q
37.4 dB(A) (60%)
Clock Speed - GPU Clock Witcher 3 ultra
min: 1550 avg: 1632 median: 1619 (63%) max: 1720 MHz
min: 1780 avg: 1784 median: 1783.5 (70%) max: 1787 MHz
Clock Speed - GPU Clock Speed Furmark
min: 1215 avg: 1263 median: 1271 (50%) max: 1295 MHz
min: 1480 avg: 1506 median: 1500 (59%) max: 1538 MHz
Average Benchmarks NVIDIA GeForce GTX 1060 Mobile → 100% n=18 Average Benchmarks NVIDIA GeForce GTX 1050 Max-Q → 65% n=18 Average Benchmarks NVIDIA GeForce GTX 1080 Ti (Desktop) → 179% n=18
- Range of benchmark values for this graphics card
- Average benchmark values for this graphics card
* Smaller numbers mean a higher performance
1 This benchmark is not used for the average calculation
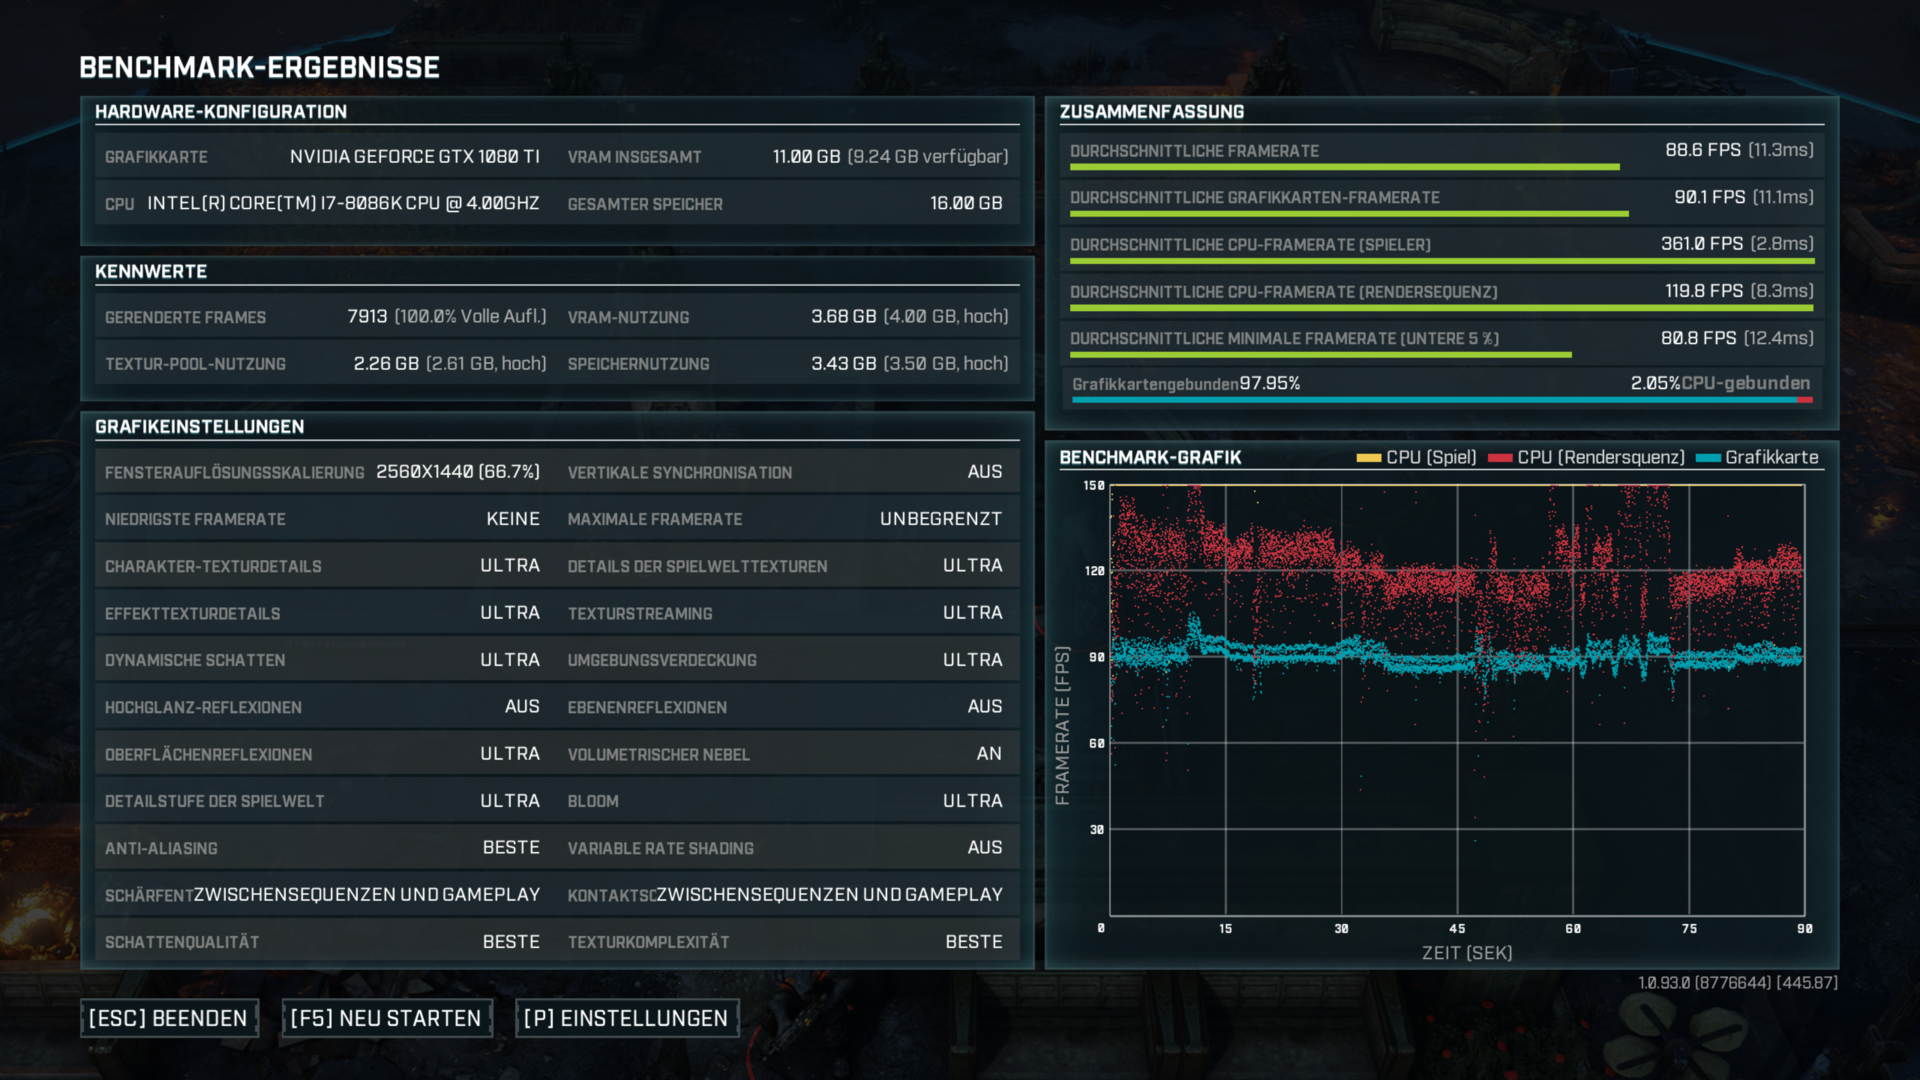
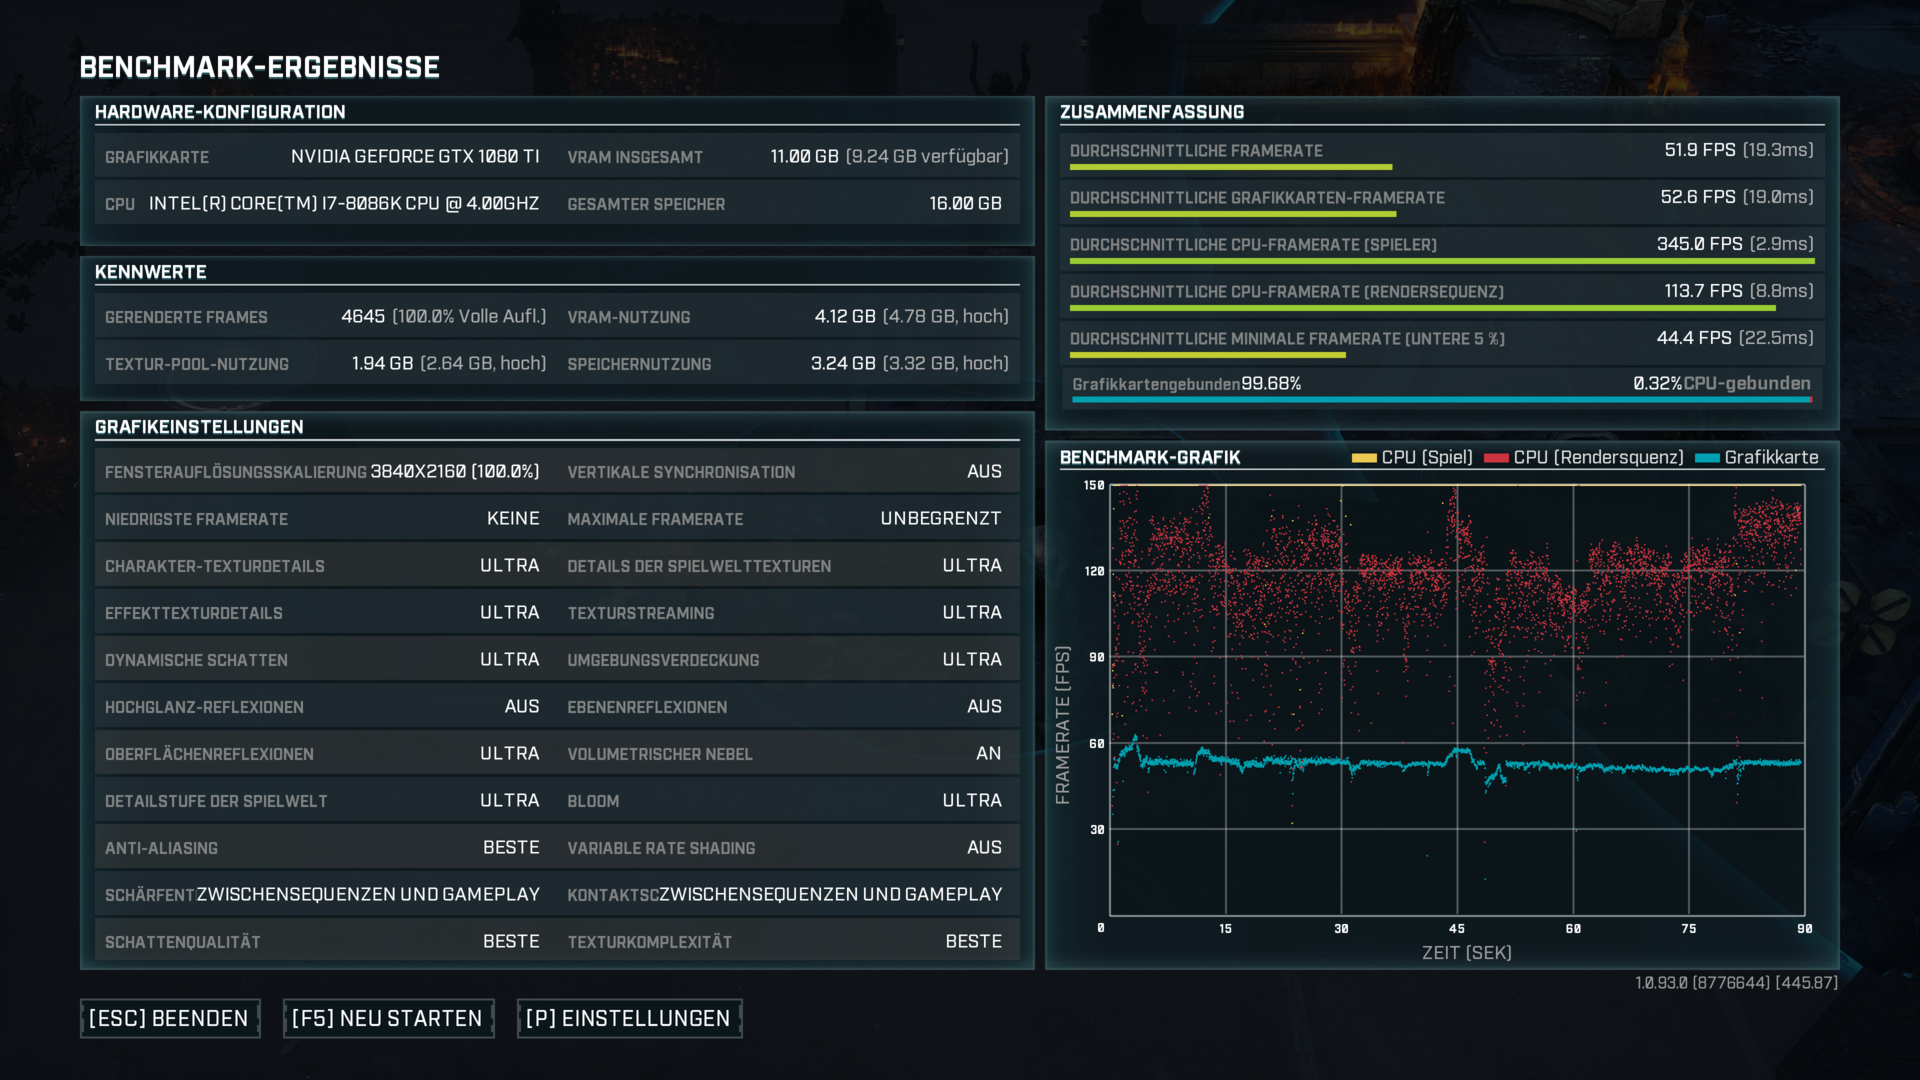
Game Benchmarks The following benchmarks stem from our benchmarks of review laptops. The performance depends on the used graphics memory, clock rate, processor, system settings, drivers, and operating systems. So the results don't have to be representative for all laptops with this GPU. For detailed information on the benchmark results, click on the fps number.
100%
GeForce GTX 1060 Mobile:
13.9 [X] HP Omen 15-dc0006ng Intel Core i7-8750H 2.2GHz
GeForce GTX 1060 Mobile
min:
6.52 fps, P0.1:
6.64 fps, P1:
7.11 fps, max:
55.3 fps
21.5 [X] HP Omen 15-dc0006ng 1.0.16.1
Intel Core i7-8750H 2.2GHz
GeForce GTX 1060 Mobile
min:
10.7 fps, P0.1:
10.9 fps, P1:
12.4 fps, max:
63.7 fps
~ 18 fps
100%
GeForce GTX 1060 Mobile:
12.3 [X] HP Omen 15-dc0006ng Intel Core i7-8750H 2.2GHz
GeForce GTX 1060 Mobile
min:
5.15 fps, P0.1:
5.23 fps, P1:
6.17 fps, max:
53.4 fps
18.2 [X] HP Omen 15-dc0006ng 1.0.16.1
Intel Core i7-8750H 2.2GHz
GeForce GTX 1060 Mobile
min:
7.17 fps, P0.1:
8.35 fps, P1:
10.9 fps, max:
55.4 fps
~ 15 fps
100%
GeForce GTX 1060 Mobile:
11.6 [X] HP Omen 15-dc0006ng Intel Core i7-8750H 2.2GHz
GeForce GTX 1060 Mobile
min:
5.58 fps, P0.1:
5.67 fps, P1:
5.99 fps, max:
52.9 fps
15.6 [X] HP Omen 15-dc0006ng 1.0.16.1
Intel Core i7-8750H 2.2GHz
GeForce GTX 1060 Mobile
min:
8.35 fps, P0.1:
8.39 fps, P1:
10.2 fps, max:
35.1 fps
~ 14 fps
100%
GeForce GTX 1060 Mobile:
136.6 [X] HP Omen 15-dc0006ng Intel Core i7-8750H 2.2GHz
GeForce GTX 1060 Mobile
min:
13.5 fps, P0.1:
36.9 fps, P1:
67.3 fps, max:
560 fps
fps
100%
GeForce GTX 1060 Mobile:
110 [X] HP Omen 15-dc0006ng Intel Core i7-8750H 2.2GHz
GeForce GTX 1060 Mobile
min:
41.5 fps, P0.1:
44.8 fps, P1:
55.6 fps, max:
585 fps
fps
100%
GeForce GTX 1060 Mobile:
84.7 [X] HP Omen 15-dc0006ng Intel Core i7-8750H 2.2GHz
GeForce GTX 1060 Mobile
min:
30.5 fps, P0.1:
34.2 fps, P1:
41.8 fps, max:
395 fps
fps
100%
GeForce GTX 1060 Mobile:
60.8 [X] HP Omen 15-dc0006ng Intel Core i7-8750H 2.2GHz
GeForce GTX 1060 Mobile
min:
19.2 fps, P0.1:
27.5 fps, P1:
33.5 fps, max:
207 fps
fps
100%
GeForce GTX 1060 Mobile:
39.8 [X] HP Omen 15-dc0006ng 2.02
Intel Core i7-8750H 2.2GHz
GeForce GTX 1060 Mobile
min:
26.9 fps, max:
54.2 fps
fps
100%
GeForce GTX 1060 Mobile:
30.9 [X] HP Omen 15-dc0006ng 2.02
Intel Core i7-8750H 2.2GHz
GeForce GTX 1060 Mobile
min:
22.4 fps, max:
39.5 fps
fps
100%
GeForce GTX 1060 Mobile:
26.8 [X] HP Omen 15-dc0006ng 2.02
Intel Core i7-8750H 2.2GHz
GeForce GTX 1060 Mobile
min:
20.5 fps, max:
36 fps
fps
100%
GeForce GTX 1060 Mobile:
22.6 [X] HP Omen 15-dc0006ng 2.02
Intel Core i7-8750H 2.2GHz
GeForce GTX 1060 Mobile
min:
16.6 fps, max:
32.3 fps
fps
265%
GeForce GTX 1080 Ti:
59.9 [X] Asus Maximum XIII Hero Desktop MSI GTX 1080 Ti FE 2.02
Intel Core i9-11900K 3.5GHz
GeForce GTX 1080 Ti
min:
42.4 fps, max:
84 fps
fps
GeForce GTX 1080 Ti:
36.7 [X] Asus Maximum XIII Hero Desktop MSI GTX 1080 Ti FE 2.02
Intel Core i9-11900K 3.5GHz
GeForce GTX 1080 Ti
min:
27.3 fps, max:
51.2 fps
fps
GeForce GTX 1080 Ti:
16.3 [X] Asus Maximum XIII Hero Desktop MSI GTX 1080 Ti FE 2.02
Intel Core i9-11900K 3.5GHz
GeForce GTX 1080 Ti
min:
12.4 fps, max:
23.1 fps
fps
100%
GeForce GTX 1060 Mobile:
50.5 [X] HP Omen 15-dc0006ng Intel Core i7-8750H 2.2GHz
GeForce GTX 1060 Mobile
min:
18.9 fps, P0.1:
30 fps, P1:
41.5 fps, max:
143.8 fps
fps
100%
GeForce GTX 1060 Mobile:
39.8 [X] HP Omen 15-dc0006ng Intel Core i7-8750H 2.2GHz
GeForce GTX 1060 Mobile
min:
22.7 fps, P0.1:
28.3 fps, P1:
33.8 fps, max:
66.7 fps
fps
100%
GeForce GTX 1060 Mobile:
32.4 [X] HP Omen 15-dc0006ng Intel Core i7-8750H 2.2GHz
GeForce GTX 1060 Mobile
min:
24.3 fps, P0.1:
25.1 fps, P1:
27.1 fps, max:
50 fps
fps
100%
GeForce GTX 1060 Mobile:
30.5 [X] HP Omen 15-dc0006ng Intel Core i7-8750H 2.2GHz
GeForce GTX 1060 Mobile
min:
22.9 fps, P0.1:
23.3 fps, P1:
25.7 fps, max:
49.6 fps
fps
239%
GeForce GTX 1080 Ti:
72.9 [X] Asus Maximum XIII Hero Desktop MSI GTX 1080 Ti FE Intel Core i9-11900K 3.5GHz
GeForce GTX 1080 Ti
min:
47.3 fps, P0.1:
51.1 fps, P1:
62.8 fps, max:
168.4 fps
fps
GeForce GTX 1080 Ti:
49.5 [X] Asus Maximum XIII Hero Desktop MSI GTX 1080 Ti FE Intel Core i9-11900K 3.5GHz
GeForce GTX 1080 Ti
min:
36.6 fps, P0.1:
37.3 fps, P1:
41.2 fps, max:
76.7 fps
fps
GeForce GTX 1080 Ti:
25.6 [X] Asus Maximum XIII Hero Desktop MSI GTX 1080 Ti FE Intel Core i9-11900K 3.5GHz
GeForce GTX 1080 Ti
min:
19.7 fps, P0.1:
19.9 fps, P1:
22 fps, max:
37.4 fps
fps
100%
GeForce GTX 1060 Mobile:
96 [X] HP Omen 15-dc0006ng Intel Core i7-8750H 2.2GHz
GeForce GTX 1060 Mobile
min:
75 fps, max:
123 fps
fps
100%
GeForce GTX 1060 Mobile:
83 [X] HP Omen 15-dc0006ng Intel Core i7-8750H 2.2GHz
GeForce GTX 1060 Mobile
min:
69 fps, max:
96 fps
fps
100%
GeForce GTX 1060 Mobile:
63 [X] HP Omen 15-dc0006ng Intel Core i7-8750H 2.2GHz
GeForce GTX 1060 Mobile
min:
53 fps, max:
70 fps
fps
100%
GeForce GTX 1060 Mobile:
54 [X] HP Omen 15-dc0006ng Intel Core i7-8750H 2.2GHz
GeForce GTX 1060 Mobile
min:
46 fps, max:
64 fps
fps
100%
GeForce GTX 1060 Mobile:
91 [X] HP Omen 15-dc0006ng Intel Core i7-8750H 2.2GHz
GeForce GTX 1060 Mobile
min:
8.44 fps, P0.1:
18.5 fps, P1:
50 fps, max:
246 fps
fps
100%
GeForce GTX 1060 Mobile:
79.5 [X] HP Omen 15-dc0006ng Intel Core i7-8750H 2.2GHz
GeForce GTX 1060 Mobile
min:
30.1 fps, P0.1:
32.2 fps, P1:
50.4 fps, max:
237 fps
fps
100%
GeForce GTX 1060 Mobile:
68.9 [X] HP Omen 15-dc0006ng Intel Core i7-8750H 2.2GHz
GeForce GTX 1060 Mobile
min:
27.1 fps, P0.1:
35.2 fps, P1:
43.6 fps, max:
206 fps
fps
100%
GeForce GTX 1060 Mobile:
57.1 [X] HP Omen 15-dc0006ng Intel Core i7-8750H 2.2GHz
GeForce GTX 1060 Mobile
min:
13.6 fps, P0.1:
15.7 fps, P1:
31.4 fps, max:
226 fps
fps
100%
GeForce GTX 1060 Mobile:
26.6 [X] HP Omen 15-dc0006ng Intel Core i7-8750H 2.2GHz
GeForce GTX 1060 Mobile
min:
12.4 fps, P0.1:
13.2 fps, P1:
15.7 fps, max:
88.5 fps
fps
100%
GeForce GTX 1060 Mobile:
23.2 [X] HP Omen 15-dc0006ng Intel Core i7-8750H 2.2GHz
GeForce GTX 1060 Mobile
min:
10.3 fps, P0.1:
11.2 fps, P1:
12.2 fps, max:
75.1 fps
fps
100%
GeForce GTX 1060 Mobile:
22.1 [X] HP Omen 15-dc0006ng Intel Core i7-8750H 2.2GHz
GeForce GTX 1060 Mobile
min:
9.58 fps, P0.1:
10.3 fps, P1:
12 fps, max:
62.2 fps
fps
100%
GeForce GTX 1060 Mobile:
20.4 [X] HP Omen 15-dc0006ng Intel Core i7-8750H 2.2GHz
GeForce GTX 1060 Mobile
min:
9.85 fps, P0.1:
10.6 fps, P1:
12.1 fps, max:
65.3 fps
fps
100%
GeForce GTX 1060 Mobile:
100.9 [X] HP Omen 15-dc0006ng Intel Core i7-8750H 2.2GHz
GeForce GTX 1060 Mobile
min:
37.9 fps, P0.1:
39.1 fps, P1:
64.8 fps, max:
186.3 fps
fps
100%
GeForce GTX 1060 Mobile:
82.8 [X] HP Omen 15-dc0006ng Intel Core i7-8750H 2.2GHz
GeForce GTX 1060 Mobile
min:
29.9 fps, P0.1:
32.4 fps, P1:
43.9 fps, max:
151.1 fps
fps
100%
GeForce GTX 1060 Mobile:
55.2 [X] HP Omen 15-dc0006ng Intel Core i7-8750H 2.2GHz
GeForce GTX 1060 Mobile
min:
21.8 fps, P0.1:
22.6 fps, P1:
24.6 fps, max:
162.4 fps
fps
100%
GeForce GTX 1060 Mobile:
42.8 [X] HP Omen 15-dc0006ng Intel Core i7-8750H 2.2GHz
GeForce GTX 1060 Mobile
min:
8.97 fps, P0.1:
12.5 fps, P1:
18.9 fps, max:
126.2 fps
fps
100%
GeForce GTX 1060 Mobile:
32.3 [X] HP Omen 15-dc0006ng Intel Core i7-8750H 2.2GHz
GeForce GTX 1060 Mobile
min:
15 fps, P0.1:
17.6 fps, P1:
20.5 fps, max:
61.4 fps
fps
100%
GeForce GTX 1060 Mobile:
25.6 [X] HP Omen 15-dc0006ng Intel Core i7-8750H 2.2GHz
GeForce GTX 1060 Mobile
min:
10.7 fps, P0.1:
12 fps, P1:
16.3 fps, max:
41.9 fps
fps
100%
GeForce GTX 1060 Mobile:
21.9 [X] HP Omen 15-dc0006ng Intel Core i7-8750H 2.2GHz
GeForce GTX 1060 Mobile
min:
6.98 fps, P0.1:
9.93 fps, P1:
13.9 fps, max:
34.7 fps
fps
100%
GeForce GTX 1060 Mobile:
17.3 [X] HP Omen 15-dc0006ng Intel Core i7-8750H 2.2GHz
GeForce GTX 1060 Mobile
min:
2.06 fps, P0.1:
5.28 fps, P1:
11.9 fps, max:
28.6 fps
fps
100%
GeForce GTX 1060 Mobile:
47 [X] HP Omen 15-dc0006ng Intel Core i7-8750H 2.2GHz
GeForce GTX 1060 Mobile
min:
11.5 fps, P0.1:
24.4 fps, P1:
28.8 fps, max:
82.3 fps
fps
100%
GeForce GTX 1060 Mobile:
34.9 [X] HP Omen 15-dc0006ng Intel Core i7-8750H 2.2GHz
GeForce GTX 1060 Mobile
min:
13.7 fps, P0.1:
24.6 fps, P1:
27 fps, max:
53.3 fps
fps
100%
GeForce GTX 1060 Mobile:
31.9 [X] HP Omen 15-dc0006ng Intel Core i7-8750H 2.2GHz
GeForce GTX 1060 Mobile
min:
20.1 fps, P0.1:
22.6 fps, P1:
25.2 fps, max:
47 fps
fps
100%
GeForce GTX 1060 Mobile:
26.3 [X] HP Omen 15-dc0006ng Intel Core i7-8750H 2.2GHz
GeForce GTX 1060 Mobile
min:
15.2 fps, P0.1:
16.8 fps, P1:
18.6 fps, max:
38.5 fps
fps
100%
GeForce GTX 1060 Mobile:
67.7 [X] HP Omen 15-dc0006ng Intel Core i7-8750H 2.2GHz
GeForce GTX 1060 Mobile
P0.1:
27.4 fpsP1:
33.1 fps
fps
100%
GeForce GTX 1060 Mobile:
59.3 [X] HP Omen 15-dc0006ng Intel Core i7-8750H 2.2GHz
GeForce GTX 1060 Mobile
P0.1:
25.3 fpsP1:
28.9 fps
fps
100%
GeForce GTX 1060 Mobile:
45.8 [X] HP Omen 15-dc0006ng Intel Core i7-8750H 2.2GHz
GeForce GTX 1060 Mobile
P0.1:
21.1 fpsP1:
24.1 fps
fps
100%
GeForce GTX 1060 Mobile:
46.5 [X] HP Omen 15-dc0006ng Intel Core i7-8750H 2.2GHz
GeForce GTX 1060 Mobile
P0.1:
22.5 fpsP1:
25.8 fps
fps
100%
GeForce GTX 1060 Mobile:
48.2 [X] HP Omen 15-dc0006ng Intel Core i7-8750H 2.2GHz
GeForce GTX 1060 Mobile
min:
16.3 fps, P0.1:
20.3 fps, P1:
31.7 fps, max:
85.2 fps
fps
100%
GeForce GTX 1060 Mobile:
35 [X] HP Omen 15-dc0006ng Intel Core i7-8750H 2.2GHz
GeForce GTX 1060 Mobile
min:
2.92 fps, P0.1:
4.96 fps, P1:
19.7 fps, max:
64.7 fps
fps
100%
GeForce GTX 1060 Mobile:
34.5 [X] HP Omen 15-dc0006ng Intel Core i7-8750H 2.2GHz
GeForce GTX 1060 Mobile
min:
11.9 fps, P0.1:
14 fps, P1:
22.9 fps, max:
58 fps
fps
100%
GeForce GTX 1060 Mobile:
33.9 [X] HP Omen 15-dc0006ng Intel Core i7-8750H 2.2GHz
GeForce GTX 1060 Mobile
min:
12.5 fps, P0.1:
13.4 fps, P1:
22.4 fps, max:
59.3 fps
fps
100%
GeForce GTX 1060 Mobile:
72.9 [X] HP Omen 15-dc0006ng Intel Core i7-8750H 2.2GHz
GeForce GTX 1060 Mobile
min:
28.7 fps, P0.1:
31.5 fps, P1:
40.5 fps, max:
149.6 fps
fps
100%
GeForce GTX 1060 Mobile:
51.3 [X] HP Omen 15-dc0006ng Intel Core i7-8750H 2.2GHz
GeForce GTX 1060 Mobile
min:
20.3 fps, P0.1:
22.8 fps, P1:
25.2 fps, max:
130.1 fps
fps
100%
GeForce GTX 1060 Mobile:
31.9 [X] HP Omen 15-dc0006ng Intel Core i7-8750H 2.2GHz
GeForce GTX 1060 Mobile
min:
16.8 fps, P0.1:
17.2 fps, P1:
19.5 fps, max:
96.1 fps
fps
100%
GeForce GTX 1060 Mobile:
25.8 [X] HP Omen 15-dc0006ng Intel Core i7-8750H 2.2GHz
GeForce GTX 1060 Mobile
min:
13.6 fps, P0.1:
16.1 fps, P1:
19 fps, max:
54.8 fps
fps
100%
GeForce GTX 1060 Mobile:
40 [X] HP Omen 15-dc0006ng Intel Core i7-8750H 2.2GHz
GeForce GTX 1060 Mobile
min:
20 fps, max:
80 fps
fps
100%
GeForce GTX 1060 Mobile:
39 [X] HP Omen 15-dc0006ng Intel Core i7-8750H 2.2GHz
GeForce GTX 1060 Mobile
min:
21 fps, max:
88 fps
fps
100%
GeForce GTX 1060 Mobile:
34 [X] HP Omen 15-dc0006ng Intel Core i7-8750H 2.2GHz
GeForce GTX 1060 Mobile
min:
17 fps, max:
71 fps
fps
100%
GeForce GTX 1060 Mobile:
28 [X] HP Omen 15-dc0006ng Intel Core i7-8750H 2.2GHz
GeForce GTX 1060 Mobile
min:
12 fps, max:
50 fps
fps
100%
GeForce GTX 1060 Mobile:
48.2 [X] HP Omen 15-dc0006ng Intel Core i7-8750H 2.2GHz
GeForce GTX 1060 Mobile
min:
14.9 fps, P0.1:
16.5 fps, P1:
19.3 fps, max:
98.8 fps
fps
100%
GeForce GTX 1060 Mobile:
35.1 [X] HP Omen 15-dc0006ng Intel Core i7-8750H 2.2GHz
GeForce GTX 1060 Mobile
min:
11.6 fps, P0.1:
12.9 fps, P1:
14.6 fps, max:
89.2 fps
fps
100%
GeForce GTX 1060 Mobile:
27.1 [X] HP Omen 15-dc0006ng Intel Core i7-8750H 2.2GHz
GeForce GTX 1060 Mobile
min:
8.81 fps, P0.1:
9.94 fps, P1:
11.6 fps, max:
71.1 fps
fps
100%
GeForce GTX 1060 Mobile:
20.9 [X] HP Omen 15-dc0006ng Intel Core i7-8750H 2.2GHz
GeForce GTX 1060 Mobile
min:
5.88 fps, P0.1:
6.01 fps, P1:
9.01 fps, max:
61.8 fps
fps
100%
GeForce GTX 1060 Mobile:
25.3 [X] HP Omen 15-dc0006ng Intel Core i7-8750H 2.2GHz
GeForce GTX 1060 Mobile
min:
10 fps, P0.1:
10.4 fps, P1:
11.4 fps, max:
127.1 fps
fps
100%
GeForce GTX 1060 Mobile:
23.1 [X] HP Omen 15-dc0006ng Intel Core i7-8750H 2.2GHz
GeForce GTX 1060 Mobile
min:
9.51 fps, P0.1:
9.55 fps, P1:
10.3 fps, max:
83.3 fps
fps
100%
GeForce GTX 1060 Mobile:
19.7 [X] HP Omen 15-dc0006ng Intel Core i7-8750H 2.2GHz
GeForce GTX 1060 Mobile
fps
100%
GeForce GTX 1060 Mobile:
19.6 [X] HP Omen 15-dc0006ng Intel Core i7-8750H 2.2GHz
GeForce GTX 1060 Mobile
min:
9.12 fps, P0.1:
9.18 fps, P1:
9.44 fps, max:
83.5 fps
fps
100%
GeForce GTX 1060 Mobile:
85.2 [X] HP Omen 15-dc0006ng Intel Core i7-8750H 2.2GHz
GeForce GTX 1060 Mobile
min:
6.74 fps, P0.1:
23.3 fps, P1:
33.6 fps, max:
162.8 fps
fps
100%
GeForce GTX 1060 Mobile:
28.9 [X] HP Omen 15-dc0006ng Intel Core i7-8750H 2.2GHz
GeForce GTX 1060 Mobile
min:
7.85 fps, P0.1:
15.9 fps, P1:
19.3 fps, max:
104.2 fps
fps
100%
GeForce GTX 1060 Mobile:
26.8 [X] HP Omen 15-dc0006ng Intel Core i7-8750H 2.2GHz
GeForce GTX 1060 Mobile
min:
7.4 fps, P0.1:
16.9 fps, P1:
18.5 fps, max:
112.7 fps
fps
100%
GeForce GTX 1060 Mobile:
23.7 [X] HP Omen 15-dc0006ng Intel Core i7-8750H 2.2GHz
GeForce GTX 1060 Mobile
min:
7.45 fps, P0.1:
8.86 fps, P1:
16 fps, max:
101.8 fps
fps
100%
GeForce GTX 1060 Mobile:
103.7 [X] HP Omen 15-dc0006ng Intel Core i7-8750H 2.2GHz
GeForce GTX 1060 Mobile
min:
25.7 fps, P0.1:
30.1 fps, P1:
45 fps, max:
199.2 fps
fps
100%
GeForce GTX 1060 Mobile:
59.7 [X] HP Omen 15-dc0006ng Intel Core i7-8750H 2.2GHz
GeForce GTX 1060 Mobile
min:
21.5 fps, P0.1:
22.3 fps, P1:
25.4 fps, max:
198.9 fps
fps
100%
GeForce GTX 1060 Mobile:
47.8 [X] HP Omen 15-dc0006ng Intel Core i7-8750H 2.2GHz
GeForce GTX 1060 Mobile
min:
19.1 fps, P0.1:
19.2 fps, P1:
21.4 fps, max:
180.2 fps
fps
100%
GeForce GTX 1060 Mobile:
38.1 [X] HP Omen 15-dc0006ng Intel Core i7-8750H 2.2GHz
GeForce GTX 1060 Mobile
min:
15.1 fps, P0.1:
16.9 fps, P1:
18.9 fps, max:
147.7 fps
fps
100%
GeForce GTX 1060 Mobile:
64.3 [X] HP Omen 15-dc0006ng Intel Core i7-8750H 2.2GHz
GeForce GTX 1060 Mobile
fps
100%
GeForce GTX 1060 Mobile:
42.9 [X] HP Omen 15-dc0006ng Intel Core i7-8750H 2.2GHz
GeForce GTX 1060 Mobile
fps
100%
GeForce GTX 1060 Mobile:
40.5 [X] HP Omen 15-dc0006ng Intel Core i7-8750H 2.2GHz
GeForce GTX 1060 Mobile
fps
100%
GeForce GTX 1060 Mobile:
25.7 [X] HP Omen 15-dc0006ng Intel Core i7-8750H 2.2GHz
GeForce GTX 1060 Mobile
fps
100%
GeForce GTX 1060 Mobile:
51.9 [X] HP Omen 15-dc0006ng Intel Core i7-8750H 2.2GHz
GeForce GTX 1060 Mobile
min:
17.7 fps, P0.1:
20.4 fps, P1:
24.2 fps, max:
111.9 fps
fps
100%
GeForce GTX 1060 Mobile:
44.6 [X] HP Omen 15-dc0006ng Intel Core i7-8750H 2.2GHz
GeForce GTX 1060 Mobile
min:
18.8 fps, P0.1:
19 fps, P1:
20.7 fps, max:
116 fps
fps
100%
GeForce GTX 1060 Mobile:
35.4 [X] HP Omen 15-dc0006ng Intel Core i7-8750H 2.2GHz
GeForce GTX 1060 Mobile
min:
14.9 fps, P0.1:
15.4 fps, P1:
17 fps, max:
84.2 fps
fps
100%
GeForce GTX 1060 Mobile:
29.5 [X] HP Omen 15-dc0006ng Intel Core i7-8750H 2.2GHz
GeForce GTX 1060 Mobile
min:
9.23 fps, P0.1:
13.2 fps, P1:
14.9 fps, max:
77.2 fps
fps
100%
GeForce GTX 1060 Mobile:
50.7 [X] HP Omen 15-dc0006ng Intel Core i7-8750H 2.2GHz
GeForce GTX 1060 Mobile
min:
31.5 fps, P0.1:
32.7 fps, P1:
38.2 fps, max:
94.6 fps
fps
100%
GeForce GTX 1060 Mobile:
45.7 [X] HP Omen 15-dc0006ng Intel Core i7-8750H 2.2GHz
GeForce GTX 1060 Mobile
min:
27.1 fps, P0.1:
28.5 fps, P1:
35.5 fps, max:
78 fps
fps
100%
GeForce GTX 1060 Mobile:
43.6 [X] HP Omen 15-dc0006ng Intel Core i7-8750H 2.2GHz
GeForce GTX 1060 Mobile
min:
28.8 fps, P0.1:
29.3 fps, P1:
33.8 fps, max:
83.8 fps
fps
100%
GeForce GTX 1060 Mobile:
38.9 [X] HP Omen 15-dc0006ng Intel Core i7-8750H 2.2GHz
GeForce GTX 1060 Mobile
min:
22.4 fps, P0.1:
23.9 fps, P1:
28.1 fps, max:
68.7 fps
fps
100%
GeForce GTX 1060 Mobile:
50 [X] HP Omen 15-dc0006ng Intel Core i7-8750H 2.2GHz
GeForce GTX 1060 Mobile
min:
29 fps
fps
100%
GeForce GTX 1060 Mobile:
45 [X] HP Omen 15-dc0006ng Intel Core i7-8750H 2.2GHz
GeForce GTX 1060 Mobile
min:
26 fps
fps
100%
GeForce GTX 1060 Mobile:
34 [X] HP Omen 15-dc0006ng Intel Core i7-8750H 2.2GHz
GeForce GTX 1060 Mobile
min:
15 fps
fps
100%
GeForce GTX 1060 Mobile:
35 [X] HP Omen 15-dc0006ng Intel Core i7-8750H 2.2GHz
GeForce GTX 1060 Mobile
min:
16 fps
fps
217%
GeForce GTX 1080 Ti:
76 [X] Asus Maximum XIII Hero Desktop MSI GTX 1080 Ti FE Intel Core i9-11900K 3.5GHz
GeForce GTX 1080 Ti
min:
40 fps
fps
GeForce GTX 1080 Ti:
53 [X] Asus Maximum XIII Hero Desktop MSI GTX 1080 Ti FE Intel Core i9-11900K 3.5GHz
GeForce GTX 1080 Ti
min:
25 fps
fps
GeForce GTX 1080 Ti:
32 [X] Asus Maximum XIII Hero Desktop MSI GTX 1080 Ti FE Intel Core i9-11900K 3.5GHz
GeForce GTX 1080 Ti
min:
14 fps
fps
100%
GeForce GTX 1060 Mobile:
33.1 [X] HP Omen 15-dc0006ng Intel Core i7-8750H 2.2GHz
GeForce GTX 1060 Mobile
min:
24.5 fps, P0.1:
26.9 fps, P1:
30 fps, max:
44 fps
fps
100%
GeForce GTX 1060 Mobile:
29.1 [X] HP Omen 15-dc0006ng Intel Core i7-8750H 2.2GHz
GeForce GTX 1060 Mobile
min:
15 fps, P0.1:
15.5 fps, P1:
16.4 fps, max:
56.1 fps
fps
100%
GeForce GTX 1060 Mobile:
29.1 [X] HP Omen 15-dc0006ng Intel Core i7-8750H 2.2GHz
GeForce GTX 1060 Mobile
min:
15.1 fps, P0.1:
15.3 fps, P1:
17.4 fps, max:
62.9 fps
fps
100%
GeForce GTX 1060 Mobile:
27.6 [X] HP Omen 15-dc0006ng Intel Core i7-8750H 2.2GHz
GeForce GTX 1060 Mobile
min:
13.2 fps, P0.1:
13.4 fps, P1:
16.3 fps, max:
72.8 fps
fps
100%
GeForce GTX 1060 Mobile:
41.1 [X] HP Omen 15-dc0006ng Intel Core i7-8750H 2.2GHz
GeForce GTX 1060 Mobile
min:
13.9 fps, P0.1:
15.3 fps, P1:
19.9 fps, max:
127.3 fps
fps
100%
GeForce GTX 1060 Mobile:
33.1 [X] HP Omen 15-dc0006ng Intel Core i7-8750H 2.2GHz
GeForce GTX 1060 Mobile
min:
13.2 fps, P0.1:
13.2 fps, P1:
17.4 fps, max:
95.9 fps
fps
100%
GeForce GTX 1060 Mobile:
27.9 [X] HP Omen 15-dc0006ng Intel Core i7-8750H 2.2GHz
GeForce GTX 1060 Mobile
min:
12.7 fps, P0.1:
15.4 fps, P1:
17.8 fps, max:
80 fps
fps
100%
GeForce GTX 1060 Mobile:
24 [X] HP Omen 15-dc0006ng Intel Core i7-8750H 2.2GHz
GeForce GTX 1060 Mobile
min:
9.95 fps, P0.1:
12.1 fps, P1:
16 fps, max:
63.2 fps
fps
100%
GeForce GTX 1060 Mobile:
99.3 [X] HP Omen 15-dc0006ng Intel Core i7-8750H 2.2GHz
GeForce GTX 1060 Mobile
min:
33.4 fps, P0.1:
37.8 fps, P1:
51.6 fps, max:
179.9 fps
fps
100%
GeForce GTX 1060 Mobile:
57.7 [X] HP Omen 15-dc0006ng Intel Core i7-8750H 2.2GHz
GeForce GTX 1060 Mobile
min:
14.2 fps, P0.1:
24.2 fps, P1:
39.7 fps, max:
121.1 fps
fps
100%
GeForce GTX 1060 Mobile:
43.4 [X] HP Omen 15-dc0006ng Intel Core i7-8750H 2.2GHz
GeForce GTX 1060 Mobile
min:
20.4 fps, P0.1:
21.5 fps, P1:
29.9 fps, max:
108.1 fps
fps
100%
GeForce GTX 1060 Mobile:
35.6 [X] HP Omen 15-dc0006ng Intel Core i7-8750H 2.2GHz
GeForce GTX 1060 Mobile
min:
15.2 fps, P0.1:
15.8 fps, P1:
25.4 fps, max:
98.9 fps
fps
100%
GeForce GTX 1060 Mobile:
25.8 [X] HP Omen 15-dc0006ng Intel Core i7-8750H 2.2GHz
GeForce GTX 1060 Mobile
min:
11.2 fps, P0.1:
11.6 fps, P1:
14.5 fps, max:
57.3 fps
fps
100%
GeForce GTX 1060 Mobile:
112.7 [X] HP Omen 15-dc0006ng 959964
Intel Core i7-8750H 2.2GHz
GeForce GTX 1060 Mobile
min:
95 fps, P1:
49 fps, max:
129 fps
fps
100%
GeForce GTX 1060 Mobile:
102 [X] HP Omen 15-dc0006ng 959964
Intel Core i7-8750H 2.2GHz
GeForce GTX 1060 Mobile
min:
88 fps, P1:
44 fps, max:
119 fps
fps
100%
GeForce GTX 1060 Mobile:
74 [X] HP Omen 15-dc0006ng 959964
Intel Core i7-8750H 2.2GHz
GeForce GTX 1060 Mobile
min:
62 fps, P1:
35 fps, max:
84 fps
fps
100%
GeForce GTX 1060 Mobile:
52.7 [X] HP Omen 15-dc0006ng 959964
Intel Core i7-8750H 2.2GHz
GeForce GTX 1060 Mobile
min:
44 fps, P1:
27 fps, max:
63 fps
fps
100%
GeForce GTX 1060 Mobile:
126.7 [X] HP Omen 15-dc0006ng Intel Core i7-8750H 2.2GHz
GeForce GTX 1060 Mobile
min:
14.4 fps, P0.1:
55.6 fps, P1:
79.8 fps, max:
254 fps
fps
100%
GeForce GTX 1060 Mobile:
92.2 [X] HP Omen 15-dc0006ng Intel Core i7-8750H 2.2GHz
GeForce GTX 1060 Mobile
min:
11.2 fps, P0.1:
15.8 fps, P1:
63.5 fps, max:
181.9 fps
fps
100%
GeForce GTX 1060 Mobile:
76.7 [X] HP Omen 15-dc0006ng Intel Core i7-8750H 2.2GHz
GeForce GTX 1060 Mobile
min:
6.5 fps, P0.1:
25.1 fps, P1:
54.2 fps, max:
149.4 fps
fps
100%
GeForce GTX 1060 Mobile:
70.2 [X] HP Omen 15-dc0006ng Intel Core i7-8750H 2.2GHz
GeForce GTX 1060 Mobile
min:
27.2 fps, P0.1:
31.6 fps, P1:
51.9 fps, max:
138 fps
fps
100%
GeForce GTX 1060 Mobile:
66.2 [X] HP Omen 15-dc0006ng Intel Core i7-8750H 2.2GHz
GeForce GTX 1060 Mobile
min:
21.2 fps, P0.1:
24.1 fps, P1:
29.2 fps, max:
162.6 fps
fps
100%
GeForce GTX 1060 Mobile:
53.7 [X] HP Omen 15-dc0006ng Intel Core i7-8750H 2.2GHz
GeForce GTX 1060 Mobile
min:
20.6 fps, P0.1:
21.8 fps, P1:
24.6 fps, max:
146 fps
fps
100%
GeForce GTX 1060 Mobile:
52.2 [X] HP Omen 15-dc0006ng Intel Core i7-8750H 2.2GHz
GeForce GTX 1060 Mobile
min:
17.1 fps, P0.1:
20.2 fps, P1:
24.3 fps, max:
173.8 fps
fps
100%
GeForce GTX 1060 Mobile:
51.6 [X] HP Omen 15-dc0006ng Intel Core i7-8750H 2.2GHz
GeForce GTX 1060 Mobile
min:
21.2 fps, P0.1:
22.2 fps, P1:
24.8 fps, max:
149.6 fps
fps
100%
GeForce GTX 1060 Mobile:
71.6 [X] HP Omen 15-dc0006ng Intel Core i7-8750H 2.2GHz
GeForce GTX 1060 Mobile
fps
100%
GeForce GTX 1060 Mobile:
57.4 [X] HP Omen 15-dc0006ng Intel Core i7-8750H 2.2GHz
GeForce GTX 1060 Mobile
fps
100%
GeForce GTX 1060 Mobile:
39.8 [X] HP Omen 15-dc0006ng Intel Core i7-8750H 2.2GHz
GeForce GTX 1060 Mobile
fps
100%
GeForce GTX 1060 Mobile:
31.9 [X] HP Omen 15-dc0006ng Intel Core i7-8750H 2.2GHz
GeForce GTX 1060 Mobile
fps
100%
GeForce GTX 1060 Mobile:
37.3 [X] HP Omen 15-dc0006ng Intel Core i7-8750H 2.2GHz
GeForce GTX 1060 Mobile
min:
19 fps, max:
55 fps
fps
100%
GeForce GTX 1060 Mobile:
29.5 [X] HP Omen 15-dc0006ng Intel Core i7-8750H 2.2GHz
GeForce GTX 1060 Mobile
min:
16.9 fps, max:
40.5 fps
fps
100%
GeForce GTX 1060 Mobile:
25 [X] HP Omen 15-dc0006ng Intel Core i7-8750H 2.2GHz
GeForce GTX 1060 Mobile
min:
18.8 fps, max:
38.4 fps
fps
100%
GeForce GTX 1060 Mobile:
22.7 [X] HP Omen 15-dc0006ng Intel Core i7-8750H 2.2GHz
GeForce GTX 1060 Mobile
min:
17.3 fps, max:
31.8 fps
fps
100%
GeForce GTX 1060 Mobile:
63 [X] HP Omen 15-dc0006ng Intel Core i7-8750H 2.2GHz
GeForce GTX 1060 Mobile
min:
20.6 fps, P0.1:
22 fps, P1:
25.7 fps, max:
134.9 fps
fps
100%
GeForce GTX 1060 Mobile:
52.6 [X] HP Omen 15-dc0006ng Intel Core i7-8750H 2.2GHz
GeForce GTX 1060 Mobile
min:
20.2 fps, P0.1:
20.6 fps, P1:
25.2 fps, max:
119.3 fps
fps
100%
GeForce GTX 1060 Mobile:
44.9 [X] HP Omen 15-dc0006ng Intel Core i7-8750H 2.2GHz
GeForce GTX 1060 Mobile
min:
17.1 fps, P0.1:
19.1 fps, P1:
22.7 fps, max:
101.1 fps
fps
100%
GeForce GTX 1060 Mobile:
37.3 [X] HP Omen 15-dc0006ng Intel Core i7-8750H 2.2GHz
GeForce GTX 1060 Mobile
min:
16.3 fps, P0.1:
19 fps, P1:
21.2 fps, max:
88.2 fps
fps
100%
GeForce GTX 1060 Mobile:
88.5 [X] HP Omen 15-dc0006ng Intel Core i7-8750H 2.2GHz
GeForce GTX 1060 Mobile
min:
50.8 fps, max:
149.1 fps
fps
100%
GeForce GTX 1060 Mobile:
75.7 [X] HP Omen 15-dc0006ng Intel Core i7-8750H 2.2GHz
GeForce GTX 1060 Mobile
min:
46 fps, max:
118.1 fps
fps
100%
GeForce GTX 1060 Mobile:
68.6 [X] HP Omen 15-dc0006ng Intel Core i7-8750H 2.2GHz
GeForce GTX 1060 Mobile
min:
46.5 fps, max:
89.4 fps
fps
100%
GeForce GTX 1060 Mobile:
51.3 [X] HP Omen 15-dc0006ng Intel Core i7-8750H 2.2GHz
GeForce GTX 1060 Mobile
min:
40.1 fps, max:
69.9 fps
fps
100%
GeForce GTX 1060 Mobile:
58 [X] HP Omen 15-dc0006ng Intel Core i7-8750H 2.2GHz
GeForce GTX 1060 Mobile
min:
25.2 fps, P0.1:
31.7 fps, P1:
41.1 fps, max:
72.5 fps
fps
100%
GeForce GTX 1060 Mobile:
56.9 [X] HP Omen 15-dc0006ng Intel Core i7-8750H 2.2GHz
GeForce GTX 1060 Mobile
min:
23.4 fps, P0.1:
26.8 fps, P1:
38.9 fps, max:
73.1 fps
fps
100%
GeForce GTX 1060 Mobile:
54.2 [X] HP Omen 15-dc0006ng Intel Core i7-8750H 2.2GHz
GeForce GTX 1060 Mobile
min:
18.3 fps, P0.1:
21.8 fps, P1:
32.1 fps, max:
72.9 fps
fps
100%
GeForce GTX 1060 Mobile:
48.4 [X] HP Omen 15-dc0006ng Intel Core i7-8750H 2.2GHz
GeForce GTX 1060 Mobile
min:
19.8 fps, P0.1:
20.8 fps, P1:
31.6 fps, max:
71.4 fps
fps
100%
GeForce GTX 1060 Mobile:
40.3 [X] HP Omen 15-dc0006ng Intel Core i7-8750H 2.2GHz
GeForce GTX 1060 Mobile
min:
24.3 fps, P0.1:
25.2 fps, P1:
28.2 fps, max:
101.3 fps
fps
100%
GeForce GTX 1060 Mobile:
34 [X] HP Omen 15-dc0006ng Intel Core i7-8750H 2.2GHz
GeForce GTX 1060 Mobile
min:
22.6 fps, P0.1:
23.4 fps, P1:
26.1 fps, max:
60.4 fps
fps
100%
GeForce GTX 1060 Mobile:
29.1 [X] HP Omen 15-dc0006ng Intel Core i7-8750H 2.2GHz
GeForce GTX 1060 Mobile
min:
17.9 fps, P0.1:
18.4 fps, P1:
20.8 fps, max:
64 fps
fps
100%
GeForce GTX 1060 Mobile:
98 [X] HP Omen 15-dc0006ng Intel Core i7-8750H 2.2GHz
GeForce GTX 1060 Mobile
min:
68 fps, max:
122 fps
fps
100%
GeForce GTX 1060 Mobile:
76 [X] HP Omen 15-dc0006ng Intel Core i7-8750H 2.2GHz
GeForce GTX 1060 Mobile
min:
54 fps, max:
94 fps
fps
100%
GeForce GTX 1060 Mobile:
64 [X] HP Omen 15-dc0006ng Intel Core i7-8750H 2.2GHz
GeForce GTX 1060 Mobile
min:
40 fps, max:
83 fps
fps
100%
GeForce GTX 1060 Mobile:
54 [X] HP Omen 15-dc0006ng Intel Core i7-8750H 2.2GHz
GeForce GTX 1060 Mobile
min:
31 fps, max:
69 fps
fps
100%
GeForce GTX 1060 Mobile:
52.6 [X] HP Omen 15-dc0006ng Intel Core i7-8750H 2.2GHz
GeForce GTX 1060 Mobile
min:
20.5 fps, P0.1:
31 fps, P1:
40.3 fps, max:
135.2 fps
fps
100%
GeForce GTX 1060 Mobile:
42.8 [X] HP Omen 15-dc0006ng Intel Core i7-8750H 2.2GHz
GeForce GTX 1060 Mobile
min:
25.2 fps, P0.1:
29.2 fps, P1:
35.2 fps, max:
68.3 fps
fps
100%
GeForce GTX 1060 Mobile:
34.3 [X] HP Omen 15-dc0006ng Intel Core i7-8750H 2.2GHz
GeForce GTX 1060 Mobile
min:
24.4 fps, P0.1:
25.6 fps, P1:
28.2 fps, max:
54.5 fps
fps
100%
GeForce GTX 1060 Mobile:
24.2 [X] HP Omen 15-dc0006ng Intel Core i7-8750H 2.2GHz
GeForce GTX 1060 Mobile
min:
19 fps, P0.1:
19.3 fps, P1:
20.1 fps, max:
36.9 fps
fps
100%
GeForce GTX 1060 Mobile:
52.1 [X] MSI GT62VR Intel Core i7-6820HK 2.7GHz
GeForce GTX 1060 Mobile
min:
26.1 fps, P0.1:
31.5 fps, P1:
37.5 fps, max:
157 fps
fps
100%
GeForce GTX 1060 Mobile:
45.8 [X] MSI GT62VR Intel Core i7-6820HK 2.7GHz
GeForce GTX 1060 Mobile
min:
25 fps, P0.1:
28.2 fps, P1:
33.7 fps, max:
145 fps
fps
100%
GeForce GTX 1060 Mobile:
42.7 [X] MSI GT62VR Intel Core i7-6820HK 2.7GHz
GeForce GTX 1060 Mobile
min:
24.1 fps, P0.1:
28.3 fps, P1:
32.4 fps, max:
125 fps
fps
100%
GeForce GTX 1060 Mobile:
143 [X] MSI GT62VR Intel Core i7-6820HK 2.7GHz
GeForce GTX 1060 Mobile
min:
13 fps, P0.1:
21.5 fps, P1:
38.3 fps, max:
189 fps
fps
100%
GeForce GTX 1060 Mobile:
111 [X] MSI GT62VR Intel Core i7-6820HK 2.7GHz
GeForce GTX 1060 Mobile
min:
10.1 fps, P0.1:
22 fps, P1:
29.4 fps, max:
150 fps
fps
100%
GeForce GTX 1060 Mobile:
86.4 [X] MSI GT62VR Intel Core i7-6820HK 2.7GHz
GeForce GTX 1060 Mobile
min:
15.7 fps, P0.1:
53 fps, P1:
63.6 fps, max:
119 fps
fps
100%
GeForce GTX 1060 Mobile:
69.8 [X] MSI GT62VR Intel Core i7-6820HK 2.7GHz
GeForce GTX 1060 Mobile
min:
13 fps, P0.1:
19.6 fps, P1:
49.8 fps, max:
106 fps
fps
100%
GeForce GTX 1060 Mobile:
86.4 [X] MSI GT62VR Intel Core i7-6820HK 2.7GHz
GeForce GTX 1060 Mobile
min:
16.9 fps, P0.1:
33.8 fps, P1:
58.4 fps, max:
121 fps
fps
100%
GeForce GTX 1060 Mobile:
61.3 [X] MSI GT62VR Intel Core i7-6820HK 2.7GHz
GeForce GTX 1060 Mobile
min:
29 fps, P0.1:
36.6 fps, P1:
44.9 fps, max:
109 fps
fps
100%
GeForce GTX 1060 Mobile:
50.2 [X] MSI GT62VR Intel Core i7-6820HK 2.7GHz
GeForce GTX 1060 Mobile
min:
21.4 fps, P0.1:
28.7 fps, P1:
35.5 fps, max:
102 fps
fps
100%
GeForce GTX 1060 Mobile:
44.2 [X] MSI GT62VR Intel Core i7-6820HK 2.7GHz
GeForce GTX 1060 Mobile
min:
26.4 fps, P0.1:
27.5 fps, P1:
31.5 fps, max:
82.7 fps
fps
100%
GeForce GTX 1060 Mobile:
107 [X] HP Omen 15-dc0006ng Intel Core i7-8750H 2.2GHz
GeForce GTX 1060 Mobile
114 [X] MSI GT62VR Intel Core i7-6820HK 2.7GHz
GeForce GTX 1060 Mobile
~ 111 fps
100%
GeForce GTX 1060 Mobile:
64 [X] HP Omen 15-dc0006ng Intel Core i7-8750H 2.2GHz
GeForce GTX 1060 Mobile
73 [X] MSI GT62VR Intel Core i7-6820HK 2.7GHz
GeForce GTX 1060 Mobile
~ 69 fps
100%
GeForce GTX 1060 Mobile:
57 [X] HP Omen 15-dc0006ng Intel Core i7-8750H 2.2GHz
GeForce GTX 1060 Mobile
65 [X] MSI GT62VR Intel Core i7-6820HK 2.7GHz
GeForce GTX 1060 Mobile
~ 61 fps
100%
GeForce GTX 1060 Mobile:
22 [X] HP Omen 15-dc0006ng Intel Core i7-8750H 2.2GHz
GeForce GTX 1060 Mobile
31 [X] MSI GT62VR Intel Core i7-6820HK 2.7GHz
GeForce GTX 1060 Mobile
~ 27 fps
100%
GeForce GTX 1060 Mobile:
72.6 [X] MSI GT62VR Intel Core i7-6820HK 2.7GHz
GeForce GTX 1060 Mobile
min:
48.9 fps, P0.1:
53.1 fps, P1:
57.3 fps, max:
176 fps
fps
100%
GeForce GTX 1060 Mobile:
56.1 [X] MSI GT62VR Intel Core i7-6820HK 2.7GHz
GeForce GTX 1060 Mobile
min:
38.7 fps, P0.1:
41.9 fps, P1:
44.8 fps, max:
92.6 fps
fps
100%
GeForce GTX 1060 Mobile:
41.1 [X] MSI GT62VR Intel Core i7-6820HK 2.7GHz
GeForce GTX 1060 Mobile
min:
10.1 fps, P0.1:
30.9 fps, P1:
33.6 fps, max:
75.4 fps
fps
100%
GeForce GTX 1060 Mobile:
36.6 [X] MSI GT62VR Intel Core i7-6820HK 2.7GHz
GeForce GTX 1060 Mobile
min:
27.3 fps, P0.1:
28.8 fps, P1:
30.7 fps, max:
53.6 fps
fps
100%
GeForce GTX 1060 Mobile:
119 [X] MSI GT62VR Intel Core i7-6820HK 2.7GHz
GeForce GTX 1060 Mobile
min:
81 fps, max:
164 fps
fps
100%
GeForce GTX 1060 Mobile:
67 [X] MSI GT62VR Intel Core i7-6820HK 2.7GHz
GeForce GTX 1060 Mobile
min:
54 fps, max:
83 fps
fps
100%
GeForce GTX 1060 Mobile:
51 [X] MSI GT62VR Intel Core i7-6820HK 2.7GHz
GeForce GTX 1060 Mobile
min:
43 fps, max:
67 fps
fps
100%
GeForce GTX 1060 Mobile:
45 [X] MSI GT62VR Intel Core i7-6820HK 2.7GHz
GeForce GTX 1060 Mobile
min:
39 fps, max:
60 fps
fps
100%
GeForce GTX 1060 Mobile:
81 [X] MSI GT62VR Intel Core i7-6820HK 2.7GHz
GeForce GTX 1060 Mobile
min:
12 fps, max:
102 fps
fps
100%
GeForce GTX 1060 Mobile:
79 [X] MSI GT62VR Intel Core i7-6820HK 2.7GHz
GeForce GTX 1060 Mobile
min:
51 fps, max:
102 fps
fps
100%
GeForce GTX 1060 Mobile:
80 [X] MSI GT62VR Intel Core i7-6820HK 2.7GHz
GeForce GTX 1060 Mobile
min:
51 fps, max:
103 fps
fps
100%
GeForce GTX 1060 Mobile:
78 [X] MSI GT62VR Intel Core i7-6820HK 2.7GHz
GeForce GTX 1060 Mobile
min:
47 fps, max:
100 fps
fps
100%
GeForce GTX 1060 Mobile:
107 [X] MSI GT62VR Intel Core i7-6820HK 2.7GHz
GeForce GTX 1060 Mobile
min:
22.1 fps, P0.1:
33.9 fps, P1:
73 fps, max:
210 fps
fps
100%
GeForce GTX 1060 Mobile:
89.6 [X] MSI GT62VR Intel Core i7-6820HK 2.7GHz
GeForce GTX 1060 Mobile
min:
46.8 fps, P0.1:
52 fps, P1:
60.4 fps, max:
209 fps
fps
100%
GeForce GTX 1060 Mobile:
81.1 [X] MSI GT62VR Intel Core i7-6820HK 2.7GHz
GeForce GTX 1060 Mobile
min:
20.2 fps, P0.1:
44.4 fps, P1:
52.2 fps, max:
197 fps
fps
100%
GeForce GTX 1060 Mobile:
81.8 [X] MSI GT62VR Intel Core i7-6820HK 2.7GHz
GeForce GTX 1060 Mobile
min:
72 fps, max:
102 fps
fps
100%
GeForce GTX 1060 Mobile:
61.8 [X] MSI GT62VR Intel Core i7-6820HK 2.7GHz
GeForce GTX 1060 Mobile
min:
38 fps, max:
71 fps
fps
100%
GeForce GTX 1060 Mobile:
51.9 [X] MSI GT62VR Intel Core i7-6820HK 2.7GHz
GeForce GTX 1060 Mobile
min:
22 fps, max:
58 fps
fps
100%
GeForce GTX 1060 Mobile:
44.3 [X] MSI GT62VR Intel Core i7-6820HK 2.7GHz
GeForce GTX 1060 Mobile
min:
37 fps, max:
50 fps
fps
100%
GeForce GTX 1060 Mobile:
71.2 [X] MSI GT62VR Intel Core i7-6820HK 2.7GHz
GeForce GTX 1060 Mobile
min:
25.9 fps, P0.1:
34.2 fps, P1:
47.9 fps, max:
167 fps
fps
100%
GeForce GTX 1060 Mobile:
67.6 [X] MSI GT62VR Intel Core i7-6820HK 2.7GHz
GeForce GTX 1060 Mobile
min:
27.6 fps, P0.1:
33.9 fps, P1:
45.8 fps, max:
166 fps
fps
100%
GeForce GTX 1060 Mobile:
88.6 [X] MSI GT62VR Intel Core i7-6820HK 2.7GHz
GeForce GTX 1060 Mobile
min:
7.51 fps, P0.1:
28.5 fps, P1:
45.3 fps, max:
212 fps
fps
100%
GeForce GTX 1060 Mobile:
53.6 [X] MSI GT62VR Intel Core i7-6820HK 2.7GHz
GeForce GTX 1060 Mobile
min:
17 fps, P0.1:
28.1 fps, P1:
35.5 fps, max:
100 fps
fps
100%
GeForce GTX 1060 Mobile:
40.4 [X] MSI GT62VR Intel Core i7-6820HK 2.7GHz
GeForce GTX 1060 Mobile
min:
17.4 fps, P0.1:
20.6 fps, P1:
26.1 fps, max:
94.9 fps
fps
100%
GeForce GTX 1060 Mobile:
81 [X] MSI GT62VR Intel Core i7-6820HK 2.7GHz
GeForce GTX 1060 Mobile
min:
33.2 fps, P0.1:
48.3 fps, P1:
55.1 fps, max:
110 fps
fps
100%
GeForce GTX 1060 Mobile:
55.5 [X] MSI GT62VR Intel Core i7-6820HK 2.7GHz
GeForce GTX 1060 Mobile
min:
17.8 fps, P0.1:
41.3 fps, P1:
45.4 fps, max:
71.1 fps
fps
100%
GeForce GTX 1060 Mobile:
43.4 [X] MSI GT62VR Intel Core i7-6820HK 2.7GHz
GeForce GTX 1060 Mobile
min:
16.9 fps, P0.1:
34.1 fps, P1:
36.1 fps, max:
56.4 fps
fps
100%
GeForce GTX 1060 Mobile:
34.7 [X] MSI GT62VR Intel Core i7-6820HK 2.7GHz
GeForce GTX 1060 Mobile
min:
14.7 fps, P0.1:
26.1 fps, P1:
28.7 fps, max:
54.6 fps
fps
100%
GeForce GTX 1060 Mobile:
155 [X] MSI GT62VR Intel Core i7-6820HK 2.7GHz
GeForce GTX 1060 Mobile
fps
100%
GeForce GTX 1060 Mobile:
94 [X] MSI GT62VR Intel Core i7-6820HK 2.7GHz
GeForce GTX 1060 Mobile
fps
100%
GeForce GTX 1060 Mobile:
78 [X] MSI GT62VR Intel Core i7-6820HK 2.7GHz
GeForce GTX 1060 Mobile
fps
100%
GeForce GTX 1060 Mobile:
48 [X] MSI GT62VR Intel Core i7-6820HK 2.7GHz
GeForce GTX 1060 Mobile
fps
100%
GeForce GTX 1060 Mobile:
101 [X] MSI GT62VR Intel Core i7-6820HK 2.7GHz
GeForce GTX 1060 Mobile
min:
55.1 fps, P0.1:
66.8 fps, P1:
81.1 fps, max:
120 fps
fps
100%
GeForce GTX 1060 Mobile:
102 [X] MSI GT62VR Intel Core i7-6820HK 2.7GHz
GeForce GTX 1060 Mobile
min:
60.3 fps, P0.1:
69.7 fps, P1:
77.5 fps, max:
123 fps
fps
100%
GeForce GTX 1060 Mobile:
101 [X] MSI GT62VR Intel Core i7-6820HK 2.7GHz
GeForce GTX 1060 Mobile
min:
50.6 fps, P0.1:
68.2 fps, P1:
74 fps, max:
121 fps
fps
100%
GeForce GTX 1060 Mobile:
89.8 [X] MSI GT62VR Intel Core i7-6820HK 2.7GHz
GeForce GTX 1060 Mobile
min:
21.9 fps, P0.1:
28.6 fps, P1:
43.8 fps, max:
189 fps
fps
100%
GeForce GTX 1060 Mobile:
65.6 [X] MSI GT62VR Intel Core i7-6820HK 2.7GHz
GeForce GTX 1060 Mobile
min:
24.6 fps, P0.1:
29.5 fps, P1:
42 fps, max:
162 fps
fps
100%
GeForce GTX 1060 Mobile:
57.1 [X] MSI GT62VR Intel Core i7-6820HK 2.7GHz
GeForce GTX 1060 Mobile
min:
23.6 fps, P0.1:
27.3 fps, P1:
37.9 fps, max:
119 fps
fps
100%
GeForce GTX 1060 Mobile:
41 [X] MSI GT62VR Intel Core i7-6820HK 2.7GHz
GeForce GTX 1060 Mobile
min:
17.5 fps, P0.1:
23 fps, P1:
30.1 fps, max:
82.5 fps
fps
100%
GeForce GTX 1060 Mobile:
80.3 [X] MSI GT62VR Intel Core i7-6820HK 2.7GHz
GeForce GTX 1060 Mobile
min:
20.9 fps, P0.1:
24.5 fps, P1:
43.5 fps, max:
226 fps
fps
100%
GeForce GTX 1060 Mobile:
70.2 [X] MSI GT62VR Intel Core i7-6820HK 2.7GHz
GeForce GTX 1060 Mobile
min:
19.7 fps, P0.1:
25.1 fps, P1:
41.9 fps, max:
190 fps
fps
100%
GeForce GTX 1060 Mobile:
131 [X] MSI GT62VR Intel Core i7-6820HK 2.7GHz
GeForce GTX 1060 Mobile
min:
75 fps, P0.1:
86.8 fps, P1:
97.8 fps, max:
196 fps
fps
100%
GeForce GTX 1060 Mobile:
62.5 [X] MSI GT62VR Intel Core i7-6820HK 2.7GHz
GeForce GTX 1060 Mobile
min:
50.5 fps, P0.1:
50.7 fps, P1:
51.5 fps, max:
86.2 fps
fps
100%
GeForce GTX 1060 Mobile:
60.8 [X] MSI GT62VR Intel Core i7-6820HK 2.7GHz
GeForce GTX 1060 Mobile
min:
46.3 fps, P0.1:
50.2 fps, P1:
50.9 fps, max:
86.5 fps
fps
100%
GeForce GTX 1060 Mobile:
53.9 [X] MSI GT62VR Intel Core i7-6820HK 2.7GHz
GeForce GTX 1060 Mobile
min:
43.5 fps, P0.1:
43.8 fps, P1:
44.7 fps, max:
78.1 fps
fps
100%
GeForce GTX 1060 Mobile:
72 [X] MSI GT62VR Intel Core i7-6820HK 2.7GHz
GeForce GTX 1060 Mobile
min:
0.703 fps, P0.1:
14.8 fps, P1:
39.3 fps, max:
130 fps
fps
100%
GeForce GTX 1060 Mobile:
69.1 [X] MSI GT62VR Intel Core i7-6820HK 2.7GHz
GeForce GTX 1060 Mobile
min:
13.9 fps, P0.1:
14.9 fps, P1:
33.9 fps, max:
125 fps
fps
100%
GeForce GTX 1060 Mobile:
60.6 [X] MSI GT62VR Intel Core i7-6820HK 2.7GHz
GeForce GTX 1060 Mobile
min:
12.3 fps, P0.1:
24.4 fps, P1:
33.5 fps, max:
134 fps
fps
100%
GeForce GTX 1060 Mobile:
50.7 [X] MSI GT62VR Intel Core i7-6820HK 2.7GHz
GeForce GTX 1060 Mobile
min:
13 fps, P0.1:
14.9 fps, P1:
26.5 fps, max:
156 fps
fps
100%
GeForce GTX 1060 Mobile:
117 [X] MSI GT62VR Intel Core i7-6820HK 2.7GHz
GeForce GTX 1060 Mobile
fps
100%
GeForce GTX 1060 Mobile:
76 [X] MSI GT62VR Intel Core i7-6820HK 2.7GHz
GeForce GTX 1060 Mobile
fps
100%
GeForce GTX 1060 Mobile:
64.4 [X] HP Omen 15-dc0006ng Intel Core i7-8750H 2.2GHz
GeForce GTX 1060 Mobile
69 [X] MSI GT62VR Intel Core i7-6820HK 2.7GHz
GeForce GTX 1060 Mobile
~ 67 fps
100%
GeForce GTX 1060 Mobile:
58.7 [X] HP Omen 15-dc0006ng Intel Core i7-8750H 2.2GHz
GeForce GTX 1060 Mobile
63 [X] MSI GT62VR Intel Core i7-6820HK 2.7GHz
GeForce GTX 1060 Mobile
~ 61 fps
100%
GeForce GTX 1060 Mobile:
69.4 [X] MSI GT62VR Intel Core i7-6820HK 2.7GHz
GeForce GTX 1060 Mobile
min:
1.99 fps, P0.1:
10.1 fps, P1:
54 fps, max:
118 fps
fps
100%
GeForce GTX 1060 Mobile:
33.5 [X] MSI GT62VR Intel Core i7-6820HK 2.7GHz
GeForce GTX 1060 Mobile
min:
3.65 fps, P0.1:
11.9 fps, P1:
27.3 fps, max:
94.6 fps
fps
100%
GeForce GTX 1060 Mobile:
27.6 [X] MSI GT62VR Intel Core i7-6820HK 2.7GHz
GeForce GTX 1060 Mobile
min:
9.87 fps, P0.1:
20.3 fps, P1:
24.1 fps, max:
51.6 fps
fps
100%
GeForce GTX 1060 Mobile:
23.1 [X] MSI GT62VR Intel Core i7-6820HK 2.7GHz
GeForce GTX 1060 Mobile
min:
5.43 fps, P0.1:
11.2 fps, P1:
18.8 fps, max:
46.8 fps
fps
241%
GeForce GTX 1080 Ti:
55.6 [X] Aorus Z370 Ultra Gaming Desktop DDR4-2666 Intel Core i7-8086K 3.7GHz
GeForce GTX 1080 Ti
min:
18.6 fps, P0.1:
33.7 fps, P1:
45.4 fps, max:
126 fps
fps
GeForce GTX 1080 Ti:
36.9 [X] Aorus Z370 Ultra Gaming Desktop DDR4-2666 Intel Core i7-8086K 3.7GHz
GeForce GTX 1080 Ti
min:
17.7 fps, P0.1:
25.1 fps, P1:
32.3 fps, max:
67.9 fps
fps
GeForce GTX 1080 Ti:
16.9 [X] Aorus Z370 Ultra Gaming Desktop DDR4-2666 Intel Core i7-8086K 3.7GHz
GeForce GTX 1080 Ti
min:
13 fps, P0.1:
13.4 fps, P1:
14.9 fps, max:
29.5 fps
fps
100%
GeForce GTX 1060 Mobile:
89 [X] MSI GT62VR Intel Core i7-6820HK 2.7GHz
GeForce GTX 1060 Mobile
min:
32 fps, max:
141 fps
fps
100%
GeForce GTX 1060 Mobile:
56 [X] MSI GT62VR Intel Core i7-6820HK 2.7GHz
GeForce GTX 1060 Mobile
min:
29 fps, max:
103 fps
fps
100%
GeForce GTX 1060 Mobile:
44 [X] MSI GT62VR Intel Core i7-6820HK 2.7GHz
GeForce GTX 1060 Mobile
min:
22 fps, max:
85 fps
fps
100%
GeForce GTX 1060 Mobile:
41 [X] MSI GT62VR Intel Core i7-6820HK 2.7GHz
GeForce GTX 1060 Mobile
min:
21 fps, max:
85 fps
fps
100%
GeForce GTX 1060 Mobile:
83.2 [X] MSI GT62VR Intel Core i7-6820HK 2.7GHz
GeForce GTX 1060 Mobile
min:
41.3 fps, P0.1:
43.9 fps, P1:
53 fps, max:
106 fps
fps
100%
GeForce GTX 1060 Mobile:
53.5 [X] MSI GT62VR Intel Core i7-6820HK 2.7GHz
GeForce GTX 1060 Mobile
min:
25.3 fps, P0.1:
30.2 fps, P1:
34.1 fps, max:
102 fps
fps
100%
GeForce GTX 1060 Mobile:
50.8 [X] MSI GT62VR Intel Core i7-6820HK 2.7GHz
GeForce GTX 1060 Mobile
min:
28 fps, P0.1:
28.7 fps, P1:
31.6 fps, max:
103 fps
fps
100%
GeForce GTX 1060 Mobile:
45.1 [X] MSI GT62VR Intel Core i7-6820HK 2.7GHz
GeForce GTX 1060 Mobile
min:
24.5 fps, P0.1:
25.7 fps, P1:
28.9 fps, max:
88.1 fps
fps
100%
GeForce GTX 1060 Mobile:
83.1 [X] MSI GT62VR Intel Core i7-6820HK 2.7GHz
GeForce GTX 1060 Mobile
min:
35.3 fps, P0.1:
48 fps, P1:
54.2 fps, max:
273 fps
fps
100%
GeForce GTX 1060 Mobile:
53.1 [X] MSI GT62VR Intel Core i7-6820HK 2.7GHz
GeForce GTX 1060 Mobile
min:
30.7 fps, P0.1:
35.3 fps, P1:
38.1 fps, max:
98.6 fps
fps
100%
GeForce GTX 1060 Mobile:
43.9 [X] MSI GT62VR Intel Core i7-6820HK 2.7GHz
GeForce GTX 1060 Mobile
min:
24.1 fps, P0.1:
28.5 fps, P1:
31.2 fps, max:
86.7 fps
fps
100%
GeForce GTX 1060 Mobile:
38.8 [X] MSI GT62VR Intel Core i7-6820HK 2.7GHz
GeForce GTX 1060 Mobile
min:
21.6 fps, P0.1:
24.4 fps, P1:
27.6 fps, max:
84.7 fps
fps
100%
GeForce GTX 1060 Mobile:
24.6 [X] MSI GT62VR Intel Core i7-6820HK 2.7GHz
GeForce GTX 1060 Mobile
min:
15.5 fps, P0.1:
16.1 fps, P1:
18.7 fps, max:
46.8 fps
fps
100%
GeForce GTX 1060 Mobile:
53 [X] MSI GT62VR Intel Core i7-6820HK 2.7GHz
GeForce GTX 1060 Mobile
P0.1:
13 fpsP1:
fps
fps
100%
GeForce GTX 1060 Mobile:
45 [X] MSI GT62VR Intel Core i7-6820HK 2.7GHz
GeForce GTX 1060 Mobile
P0.1:
15 fpsP1:
fps
fps
100%
GeForce GTX 1060 Mobile:
38 [X] MSI GT62VR Intel Core i7-6820HK 2.7GHz
GeForce GTX 1060 Mobile
P0.1:
23 fpsP1:
fps
fps
100%
GeForce GTX 1060 Mobile:
27 [X] MSI GT62VR Intel Core i7-6820HK 2.7GHz
GeForce GTX 1060 Mobile
P0.1:
16 fpsP1:
fps
fps
100%
GeForce GTX 1060 Mobile:
10 [X] MSI GT62VR Intel Core i7-6820HK 2.7GHz
GeForce GTX 1060 Mobile
P0.1:
6 fpsP1:
fps
fps
100%
GeForce GTX 1060 Mobile:
47.7 [X] MSI GT62VR Intel Core i7-6820HK 2.7GHz
GeForce GTX 1060 Mobile
min:
9.2 fps, P0.1:
30.8 fps, P1:
40.7 fps, max:
80.7 fps
fps
100%
GeForce GTX 1060 Mobile:
38.3 [X] MSI GT62VR Intel Core i7-6820HK 2.7GHz
GeForce GTX 1060 Mobile
min:
25.8 fps, P0.1:
27.2 fps, P1:
33.2 fps, max:
53.4 fps
fps
100%
GeForce GTX 1060 Mobile:
22.2 [X] MSI GT62VR Intel Core i7-6820HK 2.7GHz
GeForce GTX 1060 Mobile
min:
17.1 fps, P0.1:
17.5 fps, P1:
19.1 fps, max:
26.3 fps
fps
100%
GeForce GTX 1060 Mobile:
18 [X] MSI GT62VR Intel Core i7-6820HK 2.7GHz
GeForce GTX 1060 Mobile
min:
14.1 fps, P0.1:
14.7 fps, P1:
15.7 fps, max:
21 fps
fps
100%
GeForce GTX 1060 Mobile:
12.5 [X] MSI GT62VR Intel Core i7-6820HK 2.7GHz
GeForce GTX 1060 Mobile
min:
9.3 fps, P0.1:
9.9 fps, P1:
11 fps, max:
14.8 fps
fps
100%
GeForce GTX 1060 Mobile:
66.2 [X] MSI GT62VR Intel Core i7-6820HK 2.7GHz
GeForce GTX 1060 Mobile
min:
34.21 fps, P1:
46.96 fps, max:
105.44 fps
fps
100%
GeForce GTX 1060 Mobile:
54.7 [X] MSI GT62VR Intel Core i7-6820HK 2.7GHz
GeForce GTX 1060 Mobile
min:
27.9 fps, P1:
40.56 fps, max:
83.33 fps
fps
100%
GeForce GTX 1060 Mobile:
48 [X] MSI GT62VR Intel Core i7-6820HK 2.7GHz
GeForce GTX 1060 Mobile
min:
25.36 fps, P1:
36.54 fps, max:
71.61 fps
fps
100%
GeForce GTX 1060 Mobile:
28.1 [X] MSI GT62VR Intel Core i7-6820HK 2.7GHz
GeForce GTX 1060 Mobile
min:
17.11 fps, P1:
22.9 fps, max:
51.71 fps
fps
100%
GeForce GTX 1060 Mobile:
19.4 [X] MSI GT62VR Intel Core i7-6820HK 2.7GHz
GeForce GTX 1060 Mobile
min:
11.53 fps, P1:
14.85 fps, max:
39.93 fps
fps
100%
GeForce GTX 1060 Mobile:
137 [X] MSI GT62VR 1.5.4.5
Intel Core i7-6820HK 2.7GHz
GeForce GTX 1060 Mobile
min:
7.1 fps, P1:
108 fps, max:
177 fps
fps
100%
GeForce GTX 1060 Mobile:
137 [X] MSI GT62VR 1.5.4.5
Intel Core i7-6820HK 2.7GHz
GeForce GTX 1060 Mobile
min:
13.2 fps, P1:
107 fps, max:
174 fps
fps
100%
GeForce GTX 1060 Mobile:
133 [X] MSI GT62VR 1.5.4.5
Intel Core i7-6820HK 2.7GHz
GeForce GTX 1060 Mobile
min:
57.2 fps, P1:
104 fps, max:
169 fps
fps
100%
GeForce GTX 1060 Mobile:
130 [X] MSI GT62VR 1.5.4.5
Intel Core i7-6820HK 2.7GHz
GeForce GTX 1060 Mobile
min:
38 fps, P1:
94.6 fps, max:
169 fps
fps
100%
GeForce GTX 1060 Mobile:
129 [X] MSI GT62VR 1.5.4.5
Intel Core i7-6820HK 2.7GHz
GeForce GTX 1060 Mobile
min:
47.1 fps, P1:
89.9 fps, max:
170 fps
fps
100%
GeForce GTX 1060 Mobile:
88.7 [X] MSI GT62VR 1.5.4.5
Intel Core i7-6820HK 2.7GHz
GeForce GTX 1060 Mobile
min:
33.9 fps, P1:
69.8 fps, max:
143 fps
fps
100%
GeForce GTX 1060 Mobile:
210 [X] MSI GT62VR 1.5.4.5
Intel Core i7-6820HK 2.7GHz
GeForce GTX 1060 Mobile
min:
17.7 fps, P1:
95.4 fps, max:
306 fps
fps
100%
GeForce GTX 1060 Mobile:
152 [X] MSI GT62VR 1.5.4.5
Intel Core i7-6820HK 2.7GHz
GeForce GTX 1060 Mobile
min:
33.4 fps, P1:
81.6 fps, max:
268 fps
fps
100%
GeForce GTX 1060 Mobile:
125 [X] MSI GT62VR 1.5.4.5
Intel Core i7-6820HK 2.7GHz
GeForce GTX 1060 Mobile
min:
89.7 fps, P1:
101 fps, max:
165 fps
fps
100%
GeForce GTX 1060 Mobile:
112 [X] MSI GT62VR 1.5.4.5
Intel Core i7-6820HK 2.7GHz
GeForce GTX 1060 Mobile
min:
68.4 fps, P1:
89.2 fps, max:
165 fps
fps
100%
GeForce GTX 1060 Mobile:
71.3 [X] MSI GT62VR 1.5.4.5
Intel Core i7-6820HK 2.7GHz
GeForce GTX 1060 Mobile
min:
54.3 fps, P1:
58.5 fps, max:
93.9 fps
fps
100%
GeForce GTX 1060 Mobile:
39.5 [X] MSI GT62VR 1.5.4.5
Intel Core i7-6820HK 2.7GHz
GeForce GTX 1060 Mobile
min:
32.2 fps, P1:
34.4 fps, max:
48.9 fps
fps
100%
GeForce GTX 1060 Mobile:
93.8 [X] MSI GT62VR 1.5.4.5
Intel Core i7-6820HK 2.7GHz
GeForce GTX 1060 Mobile
min:
3.52 fps, P1:
55.8 fps, max:
167 fps
fps
100%
GeForce GTX 1060 Mobile:
54.7 [X] MSI GT62VR 1.5.4.5
Intel Core i7-6820HK 2.7GHz
GeForce GTX 1060 Mobile
min:
28.5 fps, P1:
38.5 fps, max:
123 fps
fps
100%
GeForce GTX 1060 Mobile:
50.3 [X] MSI GT62VR 1.5.4.5
Intel Core i7-6820HK 2.7GHz
GeForce GTX 1060 Mobile
min:
22.4 fps, P1:
36.9 fps, max:
120 fps
fps
100%
GeForce GTX 1060 Mobile:
33 [X] MSI GT62VR 1.5.4.5
Intel Core i7-6820HK 2.7GHz
GeForce GTX 1060 Mobile
min:
22.4 fps, P1:
26.2 fps, max:
62.7 fps
fps
100%
GeForce GTX 1060 Mobile:
16.5 [X] MSI GT62VR 1.5.4.5
Intel Core i7-6820HK 2.7GHz
GeForce GTX 1060 Mobile
min:
12.1 fps, P1:
14.7 fps, max:
22.5 fps
fps
100%
GeForce GTX 1060 Mobile:
77.8 [X] MSI GT62VR Intel Core i7-6820HK 2.7GHz
GeForce GTX 1060 Mobile
min:
3.03 fps, P1:
39.6 fps, max:
148 fps
fps
100%
GeForce GTX 1060 Mobile:
55.5 [X] MSI GT62VR Intel Core i7-6820HK 2.7GHz
GeForce GTX 1060 Mobile
min:
6.44 fps, P1:
32 fps, max:
104 fps
fps
100%
GeForce GTX 1060 Mobile:
41.5 [X] MSI GT62VR Intel Core i7-6820HK 2.7GHz
GeForce GTX 1060 Mobile
min:
2.23 fps, P1:
18.9 fps, max:
79.6 fps
fps
100%
GeForce GTX 1060 Mobile:
33.3 [X] MSI GT62VR Intel Core i7-6820HK 2.7GHz
GeForce GTX 1060 Mobile
min:
2.53 fps, P1:
13.5 fps, max:
70.6 fps
fps
100%
GeForce GTX 1060 Mobile:
27.7 [X] MSI GT62VR Intel Core i7-6820HK 2.7GHz
GeForce GTX 1060 Mobile
min:
12.9 fps, P1:
16.8 fps, max:
63.4 fps
fps
100%
GeForce GTX 1060 Mobile:
51.8 [X] MSI GT62VR 1.5.4.5
Intel Core i7-6820HK 2.7GHz
GeForce GTX 1060 Mobile
min:
5.71 fps, P1:
37.8 fps, max:
64.1 fps
60.5 [X] HP Omen 15-dc0006ng Intel Core i7-8750H 2.2GHz
GeForce GTX 1060 Mobile
min:
21.6 fps, P0.1:
22.9 fps, P1:
30.2 fps, max:
102.7 fps
82.5 [X] HP Omen 15-dc0006ng Intel Core i7-8750H 2.2GHz
GeForce GTX 1060 Mobile
min:
11.5 fps, P0.1:
32.8 fps, P1:
51.1 fps, max:
114.7 fps
~ 65 fps
117%
GeForce GTX 1080 Ti:
75.9 [X] Aorus Z370 Ultra Gaming Desktop DDR4-2666 Intel Core i7-8086K 3.7GHz
GeForce GTX 1080 Ti
min:
9 fps, P1:
58 fps, max:
92 fps
fps
100%
GeForce GTX 1060 Mobile:
39 [X] MSI GT62VR 1.5.4.5
Intel Core i7-6820HK 2.7GHz
GeForce GTX 1060 Mobile
min:
6.83 fps, P1:
28.502 fps, max:
53 fps
fps
177%
GeForce GTX 1080 Ti:
69.1 [X] Aorus Z370 Ultra Gaming Desktop DDR4-2666 Intel Core i7-8086K 3.7GHz
GeForce GTX 1080 Ti
min:
5 fps, P1:
50.7 fps, max:
82 fps
fps
100%
GeForce GTX 1060 Mobile:
28.7 [X] MSI GT62VR 1.5.4.5
Intel Core i7-6820HK 2.7GHz
GeForce GTX 1060 Mobile
min:
8.74 fps, P1:
21.9 fps, max:
42.1 fps
36.9 [X] HP Omen 15-dc0006ng Intel Core i7-8750H 2.2GHz
GeForce GTX 1060 Mobile
min:
17.3 fps, P0.1:
18.5 fps, P1:
21.2 fps, max:
81.4 fps
~ 33 fps
164%
GeForce GTX 1080 Ti:
54 [X] Aorus Z370 Ultra Gaming Desktop DDR4-2666 Intel Core i7-8086K 3.7GHz
GeForce GTX 1080 Ti
min:
6 fps, P1:
43.6 fps, max:
63 fps
fps
100%
GeForce GTX 1060 Mobile:
19.5 [X] MSI GT62VR 1.5.4.5
Intel Core i7-6820HK 2.7GHz
GeForce GTX 1060 Mobile
min:
8.94 fps, P1:
15.313 fps, max:
31.9 fps
26.6 [X] HP Omen 15-dc0006ng Intel Core i7-8750H 2.2GHz
GeForce GTX 1060 Mobile
min:
10.1 fps, P0.1:
10.2 fps, P1:
11.6 fps, max:
53.9 fps
~ 23 fps
187%
GeForce GTX 1080 Ti:
43.1 [X] Aorus Z370 Ultra Gaming Desktop DDR4-2666 Intel Core i7-8086K 3.7GHz
GeForce GTX 1080 Ti
min:
8 fps, P1:
36.7 fps, max:
53 fps
fps
100%
GeForce GTX 1060 Mobile:
14.2 [X] MSI GT62VR 1.5.4.5
Intel Core i7-6820HK 2.7GHz
GeForce GTX 1060 Mobile
min:
7.26 fps, P1:
11.312 fps, max:
29.3 fps
fps
244%
GeForce GTX 1080 Ti:
34.7 [X] Aorus Z370 Ultra Gaming Desktop DDR4-2666 Intel Core i7-8086K 3.7GHz
GeForce GTX 1080 Ti
min:
7.5 fps, P1:
29.3 fps, max:
42.5 fps
fps
100%
GeForce GTX 1060 Mobile:
7.7 [X] MSI GT62VR 1.5.4.5
Intel Core i7-6820HK 2.7GHz
GeForce GTX 1060 Mobile
min:
3.62 fps, P1:
5.3228 fps, max:
17.9 fps
fps
274%
GeForce GTX 1080 Ti:
21.2 [X] Aorus Z370 Ultra Gaming Desktop DDR4-2666 Intel Core i7-8086K 3.7GHz
GeForce GTX 1080 Ti
min:
12 fps, P1:
17.5 fps, max:
39.7 fps
fps
100%
GeForce GTX 1060 Mobile:
83 [X] MSI GT62VR Intel Core i7-6820HK 2.7GHz
GeForce GTX 1060 Mobile
min:
15 fps
fps
100%
GeForce GTX 1060 Mobile:
62 [X] MSI GT62VR Intel Core i7-6820HK 2.7GHz
GeForce GTX 1060 Mobile
min:
31 fps
fps
100%
GeForce GTX 1060 Mobile:
51 [X] MSI GT62VR Intel Core i7-6820HK 2.7GHz
GeForce GTX 1060 Mobile
min:
26 fps
fps
100%
GeForce GTX 1060 Mobile:
39 [X] MSI GT62VR Intel Core i7-6820HK 2.7GHz
GeForce GTX 1060 Mobile
min:
11 fps
fps
100%
GeForce GTX 1060 Mobile:
29 [X] MSI GT62VR Intel Core i7-6820HK 2.7GHz
GeForce GTX 1060 Mobile
min:
14 fps
fps
100%
GeForce GTX 1060 Mobile:
15 [X] MSI GT62VR Intel Core i7-6820HK 2.7GHz
GeForce GTX 1060 Mobile
min:
6 fps
fps
100%
GeForce GTX 1060 Mobile:
108 [X] MSI GT62VR Intel Core i7-6820HK 2.7GHz
GeForce GTX 1060 Mobile
min:
79 fps
111.9 [X] HP Omen 15-dc0006ng Intel Core i7-8750H 2.2GHz
GeForce GTX 1060 Mobile
min:
33.1 fps, P0.1:
57.7 fps, P1:
82.7 fps, max:
197 fps
~ 110 fps
100%
GeForce GTX 1060 Mobile:
64.9 [X] HP Omen 15-dc0006ng Intel Core i7-8750H 2.2GHz
GeForce GTX 1060 Mobile
min:
25.1 fps, P0.1:
25.9 fps, P1:
28.4 fps, max:
151.7 fps
71.4 [X] MSI GT62VR Intel Core i7-6820HK 2.7GHz
GeForce GTX 1060 Mobile
min:
46 fps
~ 68 fps
100%
GeForce GTX 1060 Mobile:
60 [X] HP Omen 15-dc0006ng Intel Core i7-8750H 2.2GHz
GeForce GTX 1060 Mobile
min:
24.4 fps, P0.1:
24.7 fps, P1:
27.6 fps, max:
154 fps
66.3 [X] MSI GT62VR Intel Core i7-6820HK 2.7GHz
GeForce GTX 1060 Mobile
min:
43 fps
~ 63 fps
100%
GeForce GTX 1060 Mobile:
58 [X] HP Omen 15-dc0006ng Intel Core i7-8750H 2.2GHz
GeForce GTX 1060 Mobile
min:
15.9 fps, P0.1:
23.2 fps, P1:
26.2 fps, max:
123.7 fps
64.9 [X] MSI GT62VR Intel Core i7-6820HK 2.7GHz
GeForce GTX 1060 Mobile
min:
42 fps
~ 61 fps
100%
GeForce GTX 1060 Mobile:
41.5 [X] MSI GT62VR Intel Core i7-6820HK 2.7GHz
GeForce GTX 1060 Mobile
min:
28 fps
fps
100%
GeForce GTX 1060 Mobile:
21.4 [X] MSI GT62VR Intel Core i7-6820HK 2.7GHz
GeForce GTX 1060 Mobile
min:
15 fps
fps
100%
GeForce GTX 1060 Mobile:
168 [X] MSI GT62VR Intel Core i7-6820HK 2.7GHz
GeForce GTX 1060 Mobile
min:
134 fps
fps
148%
GeForce GTX 1080 Ti:
248 [X] Aorus Z370 Ultra Gaming Desktop DDR4-2666 670054
Intel Core i7-8086K 3.7GHz
GeForce GTX 1080 Ti
min:
203 fps, max:
272 fps
fps
100%
GeForce GTX 1060 Mobile:
128 [X] MSI GT62VR Intel Core i7-6820HK 2.7GHz
GeForce GTX 1060 Mobile
min:
110 fps
fps
166%
GeForce GTX 1080 Ti:
213 [X] Aorus Z370 Ultra Gaming Desktop DDR4-2666 670054
Intel Core i7-8086K 3.7GHz
GeForce GTX 1080 Ti
min:
171 fps, max:
241 fps
fps
100%
GeForce GTX 1060 Mobile:
98 [X] MSI GT62VR Intel Core i7-6820HK 2.7GHz
GeForce GTX 1060 Mobile
min:
84 fps
fps
211%
GeForce GTX 1080 Ti:
207 [X] Aorus Z370 Ultra Gaming Desktop DDR4-2666 670054
Intel Core i7-8086K 3.7GHz
GeForce GTX 1080 Ti
min:
171 fps, max:
233 fps
fps
100%
GeForce GTX 1060 Mobile:
66 [X] MSI GT62VR Intel Core i7-6820HK 2.7GHz
GeForce GTX 1060 Mobile
min:
48 fps
fps
232%
GeForce GTX 1080 Ti:
153 [X] Aorus Z370 Ultra Gaming Desktop DDR4-2666 670054
Intel Core i7-8086K 3.7GHz
GeForce GTX 1080 Ti
min:
120 fps, max:
186 fps
fps
100%
GeForce GTX 1060 Mobile:
48 [X] MSI GT62VR Intel Core i7-6820HK 2.7GHz
GeForce GTX 1060 Mobile
min:
37 fps
fps
246%
GeForce GTX 1080 Ti:
118 [X] Aorus Z370 Ultra Gaming Desktop DDR4-2666 670054
Intel Core i7-8086K 3.7GHz
GeForce GTX 1080 Ti
min:
94 fps, max:
140 fps
fps
100%
GeForce GTX 1060 Mobile:
26 [X] MSI GT62VR Intel Core i7-6820HK 2.7GHz
GeForce GTX 1060 Mobile
min:
21 fps
fps
277%
GeForce GTX 1080 Ti:
71.9 [X] Aorus Z370 Ultra Gaming Desktop DDR4-2666 670054
Intel Core i7-8086K 3.7GHz
GeForce GTX 1080 Ti
min:
59 fps, max:
86 fps
fps
100%
GeForce GTX 1060 Mobile:
137 [X] MSI GT62VR Intel Core i7-6820HK 2.7GHz
GeForce GTX 1060 Mobile
min:
108 fps
fps
100%
GeForce GTX 1060 Mobile:
136 [X] MSI GT62VR Intel Core i7-6820HK 2.7GHz
GeForce GTX 1060 Mobile
min:
107 fps
fps
100%
GeForce GTX 1060 Mobile:
134 [X] MSI GT62VR Intel Core i7-6820HK 2.7GHz
GeForce GTX 1060 Mobile
min:
106 fps
fps
100%
GeForce GTX 1060 Mobile:
133 [X] MSI GT62VR Intel Core i7-6820HK 2.7GHz
GeForce GTX 1060 Mobile
min:
102 fps
fps
100%
GeForce GTX 1060 Mobile:
117 [X] MSI GT62VR Intel Core i7-6820HK 2.7GHz
GeForce GTX 1060 Mobile
min:
97 fps
fps
100%
GeForce GTX 1060 Mobile:
200 [X] MSI GT62VR Intel Core i7-6820HK 2.7GHz
GeForce GTX 1060 Mobile
fps
127%
GeForce GTX 1080 Ti:
253 [X] Aorus Z370 Ultra Gaming Desktop DDR4-2666 Intel Core i7-8086K 3.7GHz
GeForce GTX 1080 Ti
fps
100%
GeForce GTX 1060 Mobile:
110 [X] MSI GT62VR Intel Core i7-6820HK 2.7GHz
GeForce GTX 1060 Mobile
fps
185%
GeForce GTX 1080 Ti:
204 [X] Aorus Z370 Ultra Gaming Desktop DDR4-2666 Intel Core i7-8086K 3.7GHz
GeForce GTX 1080 Ti
fps
100%
GeForce GTX 1060 Mobile:
68.5 [X] MSI GT62VR Intel Core i7-6820HK 2.7GHz
GeForce GTX 1060 Mobile
fps
200%
GeForce GTX 1080 Ti:
137 [X] Aorus Z370 Ultra Gaming Desktop DDR4-2666 Intel Core i7-8086K 3.7GHz
GeForce GTX 1080 Ti
fps
100%
GeForce GTX 1060 Mobile:
45.9 [X] MSI GT62VR Intel Core i7-6820HK 2.7GHz
GeForce GTX 1060 Mobile
fps
259%
GeForce GTX 1080 Ti:
119 [X] Aorus Z370 Ultra Gaming Desktop DDR4-2666 Intel Core i7-8086K 3.7GHz
GeForce GTX 1080 Ti
fps
100%
GeForce GTX 1060 Mobile:
31.4 [X] MSI GT62VR Intel Core i7-6820HK 2.7GHz
GeForce GTX 1060 Mobile
fps
282%
GeForce GTX 1080 Ti:
88.6 □ [X] Aorus Z370 Ultra Gaming Desktop DDR4-2666 Intel Core i7-8086K 3.7GHz
GeForce GTX 1080 Ti
fps
100%
GeForce GTX 1060 Mobile:
15.7 [X] MSI GT62VR Intel Core i7-6820HK 2.7GHz
GeForce GTX 1060 Mobile
fps
331%
GeForce GTX 1080 Ti:
51.9 □ [X] Aorus Z370 Ultra Gaming Desktop DDR4-2666 Intel Core i7-8086K 3.7GHz
GeForce GTX 1080 Ti
fps
100%
GeForce GTX 1060 Mobile:
156 [X] MSI GT62VR Intel Core i7-6820HK 2.7GHz
GeForce GTX 1060 Mobile
min:
69 fps
174.1 [X] HP Omen 15-dc0006ng Intel Core i7-8750H 2.2GHz
GeForce GTX 1060 Mobile
min:
58.7 fps, P0.1:
85.5 fps, P1:
107.5 fps, max:
347 fps
~ 165 fps
100%
GeForce GTX 1060 Mobile:
84.1 [X] MSI GT62VR Intel Core i7-6820HK 2.7GHz
GeForce GTX 1060 Mobile
min:
59 fps
88.2 [X] HP Omen 15-dc0006ng Intel Core i7-8750H 2.2GHz
GeForce GTX 1060 Mobile
min:
42.5 fps, P0.1:
53.8 fps, P1:
62.1 fps, max:
241 fps
~ 86 fps
100%
GeForce GTX 1060 Mobile:
75.8 [X] MSI GT62VR Intel Core i7-6820HK 2.7GHz
GeForce GTX 1060 Mobile
min:
56 fps
81.1 [X] HP Omen 15-dc0006ng Intel Core i7-8750H 2.2GHz
GeForce GTX 1060 Mobile
min:
45.1 fps, P0.1:
45.7 fps, P1:
56.9 fps, max:
304 fps
~ 78 fps
100%
GeForce GTX 1060 Mobile:
70.2 [X] HP Omen 15-dc0006ng Intel Core i7-8750H 2.2GHz
GeForce GTX 1060 Mobile
min:
43.4 fps, P0.1:
44 fps, P1:
48.1 fps, max:
152.4 fps
73.2 [X] MSI GT62VR Intel Core i7-6820HK 2.7GHz
GeForce GTX 1060 Mobile
min:
53 fps
~ 72 fps
249%
GeForce GTX 1080 Ti:
179 [X] Aorus Z370 Ultra Gaming Desktop DDR4-2666 Intel Core i7-8086K 3.7GHz
GeForce GTX 1080 Ti
P1:
137 fps
fps
100%
GeForce GTX 1060 Mobile:
46.3 [X] MSI GT62VR Intel Core i7-6820HK 2.7GHz
GeForce GTX 1060 Mobile
min:
34 fps
fps
283%
GeForce GTX 1080 Ti:
131 [X] Aorus Z370 Ultra Gaming Desktop DDR4-2666 Intel Core i7-8086K 3.7GHz
GeForce GTX 1080 Ti
P1:
96.2 fps
fps
100%
GeForce GTX 1060 Mobile:
23.1 [X] MSI GT62VR Intel Core i7-6820HK 2.7GHz
GeForce GTX 1060 Mobile
min:
18 fps
fps
293%
GeForce GTX 1080 Ti:
67.6 [X] Aorus Z370 Ultra Gaming Desktop DDR4-2666 Intel Core i7-8086K 3.7GHz
GeForce GTX 1080 Ti
P1:
55.6 fps
fps
100%
GeForce GTX 1060 Mobile:
147 [X] MSI GT62VR Intel Core i7-6820HK 2.7GHz
GeForce GTX 1060 Mobile
min:
138 fps
fps
57%
GeForce GTX 1050 Max-Q:
83.1 fps
100%
GeForce GTX 1060 Mobile:
67.4 [X] MSI GT62VR Intel Core i7-6820HK 2.7GHz
GeForce GTX 1060 Mobile
min:
62 fps
fps
48%
GeForce GTX 1050 Max-Q:
32.5 fps
100%
GeForce GTX 1060 Mobile:
53.4 [X] MSI GT62VR Intel Core i7-6820HK 2.7GHz
GeForce GTX 1060 Mobile
min:
50 fps
fps
49%
GeForce GTX 1050 Max-Q:
26.4 fps
230%
GeForce GTX 1080 Ti:
123 [X] Aorus Z370 Ultra Gaming Desktop DDR4-2666 Intel Core i7-8086K 3.7GHz
GeForce GTX 1080 Ti
min:
116 fps, max:
127 fps
fps
100%
GeForce GTX 1060 Mobile:
31.9 [X] MSI GT62VR Intel Core i7-6820HK 2.7GHz
GeForce GTX 1060 Mobile
min:
29 fps
fps
48%
GeForce GTX 1050 Max-Q:
15.4 fps
250%
GeForce GTX 1080 Ti:
79.7 [X] Aorus Z370 Ultra Gaming Desktop DDR4-2666 Intel Core i7-8086K 3.7GHz
GeForce GTX 1080 Ti
min:
70 fps, max:
90 fps
fps
100%
GeForce GTX 1060 Mobile:
14.6 [X] MSI GT62VR Intel Core i7-6820HK 2.7GHz
GeForce GTX 1060 Mobile
min:
14 fps
fps
51%
GeForce GTX 1050 Max-Q:
7.5 fps
257%
GeForce GTX 1080 Ti:
37.5 [X] Aorus Z370 Ultra Gaming Desktop DDR4-2666 Intel Core i7-8086K 3.7GHz
GeForce GTX 1080 Ti
min:
32 fps, max:
44 fps
fps
100%
GeForce GTX 1060 Mobile:
121 [X] MSI GT62VR Intel Core i7-6820HK 2.7GHz
GeForce GTX 1060 Mobile
min:
109 fps
fps
100%
GeForce GTX 1060 Mobile:
89.4 [X] MSI GT62VR Intel Core i7-6820HK 2.7GHz
GeForce GTX 1060 Mobile
min:
80 fps
fps
100%
GeForce GTX 1060 Mobile:
80.5 [X] MSI GT62VR Intel Core i7-6820HK 2.7GHz
GeForce GTX 1060 Mobile
min:
69 fps
fps
100%
GeForce GTX 1060 Mobile:
61.7 [X] MSI GT62VR Intel Core i7-6820HK 2.7GHz
GeForce GTX 1060 Mobile
min:
49 fps
fps
188%
GeForce GTX 1080 Ti:
116 [X] Aorus Z370 Ultra Gaming Desktop DDR4-2666 Intel Core i7-8086K 3.7GHz
GeForce GTX 1080 Ti
min:
102 fps, max:
122 fps
fps
100%
GeForce GTX 1060 Mobile:
43.1 [X] MSI GT62VR Intel Core i7-6820HK 2.7GHz
GeForce GTX 1060 Mobile
min:
40 fps
fps
248%
GeForce GTX 1080 Ti:
107 [X] Aorus Z370 Ultra Gaming Desktop DDR4-2666 Intel Core i7-8086K 3.7GHz
GeForce GTX 1080 Ti
min:
80 fps, max:
122 fps
fps
100%
GeForce GTX 1060 Mobile:
19.9 [X] MSI GT62VR Intel Core i7-6820HK 2.7GHz
GeForce GTX 1060 Mobile
min:
15 fps
fps
265%
GeForce GTX 1080 Ti:
52.8 [X] Aorus Z370 Ultra Gaming Desktop DDR4-2666 Intel Core i7-8086K 3.7GHz
GeForce GTX 1080 Ti
min:
38 fps, max:
64 fps
fps
100%
GeForce GTX 1060 Mobile:
96.4 [X] MSI GT62VR Intel Core i7-6820HK 2.7GHz
GeForce GTX 1060 Mobile
min:
19 fps
fps
36%
GeForce GTX 1050 Max-Q:
35.1 fps
100%
GeForce GTX 1060 Mobile:
51.6 [X] MSI GT62VR Intel Core i7-6820HK 2.7GHz
GeForce GTX 1060 Mobile
min:
13 fps
fps
49%
GeForce GTX 1050 Max-Q:
25.3 fps
100%
GeForce GTX 1060 Mobile:
33 [X] MSI GT62VR Intel Core i7-6820HK 2.7GHz
GeForce GTX 1060 Mobile
min:
17 fps
fps
49%
GeForce GTX 1050 Max-Q:
16.1 fps
239%
GeForce GTX 1080 Ti:
79 [X] Nvidia GeForce GTX 1080 Ti Founders Edition Intel Core i7-7740X 4.3GHz
GeForce GTX 1080 Ti
min:
43.3 fps, P1:
66.7 fps, max:
128 fps
fps
100%
GeForce GTX 1060 Mobile:
20.7 [X] MSI GT62VR Intel Core i7-6820HK 2.7GHz
GeForce GTX 1060 Mobile
min:
13 fps
fps
47%
GeForce GTX 1050 Max-Q:
9.8 fps
246%
GeForce GTX 1080 Ti:
50.7 [X] Nvidia GeForce GTX 1080 Ti Founders Edition Intel Core i7-7740X 4.3GHz
GeForce GTX 1080 Ti
min:
6.87 fps, P1:
37 fps, max:
129 fps
50.9 [X] Asus X299 Prime Desktop DDR4-2666 Intel Core i9-9980XE 3GHz
GeForce GTX 1080 Ti
min:
33 fps, P1:
38.5 fps, max:
62.1 fps
~ 51 fps
100%
GeForce GTX 1060 Mobile:
16.9 [X] MSI GT62VR Intel Core i7-6820HK 2.7GHz
GeForce GTX 1060 Mobile
min:
10 fps
fps
242%
GeForce GTX 1080 Ti:
40.9 [X] Nvidia GeForce GTX 1080 Ti Founders Edition Intel Core i7-7740X 4.3GHz
GeForce GTX 1080 Ti
min:
5.5 fps, P1:
32.3 fps, max:
129 fps
fps
100%
GeForce GTX 1060 Mobile:
10.9 [X] MSI GT62VR Intel Core i7-6820HK 2.7GHz
GeForce GTX 1060 Mobile
min:
7 fps
fps
243%
GeForce GTX 1080 Ti:
26.5 [X] Nvidia GeForce GTX 1080 Ti Founders Edition Intel Core i7-7740X 4.3GHz
GeForce GTX 1080 Ti
min:
21.4 fps, P1:
22.2 fps, max:
128 fps
fps
100%
GeForce GTX 1060 Mobile:
74.4 [X] MSI GT62VR Intel Core i7-6820HK 2.7GHz
GeForce GTX 1060 Mobile
min:
48 fps
fps
59%
GeForce GTX 1050 Max-Q:
43.6 fps
100%
GeForce GTX 1060 Mobile:
67.1 [X] MSI GT62VR Intel Core i7-6820HK 2.7GHz
GeForce GTX 1060 Mobile
min:
46 fps
fps
53%
GeForce GTX 1050 Max-Q:
35.8 fps
100%
GeForce GTX 1060 Mobile:
59.3 [X] MSI GT62VR Intel Core i7-6820HK 2.7GHz
GeForce GTX 1060 Mobile
min:
45 fps
fps
52%
GeForce GTX 1050 Max-Q:
31.1 fps
204%
GeForce GTX 1080 Ti:
121 [X] Asus X299 Prime Desktop DDR4-3200 Intel Core i9-10980XE 3GHz
GeForce GTX 1080 Ti
min:
68 fps, max:
145 fps
fps
100%
GeForce GTX 1060 Mobile:
40.4 [X] MSI GT62VR Intel Core i7-6820HK 2.7GHz
GeForce GTX 1060 Mobile
min:
35 fps
fps
49%
GeForce GTX 1050 Max-Q:
19.9 fps
243%
GeForce GTX 1080 Ti:
98 [X] Asus X299 Prime Desktop DDR4-3200 Intel Core i9-10980XE 3GHz
GeForce GTX 1080 Ti
min:
68 fps, max:
117 fps
fps
100%
GeForce GTX 1060 Mobile:
19.7 [X] MSI GT62VR Intel Core i7-6820HK 2.7GHz
GeForce GTX 1060 Mobile
min:
18 fps
fps
50%
GeForce GTX 1050 Max-Q:
9.9 fps
251%
GeForce GTX 1080 Ti:
49.4 [X] Asus X299 Prime Desktop DDR4-3200 Intel Core i9-10980XE 3GHz
GeForce GTX 1080 Ti
min:
43 fps, max:
62 fps
fps
100%
GeForce GTX 1060 Mobile:
86.2 [X] MSI GT62VR Intel Core i7-6820HK 2.7GHz
GeForce GTX 1060 Mobile
min:
69 fps
fps
71%
GeForce GTX 1050 Max-Q:
61.3 fps
100%
GeForce GTX 1060 Mobile:
68.3 [X] MSI GT62VR Intel Core i7-6820HK 2.7GHz
GeForce GTX 1060 Mobile
min:
52 fps
fps
50%
GeForce GTX 1050 Max-Q:
34.4 fps
100%
GeForce GTX 1060 Mobile:
62.4 [X] MSI GT62VR Intel Core i7-6820HK 2.7GHz
GeForce GTX 1060 Mobile
min:
51 fps
fps
48%
GeForce GTX 1050 Max-Q:
29.8 fps
100%
GeForce GTX 1060 Mobile:
50.4 [X] MSI GT62VR Intel Core i7-6820HK 2.7GHz
GeForce GTX 1060 Mobile
min:
44 fps
fps
55%
GeForce GTX 1050 Max-Q:
27.7 fps
192%
GeForce GTX 1080 Ti:
97 [X] Nvidia GeForce GTX 1080 Ti Founders Edition Intel Core i7-7740X 4.3GHz
GeForce GTX 1080 Ti
min:
82 fps, max:
113 fps
fps
100%
GeForce GTX 1060 Mobile:
35.1 [X] MSI GT62VR Intel Core i7-6820HK 2.7GHz
GeForce GTX 1060 Mobile
min:
30 fps
fps
56%
GeForce GTX 1050 Max-Q:
19.5 fps
228%
GeForce GTX 1080 Ti:
80 [X] Nvidia GeForce GTX 1080 Ti Founders Edition Intel Core i7-7740X 4.3GHz
GeForce GTX 1080 Ti
min:
72 fps, max:
88 fps
fps
100%
GeForce GTX 1060 Mobile:
18.8 [X] MSI GT62VR Intel Core i7-6820HK 2.7GHz
GeForce GTX 1060 Mobile
min:
15 fps
fps
53%
GeForce GTX 1050 Max-Q:
10 fps
252%
GeForce GTX 1080 Ti:
47.4 [X] Nvidia GeForce GTX 1080 Ti Founders Edition Intel Core i7-7740X 4.3GHz
GeForce GTX 1080 Ti
min:
40 fps, max:
53 fps
fps
100%
GeForce GTX 1060 Mobile:
123 [X] MSI GT62VR Intel Core i7-6820HK 2.7GHz
GeForce GTX 1060 Mobile
min:
81 fps
fps
46%
GeForce GTX 1050 Max-Q:
56.4 fps
100%
GeForce GTX 1060 Mobile:
73.1 [X] MSI GT62VR Intel Core i7-6820HK 2.7GHz
GeForce GTX 1060 Mobile
min:
53 fps
fps
49%
GeForce GTX 1050 Max-Q:
36.1 fps
100%
GeForce GTX 1060 Mobile:
68.4 [X] MSI GT62VR Intel Core i7-6820HK 2.7GHz
GeForce GTX 1060 Mobile
min:
51 fps
fps
42%
GeForce GTX 1050 Max-Q:
28.7 fps
100%
GeForce GTX 1060 Mobile:
54.8 [X] MSI GT62VR Intel Core i7-6820HK 2.7GHz
GeForce GTX 1060 Mobile
min:
42 fps
fps
47%
GeForce GTX 1050 Max-Q:
25.7 fps
223%
GeForce GTX 1080 Ti:
122 [X] Nvidia GeForce GTX 1080 Ti Founders Edition Intel Core i7-7740X 4.3GHz
GeForce GTX 1080 Ti
P1:
74.1 fps
fps
100%
GeForce GTX 1060 Mobile:
37.4 [X] MSI GT62VR Intel Core i7-6820HK 2.7GHz
GeForce GTX 1060 Mobile
min:
29 fps
fps
46%
GeForce GTX 1050 Max-Q:
17.3 fps
243%
GeForce GTX 1080 Ti:
91 [X] Nvidia GeForce GTX 1080 Ti Founders Edition Intel Core i7-7740X 4.3GHz
GeForce GTX 1080 Ti
P1:
62.1 fps
fps
100%
GeForce GTX 1060 Mobile:
19.8 [X] MSI GT62VR Intel Core i7-6820HK 2.7GHz
GeForce GTX 1060 Mobile
min:
16 fps
fps
46%
GeForce GTX 1050 Max-Q:
9.1 fps
261%
GeForce GTX 1080 Ti:
51.7 [X] Nvidia GeForce GTX 1080 Ti Founders Edition Intel Core i7-7740X 4.3GHz
GeForce GTX 1080 Ti
P1:
36.8 fps
fps
100%
GeForce GTX 1060 Mobile:
106 [X] MSI GT62VR Intel Core i7-6820HK 2.7GHz
GeForce GTX 1060 Mobile
min:
85 fps
fps
84%
GeForce GTX 1050 Max-Q:
89.1 fps
100%
GeForce GTX 1060 Mobile:
80.1 [X] MSI GT62VR Intel Core i7-6820HK 2.7GHz
GeForce GTX 1060 Mobile
min:
65 fps
fps
51%
GeForce GTX 1050 Max-Q:
41.2 fps
100%
GeForce GTX 1060 Mobile:
68 [X] MSI GT62VR Intel Core i7-6820HK 2.7GHz
GeForce GTX 1060 Mobile
min:
55 fps
fps
43%
GeForce GTX 1050 Max-Q:
29.2 fps
100%
GeForce GTX 1060 Mobile:
45.3 [X] MSI GT62VR Intel Core i7-6820HK 2.7GHz
GeForce GTX 1060 Mobile
min:
37 fps
fps
47%
GeForce GTX 1050 Max-Q:
21.3 fps
208%
GeForce GTX 1080 Ti:
94 [X] Asus X299 Prime Desktop DDR4-3200 Intel Core i9-10980XE 3GHz
GeForce GTX 1080 Ti
P1:
61 fps
fps
100%
GeForce GTX 1060 Mobile:
39.3 [X] MSI GT62VR Intel Core i7-6820HK 2.7GHz
GeForce GTX 1060 Mobile
min:
30 fps
fps
30%
GeForce GTX 1050 Max-Q:
11.7 fps
198%
GeForce GTX 1080 Ti:
78 [X] Asus X299 Prime Desktop DDR4-3200 Intel Core i9-10980XE 3GHz
GeForce GTX 1080 Ti
P1:
52.4 fps
fps
100%
GeForce GTX 1060 Mobile:
21 [X] MSI GT62VR Intel Core i7-6820HK 2.7GHz
GeForce GTX 1060 Mobile
min:
18 fps
fps
35%
GeForce GTX 1050 Max-Q:
7.3 fps
251%
GeForce GTX 1080 Ti:
52.8 [X] Asus X299 Prime Desktop DDR4-3200 Intel Core i9-10980XE 3GHz
GeForce GTX 1080 Ti
P1:
40.7 fps
fps
100%
GeForce GTX 1060 Mobile:
89 [X] MSI GT62VR Intel Core i7-6820HK 2.7GHz
GeForce GTX 1060 Mobile
min:
60 fps
fps
63%
GeForce GTX 1050 Max-Q:
56 fps
100%
GeForce GTX 1060 Mobile:
61 [X] MSI GT62VR Intel Core i7-6820HK 2.7GHz
GeForce GTX 1060 Mobile
min:
47 fps
fps
51%
GeForce GTX 1050 Max-Q:
31 fps
100%
GeForce GTX 1060 Mobile:
55 [X] MSI GT62VR Intel Core i7-6820HK 2.7GHz
GeForce GTX 1060 Mobile
min:
43 fps
fps
53%
GeForce GTX 1050 Max-Q:
29 fps
100%
GeForce GTX 1060 Mobile:
40 [X] MSI GT62VR Intel Core i7-6820HK 2.7GHz
GeForce GTX 1060 Mobile
min:
31 fps
fps
48%
GeForce GTX 1050 Max-Q:
19 fps
203%
GeForce GTX 1080 Ti:
81 [X] Asus X299 Prime Desktop DDR4-3200 Intel Core i9-10980XE 3GHz
GeForce GTX 1080 Ti
min:
59 fps, max:
120 fps
fps
100%
GeForce GTX 1060 Mobile:
27 [X] MSI GT62VR Intel Core i7-6820HK 2.7GHz
GeForce GTX 1060 Mobile
min:
21 fps
fps
41%
GeForce GTX 1050 Max-Q:
11 fps
230%
GeForce GTX 1080 Ti:
62 [X] Asus X299 Prime Desktop DDR4-3200 Intel Core i9-10980XE 3GHz
GeForce GTX 1080 Ti
min:
49 fps, max:
88 fps
fps
100%
GeForce GTX 1060 Mobile:
13 [X] MSI GT62VR Intel Core i7-6820HK 2.7GHz
GeForce GTX 1060 Mobile
min:
10 fps
fps
46%
GeForce GTX 1050 Max-Q:
6 fps
285%
GeForce GTX 1080 Ti:
37 [X] Asus X299 Prime Desktop DDR4-3200 Intel Core i9-10980XE 3GHz
GeForce GTX 1080 Ti
min:
7 fps, max:
49 fps
fps
100%
GeForce GTX 1060 Mobile:
169 [X] MSI GT62VR Intel Core i7-6820HK 2.7GHz
GeForce GTX 1060 Mobile
min:
125 fps
fps
119%
GeForce GTX 1050 Max-Q:
200.7 fps
100%
GeForce GTX 1060 Mobile:
166 [X] MSI GT62VR Intel Core i7-6820HK 2.7GHz
GeForce GTX 1060 Mobile
min:
122 fps
fps
63%
GeForce GTX 1050 Max-Q:
105.2 fps
100%
GeForce GTX 1060 Mobile:
154 [X] MSI GT62VR Intel Core i7-6820HK 2.7GHz
GeForce GTX 1060 Mobile
min:
116 fps
fps
65%
GeForce GTX 1050 Max-Q:
100.7 fps
100%
GeForce GTX 1060 Mobile:
150 [X] MSI GT62VR Intel Core i7-6820HK 2.7GHz
GeForce GTX 1060 Mobile
min:
112 fps
fps
58%
GeForce GTX 1050 Max-Q:
86.4 fps
100%
GeForce GTX 1060 Mobile:
145 [X] MSI GT62VR Intel Core i7-6820HK 2.7GHz
GeForce GTX 1060 Mobile
min:
106 fps
fps
48%
GeForce GTX 1050 Max-Q:
69.4 fps
100%
GeForce GTX 1060 Mobile:
95.2 [X] MSI GT62VR Intel Core i7-6820HK 2.7GHz
GeForce GTX 1060 Mobile
min:
74 fps
fps
49%
GeForce GTX 1050 Max-Q:
47.1 fps
182%
GeForce GTX 1080 Ti:
173 [X] Nvidia GeForce GTX 1080 Ti Founders Edition Intel Core i7-7740X 4.3GHz
GeForce GTX 1080 Ti
P1:
125 fps
fps
100%
GeForce GTX 1060 Mobile:
92.9 [X] MSI GT62VR Intel Core i7-6820HK 2.7GHz
GeForce GTX 1060 Mobile
fps
88%
GeForce GTX 1050 Max-Q:
81.3 fps
156%
GeForce GTX 1080 Ti:
145 [X] Asus Prime X299 Deluxe XMP OC Intel Core i9-9980XE @4.4GHz
GeForce GTX 1080 Ti
fps
100%
GeForce GTX 1060 Mobile:
67.1 [X] MSI GT62VR Intel Core i7-6820HK 2.7GHz
GeForce GTX 1060 Mobile
fps
53%
GeForce GTX 1050 Max-Q:
35.3 fps
191%
GeForce GTX 1080 Ti:
128 [X] Asus Prime X299 Deluxe XMP OC Intel Core i9-9980XE @4.4GHz
GeForce GTX 1080 Ti
fps
100%
GeForce GTX 1060 Mobile:
45.6 [X] MSI GT62VR Intel Core i7-6820HK 2.7GHz
GeForce GTX 1060 Mobile
fps
49%
GeForce GTX 1050 Max-Q:
22.5 fps
226%
GeForce GTX 1080 Ti:
103 [X] Asus Prime X299 Deluxe XMP OC Intel Core i9-9980XE @4.4GHz
GeForce GTX 1080 Ti
fps
100%
GeForce GTX 1060 Mobile:
34.7 [X] MSI GT62VR Intel Core i7-6820HK 2.7GHz
GeForce GTX 1060 Mobile
fps
48%
GeForce GTX 1050 Max-Q:
16.5 fps
246%
GeForce GTX 1080 Ti:
85.4 [X] Asus Prime X299 Deluxe XMP OC Intel Core i9-9980XE @4.4GHz
GeForce GTX 1080 Ti
fps
100%
GeForce GTX 1060 Mobile:
23.8 [X] MSI GT62VR Intel Core i7-6820HK 2.7GHz
GeForce GTX 1060 Mobile
fps
49%
GeForce GTX 1050 Max-Q:
11.6 fps
259%
GeForce GTX 1080 Ti:
61.7 [X] Asus Prime X299 Deluxe XMP OC Intel Core i9-9980XE @4.4GHz
GeForce GTX 1080 Ti
fps
100%
GeForce GTX 1060 Mobile:
12.4 [X] MSI GT62VR Intel Core i7-6820HK 2.7GHz
GeForce GTX 1060 Mobile
fps
40%
GeForce GTX 1050 Max-Q:
4.9 fps
275%
GeForce GTX 1080 Ti:
34.1 [X] Asus Prime X299 Deluxe XMP OC Intel Core i9-9980XE @4.4GHz
GeForce GTX 1080 Ti
fps
100%
GeForce GTX 1060 Mobile:
144 [X] MSI GT62VR Intel Core i7-6820HK 2.7GHz
GeForce GTX 1060 Mobile
min:
129 fps
fps
47%
GeForce GTX 1050 Max-Q:
67.8 fps
162%
GeForce GTX 1080 Ti:
233 [X] Nvidia GeForce GTX 1080 Ti Founders Edition Intel Core i7-7740X 4.3GHz
GeForce GTX 1080 Ti
min:
206 fps, max:
242 fps
fps
100%
GeForce GTX 1060 Mobile:
46.6 [X] MSI GT62VR Intel Core i7-6820HK 2.7GHz
GeForce GTX 1060 Mobile
min:
41 fps
fps
49%
GeForce GTX 1050 Max-Q:
23 fps
230%
GeForce GTX 1080 Ti:
107 [X] Nvidia GeForce GTX 1080 Ti Founders Edition Intel Core i7-7740X 4.3GHz
GeForce GTX 1080 Ti
min:
93 fps, max:
122 fps
fps
100%
GeForce GTX 1060 Mobile:
33.7 [X] MSI GT62VR Intel Core i7-6820HK 2.7GHz
GeForce GTX 1060 Mobile
min:
29 fps
fps
50%
GeForce GTX 1050 Max-Q:
16.8 fps
243%
GeForce GTX 1080 Ti:
82 [X] Nvidia GeForce GTX 1080 Ti Founders Edition Intel Core i7-7740X 4.3GHz
GeForce GTX 1080 Ti
min:
71 fps, max:
92 fps
fps
100%
GeForce GTX 1060 Mobile:
20.8 [X] MSI GT62VR Intel Core i7-6820HK 2.7GHz
GeForce GTX 1060 Mobile
min:
18 fps
fps
50%
GeForce GTX 1050 Max-Q:
10.5 fps
256%
GeForce GTX 1080 Ti:
53.2 [X] Nvidia GeForce GTX 1080 Ti Founders Edition Intel Core i7-7740X 4.3GHz
GeForce GTX 1080 Ti
min:
46 fps, max:
60 fps
fps
100%
GeForce GTX 1060 Mobile:
9.7 [X] MSI GT62VR Intel Core i7-6820HK 2.7GHz
GeForce GTX 1060 Mobile
min:
8 fps
fps
53%
GeForce GTX 1050 Max-Q:
5.1 fps
266%
GeForce GTX 1080 Ti:
25.8 [X] Nvidia GeForce GTX 1080 Ti Founders Edition Intel Core i7-7740X 4.3GHz
GeForce GTX 1080 Ti
min:
22 fps, max:
30 fps
fps
100%
GeForce GTX 1060 Mobile:
167 [X] MSI GT62VR Intel Core i7-6820HK 2.7GHz
GeForce GTX 1060 Mobile
min:
140 fps
fps
80%
GeForce GTX 1050 Max-Q:
134 fps
100%
GeForce GTX 1060 Mobile:
121 [X] MSI GT62VR Intel Core i7-6820HK 2.7GHz
GeForce GTX 1060 Mobile
min:
108 fps
fps
48%
GeForce GTX 1050 Max-Q:
58 fps
100%
GeForce GTX 1060 Mobile:
98 [X] MSI GT62VR Intel Core i7-6820HK 2.7GHz
GeForce GTX 1060 Mobile
min:
91 fps
fps
50%
GeForce GTX 1050 Max-Q:
49 fps
100%
GeForce GTX 1060 Mobile:
68 [X] MSI GT62VR Intel Core i7-6820HK 2.7GHz
GeForce GTX 1060 Mobile
min:
64 fps
fps
63%
GeForce GTX 1050 Max-Q:
43 fps
184%
GeForce GTX 1080 Ti:
125 [X] Nvidia GeForce GTX 1080 Ti Founders Edition Intel Core i7-7740X 4.3GHz
GeForce GTX 1080 Ti
min:
113 fps, max:
136 fps
fps
100%
GeForce GTX 1060 Mobile:
47 [X] MSI GT62VR Intel Core i7-6820HK 2.7GHz
GeForce GTX 1060 Mobile
min:
37 fps
fps
57%
GeForce GTX 1050 Max-Q:
27 fps
260%
GeForce GTX 1080 Ti:
122 [X] Nvidia GeForce GTX 1080 Ti Founders Edition Intel Core i7-7740X 4.3GHz
GeForce GTX 1080 Ti
min:
114 fps, max:
128 fps
fps
100%
GeForce GTX 1060 Mobile:
30 [X] MSI GT62VR Intel Core i7-6820HK 2.7GHz
GeForce GTX 1060 Mobile
min:
28 fps
fps
50%
GeForce GTX 1050 Max-Q:
15 fps
237%
GeForce GTX 1080 Ti:
71 [X] Nvidia GeForce GTX 1080 Ti Founders Edition Intel Core i7-7740X 4.3GHz
GeForce GTX 1080 Ti
min:
65 fps, max:
74 fps
fps
GeForce GTX 1050 Max-Q:
119.3 fps
GeForce GTX 1080 Ti:
249 [X] Nvidia GeForce GTX 1080 Ti Founders Edition Intel Core i7-7740X 4.3GHz
GeForce GTX 1080 Ti
min:
157 fps, max:
375 fps
318 [X] Asus Prime X299 Deluxe XMP OC Intel Core i9-9980XE @4.4GHz
GeForce GTX 1080 Ti
min:
197 fps, max:
443 fps
~ 284 fps
GeForce GTX 1050 Max-Q:
38.5 fps
GeForce GTX 1080 Ti:
151 [X] Nvidia GeForce GTX 1080 Ti Founders Edition Intel Core i7-7740X 4.3GHz
GeForce GTX 1080 Ti
min:
100 fps, max:
222 fps
fps
GeForce GTX 1050 Max-Q:
23.2 fps
GeForce GTX 1080 Ti:
109 [X] Nvidia GeForce GTX 1080 Ti Founders Edition Intel Core i7-7740X 4.3GHz
GeForce GTX 1080 Ti
min:
73 fps, max:
147 fps
fps
GeForce GTX 1050 Max-Q:
16.9 fps
GeForce GTX 1080 Ti:
82.8 [X] Asus Prime X299 Deluxe XMP OC Intel Core i9-9980XE @4.4GHz
GeForce GTX 1080 Ti
min:
73 fps, max:
102 fps
85.4 [X] Nvidia GeForce GTX 1080 Ti Founders Edition Intel Core i7-7740X 4.3GHz
GeForce GTX 1080 Ti
min:
65 fps, max:
108 fps
~ 84 fps
GeForce GTX 1050 Max-Q:
6.5 fps
GeForce GTX 1080 Ti:
59 [X] Nvidia GeForce GTX 1080 Ti Founders Edition Intel Core i7-7740X 4.3GHz
GeForce GTX 1080 Ti
min:
51 fps, max:
69 fps
fps
GeForce GTX 1050 Max-Q:
3.3 fps
GeForce GTX 1080 Ti:
30.6 [X] Nvidia GeForce GTX 1080 Ti Founders Edition Intel Core i7-7740X 4.3GHz
GeForce GTX 1080 Ti
min:
26 fps, max:
34 fps
fps
100%
GeForce GTX 1060 Mobile:
134 [X] MSI GT62VR Intel Core i7-6820HK 2.7GHz
GeForce GTX 1060 Mobile
min:
94 fps
fps
52%
GeForce GTX 1050 Max-Q:
69.5 fps
198%
GeForce GTX 1080 Ti:
265 [X] Nvidia GeForce GTX 1080 Ti Founders Edition Intel Core i7-7740X 4.3GHz
GeForce GTX 1080 Ti
P1:
178.6 fps
fps
100%
GeForce GTX 1060 Mobile:
61.9 [X] MSI GT62VR Intel Core i7-6820HK 2.7GHz
GeForce GTX 1060 Mobile
min:
51 fps
fps
50%
GeForce GTX 1050 Max-Q:
31.1 fps
229%
GeForce GTX 1080 Ti:
142 [X] Nvidia GeForce GTX 1080 Ti Founders Edition Intel Core i7-7740X 4.3GHz
GeForce GTX 1080 Ti
P1:
115.2 fps
fps
100%
GeForce GTX 1060 Mobile:
53.1 [X] MSI GT62VR Intel Core i7-6820HK 2.7GHz
GeForce GTX 1060 Mobile
min:
44 fps
fps
50%
GeForce GTX 1050 Max-Q:
26.6 fps
234%
GeForce GTX 1080 Ti:
124 [X] Nvidia GeForce GTX 1080 Ti Founders Edition Intel Core i7-7740X 4.3GHz
GeForce GTX 1080 Ti
P1:
100.9 fps
fps
100%
GeForce GTX 1060 Mobile:
52.2 [X] MSI GT62VR Intel Core i7-6820HK 2.7GHz
GeForce GTX 1060 Mobile
min:
43 fps
fps
50%
GeForce GTX 1050 Max-Q:
26 fps
232%
GeForce GTX 1080 Ti:
121 [X] Nvidia GeForce GTX 1080 Ti Founders Edition Intel Core i7-7740X 4.3GHz
GeForce GTX 1080 Ti
P1:
98.5 fps
fps
GeForce GTX 1050 Max-Q:
16.3 fps
GeForce GTX 1080 Ti:
80 [X] Nvidia GeForce GTX 1080 Ti Founders Edition Intel Core i7-7740X 4.3GHz
GeForce GTX 1080 Ti
P1:
67.2 fps
fps
GeForce GTX 1050 Max-Q:
4.9 fps
GeForce GTX 1080 Ti:
38.9 [X] Nvidia GeForce GTX 1080 Ti Founders Edition Intel Core i7-7740X 4.3GHz
GeForce GTX 1080 Ti
P1:
34.5 fps
fps
100%
GeForce GTX 1060 Mobile:
69.2 [X] MSI GT62VR Intel Core i7-6820HK 2.7GHz
GeForce GTX 1060 Mobile
min:
63 fps
fps
106%
GeForce GTX 1050 Max-Q:
73.2 fps
100%
GeForce GTX 1060 Mobile:
68.4 [X] MSI GT62VR Intel Core i7-6820HK 2.7GHz
GeForce GTX 1060 Mobile
min:
59 fps
fps
67%
GeForce GTX 1050 Max-Q:
45.8 fps
100%
GeForce GTX 1060 Mobile:
53.7 [X] MSI GT62VR Intel Core i7-6820HK 2.7GHz
GeForce GTX 1060 Mobile
min:
46 fps
fps
49%
GeForce GTX 1050 Max-Q:
26.5 fps
100%
GeForce GTX 1060 Mobile:
25.1 [X] MSI GT62VR Intel Core i7-6820HK 2.7GHz
GeForce GTX 1060 Mobile
min:
23 fps
fps
56%
GeForce GTX 1050 Max-Q:
14.1 fps
203%
GeForce GTX 1080 Ti:
50.9 [X] Nvidia GeForce GTX 1080 Ti Founders Edition Intel Core i7-7740X 4.3GHz
GeForce GTX 1080 Ti
min:
47 fps, max:
57 fps
fps
100%
GeForce GTX 1060 Mobile:
18.3 [X] MSI GT62VR Intel Core i7-6820HK 2.7GHz
GeForce GTX 1060 Mobile
min:
15 fps
fps
55%
GeForce GTX 1050 Max-Q:
10.1 fps
255%
GeForce GTX 1080 Ti:
46.6 [X] Nvidia GeForce GTX 1080 Ti Founders Edition Intel Core i7-7740X 4.3GHz
GeForce GTX 1080 Ti
min:
42 fps, max:
53 fps
fps
100%
GeForce GTX 1060 Mobile:
10.7 [X] MSI GT62VR Intel Core i7-6820HK 2.7GHz
GeForce GTX 1060 Mobile
min:
8 fps
fps
57%
GeForce GTX 1050 Max-Q:
6.1 fps
352%
GeForce GTX 1080 Ti:
37.7 [X] Nvidia GeForce GTX 1080 Ti Founders Edition Intel Core i7-7740X 4.3GHz
GeForce GTX 1080 Ti
min:
35 fps, max:
42 fps
fps
100%
GeForce GTX 1060 Mobile:
125 [X] MSI GT62VR Intel Core i7-6820HK 2.7GHz
GeForce GTX 1060 Mobile
fps
58%
GeForce GTX 1050 Max-Q:
73 fps
158%
GeForce GTX 1080 Ti:
197 [X] Nvidia GeForce GTX 1080 Ti Founders Edition Intel Core i7-7740X 4.3GHz
GeForce GTX 1080 Ti
min:
53.1915 fps, P1:
114.943 fps, max:
322.581 fps
fps
100%
GeForce GTX 1060 Mobile:
78 [X] MSI GT62VR Intel Core i7-6820HK 2.7GHz
GeForce GTX 1060 Mobile
fps
44%
GeForce GTX 1050 Max-Q:
34 fps
197%
GeForce GTX 1080 Ti:
154 [X] Nvidia GeForce GTX 1080 Ti Founders Edition Intel Core i7-7740X 4.3GHz
GeForce GTX 1080 Ti
min:
52.9101 fps, P1:
86.9565 fps, max:
333.333 fps
fps
100%
GeForce GTX 1060 Mobile:
61 [X] MSI GT62VR Intel Core i7-6820HK 2.7GHz
GeForce GTX 1060 Mobile
fps
44%
GeForce GTX 1050 Max-Q:
27 fps
208%
GeForce GTX 1080 Ti:
127 [X] Nvidia GeForce GTX 1080 Ti Founders Edition Intel Core i7-7740X 4.3GHz
GeForce GTX 1080 Ti
min:
45.6621 fps, P1:
70.922 fps, max:
285.714 fps
fps
100%
GeForce GTX 1060 Mobile:
47 [X] MSI GT62VR Intel Core i7-6820HK 2.7GHz
GeForce GTX 1060 Mobile
fps
40%
GeForce GTX 1050 Max-Q:
19 fps
228%
GeForce GTX 1080 Ti:
107 [X] Nvidia GeForce GTX 1080 Ti Founders Edition Intel Core i7-7740X 4.3GHz
GeForce GTX 1080 Ti
min:
44.0529 fps, P1:
64.9351 fps, max:
250 fps
fps
100%
GeForce GTX 1060 Mobile:
32 [X] MSI GT62VR Intel Core i7-6820HK 2.7GHz
GeForce GTX 1060 Mobile
fps
38%
GeForce GTX 1050 Max-Q:
12 fps
234%
GeForce GTX 1080 Ti:
75 [X] Nvidia GeForce GTX 1080 Ti Founders Edition Intel Core i7-7740X 4.3GHz
GeForce GTX 1080 Ti
min:
29.0698 fps, P1:
49.4218 fps, max:
151.515 fps
fps
100%
GeForce GTX 1060 Mobile:
16 [X] MSI GT62VR Intel Core i7-6820HK 2.7GHz
GeForce GTX 1060 Mobile
fps
38%
GeForce GTX 1050 Max-Q:
6 fps
265%
GeForce GTX 1080 Ti:
42.4 [X] Nvidia GeForce GTX 1080 Ti Founders Edition Intel Core i7-7740X 4.3GHz
GeForce GTX 1080 Ti
min:
15.1745 fps, P1:
22.7884 fps, max:
96.1538 fps
fps
100%
GeForce GTX 1060 Mobile:
171 [X] MSI GT62VR Intel Core i7-6820HK 2.7GHz
GeForce GTX 1060 Mobile
min:
155 fps
fps
83%
GeForce GTX 1050 Max-Q:
142.1 fps
100%
GeForce GTX 1060 Mobile:
95.6 [X] MSI GT62VR Intel Core i7-6820HK 2.7GHz
GeForce GTX 1060 Mobile
min:
86 fps
fps
48%
GeForce GTX 1050 Max-Q:
45.7 fps
100%
GeForce GTX 1060 Mobile:
75.2 [X] MSI GT62VR Intel Core i7-6820HK 2.7GHz
GeForce GTX 1060 Mobile
min:
63 fps
fps
52%
GeForce GTX 1050 Max-Q:
38.8 fps
100%
GeForce GTX 1060 Mobile:
45.1 [X] MSI GT62VR Intel Core i7-6820HK 2.7GHz
GeForce GTX 1060 Mobile
min:
40 fps
fps
48%
GeForce GTX 1050 Max-Q:
21.8 fps
211%
GeForce GTX 1080 Ti:
95 [X] Nvidia GeForce GTX 1080 Ti Founders Edition Intel Core i7-7740X 4.3GHz
GeForce GTX 1080 Ti
min:
73 fps, max:
113 fps
fps
100%
GeForce GTX 1060 Mobile:
35 [X] MSI GT62VR Intel Core i7-6820HK 2.7GHz
GeForce GTX 1060 Mobile
min:
31 fps
fps
46%
GeForce GTX 1050 Max-Q:
16.1 fps
214%
GeForce GTX 1080 Ti:
75 [X] Nvidia GeForce GTX 1080 Ti Founders Edition Intel Core i7-7740X 4.3GHz
GeForce GTX 1080 Ti
min:
57 fps, max:
90 fps
fps
GeForce GTX 1050 Max-Q:
8.8 fps
GeForce GTX 1080 Ti:
49.6 [X] Nvidia GeForce GTX 1080 Ti Founders Edition Intel Core i7-7740X 4.3GHz
GeForce GTX 1080 Ti
min:
43 fps, max:
57 fps
fps
100%
GeForce GTX 1060 Mobile:
76.8 [X] MSI GT62VR Intel Core i7-6820HK 2.7GHz
GeForce GTX 1060 Mobile
min:
64 fps
fps
76%
GeForce GTX 1050 Max-Q:
58.2 fps
155%
GeForce GTX 1080 Ti:
119 [X] Nvidia GeForce GTX 1080 Ti Founders Edition Intel Core i7-7740X 4.3GHz
GeForce GTX 1080 Ti
min:
98 fps, max:
148 fps
fps
100%
GeForce GTX 1060 Mobile:
63 [X] MSI GT62VR Intel Core i7-6820HK 2.7GHz
GeForce GTX 1060 Mobile
min:
46 fps
fps
47%
GeForce GTX 1050 Max-Q:
29.9 fps
184%
GeForce GTX 1080 Ti:
116 [X] Nvidia GeForce GTX 1080 Ti Founders Edition Intel Core i7-7740X 4.3GHz
GeForce GTX 1080 Ti
min:
98 fps, max:
138 fps
fps
100%
GeForce GTX 1060 Mobile:
52.6 [X] MSI GT62VR Intel Core i7-6820HK 2.7GHz
GeForce GTX 1060 Mobile
min:
39 fps
fps
54%
GeForce GTX 1050 Max-Q:
28.6 fps
198%
GeForce GTX 1080 Ti:
104 [X] Nvidia GeForce GTX 1080 Ti Founders Edition Intel Core i7-7740X 4.3GHz
GeForce GTX 1080 Ti
min:
71 fps, max:
125 fps
fps
100%
GeForce GTX 1060 Mobile:
48.3 [X] MSI GT62VR Intel Core i7-6820HK 2.7GHz
GeForce GTX 1060 Mobile
min:
37 fps
fps
49%
GeForce GTX 1050 Max-Q:
23.5 fps
205%
GeForce GTX 1080 Ti:
99 [X] Nvidia GeForce GTX 1080 Ti Founders Edition Intel Core i7-7740X 4.3GHz
GeForce GTX 1080 Ti
min:
70 fps, max:
126 fps
fps
100%
GeForce GTX 1060 Mobile:
34.3 [X] MSI GT62VR Intel Core i7-6820HK 2.7GHz
GeForce GTX 1060 Mobile
min:
29 fps
fps
39%
GeForce GTX 1050 Max-Q:
13.5 fps
239%
GeForce GTX 1080 Ti:
82 [X] Nvidia GeForce GTX 1080 Ti Founders Edition Intel Core i7-7740X 4.3GHz
GeForce GTX 1080 Ti
min:
71 fps, max:
92 fps
fps
100%
GeForce GTX 1060 Mobile:
17.7 [X] MSI GT62VR Intel Core i7-6820HK 2.7GHz
GeForce GTX 1060 Mobile
min:
15 fps
fps
39%
GeForce GTX 1050 Max-Q:
6.9 fps
259%
GeForce GTX 1080 Ti:
45.9 [X] Nvidia GeForce GTX 1080 Ti Founders Edition Intel Core i7-7740X 4.3GHz
GeForce GTX 1080 Ti
min:
42 fps, max:
50 fps
fps
100%
GeForce GTX 1060 Mobile:
88 [X] MSI GT62VR Intel Core i7-6820HK 2.7GHz
GeForce GTX 1060 Mobile
min:
67 fps
fps
78%
GeForce GTX 1050 Max-Q:
69 fps
128%
GeForce GTX 1080 Ti:
113 [X] Nvidia GeForce GTX 1080 Ti Founders Edition Intel Core i7-7740X 4.3GHz
GeForce GTX 1080 Ti
min:
87 fps, max:
163 fps
fps
100%
GeForce GTX 1060 Mobile:
69 [X] MSI GT62VR Intel Core i7-6820HK 2.7GHz
GeForce GTX 1060 Mobile
min:
57 fps
fps
57%
GeForce GTX 1050 Max-Q:
39 fps
151%
GeForce GTX 1080 Ti:
104 [X] Nvidia GeForce GTX 1080 Ti Founders Edition Intel Core i7-7740X 4.3GHz
GeForce GTX 1080 Ti
min:
79 fps, max:
150 fps
fps
100%
GeForce GTX 1060 Mobile:
66 [X] MSI GT62VR Intel Core i7-6820HK 2.7GHz
GeForce GTX 1060 Mobile
min:
55 fps
fps
56%
GeForce GTX 1050 Max-Q:
37 fps
155%
GeForce GTX 1080 Ti:
102 [X] Nvidia GeForce GTX 1080 Ti Founders Edition Intel Core i7-7740X 4.3GHz
GeForce GTX 1080 Ti
min:
77 fps, max:
146 fps
fps
100%
GeForce GTX 1060 Mobile:
60 [X] MSI GT62VR Intel Core i7-6820HK 2.7GHz
GeForce GTX 1060 Mobile
min:
47 fps
fps
57%
GeForce GTX 1050 Max-Q:
34 fps
157%
GeForce GTX 1080 Ti:
94 [X] Nvidia GeForce GTX 1080 Ti Founders Edition Intel Core i7-7740X 4.3GHz
GeForce GTX 1080 Ti
min:
68 fps, max:
145 fps
fps
100%
GeForce GTX 1060 Mobile:
45 [X] MSI GT62VR Intel Core i7-6820HK 2.7GHz
GeForce GTX 1060 Mobile
min:
35 fps
fps
53%
GeForce GTX 1050 Max-Q:
24 fps
196%
GeForce GTX 1080 Ti:
88 [X] Nvidia GeForce GTX 1080 Ti Founders Edition Intel Core i7-7740X 4.3GHz
GeForce GTX 1080 Ti
min:
65 fps, max:
121 fps
fps
100%
GeForce GTX 1060 Mobile:
23 [X] MSI GT62VR Intel Core i7-6820HK 2.7GHz
GeForce GTX 1060 Mobile
min:
19 fps
fps
52%
GeForce GTX 1050 Max-Q:
12 fps
248%
GeForce GTX 1080 Ti:
57 [X] Nvidia GeForce GTX 1080 Ti Founders Edition Intel Core i7-7740X 4.3GHz
GeForce GTX 1080 Ti
min:
47 fps, max:
69 fps
fps
100%
GeForce GTX 1060 Mobile:
96.8 [X] MSI GT62VR Intel Core i7-6820HK 2.7GHz
GeForce GTX 1060 Mobile
min:
50 fps
fps
54%
GeForce GTX 1050 Max-Q:
52.1 fps
142%
GeForce GTX 1080 Ti:
137 [X] Nvidia GeForce GTX 1080 Ti Founders Edition Intel Core i7-7740X 4.3GHz
GeForce GTX 1080 Ti
min:
76 fps, max:
217 fps
fps
100%
GeForce GTX 1060 Mobile:
51.3 [X] MSI GT62VR Intel Core i7-6820HK 2.7GHz
GeForce GTX 1060 Mobile
min:
25 fps
fps
49%
GeForce GTX 1050 Max-Q:
24.9 fps
224%
GeForce GTX 1080 Ti:
115 [X] Nvidia GeForce GTX 1080 Ti Founders Edition Intel Core i7-7740X 4.3GHz
GeForce GTX 1080 Ti
min:
54 fps, max:
188 fps
fps
100%
GeForce GTX 1060 Mobile:
37.9 [X] MSI GT62VR Intel Core i7-6820HK 2.7GHz
GeForce GTX 1060 Mobile
min:
19 fps
fps
49%
GeForce GTX 1050 Max-Q:
18.7 fps
227%
GeForce GTX 1080 Ti:
86 [X] Nvidia GeForce GTX 1080 Ti Founders Edition Intel Core i7-7740X 4.3GHz
GeForce GTX 1080 Ti
min:
41 fps, max:
148 fps
fps
100%
GeForce GTX 1060 Mobile:
31 [X] MSI GT62VR Intel Core i7-6820HK 2.7GHz
GeForce GTX 1060 Mobile
min:
17 fps
fps
47%
GeForce GTX 1050 Max-Q:
14.6 fps
226%
GeForce GTX 1080 Ti:
70 [X] Nvidia GeForce GTX 1080 Ti Founders Edition Intel Core i7-7740X 4.3GHz
GeForce GTX 1080 Ti
min:
36 fps, max:
118 fps
fps
100%
GeForce GTX 1060 Mobile:
23 [X] MSI GT62VR Intel Core i7-6820HK 2.7GHz
GeForce GTX 1060 Mobile
min:
14 fps
fps
50%
GeForce GTX 1050 Max-Q:
11.4 fps
242%
GeForce GTX 1080 Ti:
55.7 [X] Nvidia GeForce GTX 1080 Ti Founders Edition Intel Core i7-7740X 4.3GHz
GeForce GTX 1080 Ti
min:
31 fps, max:
93 fps
fps
100%
GeForce GTX 1060 Mobile:
14 [X] MSI GT62VR Intel Core i7-6820HK 2.7GHz
GeForce GTX 1060 Mobile
min:
9 fps
fps
51%
GeForce GTX 1050 Max-Q:
7.1 fps
248%
GeForce GTX 1080 Ti:
34.7 [X] Nvidia GeForce GTX 1080 Ti Founders Edition Intel Core i7-7740X 4.3GHz
GeForce GTX 1080 Ti
min:
22.5 fps, max:
51.7 fps
fps
100%
GeForce GTX 1060 Mobile:
144 [X] MSI GT62VR Intel Core i7-6820HK 2.7GHz
GeForce GTX 1060 Mobile
min:
143 fps
fps
75%
GeForce GTX 1050 Max-Q:
107.9 fps
100%
GeForce GTX 1080 Ti:
144 [X] Nvidia GeForce GTX 1080 Ti Founders Edition Intel Core i7-7740X 4.3GHz
GeForce GTX 1080 Ti
min:
143 fps, max:
145 fps
fps
100%
GeForce GTX 1060 Mobile:
81.1 [X] MSI GT62VR Intel Core i7-6820HK 2.7GHz
GeForce GTX 1060 Mobile
min:
71 fps
fps
55%
GeForce GTX 1050 Max-Q:
44.4 fps
178%
GeForce GTX 1080 Ti:
144 [X] Nvidia GeForce GTX 1080 Ti Founders Edition Intel Core i7-7740X 4.3GHz
GeForce GTX 1080 Ti
min:
143 fps, max:
145 fps
fps
100%
GeForce GTX 1060 Mobile:
71.1 [X] MSI GT62VR Intel Core i7-6820HK 2.7GHz
GeForce GTX 1060 Mobile
min:
62 fps
fps
50%
GeForce GTX 1050 Max-Q:
35.3 fps
203%
GeForce GTX 1080 Ti:
144 [X] Nvidia GeForce GTX 1080 Ti Founders Edition Intel Core i7-7740X 4.3GHz
GeForce GTX 1080 Ti
min:
143 fps, max:
145 fps
fps
100%
GeForce GTX 1060 Mobile:
69 [X] MSI GT62VR Intel Core i7-6820HK 2.7GHz
GeForce GTX 1060 Mobile
min:
56 fps
fps
51%
GeForce GTX 1050 Max-Q:
35.3 fps
209%
GeForce GTX 1080 Ti:
144 [X] Nvidia GeForce GTX 1080 Ti Founders Edition Intel Core i7-7740X 4.3GHz
GeForce GTX 1080 Ti
min:
143 fps, max:
145 fps
fps
100%
GeForce GTX 1060 Mobile:
45.2 [X] MSI GT62VR Intel Core i7-6820HK 2.7GHz
GeForce GTX 1060 Mobile
min:
39 fps
fps
55%
GeForce GTX 1050 Max-Q:
24.8 fps
248%
GeForce GTX 1080 Ti:
112 [X] Nvidia GeForce GTX 1080 Ti Founders Edition Intel Core i7-7740X 4.3GHz
GeForce GTX 1080 Ti
min:
100 fps, max:
136 fps
fps
100%
GeForce GTX 1060 Mobile:
22 [X] MSI GT62VR Intel Core i7-6820HK 2.7GHz
GeForce GTX 1060 Mobile
min:
18 fps
fps
58%
GeForce GTX 1050 Max-Q:
12.7 fps
273%
GeForce GTX 1080 Ti:
60 [X] Nvidia GeForce GTX 1080 Ti Founders Edition Intel Core i7-7740X 4.3GHz
GeForce GTX 1080 Ti
min:
53 fps, max:
74 fps
fps
100%
GeForce GTX 1060 Mobile:
115.5 118 [X] MSI GT62VR Intel Core i7-6820HK 2.7GHz
GeForce GTX 1060 Mobile
min:
109 fps
~ 117 fps
100%
GeForce GTX 1060 Mobile:
73.9 77.8 [X] MSI GT62VR Intel Core i7-6820HK 2.7GHz
GeForce GTX 1060 Mobile
min:
71 fps
~ 76 fps
100%
GeForce GTX 1060 Mobile:
57.7 60.5 [X] MSI GT62VR Intel Core i7-6820HK 2.7GHz
GeForce GTX 1060 Mobile
min:
56 fps
~ 59 fps
100%
GeForce GTX 1060 Mobile:
56.3 57.7 [X] MSI GT62VR Intel Core i7-6820HK 2.7GHz
GeForce GTX 1060 Mobile
min:
51 fps
~ 57 fps
207%
GeForce GTX 1080 Ti:
118 [X] Nvidia GeForce GTX 1080 Ti Founders Edition Intel Core i7-7740X 4.3GHz
GeForce GTX 1080 Ti
min:
111 fps, max:
125 fps
fps
100%
GeForce GTX 1060 Mobile:
39.5 [X] MSI GT62VR Intel Core i7-6820HK 2.7GHz
GeForce GTX 1060 Mobile
min:
35 fps
fps
218%
GeForce GTX 1080 Ti:
86 [X] Nvidia GeForce GTX 1080 Ti Founders Edition Intel Core i7-7740X 4.3GHz
GeForce GTX 1080 Ti
min:
80 fps, max:
91 fps
fps
100%
GeForce GTX 1060 Mobile:
20.7 [X] MSI GT62VR Intel Core i7-6820HK 2.7GHz
GeForce GTX 1060 Mobile
min:
17 fps
fps
333%
GeForce GTX 1080 Ti:
69 [X] Nvidia GeForce GTX 1080 Ti Founders Edition Intel Core i7-7740X 4.3GHz
GeForce GTX 1080 Ti
min:
64 fps, max:
73 fps
fps
100%
GeForce GTX 1060 Mobile:
150 [X] MSI GT62VR Intel Core i7-6820HK 2.7GHz
GeForce GTX 1060 Mobile
min:
76 fps
fps
100%
GeForce GTX 1060 Mobile:
89.4 [X] MSI GT62VR Intel Core i7-6820HK 2.7GHz
GeForce GTX 1060 Mobile
min:
61 fps
fps
38%
GeForce GTX 1050 Max-Q:
33.6 fps
100%
GeForce GTX 1060 Mobile:
74.4 [X] MSI GT62VR Intel Core i7-6820HK 2.7GHz
GeForce GTX 1060 Mobile
min:
55 fps
fps
50%
GeForce GTX 1050 Max-Q:
37.2 fps
100%
GeForce GTX 1060 Mobile:
65.6 [X] MSI GT62VR Intel Core i7-6820HK 2.7GHz
GeForce GTX 1060 Mobile
min:
50 fps
fps
48%
GeForce GTX 1050 Max-Q:
31.5 fps
203%
GeForce GTX 1080 Ti:
133 [X] Nvidia GeForce GTX 1080 Ti Founders Edition Intel Core i7-7740X 4.3GHz
GeForce GTX 1080 Ti
min:
86 fps, max:
154 fps
fps
100%
GeForce GTX 1060 Mobile:
42.9 [X] MSI GT62VR Intel Core i7-6820HK 2.7GHz
GeForce GTX 1060 Mobile
min:
36 fps
fps
240%
GeForce GTX 1080 Ti:
103 [X] Nvidia GeForce GTX 1080 Ti Founders Edition Intel Core i7-7740X 4.3GHz
GeForce GTX 1080 Ti
min:
79 fps, max:
118 fps
fps
100%
GeForce GTX 1060 Mobile:
20.6 [X] MSI GT62VR Intel Core i7-6820HK 2.7GHz
GeForce GTX 1060 Mobile
min:
18 fps
fps
255%
GeForce GTX 1080 Ti:
52.6 [X] Nvidia GeForce GTX 1080 Ti Founders Edition Intel Core i7-7740X 4.3GHz
GeForce GTX 1080 Ti
min:
47 fps, max:
59 fps
fps
100%
GeForce GTX 1060 Mobile:
137 [X] MSI GT62VR Intel Core i7-6820HK 2.7GHz
GeForce GTX 1060 Mobile
min:
99 fps
fps
132%
GeForce GTX 1080 Ti:
181 [X] Nvidia GeForce GTX 1080 Ti Founders Edition Intel Core i7-7740X 4.3GHz
GeForce GTX 1080 Ti
min:
145 fps, max:
201 fps
fps
100%
GeForce GTX 1060 Mobile:
96.3 [X] MSI GT62VR Intel Core i7-6820HK 2.7GHz
GeForce GTX 1060 Mobile
min:
70 fps
fps
48%
GeForce GTX 1050 Max-Q:
46.1 fps
172%
GeForce GTX 1080 Ti:
166 [X] Nvidia GeForce GTX 1080 Ti Founders Edition Intel Core i7-7740X 4.3GHz
GeForce GTX 1080 Ti
min:
124 fps, max:
196 fps
fps
100%
GeForce GTX 1060 Mobile:
81.1 [X] MSI GT62VR Intel Core i7-6820HK 2.7GHz
GeForce GTX 1060 Mobile
min:
63 fps
fps
49%
GeForce GTX 1050 Max-Q:
39.7 fps
190%
GeForce GTX 1080 Ti:
154 [X] Nvidia GeForce GTX 1080 Ti Founders Edition Intel Core i7-7740X 4.3GHz
GeForce GTX 1080 Ti
min:
132 fps, max:
191 fps
fps
100%
GeForce GTX 1060 Mobile:
70.6 [X] MSI GT62VR Intel Core i7-6820HK 2.7GHz
GeForce GTX 1060 Mobile
min:
50 fps
fps
52%
GeForce GTX 1050 Max-Q:
36.5 fps
211%
GeForce GTX 1080 Ti:
149 [X] Nvidia GeForce GTX 1080 Ti Founders Edition Intel Core i7-7740X 4.3GHz
GeForce GTX 1080 Ti
min:
120 fps, max:
198 fps
fps
100%
GeForce GTX 1060 Mobile:
52.8 [X] MSI GT62VR Intel Core i7-6820HK 2.7GHz
GeForce GTX 1060 Mobile
min:
41 fps
fps
223%
GeForce GTX 1080 Ti:
118 [X] Nvidia GeForce GTX 1080 Ti Founders Edition Intel Core i7-7740X 4.3GHz
GeForce GTX 1080 Ti
min:
95 fps, max:
165 fps
fps
100%
GeForce GTX 1060 Mobile:
27.7 [X] MSI GT62VR Intel Core i7-6820HK 2.7GHz
GeForce GTX 1060 Mobile
min:
22 fps
fps
253%
GeForce GTX 1080 Ti:
70 [X] Nvidia GeForce GTX 1080 Ti Founders Edition Intel Core i7-7740X 4.3GHz
GeForce GTX 1080 Ti
min:
54 fps, max:
110 fps
fps
100%
GeForce GTX 1060 Mobile:
149 [X] MSI GT62VR Intel Core i7-6820HK 2.7GHz
GeForce GTX 1060 Mobile
min:
134 fps
195.6 ~ 172 fps
107%
GeForce GTX 1050 Max-Q:
183.8 fps
100%
GeForce GTX 1060 Mobile:
120 [X] MSI GT62VR Intel Core i7-6820HK 2.7GHz
GeForce GTX 1060 Mobile
min:
104 fps
146.9 ~ 133 fps
79%
GeForce GTX 1050 Max-Q:
104.8 fps
100%
GeForce GTX 1060 Mobile:
103 [X] MSI GT62VR Intel Core i7-6820HK 2.7GHz
GeForce GTX 1060 Mobile
min:
94 fps
121.9 ~ 112 fps
58%
GeForce GTX 1050 Max-Q:
64.7 fps
100%
GeForce GTX 1060 Mobile:
87.2 [X] MSI GT62VR Intel Core i7-6820HK 2.7GHz
GeForce GTX 1060 Mobile
min:
78 fps
97.2 ~ 92 fps
51%
GeForce GTX 1050 Max-Q:
46.6 fps
157%
GeForce GTX 1080 Ti:
144 [X] Nvidia GeForce GTX 1080 Ti Founders Edition Intel Core i7-7740X 4.3GHz
GeForce GTX 1080 Ti
min:
123 fps, max:
195 fps
fps
100%
GeForce GTX 1060 Mobile:
62.2 [X] MSI GT62VR Intel Core i7-6820HK 2.7GHz
GeForce GTX 1060 Mobile
min:
54 fps
fps
51%
GeForce GTX 1050 Max-Q:
31.5 fps
GeForce GTX 1050 Max-Q:
15.5 fps
GeForce GTX 1080 Ti:
85 [X] Nvidia GeForce GTX 1080 Ti Founders Edition Intel Core i7-7740X 4.3GHz
GeForce GTX 1080 Ti
min:
69 fps, max:
131 fps
fps
100%
GeForce GTX 1060 Mobile:
59.9 [X] MSI GT62VR Intel Core i7-6820HK 2.7GHz
GeForce GTX 1060 Mobile
min:
55 fps
fps
100%
GeForce GTX 1080 Ti:
59.9 [X] Nvidia GeForce GTX 1080 Ti Founders Edition Intel Core i7-7740X 4.3GHz
GeForce GTX 1080 Ti
fps
100%
GeForce GTX 1060 Mobile:
59.9 [X] MSI GT62VR Intel Core i7-6820HK 2.7GHz
GeForce GTX 1060 Mobile
min:
54 fps
fps
100%
GeForce GTX 1080 Ti:
59.9 [X] Nvidia GeForce GTX 1080 Ti Founders Edition Intel Core i7-7740X 4.3GHz
GeForce GTX 1080 Ti
fps
100%
GeForce GTX 1060 Mobile:
59.8 [X] MSI GT62VR Intel Core i7-6820HK 2.7GHz
GeForce GTX 1060 Mobile
min:
54 fps
fps
100%
GeForce GTX 1080 Ti:
59.9 [X] Nvidia GeForce GTX 1080 Ti Founders Edition Intel Core i7-7740X 4.3GHz
GeForce GTX 1080 Ti
fps
100%
GeForce GTX 1060 Mobile:
59.8 [X] MSI GT62VR Intel Core i7-6820HK 2.7GHz
GeForce GTX 1060 Mobile
min:
51 fps
fps
100%
GeForce GTX 1080 Ti:
59.9 [X] Nvidia GeForce GTX 1080 Ti Founders Edition Intel Core i7-7740X 4.3GHz
GeForce GTX 1080 Ti
fps
100%
GeForce GTX 1060 Mobile:
52.5 [X] MSI GT62VR Intel Core i7-6820HK 2.7GHz
GeForce GTX 1060 Mobile
min:
42 fps
fps
100%
GeForce GTX 1060 Mobile:
27.7 [X] MSI GT62VR Intel Core i7-6820HK 2.7GHz
GeForce GTX 1060 Mobile
min:
23 fps
fps
216%
GeForce GTX 1080 Ti:
59.9 [X] Nvidia GeForce GTX 1080 Ti Founders Edition Intel Core i7-7740X 4.3GHz
GeForce GTX 1080 Ti
min:
56 fps, max:
63 fps
fps
100%
GeForce GTX 1060 Mobile:
65.5 [X] MSI GT62VR Intel Core i7-6820HK 2.7GHz
GeForce GTX 1060 Mobile
min:
53 fps
82 ~ 74 fps
118%
GeForce GTX 1080 Ti:
81 [X] Nvidia GeForce GTX 1080 Ti Founders Edition Intel Core i7-7740X 4.3GHz
GeForce GTX 1080 Ti
min:
45 fps, max:
104 fps
92 [X] Nvidia GeForce GTX 1080 Ti Founders Edition Intel Core i7-7740X 4.3GHz
GeForce GTX 1080 Ti
min:
72 fps, max:
121 fps
~ 87 fps
100%
GeForce GTX 1060 Mobile:
61.8 64.4 [X] MSI GT62VR Intel Core i7-6820HK 2.7GHz
GeForce GTX 1060 Mobile
min:
51 fps
~ 63 fps
130%
GeForce GTX 1080 Ti:
82 [X] Nvidia GeForce GTX 1080 Ti Founders Edition Intel Core i7-7740X 4.3GHz
GeForce GTX 1080 Ti
min:
66 fps, max:
105 fps
fps
100%
GeForce GTX 1060 Mobile:
58.1 58.8 [X] MSI GT62VR Intel Core i7-6820HK 2.7GHz
GeForce GTX 1060 Mobile
min:
48 fps
~ 58 fps
129%
GeForce GTX 1080 Ti:
75 [X] Nvidia GeForce GTX 1080 Ti Founders Edition Intel Core i7-7740X 4.3GHz
GeForce GTX 1080 Ti
fps
100%
GeForce GTX 1060 Mobile:
55.5 57.7 [X] MSI GT62VR Intel Core i7-6820HK 2.7GHz
GeForce GTX 1060 Mobile
min:
46 fps
~ 57 fps
130%
GeForce GTX 1080 Ti:
74 [X] Nvidia GeForce GTX 1080 Ti Founders Edition Intel Core i7-7740X 4.3GHz
GeForce GTX 1080 Ti
fps
100%
GeForce GTX 1060 Mobile:
42.4 [X] MSI GT62VR Intel Core i7-6820HK 2.7GHz
GeForce GTX 1060 Mobile
min:
35 fps
fps
170%
GeForce GTX 1080 Ti:
72 [X] Nvidia GeForce GTX 1080 Ti Founders Edition Intel Core i7-7740X 4.3GHz
GeForce GTX 1080 Ti
min:
55 fps, max:
97 fps
fps
100%
GeForce GTX 1060 Mobile:
21.6 [X] MSI GT62VR Intel Core i7-6820HK 2.7GHz
GeForce GTX 1060 Mobile
min:
18 fps
fps
240%
GeForce GTX 1080 Ti:
51.9 [X] Nvidia GeForce GTX 1080 Ti Founders Edition Intel Core i7-7740X 4.3GHz
GeForce GTX 1080 Ti
min:
45 fps, max:
59 fps
fps
100%
GeForce GTX 1060 Mobile:
132 [X] MSI GT62VR Intel Core i7-6820HK 2.7GHz
GeForce GTX 1060 Mobile
min:
115 fps
142 ~ 137 fps
139%
GeForce GTX 1080 Ti:
191 [X] Nvidia GeForce GTX 1080 Ti Founders Edition Intel Core i7-7740X 4.3GHz
GeForce GTX 1080 Ti
min:
159 fps, max:
213 fps
fps
100%
GeForce GTX 1060 Mobile:
74.6 81.8 [X] MSI GT62VR Intel Core i7-6820HK 2.7GHz
GeForce GTX 1060 Mobile
min:
58 fps
~ 78 fps
208%
GeForce GTX 1080 Ti:
162 [X] Nvidia GeForce GTX 1080 Ti Founders Edition Intel Core i7-7740X 4.3GHz
GeForce GTX 1080 Ti
min:
135 fps, max:
201 fps
fps
100%
GeForce GTX 1060 Mobile:
69.4 72.5 75.9 [X] MSI GT62VR Intel Core i7-6820HK 2.7GHz
GeForce GTX 1060 Mobile
min:
52 fps
~ 73 fps
204%
GeForce GTX 1080 Ti:
149 [X] Nvidia GeForce GTX 1080 Ti Founders Edition Intel Core i7-7740X 4.3GHz
GeForce GTX 1080 Ti
min:
130 fps, max:
180 fps
fps
100%
GeForce GTX 1060 Mobile:
63.1 65.9 69.6 [X] MSI GT62VR Intel Core i7-6820HK 2.7GHz
GeForce GTX 1060 Mobile
min:
50 fps
~ 66 fps
220%
GeForce GTX 1080 Ti:
145 [X] Nvidia GeForce GTX 1080 Ti Founders Edition Intel Core i7-7740X 4.3GHz
GeForce GTX 1080 Ti
min:
128 fps, max:
171 fps
fps
100%
GeForce GTX 1060 Mobile:
40.7 [X] MSI GT62VR Intel Core i7-6820HK 2.7GHz
GeForce GTX 1060 Mobile
min:
28 fps
fps
265%
GeForce GTX 1080 Ti:
108 [X] Nvidia GeForce GTX 1080 Ti Founders Edition Intel Core i7-7740X 4.3GHz
GeForce GTX 1080 Ti
min:
75 fps, max:
138 fps
fps
100%
GeForce GTX 1060 Mobile:
21.5 [X] MSI GT62VR Intel Core i7-6820HK 2.7GHz
GeForce GTX 1060 Mobile
min:
13 fps
fps
261%
GeForce GTX 1080 Ti:
56.1 [X] Nvidia GeForce GTX 1080 Ti Founders Edition Intel Core i7-7740X 4.3GHz
GeForce GTX 1080 Ti
min:
37 fps, max:
73 fps
fps
100%
GeForce GTX 1060 Mobile:
67 [X] MSI GT62VR Intel Core i7-6820HK 2.7GHz
GeForce GTX 1060 Mobile
min:
37 fps
90 ~ 79 fps
71%
GeForce GTX 1050 Max-Q:
56 fps
138%
GeForce GTX 1080 Ti:
109 [X] Nvidia GeForce GTX 1080 Ti Founders Edition Intel Core i7-7740X 4.3GHz
GeForce GTX 1080 Ti
min:
53 fps, max:
150 fps
fps
100%
GeForce GTX 1060 Mobile:
61 [X] MSI GT62VR Intel Core i7-6820HK 2.7GHz
GeForce GTX 1060 Mobile
min:
35 fps
63 ~ 62 fps
60%
GeForce GTX 1050 Max-Q:
37 fps
161%
GeForce GTX 1080 Ti:
100 [X] Nvidia GeForce GTX 1080 Ti Founders Edition Intel Core i7-7740X 4.3GHz
GeForce GTX 1080 Ti
min:
55 fps, max:
144 fps
fps
100%
GeForce GTX 1060 Mobile:
52 54 [X] MSI GT62VR Intel Core i7-6820HK 2.7GHz
GeForce GTX 1060 Mobile
min:
29 fps
54 ~ 53 fps
58%
GeForce GTX 1050 Max-Q:
31 fps
170%
GeForce GTX 1080 Ti:
90 [X] Nvidia GeForce GTX 1080 Ti Founders Edition Intel Core i7-7740X 4.3GHz
GeForce GTX 1080 Ti
min:
55 fps, max:
133 fps
fps
100%
GeForce GTX 1060 Mobile:
32 37 40 [X] MSI GT62VR Intel Core i7-6820HK 2.7GHz
GeForce GTX 1060 Mobile
min:
23 fps
~ 36 fps
44%
GeForce GTX 1050 Max-Q:
16 fps
197%
GeForce GTX 1080 Ti:
71 [X] Nvidia GeForce GTX 1080 Ti Founders Edition Intel Core i7-7740X 4.3GHz
GeForce GTX 1080 Ti
min:
34 fps, max:
113 fps
fps
100%
GeForce GTX 1060 Mobile:
27 [X] MSI GT62VR Intel Core i7-6820HK 2.7GHz
GeForce GTX 1060 Mobile
min:
18 fps
fps
37%
GeForce GTX 1050 Max-Q:
10 fps
230%
GeForce GTX 1080 Ti:
62 [X] Nvidia GeForce GTX 1080 Ti Founders Edition Intel Core i7-7740X 4.3GHz
GeForce GTX 1080 Ti
min:
34 fps, max:
107 fps
fps
100%
GeForce GTX 1060 Mobile:
18 [X] MSI GT62VR Intel Core i7-6820HK 2.7GHz
GeForce GTX 1060 Mobile
min:
13 fps
fps
33%
GeForce GTX 1050 Max-Q:
6 fps
222%
GeForce GTX 1080 Ti:
40 [X] Nvidia GeForce GTX 1080 Ti Founders Edition Intel Core i7-7740X 4.3GHz
GeForce GTX 1080 Ti
min:
19 fps, max:
83 fps
fps
100%
GeForce GTX 1060 Mobile:
135 [X] MSI GT62VR Intel Core i7-6820HK 2.7GHz
GeForce GTX 1060 Mobile
min:
125 fps
fps
132%
GeForce GTX 1080 Ti:
178 [X] Nvidia GeForce GTX 1080 Ti Founders Edition Intel Core i7-7740X 4.3GHz
GeForce GTX 1080 Ti
min:
165 fps, max:
213 fps
fps
100%
GeForce GTX 1060 Mobile:
102 [X] MSI GT62VR Intel Core i7-6820HK 2.7GHz
GeForce GTX 1060 Mobile
min:
88 fps
fps
144%
GeForce GTX 1080 Ti:
147 [X] Nvidia GeForce GTX 1080 Ti Founders Edition Intel Core i7-7740X 4.3GHz
GeForce GTX 1080 Ti
min:
130 fps, max:
181 fps
fps
100%
GeForce GTX 1060 Mobile:
85 96 [X] MSI GT62VR Intel Core i7-6820HK 2.7GHz
GeForce GTX 1060 Mobile
min:
80 fps
~ 91 fps
159%
GeForce GTX 1080 Ti:
145 [X] Nvidia GeForce GTX 1080 Ti Founders Edition Intel Core i7-7740X 4.3GHz
GeForce GTX 1080 Ti
min:
126 fps, max:
180 fps
fps
100%
GeForce GTX 1060 Mobile:
66 75 [X] MSI GT62VR Intel Core i7-6820HK 2.7GHz
GeForce GTX 1060 Mobile
min:
65 fps
~ 71 fps
169%
GeForce GTX 1080 Ti:
120 [X] Nvidia GeForce GTX 1080 Ti Founders Edition Intel Core i7-7740X 4.3GHz
GeForce GTX 1080 Ti
min:
102 fps, max:
158 fps
fps
100%
GeForce GTX 1060 Mobile:
57 [X] MSI GT62VR Intel Core i7-6820HK 2.7GHz
GeForce GTX 1060 Mobile
min:
49 fps
fps
179%
GeForce GTX 1080 Ti:
102 [X] Nvidia GeForce GTX 1080 Ti Founders Edition Intel Core i7-7740X 4.3GHz
GeForce GTX 1080 Ti
min:
90 fps, max:
131 fps
fps
100%
GeForce GTX 1060 Mobile:
35 [X] MSI GT62VR Intel Core i7-6820HK 2.7GHz
GeForce GTX 1060 Mobile
min:
30 fps
fps
214%
GeForce GTX 1080 Ti:
75 [X] Nvidia GeForce GTX 1080 Ti Founders Edition Intel Core i7-7740X 4.3GHz
GeForce GTX 1080 Ti
min:
67 fps, max:
93 fps
fps
100%
GeForce GTX 1060 Mobile:
249 [X] MSI GT62VR Intel Core i7-6820HK 2.7GHz
GeForce GTX 1060 Mobile
min:
232 fps
fps
125%
GeForce GTX 1080 Ti:
311 [X] Nvidia GeForce GTX 1080 Ti Founders Edition Intel Core i7-7740X 4.3GHz
GeForce GTX 1080 Ti
min:
295 fps, max:
337 fps
fps
100%
GeForce GTX 1060 Mobile:
229 [X] MSI GT62VR Intel Core i7-6820HK 2.7GHz
GeForce GTX 1060 Mobile
min:
213 fps
fps
128%
GeForce GTX 1080 Ti:
293 [X] Nvidia GeForce GTX 1080 Ti Founders Edition Intel Core i7-7740X 4.3GHz
GeForce GTX 1080 Ti
min:
28 fps, max:
345 fps
fps
100%
GeForce GTX 1060 Mobile:
205 214 [X] MSI GT62VR Intel Core i7-6820HK 2.7GHz
GeForce GTX 1060 Mobile
min:
176 fps
~ 210 fps
46%
GeForce GTX 1050 Max-Q:
96.5 fps
135%
GeForce GTX 1080 Ti:
284 [X] Nvidia GeForce GTX 1080 Ti Founders Edition Intel Core i7-7740X 4.3GHz
GeForce GTX 1080 Ti
min:
268 fps, max:
322 fps
fps
100%
GeForce GTX 1060 Mobile:
198 [X] MSI GT62VR Intel Core i7-6820HK 2.7GHz
GeForce GTX 1060 Mobile
min:
166 fps
203 ~ 201 fps
50%
GeForce GTX 1050 Max-Q:
100.8 fps
140%
GeForce GTX 1080 Ti:
281 [X] Nvidia GeForce GTX 1080 Ti Founders Edition Intel Core i7-7740X 4.3GHz
GeForce GTX 1080 Ti
min:
265 fps, max:
318 fps
fps
100%
GeForce GTX 1060 Mobile:
173 [X] MSI GT62VR Intel Core i7-6820HK 2.7GHz
GeForce GTX 1060 Mobile
min:
142 fps
fps
153%
GeForce GTX 1080 Ti:
265 [X] Nvidia GeForce GTX 1080 Ti Founders Edition Intel Core i7-7740X 4.3GHz
GeForce GTX 1080 Ti
min:
231 fps, max:
301 fps
fps
100%
GeForce GTX 1060 Mobile:
83.4 [X] MSI GT62VR Intel Core i7-6820HK 2.7GHz
GeForce GTX 1060 Mobile
min:
66 fps
fps
207%
GeForce GTX 1080 Ti:
173 [X] Nvidia GeForce GTX 1080 Ti Founders Edition Intel Core i7-7740X 4.3GHz
GeForce GTX 1080 Ti
min:
146 fps, max:
192 fps
fps
100%
GeForce GTX 1060 Mobile:
108 [X] MSI GT62VR Intel Core i7-6820HK 2.7GHz
GeForce GTX 1060 Mobile
min:
81 fps
111 ~ 110 fps
46%
GeForce GTX 1050 Max-Q:
44 57 ~ 51 fps
145%
GeForce GTX 1080 Ti:
143 [X] Nvidia GeForce GTX 1080 Ti Founders Edition Intel Core i7-7740X 4.3GHz
GeForce GTX 1080 Ti
min:
99 fps, max:
198 fps
177 [X] Asus Prime X299 Deluxe XMP OC Intel Core i9-9980XE @4.4GHz
GeForce GTX 1080 Ti
~ 160 fps
100%
GeForce GTX 1060 Mobile:
56 64 [X] MSI GT62VR Intel Core i7-6820HK 2.7GHz
GeForce GTX 1060 Mobile
min:
51 fps
~ 60 fps
50%
GeForce GTX 1050 Max-Q:
27 33 ~ 30 fps
200%
GeForce GTX 1080 Ti:
120 [X] Nvidia GeForce GTX 1080 Ti Founders Edition Intel Core i7-7740X 4.3GHz
GeForce GTX 1080 Ti
min:
113 fps, max:
253 fps
fps
100%
GeForce GTX 1060 Mobile:
51 53 56 58 [X] MSI GT62VR Intel Core i7-6820HK 2.7GHz
GeForce GTX 1060 Mobile
min:
48 fps
~ 55 fps
47%
GeForce GTX 1050 Max-Q:
25 26 ~ 26 fps
211%
GeForce GTX 1080 Ti:
116 [X] Nvidia GeForce GTX 1080 Ti Founders Edition Intel Core i7-7740X 4.3GHz
GeForce GTX 1080 Ti
min:
107 fps, max:
226 fps
fps
100%
GeForce GTX 1060 Mobile:
43 47 49 50 [X] MSI GT62VR Intel Core i7-6820HK 2.7GHz
GeForce GTX 1060 Mobile
min:
39 fps
~ 47 fps
49%
GeForce GTX 1050 Max-Q:
22 23 ~ 23 fps
234%
GeForce GTX 1080 Ti:
107 [X] Nvidia GeForce GTX 1080 Ti Founders Edition Intel Core i7-7740X 4.3GHz
GeForce GTX 1080 Ti
min:
92 fps, max:
210 fps
113 [X] Asus Prime X299 Deluxe XMP OC Intel Core i9-9980XE @4.4GHz
GeForce GTX 1080 Ti
~ 110 fps
100%
GeForce GTX 1060 Mobile:
32 [X] MSI GT62VR Intel Core i7-6820HK 2.7GHz
GeForce GTX 1060 Mobile
min:
26 fps
fps
50%
GeForce GTX 1050 Max-Q:
16 fps
228%
GeForce GTX 1080 Ti:
73 [X] Nvidia GeForce GTX 1080 Ti Founders Edition Intel Core i7-7740X 4.3GHz
GeForce GTX 1080 Ti
min:
65 fps, max:
132 fps
fps
100%
GeForce GTX 1060 Mobile:
16 [X] MSI GT62VR Intel Core i7-6820HK 2.7GHz
GeForce GTX 1060 Mobile
min:
13 fps
fps
50%
GeForce GTX 1050 Max-Q:
8 fps
256%
GeForce GTX 1080 Ti:
41 [X] Nvidia GeForce GTX 1080 Ti Founders Edition Intel Core i7-7740X 4.3GHz
GeForce GTX 1080 Ti
min:
36 fps, max:
66 fps
41 [X] Asus Prime X299 Deluxe XMP OC Intel Core i9-9980XE @4.4GHz
GeForce GTX 1080 Ti
~ 41 fps
100%
GeForce GTX 1060 Mobile:
237 [X] HP Omen 15-dc0006ng 1.47.22.14 D3D12
Intel Core i7-8750H 2.2GHz
GeForce GTX 1060 Mobile
min:
101.7 fps, P1:
161.7 fps, max:
379 fps
fps
135%
GeForce GTX 1080 Ti:
319 [X] Aorus Z370 Ultra Gaming Desktop DDR4-2666 1.47.22.14 D3D12
Intel Core i7-8086K 3.7GHz
GeForce GTX 1080 Ti
min:
177 fps, P1:
234 fps, max:
526 fps
fps
100%
GeForce GTX 1060 Mobile:
105.6 [X] HP Omen 15-dc0006ng 1.47.22.14 D3D12
Intel Core i7-8750H 2.2GHz
GeForce GTX 1060 Mobile
min:
61.5 fps, P1:
89.7 fps, max:
234 fps
fps
234%
GeForce GTX 1080 Ti:
247 [X] Aorus Z370 Ultra Gaming Desktop DDR4-2666 1.47.22.14 D3D12
Intel Core i7-8086K 3.7GHz
GeForce GTX 1080 Ti
min:
159 fps, P1:
198 fps, max:
341 fps
fps
100%
GeForce GTX 1060 Mobile:
79.5 [X] HP Omen 15-dc0006ng 1.47.22.14 D3D12
Intel Core i7-8750H 2.2GHz
GeForce GTX 1060 Mobile
min:
51.8 fps, P1:
61.6 fps, max:
174.1 fps
fps
247%
GeForce GTX 1080 Ti:
196 [X] Aorus Z370 Ultra Gaming Desktop DDR4-2666 1.47.22.14 D3D12
Intel Core i7-8086K 3.7GHz
GeForce GTX 1080 Ti
min:
133 fps, P1:
152 fps, max:
309 fps
fps
100%
GeForce GTX 1060 Mobile:
68 [X] HP Omen 15-dc0006ng 1.47.22.14 D3D12
Intel Core i7-8750H 2.2GHz
GeForce GTX 1060 Mobile
min:
43.9 fps, P1:
54.3 fps, max:
165 fps
fps
246%
GeForce GTX 1080 Ti:
167 [X] Aorus Z370 Ultra Gaming Desktop DDR4-2666 1.47.22.14 D3D12
Intel Core i7-8086K 3.7GHz
GeForce GTX 1080 Ti
min:
115 fps, P1:
132 fps, max:
301 fps
fps
GeForce GTX 1080 Ti:
123 [X] Aorus Z370 Ultra Gaming Desktop DDR4-2666 1.47.22.14 D3D12
Intel Core i7-8086K 3.7GHz
GeForce GTX 1080 Ti
min:
99 fps, P1:
101 fps, max:
176 fps
fps
GeForce GTX 1080 Ti:
71.5 [X] Aorus Z370 Ultra Gaming Desktop DDR4-2666 1.47.22.14 D3D12
Intel Core i7-8086K 3.7GHz
GeForce GTX 1080 Ti
min:
61.3 fps, P1:
62.5 fps, max:
95.2 fps
fps
100%
GeForce GTX 1060 Mobile:
150 [X] MSI GT62VR Intel Core i7-6820HK 2.7GHz
GeForce GTX 1060 Mobile
min:
119 fps
fps
69%
GeForce GTX 1050 Max-Q:
104 fps
165%
GeForce GTX 1080 Ti:
248 [X] Nvidia GeForce GTX 1080 Ti Founders Edition Intel Core i7-7740X 4.3GHz
GeForce GTX 1080 Ti
min:
200 fps, max:
274 fps
fps
100%
GeForce GTX 1060 Mobile:
119 [X] MSI GT62VR Intel Core i7-6820HK 2.7GHz
GeForce GTX 1060 Mobile
min:
108 fps
fps
53%
GeForce GTX 1050 Max-Q:
63 fps
181%
GeForce GTX 1080 Ti:
215 [X] Nvidia GeForce GTX 1080 Ti Founders Edition Intel Core i7-7740X 4.3GHz
GeForce GTX 1080 Ti
min:
180 fps, max:
232 fps
fps
100%
GeForce GTX 1060 Mobile:
84 92 95 [X] MSI GT62VR Intel Core i7-6820HK 2.7GHz
GeForce GTX 1060 Mobile
min:
84 fps
97 ~ 92 fps
51%
GeForce GTX 1050 Max-Q:
47 fps
183%
GeForce GTX 1080 Ti:
168 [X] Nvidia GeForce GTX 1080 Ti Founders Edition Intel Core i7-7740X 4.3GHz
GeForce GTX 1080 Ti
min:
144 fps, max:
185 fps
fps
100%
GeForce GTX 1060 Mobile:
58 60 60 61 [X] MSI GT62VR Intel Core i7-6820HK 2.7GHz
GeForce GTX 1060 Mobile
min:
52 fps
~ 60 fps
48%
GeForce GTX 1050 Max-Q:
29 fps
215%
GeForce GTX 1080 Ti:
129 [X] Nvidia GeForce GTX 1080 Ti Founders Edition Intel Core i7-7740X 4.3GHz
GeForce GTX 1080 Ti
min:
113 fps, max:
138 fps
fps
100%
GeForce GTX 1060 Mobile:
47 [X] MSI GT62VR Intel Core i7-6820HK 2.7GHz
GeForce GTX 1060 Mobile
min:
42 fps
fps
230%
GeForce GTX 1080 Ti:
108 [X] Nvidia GeForce GTX 1080 Ti Founders Edition Intel Core i7-7740X 4.3GHz
GeForce GTX 1080 Ti
min:
95 fps, max:
117 fps
fps
GeForce GTX 1050 Max-Q:
13 fps
GeForce GTX 1080 Ti:
69 [X] Nvidia GeForce GTX 1080 Ti Founders Edition Intel Core i7-7740X 4.3GHz
GeForce GTX 1080 Ti
min:
64 fps, max:
72 fps
fps
100%
GeForce GTX 1060 Mobile:
85.5 [X] MSI GT62VR Intel Core i7-6820HK 2.7GHz
GeForce GTX 1060 Mobile
min:
79 fps
fps
86%
GeForce GTX 1050 Max-Q:
73.7 fps
133%
GeForce GTX 1080 Ti:
114 [X] Nvidia GeForce GTX 1080 Ti Founders Edition Intel Core i7-7740X 4.3GHz
GeForce GTX 1080 Ti
min:
104 fps, max:
122 fps
fps
100%
GeForce GTX 1060 Mobile:
68.9 [X] MSI GT62VR Intel Core i7-6820HK 2.7GHz
GeForce GTX 1060 Mobile
min:
56 fps
fps
46%
GeForce GTX 1050 Max-Q:
32 fps
160%
GeForce GTX 1080 Ti:
110 [X] Nvidia GeForce GTX 1080 Ti Founders Edition Intel Core i7-7740X 4.3GHz
GeForce GTX 1080 Ti
min:
101 fps, max:
119 fps
fps
100%
GeForce GTX 1060 Mobile:
50.8 56.5 59.1 [X] MSI GT62VR Intel Core i7-6820HK 2.7GHz
GeForce GTX 1060 Mobile
min:
48 fps
~ 55 fps
44%
GeForce GTX 1050 Max-Q:
24 fps
196%
GeForce GTX 1080 Ti:
108 [X] Nvidia GeForce GTX 1080 Ti Founders Edition Intel Core i7-7740X 4.3GHz
GeForce GTX 1080 Ti
min:
98 fps, max:
117 fps
fps
100%
GeForce GTX 1060 Mobile:
40.6 44.9 46.7 [X] MSI GT62VR Intel Core i7-6820HK 2.7GHz
GeForce GTX 1060 Mobile
min:
39 fps
~ 44 fps
45%
GeForce GTX 1050 Max-Q:
20 fps
232%
GeForce GTX 1080 Ti:
102 [X] Nvidia GeForce GTX 1080 Ti Founders Edition Intel Core i7-7740X 4.3GHz
GeForce GTX 1080 Ti
min:
83 fps, max:
115 fps
fps
100%
GeForce GTX 1060 Mobile:
28.6 [X] MSI GT62VR Intel Core i7-6820HK 2.7GHz
GeForce GTX 1060 Mobile
min:
25 fps
fps
245%
GeForce GTX 1080 Ti:
70 [X] Nvidia GeForce GTX 1080 Ti Founders Edition Intel Core i7-7740X 4.3GHz
GeForce GTX 1080 Ti
min:
61 fps, max:
79 fps
fps
100%
GeForce GTX 1060 Mobile:
13.5 [X] MSI GT62VR Intel Core i7-6820HK 2.7GHz
GeForce GTX 1060 Mobile
min:
12 fps
fps
43%
GeForce GTX 1050 Max-Q:
5.8 fps
239%
GeForce GTX 1080 Ti:
32.3 [X] Nvidia GeForce GTX 1080 Ti Founders Edition Intel Core i7-7740X 4.3GHz
GeForce GTX 1080 Ti
min:
29 fps, max:
38 fps
fps
100%
GeForce GTX 1060 Mobile:
60 [X] MSI GT62VR Intel Core i7-6820HK 2.7GHz
GeForce GTX 1060 Mobile
min:
59 fps
fps
100%
GeForce GTX 1080 Ti:
60 [X] Nvidia GeForce GTX 1080 Ti Founders Edition Intel Core i7-7740X 4.3GHz
GeForce GTX 1080 Ti
fps
100%
GeForce GTX 1060 Mobile:
60 [X] MSI GT62VR Intel Core i7-6820HK 2.7GHz
GeForce GTX 1060 Mobile
min:
59 fps
fps
70%
GeForce GTX 1050 Max-Q:
42 fps
100%
GeForce GTX 1080 Ti:
60 [X] Nvidia GeForce GTX 1080 Ti Founders Edition Intel Core i7-7740X 4.3GHz
GeForce GTX 1080 Ti
fps
100%
GeForce GTX 1060 Mobile:
59.4 60 [X] MSI GT62VR Intel Core i7-6820HK 2.7GHz
GeForce GTX 1060 Mobile
min:
59 fps
60 60 60 ~ 60 fps
62%
GeForce GTX 1050 Max-Q:
37 fps
100%
GeForce GTX 1080 Ti:
60 [X] Nvidia GeForce GTX 1080 Ti Founders Edition Intel Core i7-7740X 4.3GHz
GeForce GTX 1080 Ti
fps
100%
GeForce GTX 1060 Mobile:
58 59.9 59.9 60 [X] MSI GT62VR Intel Core i7-6820HK 2.7GHz
GeForce GTX 1060 Mobile
min:
58 fps
60 ~ 60 fps
56%
GeForce GTX 1050 Max-Q:
33.4 fps
100%
GeForce GTX 1080 Ti:
60 [X] Nvidia GeForce GTX 1080 Ti Founders Edition Intel Core i7-7740X 4.3GHz
GeForce GTX 1080 Ti
min:
59 fps, max:
61 fps
fps
100%
GeForce GTX 1060 Mobile:
41.9 [X] MSI GT62VR Intel Core i7-6820HK 2.7GHz
GeForce GTX 1060 Mobile
min:
38 fps
fps
143%
GeForce GTX 1080 Ti:
60 [X] Nvidia GeForce GTX 1080 Ti Founders Edition Intel Core i7-7740X 4.3GHz
GeForce GTX 1080 Ti
min:
58 fps, max:
62 fps
fps
100%
GeForce GTX 1060 Mobile:
21.4 [X] MSI GT62VR Intel Core i7-6820HK 2.7GHz
GeForce GTX 1060 Mobile
min:
19 fps
fps
49%
GeForce GTX 1050 Max-Q:
10.4 fps
216%
GeForce GTX 1080 Ti:
46.3 [X] Nvidia GeForce GTX 1080 Ti Founders Edition Intel Core i7-7740X 4.3GHz
GeForce GTX 1080 Ti
min:
42 fps, max:
51 fps
fps
100%
GeForce GTX 1060 Mobile:
105 [X] MSI GT62VR Intel Core i7-6820HK 2.7GHz
GeForce GTX 1060 Mobile
min:
83 fps
fps
66%
GeForce GTX 1050 Max-Q:
66 71 ~ 69 fps
129%
GeForce GTX 1080 Ti:
115 [X] Nvidia GeForce GTX 1080 Ti FE Asus Prime B350-PLUS AMD Ryzen 7 1800X 3.6GHz
GeForce GTX 1080 Ti
min:
90 fps, max:
157 fps
129 [X] Asus X299 Prime Desktop DDR4-2666 Intel Core i9-9980XE 3GHz
GeForce GTX 1080 Ti
min:
100 fps, max:
178 fps
142 [X] Asus X299 Prime Desktop Intel Core i9-10980XE 3GHz
GeForce GTX 1080 Ti
min:
110 fps, max:
197 fps
155 [X] Nvidia GeForce GTX 1080 Ti Founders Edition Intel Core i7-7740X 4.3GHz
GeForce GTX 1080 Ti
min:
122 fps, max:
98 fps
~ 135 fps
100%
GeForce GTX 1060 Mobile:
74 [X] MSI GT62VR Intel Core i7-6820HK 2.7GHz
GeForce GTX 1060 Mobile
min:
61 fps
75 ~ 75 fps
49%
GeForce GTX 1050 Max-Q:
35 38 ~ 37 fps
160%
GeForce GTX 1080 Ti:
105 [X] Nvidia GeForce GTX 1080 Ti FE Asus Prime B350-PLUS AMD Ryzen 7 1800X 3.6GHz
GeForce GTX 1080 Ti
min:
83 fps, max:
143 fps
135 [X] Nvidia GeForce GTX 1080 Ti Founders Edition Intel Core i7-7740X 4.3GHz
GeForce GTX 1080 Ti
min:
110 fps, max:
172 fps
~ 120 fps
100%
GeForce GTX 1060 Mobile:
62 68 [X] MSI GT62VR Intel Core i7-6820HK 2.7GHz
GeForce GTX 1060 Mobile
min:
59 fps
68 69 69 ~ 67 fps
51%
GeForce GTX 1050 Max-Q:
33 35 ~ 34 fps
175%
GeForce GTX 1080 Ti:
103 [X] Nvidia GeForce GTX 1080 Ti FE Asus Prime B350-PLUS AMD Ryzen 7 1800X 3.6GHz
GeForce GTX 1080 Ti
min:
80 fps, max:
148 fps
131 [X] Nvidia GeForce GTX 1080 Ti Founders Edition Intel Core i7-7740X 4.3GHz
GeForce GTX 1080 Ti
min:
108 fps, max:
161 fps
~ 117 fps
100%
GeForce GTX 1060 Mobile:
59 64 [X] MSI GT62VR Intel Core i7-6820HK 2.7GHz
GeForce GTX 1060 Mobile
min:
54 fps
64 64 65 ~ 63 fps
49%
GeForce GTX 1050 Max-Q:
30 32 ~ 31 fps
175%
GeForce GTX 1080 Ti:
98 [X] Nvidia GeForce GTX 1080 Ti FE Asus Prime B350-PLUS AMD Ryzen 7 1800X 3.6GHz
GeForce GTX 1080 Ti
min:
70 fps, max:
132 fps
106 [X] Asus X299 Prime Desktop DDR4-2666 Intel Core i9-9980XE 3GHz
GeForce GTX 1080 Ti
min:
80 fps, max:
146 fps
112 [X] Asus X299 Prime Desktop Intel Core i9-10980XE 3GHz
GeForce GTX 1080 Ti
min:
86 fps, max:
156 fps
124 [X] Nvidia GeForce GTX 1080 Ti Founders Edition Intel Core i7-7740X 4.3GHz
GeForce GTX 1080 Ti
min:
96 fps, max:
153 fps
~ 110 fps
100%
GeForce GTX 1060 Mobile:
43 [X] MSI GT62VR Intel Core i7-6820HK 2.7GHz
GeForce GTX 1060 Mobile
min:
36 fps
fps
51%
GeForce GTX 1050 Max-Q:
22 fps
226%
GeForce GTX 1080 Ti:
97 [X] Nvidia GeForce GTX 1080 Ti Founders Edition Intel Core i7-7740X 4.3GHz
GeForce GTX 1080 Ti
min:
85 fps, max:
116 fps
fps
100%
GeForce GTX 1060 Mobile:
21 [X] MSI GT62VR Intel Core i7-6820HK 2.7GHz
GeForce GTX 1060 Mobile
min:
18 fps
fps
52%
GeForce GTX 1050 Max-Q:
10 11 ~ 11 fps
257%
GeForce GTX 1080 Ti:
51 [X] Nvidia GeForce GTX 1080 Ti FE Asus Prime B350-PLUS AMD Ryzen 7 1800X 3.6GHz
GeForce GTX 1080 Ti
min:
44 fps, max:
61 fps
53 [X] Nvidia GeForce GTX 1080 Ti Founders Edition Intel Core i7-7740X 4.3GHz
GeForce GTX 1080 Ti
min:
45 fps, max:
67 fps
56 [X] Asus X299 Prime Desktop DDR4-2666 Intel Core i9-9980XE 3GHz
GeForce GTX 1080 Ti
min:
49 fps, max:
65 fps
56 [X] Asus X299 Prime Desktop Intel Core i9-10980XE 3GHz
GeForce GTX 1080 Ti
min:
50 fps, max:
67 fps
~ 54 fps
GeForce GTX 1050 Max-Q:
429.1 fps
GeForce GTX 1050 Max-Q:
132.4 fps
GeForce GTX 1050 Max-Q:
51.4 fps
GeForce GTX 1050 Max-Q:
32.5 fps
GeForce GTX 1050 Max-Q:
16 fps
GeForce GTX 1080 Ti:
77 [X] Asus Prime X299 Deluxe XMP OC Intel Core i9-9980XE @4.4GHz
GeForce GTX 1080 Ti
max:
105 fps
fps
100%
GeForce GTX 1060 Mobile:
96 fps
93%
GeForce GTX 1050 Max-Q:
88.8 fps
109%
GeForce GTX 1080 Ti:
68.4 [X] AMD Ryzen 3 1200 3.1GHz
GeForce GTX 1080 Ti
81 [X] Asus Crosshair VI Hero AMD Ryzen 5 1600 3.2GHz
GeForce GTX 1080 Ti
98 [X] Nvidia GeForce GTX 1080 Ti FE Asus Prime B350-PLUS AMD Ryzen 7 1800X 3.6GHz
GeForce GTX 1080 Ti
101 [X] Intel Core i7-4790K 4GHz
GeForce GTX 1080 Ti
110 [X] Asus X299 Prime Desktop DDR4-3200 Intel Core i9-9980XE 3GHz
GeForce GTX 1080 Ti
111 [X] Asus X299 Prime Desktop DDR4-2666 Intel Core i9-9980XE 3GHz
GeForce GTX 1080 Ti
117 [X] Nvidia GeForce GTX 1080 Ti Founders Edition Intel Core i7-7740X 4.3GHz
GeForce GTX 1080 Ti
119 [X] Asus X299 Prime Desktop Intel Core i9-10980XE 3GHz
GeForce GTX 1080 Ti
120 [X] Asus X299 Prime Desktop DDR4-3200 Intel Core i9-10980XE 3GHz
GeForce GTX 1080 Ti
125 [X] Aorus Z370 Ultra Gaming Desktop DDR4-2666 Intel Core i7-8086K 3.7GHz
GeForce GTX 1080 Ti
~ 105 fps
100%
GeForce GTX 1060 Mobile:
82.1 fps
99%
GeForce GTX 1050 Max-Q:
80.9 fps
116%
GeForce GTX 1080 Ti:
61.6 [X] AMD Ryzen 3 1200 3.1GHz
GeForce GTX 1080 Ti
72.8 [X] Asus Crosshair VI Hero AMD Ryzen 5 1600 3.2GHz
GeForce GTX 1080 Ti
88 [X] Nvidia GeForce GTX 1080 Ti FE Asus Prime B350-PLUS AMD Ryzen 7 1800X 3.6GHz
GeForce GTX 1080 Ti
90 [X] Intel Core i7-4790K 4GHz
GeForce GTX 1080 Ti
103 [X] Asus X299 Prime Desktop DDR4-3200 Intel Core i9-9980XE 3GHz
GeForce GTX 1080 Ti
103 [X] Asus X299 Prime Desktop DDR4-2666 Intel Core i9-9980XE 3GHz
GeForce GTX 1080 Ti
104 [X] Nvidia GeForce GTX 1080 Ti Founders Edition Intel Core i7-7740X 4.3GHz
GeForce GTX 1080 Ti
108 [X] Asus X299 Prime Desktop Intel Core i9-10980XE 3GHz
GeForce GTX 1080 Ti
110 [X] Asus X299 Prime Desktop DDR4-3200 Intel Core i9-10980XE 3GHz
GeForce GTX 1080 Ti
113 [X] Aorus Z370 Ultra Gaming Desktop DDR4-2666 Intel Core i7-8086K 3.7GHz
GeForce GTX 1080 Ti
~ 95 fps
100%
GeForce GTX 1060 Mobile:
70.4 fps
92%
GeForce GTX 1050 Max-Q:
65.1 fps
112%
GeForce GTX 1080 Ti:
52.2 [X] AMD Ryzen 3 1200 3.1GHz
GeForce GTX 1080 Ti
60.1 [X] Asus Crosshair VI Hero AMD Ryzen 5 1600 3.2GHz
GeForce GTX 1080 Ti
71 [X] Nvidia GeForce GTX 1080 Ti FE Asus Prime B350-PLUS AMD Ryzen 7 1800X 3.6GHz
GeForce GTX 1080 Ti
74.5 [X] Intel Core i7-4790K 4GHz
GeForce GTX 1080 Ti
85 [X] Asus X299 Prime Desktop DDR4-3200 Intel Core i9-9980XE 3GHz
GeForce GTX 1080 Ti
86 [X] Asus X299 Prime Desktop DDR4-2666 Intel Core i9-9980XE 3GHz
GeForce GTX 1080 Ti
86.8 [X] Nvidia GeForce GTX 1080 Ti Founders Edition Intel Core i7-7740X 4.3GHz
GeForce GTX 1080 Ti
89 [X] Asus X299 Prime Desktop Intel Core i9-10980XE 3GHz
GeForce GTX 1080 Ti
90 [X] Asus X299 Prime Desktop DDR4-3200 Intel Core i9-10980XE 3GHz
GeForce GTX 1080 Ti
93 [X] Aorus Z370 Ultra Gaming Desktop DDR4-2666 Intel Core i7-8086K 3.7GHz
GeForce GTX 1080 Ti
~ 79 fps
GeForce GTX 1050 Max-Q:
30.3 fps
GeForce GTX 1080 Ti:
45.7 [X] AMD Ryzen 3 1200 3.1GHz
GeForce GTX 1080 Ti
52.5 [X] Asus Crosshair VI Hero AMD Ryzen 5 1600 3.2GHz
GeForce GTX 1080 Ti
61.7 [X] Nvidia GeForce GTX 1080 Ti FE Asus Prime B350-PLUS AMD Ryzen 7 1800X 3.6GHz
GeForce GTX 1080 Ti
67.6 [X] Intel Core i7-4790K 4GHz
GeForce GTX 1080 Ti
72 [X] Asus X299 Prime Desktop DDR4-3200 Intel Core i9-9980XE 3GHz
GeForce GTX 1080 Ti
72 [X] Asus X299 Prime Desktop DDR4-2666 Intel Core i9-9980XE 3GHz
GeForce GTX 1080 Ti
75 [X] Asus X299 Prime Desktop Intel Core i9-10980XE 3GHz
GeForce GTX 1080 Ti
75.6 [X] Nvidia GeForce GTX 1080 Ti Founders Edition Intel Core i7-7740X 4.3GHz
GeForce GTX 1080 Ti
77 [X] Asus X299 Prime Desktop DDR4-3200 Intel Core i9-10980XE 3GHz
GeForce GTX 1080 Ti
81 [X] Aorus Z370 Ultra Gaming Desktop DDR4-2666 Intel Core i7-8086K 3.7GHz
GeForce GTX 1080 Ti
~ 68 fps
100%
GeForce GTX 1060 Mobile:
112 [X] MSI GT62VR Intel Core i7-6820HK 2.7GHz
GeForce GTX 1060 Mobile
min:
93 fps
fps
73%
GeForce GTX 1050 Max-Q:
82.1 fps
138%
GeForce GTX 1080 Ti:
155 [X] Intel Core i7-4790K 4GHz
GeForce GTX 1080 Ti
min:
131 fps, max:
182 fps
fps
100%
GeForce GTX 1060 Mobile:
74.7 [X] MSI GT62VR Intel Core i7-6820HK 2.7GHz
GeForce GTX 1060 Mobile
min:
65 fps
fps
49%
GeForce GTX 1050 Max-Q:
36.8 fps
163%
GeForce GTX 1080 Ti:
122 [X] Intel Core i7-4790K 4GHz
GeForce GTX 1080 Ti
min:
102 fps, max:
146 fps
fps
100%
GeForce GTX 1060 Mobile:
43.6 57.1 60.3 62 [X] MSI GT62VR Intel Core i7-6820HK 2.7GHz
GeForce GTX 1060 Mobile
min:
52 fps
~ 56 fps
53%
GeForce GTX 1050 Max-Q:
29.5 fps
171%
GeForce GTX 1080 Ti:
96 [X] Intel Core i7-4790K 4GHz
GeForce GTX 1080 Ti
min:
65 fps, max:
123 fps
fps
100%
GeForce GTX 1060 Mobile:
36 38 43 43.9 45.2 [X] MSI GT62VR Intel Core i7-6820HK 2.7GHz
GeForce GTX 1060 Mobile
min:
37 fps
~ 41 fps
52%
GeForce GTX 1050 Max-Q:
21.5 fps
178%
GeForce GTX 1080 Ti:
73 [X] Intel Core i7-4790K 4GHz
GeForce GTX 1080 Ti
min:
53 fps, max:
92 fps
fps
100%
GeForce GTX 1060 Mobile:
28.4 [X] MSI GT62VR Intel Core i7-6820HK 2.7GHz
GeForce GTX 1060 Mobile
min:
23 fps
fps
195%
GeForce GTX 1080 Ti:
55.3 [X] Intel Core i7-4790K 4GHz
GeForce GTX 1080 Ti
min:
42 fps, max:
68 fps
fps
100%
GeForce GTX 1060 Mobile:
13.7 [X] MSI GT62VR Intel Core i7-6820HK 2.7GHz
GeForce GTX 1060 Mobile
min:
11 fps
13.9 ~ 14 fps
43%
GeForce GTX 1050 Max-Q:
6 fps
221%
GeForce GTX 1080 Ti:
31 [X] Intel Core i7-4790K 4GHz
GeForce GTX 1080 Ti
min:
24 fps, max:
36 fps
fps
100%
GeForce GTX 1060 Mobile:
110 [X] MSI GT62VR Intel Core i7-6820HK 2.7GHz
GeForce GTX 1060 Mobile
min:
54 fps
fps
52%
GeForce GTX 1050 Max-Q:
56.9 fps
152%
GeForce GTX 1080 Ti:
160 [X] Aorus Z370 Ultra Gaming Desktop DDR4-2666 1.3
Intel Core i7-8086K 3.7GHz
GeForce GTX 1080 Ti
173 [X] Intel Core i7-4790K 4GHz
GeForce GTX 1080 Ti
min:
112 fps, max:
218 fps
~ 167 fps
100%
GeForce GTX 1060 Mobile:
58.6 [X] MSI GT62VR Intel Core i7-6820HK 2.7GHz
GeForce GTX 1060 Mobile
min:
46 fps
62.4 ~ 61 fps
48%
GeForce GTX 1050 Max-Q:
29.3 fps
213%
GeForce GTX 1080 Ti:
129 [X] Intel Core i7-4790K 4GHz
GeForce GTX 1080 Ti
min:
89 fps, max:
169 fps
131 [X] Aorus Z370 Ultra Gaming Desktop DDR4-2666 1.3
Intel Core i7-8086K 3.7GHz
GeForce GTX 1080 Ti
~ 130 fps
100%
GeForce GTX 1060 Mobile:
37.2 39.8 41 [X] MSI GT62VR Intel Core i7-6820HK 2.7GHz
GeForce GTX 1060 Mobile
min:
3 fps
42 47.3 ~ 41 fps
50%
GeForce GTX 1050 Max-Q:
20.6 fps
237%
GeForce GTX 1080 Ti:
92 [X] Intel Core i7-4790K 4GHz
GeForce GTX 1080 Ti
max:
131 fps
101 [X] Aorus Z370 Ultra Gaming Desktop DDR4-2666 1.3
Intel Core i7-8086K 3.7GHz
GeForce GTX 1080 Ti
~ 97 fps
GeForce GTX 1080 Ti:
76.3 [X] Aorus Z370 Ultra Gaming Desktop DDR4-2666 1.3
Intel Core i7-8086K 3.7GHz
GeForce GTX 1080 Ti
fps
100%
GeForce GTX 1060 Mobile:
16.4 16.7 [X] MSI GT62VR Intel Core i7-6820HK 2.7GHz
GeForce GTX 1060 Mobile
~ 17 fps
46%
GeForce GTX 1050 Max-Q:
7.9 fps
253%
GeForce GTX 1080 Ti:
41 [X] Nvidia GeForce GTX 1080 Ti FE Asus Prime B350-PLUS AMD Ryzen 7 1800X 3.6GHz
GeForce GTX 1080 Ti
max:
59 fps
42.3 [X] Intel Core i7-4790K 4GHz
GeForce GTX 1080 Ti
min:
31 fps, max:
64 fps
43.5 [X] Nvidia GeForce GTX 1080 Ti Founders Edition Intel Core i7-7740X 4.3GHz
GeForce GTX 1080 Ti
min:
28 fps, max:
64 fps
45.8 [X] Aorus Z370 Ultra Gaming Desktop DDR4-2666 1.3
Intel Core i7-8086K 3.7GHz
GeForce GTX 1080 Ti
~ 43 fps
100%
GeForce GTX 1060 Mobile:
208 [X] MSI GT62VR Intel Core i7-6820HK 2.7GHz
GeForce GTX 1060 Mobile
min:
177 fps
fps
69%
GeForce GTX 1050 Max-Q:
142.8 fps
100%
GeForce GTX 1060 Mobile:
177 [X] MSI GT62VR Intel Core i7-6820HK 2.7GHz
GeForce GTX 1060 Mobile
min:
153 fps
fps
63%
GeForce GTX 1050 Max-Q:
111.8 fps
100%
GeForce GTX 1060 Mobile:
91.5 99.6 105 [X] MSI GT62VR Intel Core i7-6820HK 2.7GHz
GeForce GTX 1060 Mobile
min:
97 fps
110 114 ~ 104 fps
48%
GeForce GTX 1050 Max-Q:
49.4 fps
195%
GeForce GTX 1080 Ti:
203 [X] Intel Core i7-4790K 4GHz
GeForce GTX 1080 Ti
min:
181 fps, max:
226 fps
fps
100%
GeForce GTX 1060 Mobile:
77.5 80.4 [X] MSI GT62VR Intel Core i7-6820HK 2.7GHz
GeForce GTX 1060 Mobile
min:
75 fps
81.2 81.4 84.4 ~ 81 fps
45%
GeForce GTX 1050 Max-Q:
36.5 fps
201%
GeForce GTX 1080 Ti:
163 [X] Intel Core i7-4790K 4GHz
GeForce GTX 1080 Ti
min:
148 fps, max:
180 fps
fps
100%
GeForce GTX 1060 Mobile:
50.3 [X] MSI GT62VR Intel Core i7-6820HK 2.7GHz
GeForce GTX 1060 Mobile
min:
47 fps
fps
213%
GeForce GTX 1080 Ti:
107 [X] Intel Core i7-4790K 4GHz
GeForce GTX 1080 Ti
min:
99 fps, max:
117 fps
fps
100%
GeForce GTX 1060 Mobile:
22.7 23.6 [X] MSI GT62VR Intel Core i7-6820HK 2.7GHz
GeForce GTX 1060 Mobile
min:
22 fps
~ 23 fps
40%
GeForce GTX 1050 Max-Q:
9.3 fps
223%
GeForce GTX 1080 Ti:
51.4 [X] Intel Core i7-4790K 4GHz
GeForce GTX 1080 Ti
min:
49 fps, max:
54 fps
fps
100%
GeForce GTX 1060 Mobile:
161 [X] MSI GT62VR Intel Core i7-6820HK 2.7GHz
GeForce GTX 1060 Mobile
min:
125 fps
fps
51%
GeForce GTX 1050 Max-Q:
82.5 fps
111%
GeForce GTX 1080 Ti:
179 [X] Intel Core i7-4790K 4GHz
GeForce GTX 1080 Ti
min:
148 fps, max:
212 fps
fps
100%
GeForce GTX 1060 Mobile:
111 [X] MSI GT62VR Intel Core i7-6820HK 2.7GHz
GeForce GTX 1060 Mobile
min:
97 fps
fps
51%
GeForce GTX 1050 Max-Q:
56.5 fps
150%
GeForce GTX 1080 Ti:
167 [X] Intel Core i7-4790K 4GHz
GeForce GTX 1080 Ti
min:
130 fps, max:
196 fps
fps
100%
GeForce GTX 1060 Mobile:
61.1 74.3 74.8 80.6 97.9 [X] MSI GT62VR Intel Core i7-6820HK 2.7GHz
GeForce GTX 1060 Mobile
min:
86 fps
~ 78 fps
63%
GeForce GTX 1050 Max-Q:
48.8 fps
182%
GeForce GTX 1080 Ti:
142 [X] Intel Core i7-4790K 4GHz
GeForce GTX 1080 Ti
min:
112 fps, max:
164 fps
fps
100%
GeForce GTX 1060 Mobile:
55 62 62.3 62.3 71 [X] MSI GT62VR Intel Core i7-6820HK 2.7GHz
GeForce GTX 1060 Mobile
min:
64 fps
~ 63 fps
52%
GeForce GTX 1050 Max-Q:
32.7 fps
246%
GeForce GTX 1080 Ti:
155 [X] Intel Core i7-4790K 4GHz
GeForce GTX 1080 Ti
min:
121 fps, max:
177 fps
fps
100%
GeForce GTX 1060 Mobile:
44.5 [X] MSI GT62VR Intel Core i7-6820HK 2.7GHz
GeForce GTX 1060 Mobile
min:
41 fps
fps
247%
GeForce GTX 1080 Ti:
110 [X] Intel Core i7-4790K 4GHz
GeForce GTX 1080 Ti
min:
100 fps, max:
122 fps
fps
100%
GeForce GTX 1060 Mobile:
21.8 [X] MSI GT62VR Intel Core i7-6820HK 2.7GHz
GeForce GTX 1060 Mobile
min:
19 fps
fps
34%
GeForce GTX 1050 Max-Q:
7.4 fps
259%
GeForce GTX 1080 Ti:
56.4 [X] Intel Core i7-4790K 4GHz
GeForce GTX 1080 Ti
min:
52 fps, max:
62 fps
fps
100%
GeForce GTX 1060 Mobile:
106 [X] MSI GT62VR Intel Core i7-6820HK 2.7GHz
GeForce GTX 1060 Mobile
min:
77 fps
fps
100%
GeForce GTX 1060 Mobile:
99 [X] MSI GT62VR Intel Core i7-6820HK 2.7GHz
GeForce GTX 1060 Mobile
min:
62 fps
fps
100%
GeForce GTX 1060 Mobile:
69.1 77.8 82.1 84.8 87.1 [X] MSI GT62VR Intel Core i7-6820HK 2.7GHz
GeForce GTX 1060 Mobile
min:
56 fps
~ 80 fps
100%
GeForce GTX 1060 Mobile:
66.2 73.7 77 77.1 81.4 [X] MSI GT62VR Intel Core i7-6820HK 2.7GHz
GeForce GTX 1060 Mobile
min:
53 fps
~ 75 fps
179%
GeForce GTX 1080 Ti:
134 [X] Intel Core i7-4790K 4GHz
GeForce GTX 1080 Ti
min:
93 fps, max:
171 fps
fps
100%
GeForce GTX 1060 Mobile:
51.7 [X] MSI GT62VR Intel Core i7-6820HK 2.7GHz
GeForce GTX 1060 Mobile
min:
33 fps
fps
226%
GeForce GTX 1080 Ti:
117 [X] Intel Core i7-4790K 4GHz
GeForce GTX 1080 Ti
min:
78 fps, max:
137 fps
fps
100%
GeForce GTX 1060 Mobile:
25.9 [X] MSI GT62VR Intel Core i7-6820HK 2.7GHz
GeForce GTX 1060 Mobile
min:
16 fps
fps
251%
GeForce GTX 1080 Ti:
65 [X] Intel Core i7-4790K 4GHz
GeForce GTX 1080 Ti
min:
44 fps, max:
76 fps
fps
100%
GeForce GTX 1060 Mobile:
187 [X] MSI GT62VR Intel Core i7-6820HK 2.7GHz
GeForce GTX 1060 Mobile
min:
123 fps
fps
77%
GeForce GTX 1050 Max-Q:
144.8 fps
100%
GeForce GTX 1060 Mobile:
176 [X] MSI GT62VR Intel Core i7-6820HK 2.7GHz
GeForce GTX 1060 Mobile
min:
117 fps
fps
57%
GeForce GTX 1050 Max-Q:
99.6 fps
100%
GeForce GTX 1060 Mobile:
92.3 93.8 93.9 [X] MSI GT62VR Intel Core i7-6820HK 2.7GHz
GeForce GTX 1060 Mobile
min:
75 fps
94.5 96.3 ~ 94 fps
50%
GeForce GTX 1050 Max-Q:
46.7 fps
100%
GeForce GTX 1060 Mobile:
68.2 70.4 70.5 71.6 74.6 [X] MSI GT62VR Intel Core i7-6820HK 2.7GHz
GeForce GTX 1060 Mobile
min:
61 fps
~ 71 fps
52%
GeForce GTX 1050 Max-Q:
36.7 fps
225%
GeForce GTX 1080 Ti:
160 [X] Intel Core i7-4790K 4GHz
GeForce GTX 1080 Ti
min:
118 fps, max:
196 fps
fps
100%
GeForce GTX 1060 Mobile:
53.6 [X] MSI GT62VR Intel Core i7-6820HK 2.7GHz
GeForce GTX 1060 Mobile
min:
42 fps
fps
244%
GeForce GTX 1080 Ti:
131 [X] Intel Core i7-4790K 4GHz
GeForce GTX 1080 Ti
min:
106 fps, max:
153 fps
fps
100%
GeForce GTX 1060 Mobile:
31.9 [X] MSI GT62VR Intel Core i7-6820HK 2.7GHz
GeForce GTX 1060 Mobile
min:
25 fps
fps
50%
GeForce GTX 1050 Max-Q:
16.1 fps
257%
GeForce GTX 1080 Ti:
82 [X] Intel Core i7-4790K 4GHz
GeForce GTX 1080 Ti
min:
68 fps, max:
96 fps
fps
100%
GeForce GTX 1060 Mobile:
195 [X] MSI GT62VR Intel Core i7-6820HK 2.7GHz
GeForce GTX 1060 Mobile
min:
125 fps
fps
100%
GeForce GTX 1060 Mobile:
105 [X] MSI GT62VR Intel Core i7-6820HK 2.7GHz
GeForce GTX 1060 Mobile
min:
68 fps
fps
100%
GeForce GTX 1060 Mobile:
77.4 78 81.5 [X] MSI GT62VR Intel Core i7-6820HK 2.7GHz
GeForce GTX 1060 Mobile
min:
61 fps
83.4 85.2 ~ 81 fps
100%
GeForce GTX 1060 Mobile:
70.7 72.2 73.9 [X] MSI GT62VR Intel Core i7-6820HK 2.7GHz
GeForce GTX 1060 Mobile
min:
50 fps
76.3 78.7 ~ 74 fps
216%
GeForce GTX 1080 Ti:
160 [X] Intel Core i7-4790K 4GHz
GeForce GTX 1080 Ti
fps
100%
GeForce GTX 1060 Mobile:
48.7 [X] MSI GT62VR Intel Core i7-6820HK 2.7GHz
GeForce GTX 1060 Mobile
min:
37 fps
fps
100%
GeForce GTX 1060 Mobile:
26.1 [X] MSI GT62VR Intel Core i7-6820HK 2.7GHz
GeForce GTX 1060 Mobile
min:
23 fps
27.1 ~ 27 fps
241%
GeForce GTX 1080 Ti:
65.2 [X] Intel Core i7-4790K 4GHz
GeForce GTX 1080 Ti
fps
100%
GeForce GTX 1060 Mobile:
67 [X] MSI GT62VR Intel Core i7-6820HK 2.7GHz
GeForce GTX 1060 Mobile
min:
23 fps
fps
88%
GeForce GTX 1050 Max-Q:
59 fps
100%
GeForce GTX 1060 Mobile:
62 [X] MSI GT62VR Intel Core i7-6820HK 2.7GHz
GeForce GTX 1060 Mobile
min:
13 fps
74 ~ 68 fps
59%
GeForce GTX 1050 Max-Q:
40 fps
100%
GeForce GTX 1060 Mobile:
49 57 60 [X] MSI GT62VR Intel Core i7-6820HK 2.7GHz
GeForce GTX 1060 Mobile
min:
11 fps
65 66 ~ 59 fps
59%
GeForce GTX 1050 Max-Q:
35 fps
100%
GeForce GTX 1060 Mobile:
42 47 50 [X] MSI GT62VR Intel Core i7-6820HK 2.7GHz
GeForce GTX 1060 Mobile
min:
10 fps
54 56 ~ 50 fps
56%
GeForce GTX 1050 Max-Q:
28 fps
158%
GeForce GTX 1080 Ti:
79 [X] Intel Core i7-4790K 4GHz
GeForce GTX 1080 Ti
min:
42 fps, max:
124 fps
fps
100%
GeForce GTX 1060 Mobile:
39 [X] MSI GT62VR Intel Core i7-6820HK 2.7GHz
GeForce GTX 1060 Mobile
min:
7 fps
fps
100%
GeForce GTX 1060 Mobile:
22 [X] MSI GT62VR Intel Core i7-6820HK 2.7GHz
GeForce GTX 1060 Mobile
min:
5 fps
fps
50%
GeForce GTX 1050 Max-Q:
11 fps
223%
GeForce GTX 1080 Ti:
49 [X] Intel Core i7-4790K 4GHz
GeForce GTX 1080 Ti
min:
31 fps, max:
84 fps
fps
100%
GeForce GTX 1060 Mobile:
125 [X] MSI GT62VR Intel Core i7-6820HK 2.7GHz
GeForce GTX 1060 Mobile
min:
96 fps
fps
66%
GeForce GTX 1050 Max-Q:
82.2 fps
100%
GeForce GTX 1060 Mobile:
108 [X] MSI GT62VR Intel Core i7-6820HK 2.7GHz
GeForce GTX 1060 Mobile
min:
69 fps
fps
53%
GeForce GTX 1050 Max-Q:
57.4 fps
100%
GeForce GTX 1060 Mobile:
85 93.8 94.1 94.2 98.2 [X] MSI GT62VR Intel Core i7-6820HK 2.7GHz
GeForce GTX 1060 Mobile
min:
63 fps
~ 93 fps
55%
GeForce GTX 1050 Max-Q:
51.6 fps
168%
GeForce GTX 1080 Ti:
156 [X] Intel Core i7-4790K 4GHz
GeForce GTX 1080 Ti
P1:
8.3 fps
fps
100%
GeForce GTX 1060 Mobile:
71.4 78.4 78.4 79.7 [X] MSI GT62VR Intel Core i7-6820HK 2.7GHz
GeForce GTX 1060 Mobile
min:
56 fps
81.3 ~ 78 fps
49%
GeForce GTX 1050 Max-Q:
38.1 fps
203%
GeForce GTX 1080 Ti:
158 [X] Intel Core i7-4790K 4GHz
GeForce GTX 1080 Ti
P1:
8.3 fps
fps
100%
GeForce GTX 1060 Mobile:
39.6 [X] MSI GT62VR Intel Core i7-6820HK 2.7GHz
GeForce GTX 1060 Mobile
min:
33 fps
fps
100%
GeForce GTX 1060 Mobile:
19.3 [X] MSI GT62VR Intel Core i7-6820HK 2.7GHz
GeForce GTX 1060 Mobile
min:
17 fps
fps
70%
GeForce GTX 1050 Max-Q:
13.5 fps
267%
GeForce GTX 1080 Ti:
51.5 [X] Intel Core i7-4790K 4GHz
GeForce GTX 1080 Ti
P1:
22.8 fps
fps
100%
GeForce GTX 1060 Mobile:
120 [X] MSI GT62VR Intel Core i7-6820HK 2.7GHz
GeForce GTX 1060 Mobile
min:
117 fps
fps
100%
GeForce GTX 1060 Mobile:
84.5 [X] MSI GT62VR Intel Core i7-6820HK 2.7GHz
GeForce GTX 1060 Mobile
min:
78 fps
fps
100%
GeForce GTX 1060 Mobile:
68 68.1 69.1 [X] MSI GT62VR Intel Core i7-6820HK 2.7GHz
GeForce GTX 1060 Mobile
min:
64 fps
70.9 ~ 69 fps
100%
GeForce GTX 1060 Mobile:
51.9 52 54 54.2 [X] MSI GT62VR Intel Core i7-6820HK 2.7GHz
GeForce GTX 1060 Mobile
min:
49 fps
~ 53 fps
226%
GeForce GTX 1080 Ti:
120 [X] Intel Core i7-4790K 4GHz
GeForce GTX 1080 Ti
min:
110 fps, max:
123 fps
fps
100%
GeForce GTX 1060 Mobile:
33.4 [X] MSI GT62VR Intel Core i7-6820HK 2.7GHz
GeForce GTX 1060 Mobile
min:
30 fps
fps
100%
GeForce GTX 1060 Mobile:
17.1 [X] MSI GT62VR Intel Core i7-6820HK 2.7GHz
GeForce GTX 1060 Mobile
min:
15 fps
fps
260%
GeForce GTX 1080 Ti:
44.4 [X] Intel Core i7-4790K 4GHz
GeForce GTX 1080 Ti
min:
42 fps, max:
48 fps
fps
100%
GeForce GTX 1060 Mobile:
69 [X] MSI GT62VR Intel Core i7-6820HK 2.7GHz
GeForce GTX 1060 Mobile
min:
59 fps
fps
100%
GeForce GTX 1060 Mobile:
47 [X] MSI GT62VR Intel Core i7-6820HK 2.7GHz
GeForce GTX 1060 Mobile
min:
41 fps
fps
100%
GeForce GTX 1060 Mobile:
36.5 39.1 43 [X] MSI GT62VR Intel Core i7-6820HK 2.7GHz
GeForce GTX 1060 Mobile
min:
37 fps
43.4 ~ 41 fps
100%
GeForce GTX 1060 Mobile:
35.1 38.1 41.6 [X] MSI GT62VR Intel Core i7-6820HK 2.7GHz
GeForce GTX 1060 Mobile
min:
36 fps
41.8 ~ 39 fps
223%
GeForce GTX 1080 Ti:
87 [X] Intel Core i7-4790K 4GHz
GeForce GTX 1080 Ti
87 [X] Intel Core i7-4790K 4GHz
GeForce GTX 1080 Ti
min:
67 fps, max:
99 fps
~ 87 fps
100%
GeForce GTX 1060 Mobile:
16.1 [X] MSI GT62VR Intel Core i7-6820HK 2.7GHz
GeForce GTX 1060 Mobile
min:
14 fps
fps
252%
GeForce GTX 1080 Ti:
40.6 [X] Intel Core i7-4790K 4GHz
GeForce GTX 1080 Ti
min:
34 fps, max:
44 fps
fps
100%
GeForce GTX 1060 Mobile:
110 132 [X] MSI GT62VR Intel Core i7-6820HK 2.7GHz
GeForce GTX 1060 Mobile
min:
69 fps
~ 121 fps
80%
GeForce GTX 1050 Max-Q:
97 fps
138%
GeForce GTX 1080 Ti:
167 [X] Intel Core i7-4790K 4GHz
GeForce GTX 1080 Ti
min:
72 fps, max:
207 fps
fps
100%
GeForce GTX 1060 Mobile:
79 97 [X] MSI GT62VR Intel Core i7-6820HK 2.7GHz
GeForce GTX 1060 Mobile
min:
37 fps
~ 88 fps
50%
GeForce GTX 1050 Max-Q:
44 fps
176%
GeForce GTX 1080 Ti:
155 [X] Intel Core i7-4790K 4GHz
GeForce GTX 1080 Ti
min:
73 fps, max:
196 fps
fps
100%
GeForce GTX 1060 Mobile:
58 68 70 74 [X] MSI GT62VR Intel Core i7-6820HK 2.7GHz
GeForce GTX 1060 Mobile
min:
21 fps
~ 68 fps
46%
GeForce GTX 1050 Max-Q:
31 fps
203%
GeForce GTX 1080 Ti:
138 [X] Intel Core i7-4790K 4GHz
GeForce GTX 1080 Ti
min:
64 fps, max:
194 fps
fps
100%
GeForce GTX 1060 Mobile:
52 52 52 53 54 [X] MSI GT62VR Intel Core i7-6820HK 2.7GHz
GeForce GTX 1060 Mobile
min:
14 fps
~ 53 fps
45%
GeForce GTX 1050 Max-Q:
24 fps
221%
GeForce GTX 1080 Ti:
117 [X] Intel Core i7-4790K 4GHz
GeForce GTX 1080 Ti
min:
52 fps, max:
182 fps
fps
100%
GeForce GTX 1060 Mobile:
19 [X] MSI GT62VR Intel Core i7-6820HK 2.7GHz
GeForce GTX 1060 Mobile
min:
12 fps
fps
53%
GeForce GTX 1050 Max-Q:
10 fps
268%
GeForce GTX 1080 Ti:
51 [X] Intel Core i7-4790K 4GHz
GeForce GTX 1080 Ti
min:
22 fps, max:
171 fps
fps
100%
GeForce GTX 1060 Mobile:
288 [X] MSI GT62VR Intel Core i7-6820HK 2.7GHz
GeForce GTX 1060 Mobile
min:
255 fps
fps
88%
GeForce GTX 1050 Max-Q:
254.7 fps
100%
GeForce GTX 1060 Mobile:
272 [X] MSI GT62VR Intel Core i7-6820HK 2.7GHz
GeForce GTX 1060 Mobile
min:
247 fps
fps
56%
GeForce GTX 1050 Max-Q:
153.2 fps
100%
GeForce GTX 1060 Mobile:
167 217 248 [X] MSI GT62VR Intel Core i7-6820HK 2.7GHz
GeForce GTX 1060 Mobile
min:
221 fps
250 ~ 221 fps
58%
GeForce GTX 1050 Max-Q:
127.5 fps
100%
GeForce GTX 1060 Mobile:
163 164 213 219 [X] MSI GT62VR Intel Core i7-6820HK 2.7GHz
GeForce GTX 1060 Mobile
min:
187 fps
247 ~ 201 fps
63%
GeForce GTX 1050 Max-Q:
127 fps
100%
GeForce GTX 1060 Mobile:
104 [X] MSI GT62VR Intel Core i7-6820HK 2.7GHz
GeForce GTX 1060 Mobile
min:
80 fps
fps
53%
GeForce GTX 1050 Max-Q:
55.5 fps
100%
GeForce GTX 1060 Mobile:
86.6 [X] MSI GT62VR Intel Core i7-6820HK 2.7GHz
GeForce GTX 1060 Mobile
min:
60 fps
fps
100%
GeForce GTX 1060 Mobile:
48.6 [X] MSI GT62VR Intel Core i7-6820HK 2.7GHz
GeForce GTX 1060 Mobile
min:
46 fps
fps
100%
GeForce GTX 1060 Mobile:
35.4 37 [X] MSI GT62VR Intel Core i7-6820HK 2.7GHz
GeForce GTX 1060 Mobile
min:
35 fps
~ 36 fps
100%
GeForce GTX 1060 Mobile:
24 25 [X] MSI GT62VR Intel Core i7-6820HK 2.7GHz
GeForce GTX 1060 Mobile
min:
23 fps
30 ~ 26 fps
225%
GeForce GTX 1080 Ti:
58.5 [X] Intel Core i7-4790K 4GHz
GeForce GTX 1080 Ti
min:
54 fps, max:
64 fps
fps
100%
GeForce GTX 1060 Mobile:
9.1 [X] MSI GT62VR Intel Core i7-6820HK 2.7GHz
GeForce GTX 1060 Mobile
min:
8 fps
fps
247%
GeForce GTX 1080 Ti:
22.5 [X] Intel Core i7-4790K 4GHz
GeForce GTX 1080 Ti
min:
21 fps, max:
24 fps
fps
100%
GeForce GTX 1060 Mobile:
178 [X] MSI GT62VR Intel Core i7-6820HK 2.7GHz
GeForce GTX 1060 Mobile
min:
141 fps
fps
100%
GeForce GTX 1060 Mobile:
125 [X] MSI GT62VR Intel Core i7-6820HK 2.7GHz
GeForce GTX 1060 Mobile
min:
110 fps
fps
100%
GeForce GTX 1060 Mobile:
81 99 103 [X] MSI GT62VR Intel Core i7-6820HK 2.7GHz
GeForce GTX 1060 Mobile
min:
88 fps
~ 94 fps
100%
GeForce GTX 1060 Mobile:
60 61 66 [X] MSI GT62VR Intel Core i7-6820HK 2.7GHz
GeForce GTX 1060 Mobile
min:
57 fps
76 ~ 66 fps
100%
GeForce GTX 1060 Mobile:
30 [X] MSI GT62VR Intel Core i7-6820HK 2.7GHz
GeForce GTX 1060 Mobile
min:
26 fps
fps
100%
GeForce GTX 1060 Mobile:
98.6 [X] MSI GT62VR Intel Core i7-6820HK 2.7GHz
GeForce GTX 1060 Mobile
min:
60 fps
fps
129%
GeForce GTX 1080 Ti:
127 [X] Intel Core i7-4790K 4GHz
GeForce GTX 1080 Ti
min:
80 fps, max:
145 fps
fps
100%
GeForce GTX 1060 Mobile:
78 [X] MSI GT62VR Intel Core i7-6820HK 2.7GHz
GeForce GTX 1060 Mobile
min:
35 fps
fps
160%
GeForce GTX 1080 Ti:
125 [X] Intel Core i7-4790K 4GHz
GeForce GTX 1080 Ti
min:
80 fps, max:
144 fps
fps
100%
GeForce GTX 1060 Mobile:
61 64.1 69 69.4 [X] MSI GT62VR Intel Core i7-6820HK 2.7GHz
GeForce GTX 1060 Mobile
min:
51 fps
~ 66 fps
78%
GeForce GTX 1050 Max-Q:
51.4 fps
174%
GeForce GTX 1080 Ti:
115 [X] Intel Core i7-4790K 4GHz
GeForce GTX 1080 Ti
min:
52 fps, max:
142 fps
fps
100%
GeForce GTX 1060 Mobile:
47.7 51.8 [X] MSI GT62VR Intel Core i7-6820HK 2.7GHz
GeForce GTX 1060 Mobile
min:
34 fps
53 ~ 51 fps
66%
GeForce GTX 1050 Max-Q:
33.6 fps
200%
GeForce GTX 1080 Ti:
93 [X] AMD Ryzen 7 1800X 3.6GHz
GeForce GTX 1080 Ti
min:
60 fps, max:
115 fps
110 [X] Intel Core i7-4790K 4GHz
GeForce GTX 1080 Ti
min:
78 fps, max:
137 fps
~ 102 fps
100%
GeForce GTX 1060 Mobile:
17.4 [X] MSI GT62VR Intel Core i7-6820HK 2.7GHz
GeForce GTX 1060 Mobile
min:
12 fps
fps
65%
GeForce GTX 1050 Max-Q:
11.3 fps
259%
GeForce GTX 1080 Ti:
44.8 [X] AMD Ryzen 7 1800X 3.6GHz
GeForce GTX 1080 Ti
min:
36 fps, max:
51 fps
46 [X] Intel Core i7-4790K 4GHz
GeForce GTX 1080 Ti
min:
36 fps, max:
51 fps
~ 45 fps
100%
GeForce GTX 1060 Mobile:
127.2 fps
107%
GeForce GTX 1050 Max-Q:
136 fps
117%
GeForce GTX 1080 Ti:
149 [X] Nvidia GeForce GTX 1080 Ti FE Asus Prime B350-PLUS AMD Ryzen 7 1800X 3.6GHz
GeForce GTX 1080 Ti
min:
129 fps
fps
100%
GeForce GTX 1060 Mobile:
120.2 fps
106%
GeForce GTX 1050 Max-Q:
128 fps
116%
GeForce GTX 1080 Ti:
140 [X] Nvidia GeForce GTX 1080 Ti FE Asus Prime B350-PLUS AMD Ryzen 7 1800X 3.6GHz
GeForce GTX 1080 Ti
min:
122 fps
fps
100%
GeForce GTX 1060 Mobile:
109.6 fps
109%
GeForce GTX 1050 Max-Q:
120 fps
124%
GeForce GTX 1080 Ti:
136 [X] Nvidia GeForce GTX 1080 Ti FE Asus Prime B350-PLUS AMD Ryzen 7 1800X 3.6GHz
GeForce GTX 1080 Ti
min:
119 fps
fps
100%
GeForce GTX 1060 Mobile:
108.1 fps
109%
GeForce GTX 1050 Max-Q:
118 fps
142%
GeForce GTX 1080 Ti:
136 [X] Nvidia GeForce GTX 1080 Ti FE Asus Prime B350-PLUS AMD Ryzen 7 1800X 3.6GHz
GeForce GTX 1080 Ti
min:
117 fps
171 [X] Intel Core i7-4790K 4GHz
GeForce GTX 1080 Ti
min:
146 fps
~ 154 fps
GeForce GTX 1050 Max-Q:
55 fps
GeForce GTX 1080 Ti:
134 [X] Nvidia GeForce GTX 1080 Ti FE Asus Prime B350-PLUS AMD Ryzen 7 1800X 3.6GHz
GeForce GTX 1080 Ti
min:
122 fps
166 [X] Intel Core i7-4790K 4GHz
GeForce GTX 1080 Ti
min:
137 fps
~ 150 fps
100%
GeForce GTX 1060 Mobile:
214.4 248 [X] MSI GT62VR Intel Core i7-6820HK 2.7GHz
GeForce GTX 1060 Mobile
min:
234 fps
~ 231 fps
83%
GeForce GTX 1050 Max-Q:
191.1 fps
100%
GeForce GTX 1060 Mobile:
152 [X] MSI GT62VR Intel Core i7-6820HK 2.7GHz
GeForce GTX 1060 Mobile
min:
137 fps
162.3 ~ 157 fps
56%
GeForce GTX 1050 Max-Q:
88 fps
100%
GeForce GTX 1060 Mobile:
90.1 90.2 96.3 98 98.5 105 [X] MSI GT62VR Intel Core i7-6820HK 2.7GHz
GeForce GTX 1060 Mobile
min:
85 fps
~ 96 fps
49%
GeForce GTX 1050 Max-Q:
47.1 fps
184%
GeForce GTX 1080 Ti:
177 [X] Intel Core i7-4790K 4GHz
GeForce GTX 1080 Ti
min:
79 fps, max:
211 fps
fps
100%
GeForce GTX 1060 Mobile:
51.8 54.2 55 55.3 58 59.2 [X] MSI GT62VR Intel Core i7-6820HK 2.7GHz
GeForce GTX 1060 Mobile
min:
51 fps
67 ~ 57 fps
46%
GeForce GTX 1050 Max-Q:
26.2 fps
191%
GeForce GTX 1080 Ti:
109 [X] Intel Core i7-4790K 4GHz
GeForce GTX 1080 Ti
min:
60 fps, max:
135 fps
fps
100%
GeForce GTX 1060 Mobile:
31 31.5 31.6 [X] MSI GT62VR Intel Core i7-6820HK 2.7GHz
GeForce GTX 1060 Mobile
min:
28 fps
~ 31 fps
50%
GeForce GTX 1050 Max-Q:
15.4 fps
248%
GeForce GTX 1080 Ti:
77 [X] Intel Core i7-4790K 4GHz
GeForce GTX 1080 Ti
fps
100%
GeForce GTX 1060 Mobile:
247.1 250 [X] MSI GT62VR Intel Core i7-6820HK 2.7GHz
GeForce GTX 1060 Mobile
min:
239 fps
~ 249 fps
97%
GeForce GTX 1050 Max-Q:
240.3 fps
100%
GeForce GTX 1080 Ti:
250 [X] Intel Core i7-4790K 4GHz
GeForce GTX 1080 Ti
min:
244 fps, max:
252 fps
fps
100%
GeForce GTX 1060 Mobile:
233.5 238 245 [X] MSI GT62VR Intel Core i7-6820HK 2.7GHz
GeForce GTX 1060 Mobile
min:
214 fps
~ 239 fps
65%
GeForce GTX 1050 Max-Q:
155.4 fps
102%
GeForce GTX 1080 Ti:
244 [X] Intel Core i7-4790K 4GHz
GeForce GTX 1080 Ti
min:
185 fps, max:
252 fps
fps
100%
GeForce GTX 1060 Mobile:
136 145 168 169.4 171 175 [X] MSI GT62VR Intel Core i7-6820HK 2.7GHz
GeForce GTX 1060 Mobile
min:
139 fps
181 ~ 164 fps
60%
GeForce GTX 1050 Max-Q:
98.8 fps
130%
GeForce GTX 1080 Ti:
214 [X] Intel Core i7-4790K 4GHz
GeForce GTX 1080 Ti
min:
144 fps, max:
252 fps
fps
100%
GeForce GTX 1060 Mobile:
63.4 64 65.9 [X] MSI GT62VR Intel Core i7-6820HK 2.7GHz
GeForce GTX 1060 Mobile
min:
56 fps
~ 64 fps
57%
GeForce GTX 1050 Max-Q:
36.7 fps
206%
GeForce GTX 1080 Ti:
132 [X] Intel Core i7-4790K 4GHz
GeForce GTX 1080 Ti
min:
98 fps, max:
188 fps
fps
100%
GeForce GTX 1060 Mobile:
141.8 142 [X] MSI GT62VR Intel Core i7-6820HK 2.7GHz
GeForce GTX 1060 Mobile
min:
134 fps
~ 142 fps
101%
GeForce GTX 1080 Ti:
144 [X] Intel Core i7-4790K 4GHz
GeForce GTX 1080 Ti
min:
139 fps, max:
146 fps
fps
100%
GeForce GTX 1060 Mobile:
135 [X] MSI GT62VR Intel Core i7-6820HK 2.7GHz
GeForce GTX 1060 Mobile
min:
104 fps
136.7 ~ 136 fps
105%
GeForce GTX 1080 Ti:
143 [X] Intel Core i7-4790K 4GHz
GeForce GTX 1080 Ti
min:
137 fps, max:
145 fps
fps
100%
GeForce GTX 1060 Mobile:
115 117.3 120 [X] MSI GT62VR Intel Core i7-6820HK 2.7GHz
GeForce GTX 1060 Mobile
min:
95 fps
~ 117 fps
121%
GeForce GTX 1080 Ti:
142 [X] Intel Core i7-4790K 4GHz
GeForce GTX 1080 Ti
min:
134 fps, max:
146 fps
fps
136%
GeForce GTX 1080 Ti:
139 [X] Intel Core i7-4790K 4GHz
GeForce GTX 1080 Ti
min:
129 fps, max:
145 fps
fps
100%
GeForce GTX 1060 Mobile:
35.1 38 [X] MSI GT62VR Intel Core i7-6820HK 2.7GHz
GeForce GTX 1060 Mobile
min:
32 fps
~ 37 fps
257%
GeForce GTX 1080 Ti:
95 [X] Intel Core i7-4790K 4GHz
GeForce GTX 1080 Ti
min:
68 fps, max:
115 fps
fps
100%
GeForce GTX 1060 Mobile:
131 [X] MSI GT62VR Intel Core i7-6820HK 2.7GHz
GeForce GTX 1060 Mobile
min:
105 fps
fps
147%
GeForce GTX 1080 Ti:
192 [X] Intel Core i7-4790K 4GHz
GeForce GTX 1080 Ti
min:
139 fps, max:
322 fps
fps
100%
GeForce GTX 1060 Mobile:
64 [X] MSI GT62VR Intel Core i7-6820HK 2.7GHz
GeForce GTX 1060 Mobile
min:
54 fps
fps
188%
GeForce GTX 1080 Ti:
120 [X] Intel Core i7-4790K 4GHz
GeForce GTX 1080 Ti
min:
96 fps, max:
216 fps
fps
100%
GeForce GTX 1060 Mobile:
44.4 [X] MSI GT62VR Intel Core i7-6820HK 2.7GHz
GeForce GTX 1060 Mobile
min:
34 fps
73.3 ~ 59 fps
166%
GeForce GTX 1080 Ti:
98 [X] Intel Core i7-4790K 4GHz
GeForce GTX 1080 Ti
min:
76 fps, max:
164 fps
fps
100%
GeForce GTX 1060 Mobile:
39 [X] MSI GT62VR Intel Core i7-6820HK 2.7GHz
GeForce GTX 1060 Mobile
min:
31 fps
68.3 ~ 54 fps
165%
GeForce GTX 1080 Ti:
89 [X] Intel Core i7-4790K 4GHz
GeForce GTX 1080 Ti
min:
72 fps, max:
139 fps
fps
100%
GeForce GTX 1060 Mobile:
12.3 [X] MSI GT62VR Intel Core i7-6820HK 2.7GHz
GeForce GTX 1060 Mobile
min:
9 fps
fps
275%
GeForce GTX 1080 Ti:
33.8 [X] Intel Core i7-4790K 4GHz
GeForce GTX 1080 Ti
min:
26 fps, max:
48 fps
fps
100%
GeForce GTX 1060 Mobile:
120 [X] MSI GT62VR Intel Core i7-6820HK 2.7GHz
GeForce GTX 1060 Mobile
min:
94 fps
122 131.4 ~ 124 fps
115%
GeForce GTX 1080 Ti:
140 [X] AMD Ryzen 7 1800X 3.6GHz
GeForce GTX 1080 Ti
min:
112 fps, max:
182 fps
144 [X] Intel Core i7-4790K 4GHz
GeForce GTX 1080 Ti
min:
111 fps, max:
194 fps
~ 142 fps
100%
GeForce GTX 1060 Mobile:
84 [X] MSI GT62VR Intel Core i7-6820HK 2.7GHz
GeForce GTX 1060 Mobile
min:
75 fps
85.7 ~ 85 fps
147%
GeForce GTX 1080 Ti:
124 [X] AMD Ryzen 7 1800X 3.6GHz
GeForce GTX 1080 Ti
min:
99 fps, max:
171 fps
125 [X] Intel Core i7-4790K 4GHz
GeForce GTX 1080 Ti
min:
95 fps, max:
174 fps
~ 125 fps
100%
GeForce GTX 1060 Mobile:
50 51.4 52.4 55.8 [X] MSI GT62VR Intel Core i7-6820HK 2.7GHz
GeForce GTX 1060 Mobile
min:
50 fps
59.3 ~ 54 fps
187%
GeForce GTX 1080 Ti:
100 [X] AMD Ryzen 7 1800X 3.6GHz
GeForce GTX 1080 Ti
min:
78 fps, max:
131 fps
102 [X] Intel Core i7-4790K 4GHz
GeForce GTX 1080 Ti
min:
86 fps, max:
137 fps
~ 101 fps
100%
GeForce GTX 1060 Mobile:
43 46.4 47.4 50.3 [X] MSI GT62VR Intel Core i7-6820HK 2.7GHz
GeForce GTX 1060 Mobile
min:
44 fps
53.8 ~ 48 fps
198%
GeForce GTX 1080 Ti:
94 [X] AMD Ryzen 7 1800X 3.6GHz
GeForce GTX 1080 Ti
min:
82 fps, max:
124 fps
95 [X] Intel Core i7-4790K 4GHz
GeForce GTX 1080 Ti
min:
80 fps, max:
127 fps
~ 95 fps
100%
GeForce GTX 1060 Mobile:
21.4 [X] MSI GT62VR Intel Core i7-6820HK 2.7GHz
GeForce GTX 1060 Mobile
min:
19 fps
21.5 ~ 21 fps
257%
GeForce GTX 1080 Ti:
53.4 [X] Intel Core i7-4790K 4GHz
GeForce GTX 1080 Ti
min:
48 fps, max:
67 fps
54.6 [X] AMD Ryzen 7 1800X 3.6GHz
GeForce GTX 1080 Ti
min:
48 fps, max:
67 fps
~ 54 fps
100%
GeForce GTX 1060 Mobile:
113 [X] MSI GT62VR Intel Core i7-6820HK 2.7GHz
GeForce GTX 1060 Mobile
min:
102 fps
140 145.1 ~ 133 fps
61%
GeForce GTX 1050 Max-Q:
80.6 fps
153%
GeForce GTX 1080 Ti:
203 [X] Intel Core i7-4790K 4GHz
GeForce GTX 1080 Ti
min:
175 fps, max:
232 fps
fps
100%
GeForce GTX 1060 Mobile:
66.2 70.4 71.9 [X] MSI GT62VR Intel Core i7-6820HK 2.7GHz
GeForce GTX 1060 Mobile
min:
56 fps
73.6 ~ 71 fps
50%
GeForce GTX 1050 Max-Q:
35.7 fps
187%
GeForce GTX 1080 Ti:
133 [X] Intel Core i7-4790K 4GHz
GeForce GTX 1080 Ti
min:
121 fps, max:
150 fps
fps
100%
GeForce GTX 1060 Mobile:
60.1 62.9 63.8 67 [X] MSI GT62VR Intel Core i7-6820HK 2.7GHz
GeForce GTX 1060 Mobile
min:
55 fps
67.2 67.8 ~ 65 fps
50%
GeForce GTX 1050 Max-Q:
32.5 fps
192%
GeForce GTX 1080 Ti:
125 [X] Intel Core i7-4790K 4GHz
GeForce GTX 1080 Ti
min:
113 fps, max:
139 fps
fps
100%
GeForce GTX 1060 Mobile:
34.5 35.7 36.2 38.1 [X] MSI GT62VR Intel Core i7-6820HK 2.7GHz
GeForce GTX 1060 Mobile
min:
32 fps
38.4 38.7 ~ 37 fps
46%
GeForce GTX 1050 Max-Q:
17.1 fps
190%
GeForce GTX 1080 Ti:
70.3 [X] Intel Core i7-4790K 4GHz
GeForce GTX 1080 Ti
min:
62 fps, max:
78 fps
fps
100%
GeForce GTX 1060 Mobile:
21.5 22.3 [X] MSI GT62VR Intel Core i7-6820HK 2.7GHz
GeForce GTX 1060 Mobile
min:
16 fps
25.3 ~ 23 fps
46%
GeForce GTX 1050 Max-Q:
10.5 fps
227%
GeForce GTX 1080 Ti:
52.2 [X] Intel Core i7-4790K 4GHz
GeForce GTX 1080 Ti
min:
41 fps, max:
58 fps
fps
100%
GeForce GTX 1060 Mobile:
145 212 [X] MSI GT62VR Intel Core i7-6820HK 2.7GHz
GeForce GTX 1060 Mobile
min:
145 fps
220.3 226 ~ 201 fps
117%
GeForce GTX 1080 Ti:
155 [X] Intel Core i9-7900X 3.3GHz
GeForce GTX 1080 Ti
min:
129 fps, max:
180 fps
161 [X] i7-6950X Asus X99-E Intel Core i7-6950X 3GHz
GeForce GTX 1080 Ti
min:
125 fps, max:
187 fps
166 [X] Nvidia GeForce GTX 1080 Ti Founders Edition Asus Crosshair VI Hero AMD Ryzen 5 1400 3.2GHz
GeForce GTX 1080 Ti
min:
110 fps, max:
220 fps
173 [X] AMD Ryzen 3 1200 3.1GHz
GeForce GTX 1080 Ti
min:
126 fps, max:
242 fps
184 [X] AMD Ryzen 3 1300X 3.5GHz
GeForce GTX 1080 Ti
min:
129 fps, max:
262 fps
185 [X] AMD Ryzen 7 1700X 3.4GHz
GeForce GTX 1080 Ti
min:
149 fps, max:
230 fps
191 [X] AMD Ryzen 7 1800X 3.6GHz
GeForce GTX 1080 Ti
min:
134 fps, max:
240 fps
198 [X] AMD Ryzen 7 1700 3GHz
GeForce GTX 1080 Ti
min:
162 fps, max:
240 fps
208 [X] Nvidia GeForce GTX 1080 Ti FE Asus Prime B350-PLUS AMD Ryzen 7 1700 3GHz
GeForce GTX 1080 Ti
min:
159 fps, max:
273 fps
224 [X] i7-5960X Asus X99-E Intel Core i7-5960X 3GHz
GeForce GTX 1080 Ti
min:
168 fps, max:
283 fps
230 [X] Nvidia GeForce GTX 1080 Ti FE Asus Prime B350-PLUS AMD Ryzen 7 1800X 3.6GHz
GeForce GTX 1080 Ti
min:
187 fps, max:
300 fps
233 [X] AMD Ryzen 5 1400 3.2GHz
GeForce GTX 1080 Ti
min:
145 fps, max:
317 fps
250 [X] AMD Ryzen 5 1600 3.2GHz
GeForce GTX 1080 Ti
min:
187 fps, max:
317 fps
252 [X] no SMT
AMD Ryzen 7 1800X 3.6GHz
GeForce GTX 1080 Ti
min:
180 fps, max:
350 fps
263 [X] i5-7600K Gigabyte Z270-Gaming K3 Intel Core i5-7600K 3.8GHz
GeForce GTX 1080 Ti
min:
17 fps, max:
383 fps
271 [X] 1500X Nvidia GeForce GTX 1080 Ti FE Asus Prime B350-PLUS AMD Ryzen 5 1500X 3.5GHz
GeForce GTX 1080 Ti
min:
193 fps, max:
400 fps
286 [X] Intel Core i5-8400 2.8GHz
GeForce GTX 1080 Ti
min:
141 fps, max:
414 fps
318 [X] Intel Core i7-4790K 4GHz
GeForce GTX 1080 Ti
min:
198 fps, max:
467 fps
328 [X] Intel Core i7-8700K 3.7GHz
GeForce GTX 1080 Ti
min:
184 fps, max:
429 fps
333 [X] i7-7700K Gigabyte Z270-Gaming K3 Intel Core i7-7700K 4.2GHz
GeForce GTX 1080 Ti
min:
184 fps, max:
467 fps
347 [X] Intel Core i7-7740X 4.3GHz
GeForce GTX 1080 Ti
min:
240 fps, max:
500 fps
~ 236 fps
100%
GeForce GTX 1060 Mobile:
103.5 105 [X] MSI GT62VR Intel Core i7-6820HK 2.7GHz
GeForce GTX 1060 Mobile
min:
67 fps
107.1 108.3 ~ 106 fps
50%
GeForce GTX 1050 Max-Q:
52.7 53.5 ~ 53 fps
199%
GeForce GTX 1080 Ti:
161 [X] i7-6950X Asus X99-E Intel Core i7-6950X 3GHz
GeForce GTX 1080 Ti
min:
47 fps, max:
187 fps
184 [X] AMD Ryzen 7 1700X 3.4GHz
GeForce GTX 1080 Ti
min:
154 fps, max:
230 fps
195 [X] AMD Ryzen 7 1700 3GHz
GeForce GTX 1080 Ti
min:
154 fps, max:
240 fps
217 [X] AMD Ryzen 7 1800X 3.6GHz
GeForce GTX 1080 Ti
min:
167 fps, max:
300 fps
231 [X] i5-7600K Gigabyte Z270-Gaming K3 Intel Core i5-7600K 3.8GHz
GeForce GTX 1080 Ti
min:
36 fps, max:
323 fps
239 [X] Intel Core i7-4790K 4GHz
GeForce GTX 1080 Ti
min:
143 fps, max:
317 fps
251 [X] i7-7700K Gigabyte Z270-Gaming K3 Intel Core i7-7700K 4.2GHz
GeForce GTX 1080 Ti
min:
31 fps, max:
340 fps
~ 211 fps
100%
GeForce GTX 1060 Mobile:
56.3 (!) [X] Gigabyte Aero 14 Intel Core i7-7700HQ 2.8GHz
GeForce GTX 1060 Mobile
min:
45.9 fps
94 95.6 98.2 99.8 [X] MSI GT62VR Intel Core i7-6820HK 2.7GHz
GeForce GTX 1060 Mobile
min:
61 fps
101.1 103.2 ~ 93 fps
54%
GeForce GTX 1050 Max-Q:
49.8 49.8 ~ 50 fps
230%
GeForce GTX 1080 Ti:
184 [X] AMD Ryzen 7 1700X 3.4GHz
GeForce GTX 1080 Ti
min:
147 fps, max:
230 fps
194 [X] AMD Ryzen 7 1700 3GHz
GeForce GTX 1080 Ti
min:
149 fps, max:
240 fps
211 [X] AMD Ryzen 7 1800X 3.6GHz
GeForce GTX 1080 Ti
min:
159 fps, max:
290 fps
223 [X] i5-7600K Gigabyte Z270-Gaming K3 Intel Core i5-7600K 3.8GHz
GeForce GTX 1080 Ti
min:
121 fps, max:
307 fps
229 [X] Intel Core i7-4790K 4GHz
GeForce GTX 1080 Ti
min:
182 fps, max:
317 fps
240 [X] i7-7700K Gigabyte Z270-Gaming K3 Intel Core i7-7700K 4.2GHz
GeForce GTX 1080 Ti
min:
126 fps, max:
307 fps
~ 214 fps
100%
GeForce GTX 1060 Mobile:
42.4 (!) [X] Gigabyte Aero 14 Intel Core i7-7700HQ 2.8GHz
GeForce GTX 1060 Mobile
min:
27.1 fps
70.1 70.5 71 71.3 72.3 72.4 [X] MSI GT62VR Intel Core i7-6820HK 2.7GHz
GeForce GTX 1060 Mobile
min:
41 fps
78.9 ~ 69 fps
55%
GeForce GTX 1050 Max-Q:
38.1 38.2 ~ 38 fps
254%
GeForce GTX 1080 Ti:
172 [X] AMD Ryzen 7 1700X 3.4GHz
GeForce GTX 1080 Ti
min:
136 fps, max:
213 fps
173 [X] Intel Core i7-4790K 4GHz
GeForce GTX 1080 Ti
min:
115 fps, max:
240 fps
174 [X] AMD Ryzen 7 1800X 3.6GHz
GeForce GTX 1080 Ti
min:
132 fps, max:
240 fps
174 [X] AMD Ryzen 7 1700 3GHz
GeForce GTX 1080 Ti
min:
136 fps, max:
220 fps
178 [X] i5-7600K Gigabyte Z270-Gaming K3 Intel Core i5-7600K 3.8GHz
GeForce GTX 1080 Ti
min:
129 fps, max:
257 fps
179 [X] i7-7700K Gigabyte Z270-Gaming K3 Intel Core i7-7700K 4.2GHz
GeForce GTX 1080 Ti
min:
139 fps, max:
250 fps
~ 175 fps
100%
GeForce GTX 1060 Mobile:
29 30 [X] MSI GT62VR Intel Core i7-6820HK 2.7GHz
GeForce GTX 1060 Mobile
min:
23 fps
30.2 ~ 30 fps
50%
GeForce GTX 1050 Max-Q:
14.7 15 ~ 15 fps
260%
GeForce GTX 1080 Ti:
76 [X] i7-5960X Asus X99-E Intel Core i7-5960X 3GHz
GeForce GTX 1080 Ti
min:
30 fps, max:
107 fps
77 [X] Intel Core i7-4790K 4GHz
GeForce GTX 1080 Ti
min:
58 fps, max:
131 fps
77 [X] Nvidia GeForce GTX 1080 Ti Founders Edition Asus Crosshair VI Hero AMD Ryzen 5 1400 3.2GHz
GeForce GTX 1080 Ti
min:
63 fps, max:
91 fps
77 [X] Nvidia GeForce GTX 1080 Ti FE Asus Prime B350-PLUS AMD Ryzen 7 1800X 3.6GHz
GeForce GTX 1080 Ti
min:
62 fps, max:
91 fps
77.1 [X] AMD Ryzen 5 1600 3.2GHz
GeForce GTX 1080 Ti
min:
62 fps, max:
89 fps
77.3 [X] Intel Core i7-8700K 3.7GHz
GeForce GTX 1080 Ti
min:
63 fps, max:
97 fps
77.4 [X] AMD Ryzen 3 1300X 3.5GHz
GeForce GTX 1080 Ti
min:
56 fps, max:
90 fps
77.6 [X] AMD Ryzen 5 1400 3.2GHz
GeForce GTX 1080 Ti
min:
63 fps, max:
91 fps
77.6 [X] Intel Core i5-8400 2.8GHz
GeForce GTX 1080 Ti
min:
60 fps, max:
100 fps
77.7 [X] AMD Ryzen 7 1700 3GHz
GeForce GTX 1080 Ti
min:
63 fps, max:
91 fps
77.7 [X] AMD Ryzen 3 1200 3.1GHz
GeForce GTX 1080 Ti
min:
63 fps, max:
90 fps
77.8 [X] 1500X Nvidia GeForce GTX 1080 Ti FE Asus Prime B350-PLUS AMD Ryzen 5 1500X 3.5GHz
GeForce GTX 1080 Ti
min:
63 fps, max:
89 fps
77.9 [X] i5-7600K Gigabyte Z270-Gaming K3 Intel Core i5-7600K 3.8GHz
GeForce GTX 1080 Ti
min:
23 fps, max:
105 fps
78 [X] i7-6950X Asus X99-E Intel Core i7-6950X 3GHz
GeForce GTX 1080 Ti
min:
50 fps, max:
93 fps
78 [X] Nvidia GeForce GTX 1080 Ti FE Asus Prime B350-PLUS AMD Ryzen 7 1700 3GHz
GeForce GTX 1080 Ti
min:
63 fps, max:
91 fps
78 [X] Intel Core i9-7900X 3.3GHz
GeForce GTX 1080 Ti
min:
62 fps, max:
105 fps
78.1 [X] AMD Ryzen 7 1800X 3.6GHz
GeForce GTX 1080 Ti
min:
63 fps, max:
91 fps
78.2 [X] AMD Ryzen 7 1700X 3.4GHz
GeForce GTX 1080 Ti
min:
63 fps, max:
91 fps
79 [X] i7-7700K Gigabyte Z270-Gaming K3 Intel Core i7-7700K 4.2GHz
GeForce GTX 1080 Ti
min:
46 fps, max:
117 fps
79 [X] Intel Core i7-7740X 4.3GHz
GeForce GTX 1080 Ti
min:
63 fps, max:
135 fps
~ 78 fps
100%
GeForce GTX 1060 Mobile:
305 [X] MSI GT62VR Intel Core i7-6820HK 2.7GHz
GeForce GTX 1060 Mobile
min:
270 fps
fps
100%
GeForce GTX 1060 Mobile:
158 [X] MSI GT62VR Intel Core i7-6820HK 2.7GHz
GeForce GTX 1060 Mobile
min:
135 fps
fps
100%
GeForce GTX 1060 Mobile:
98.5 98.9 101 104 105 [X] MSI GT62VR Intel Core i7-6820HK 2.7GHz
GeForce GTX 1060 Mobile
min:
87 fps
~ 101 fps
100%
GeForce GTX 1060 Mobile:
81.5 82 83 83 85.8 [X] MSI GT62VR Intel Core i7-6820HK 2.7GHz
GeForce GTX 1060 Mobile
min:
73 fps
~ 83 fps
267%
GeForce GTX 1080 Ti:
222 [X] Intel Core i7-4790K 4GHz
GeForce GTX 1080 Ti
min:
190 fps, max:
257 fps
fps
100%
GeForce GTX 1060 Mobile:
28.4 [X] MSI GT62VR Intel Core i7-6820HK 2.7GHz
GeForce GTX 1060 Mobile
min:
24 fps
fps
268%
GeForce GTX 1080 Ti:
76 [X] Intel Core i7-4790K 4GHz
GeForce GTX 1080 Ti
min:
62 fps, max:
87 fps
fps
100%
GeForce GTX 1060 Mobile:
104 [X] MSI GT62VR Intel Core i7-6820HK 2.7GHz
GeForce GTX 1060 Mobile
min:
70 fps
109.1 ~ 107 fps
100%
GeForce GTX 1060 Mobile:
94.2 [X] MSI GT62VR Intel Core i7-6820HK 2.7GHz
GeForce GTX 1060 Mobile
min:
64 fps
94.9 ~ 95 fps
100%
GeForce GTX 1060 Mobile:
58.1 60.9 65.4 66 [X] MSI GT62VR Intel Core i7-6820HK 2.7GHz
GeForce GTX 1060 Mobile
min:
56 fps
~ 63 fps
100%
GeForce GTX 1060 Mobile:
41.7 42.3 [X] MSI GT62VR Intel Core i7-6820HK 2.7GHz
GeForce GTX 1060 Mobile
min:
32 fps
42.8 44.1 ~ 43 fps
216%
GeForce GTX 1080 Ti:
93 [X] Intel Core i7-4790K 4GHz
GeForce GTX 1080 Ti
min:
71 fps, max:
107 fps
fps
100%
GeForce GTX 1060 Mobile:
22.4 [X] MSI GT62VR Intel Core i7-6820HK 2.7GHz
GeForce GTX 1060 Mobile
min:
19 fps
fps
250%
GeForce GTX 1080 Ti:
56.1 [X] Intel Core i7-4790K 4GHz
GeForce GTX 1080 Ti
min:
50 fps, max:
62 fps
fps
100%
GeForce GTX 1060 Mobile:
89.3 100 [X] MSI GT62VR Intel Core i7-6820HK 2.7GHz
GeForce GTX 1060 Mobile
min:
89 fps
~ 95 fps
100%
GeForce GTX 1060 Mobile:
52.1 80.2 82.7 93 [X] MSI GT62VR Intel Core i7-6820HK 2.7GHz
GeForce GTX 1060 Mobile
min:
76 fps
~ 77 fps
100%
GeForce GTX 1060 Mobile:
47 60.2 60.5 63.9 [X] MSI GT62VR Intel Core i7-6820HK 2.7GHz
GeForce GTX 1060 Mobile
min:
51 fps
69.4 ~ 60 fps
100%
GeForce GTX 1060 Mobile:
44.1 46.5 53.9 58.6 [X] MSI GT62VR Intel Core i7-6820HK 2.7GHz
GeForce GTX 1060 Mobile
min:
47 fps
58.7 ~ 52 fps
190%
GeForce GTX 1080 Ti:
99 [X] Intel Core i7-4790K 4GHz
GeForce GTX 1080 Ti
min:
70 fps, max:
118 fps
fps
100%
GeForce GTX 1060 Mobile:
31.2 [X] MSI GT62VR Intel Core i7-6820HK 2.7GHz
GeForce GTX 1060 Mobile
min:
26 fps
fps
231%
GeForce GTX 1080 Ti:
72 [X] Intel Core i7-4790K 4GHz
GeForce GTX 1080 Ti
min:
58 fps, max:
83 fps
fps
100%
GeForce GTX 1060 Mobile:
123.1 125 [X] MSI GT62VR Intel Core i7-6820HK 2.7GHz
GeForce GTX 1060 Mobile
min:
114 fps
~ 124 fps
100%
GeForce GTX 1060 Mobile:
123.3 124 [X] MSI GT62VR Intel Core i7-6820HK 2.7GHz
GeForce GTX 1060 Mobile
min:
106 fps
~ 124 fps
100%
GeForce GTX 1060 Mobile:
94.7 96.3 99.2 104 [X] MSI GT62VR Intel Core i7-6820HK 2.7GHz
GeForce GTX 1060 Mobile
min:
80 fps
~ 99 fps
126%
GeForce GTX 1080 Ti:
125 [X] Intel Core i7-4790K 4GHz
GeForce GTX 1080 Ti
min:
120 fps, max:
127 fps
fps
100%
GeForce GTX 1060 Mobile:
84.4 86.1 86.5 90.8 [X] MSI GT62VR Intel Core i7-6820HK 2.7GHz
GeForce GTX 1060 Mobile
min:
68 fps
~ 87 fps
100%
GeForce GTX 1060 Mobile:
42.1 [X] MSI GT62VR Intel Core i7-6820HK 2.7GHz
GeForce GTX 1060 Mobile
min:
30 fps
fps
235%
GeForce GTX 1080 Ti:
99 [X] Intel Core i7-4790K 4GHz
GeForce GTX 1080 Ti
min:
75 fps, max:
127 fps
fps
171%
GeForce GTX 1080 Ti:
144 [X] Intel Core i7-4790K 4GHz
GeForce GTX 1080 Ti
fps
100%
GeForce GTX 1060 Mobile:
50.8 fps
154%
GeForce GTX 1080 Ti:
78 [X] Intel Core i7-4790K 4GHz
GeForce GTX 1080 Ti
fps
100%
GeForce GTX 1060 Mobile:
209.3 fps
100%
GeForce GTX 1060 Mobile:
179.6 fps
189%
GeForce GTX 1080 Ti:
238 [X] Intel Core i7-4790K 4GHz
GeForce GTX 1080 Ti
min:
228 fps, max:
250 fps
fps
GeForce GTX 1080 Ti:
140 [X] Nvidia GeForce GTX 1080 Ti Founders Edition Asus Crosshair VI Hero AMD Ryzen 5 1400 3.2GHz
GeForce GTX 1080 Ti
min:
136 fps, max:
145 fps
160 [X] AMD Ryzen 7 1700 3GHz
GeForce GTX 1080 Ti
min:
149 fps, max:
171 fps
162 [X] AMD Ryzen 7 1700X 3.4GHz
GeForce GTX 1080 Ti
min:
155 fps, max:
171 fps
162 [X] AMD Ryzen 3 1200 3.1GHz
GeForce GTX 1080 Ti
min:
157 fps, max:
167 fps
170 [X] AMD Ryzen 7 1800X 3.6GHz
GeForce GTX 1080 Ti
min:
163 fps, max:
179 fps
170 [X] AMD Ryzen 5 1400 3.2GHz
GeForce GTX 1080 Ti
min:
164 fps, max:
177 fps
172 [X] no SMT
AMD Ryzen 7 1700 3GHz
GeForce GTX 1080 Ti
173 [X] AMD Ryzen 3 1300X 3.5GHz
GeForce GTX 1080 Ti
min:
155 fps, max:
180 fps
181 [X] Nvidia GeForce GTX 1080 Ti FE Asus Prime B350-PLUS AMD Ryzen 7 1700 3GHz
GeForce GTX 1080 Ti
min:
172 fps, max:
189 fps
188 [X] no SMT
AMD Ryzen 7 1800X 3.6GHz
GeForce GTX 1080 Ti
min:
182 fps, max:
199 fps
188 [X] AMD Ryzen 5 1600 3.2GHz
GeForce GTX 1080 Ti
min:
177 fps, max:
194 fps
191 [X] i7-5960X Asus X99-E Intel Core i7-5960X 3GHz
GeForce GTX 1080 Ti
min:
175 fps, max:
228 fps
191 [X] Nvidia GeForce GTX 1080 Ti FE Asus Prime B350-PLUS AMD Ryzen 7 1800X 3.6GHz
GeForce GTX 1080 Ti
min:
180 fps, max:
203 fps
192 [X] Intel Core i5-8400 2.8GHz
GeForce GTX 1080 Ti
min:
178 fps, max:
231 fps
194 [X] Intel Core i7-8700K 3.7GHz
GeForce GTX 1080 Ti
min:
179 fps, max:
234 fps
195 [X] 1500X Nvidia GeForce GTX 1080 Ti FE Asus Prime B350-PLUS AMD Ryzen 5 1500X 3.5GHz
GeForce GTX 1080 Ti
min:
188 fps, max:
203 fps
201 [X] Intel Core i9-7900X 3.3GHz
GeForce GTX 1080 Ti
min:
186 fps, max:
242 fps
204 [X] Intel Core i7-4790K 4GHz
GeForce GTX 1080 Ti
min:
190 fps, max:
250 fps
204 [X] i7-7700K Gigabyte Z270-Gaming K3 Intel Core i7-7700K 4.2GHz
GeForce GTX 1080 Ti
min:
188 fps, max:
248 fps
205 [X] i5-7600K Gigabyte Z270-Gaming K3 Intel Core i5-7600K 3.8GHz
GeForce GTX 1080 Ti
min:
191 fps, max:
241 fps
211 [X] i7-6950X Asus X99-E Intel Core i7-6950X 3GHz
GeForce GTX 1080 Ti
min:
195 fps, max:
258 fps
213 [X] Intel Core i7-7740X 4.3GHz
GeForce GTX 1080 Ti
min:
195 fps, max:
262 fps
~ 185 fps
108%
GeForce GTX 1050 Max-Q:
144.7 fps
149%
GeForce GTX 1080 Ti:
200 [X] DX11
Intel Core i7-4790K 4GHz
GeForce GTX 1080 Ti
min:
197 fps, max:
201 fps
fps
100%
GeForce GTX 1060 Mobile:
81.7 91.4 96.6 [X] Razer Blade (2016) EC 4.00 Intel Core i7-6700HQ 2.6GHz
GeForce GTX 1060 Mobile
104.9 117.5 142.5 ~ 106 fps
84%
GeForce GTX 1050 Max-Q:
89.2 fps
185%
GeForce GTX 1080 Ti:
196 [X] DX11
Intel Core i7-4790K 4GHz
GeForce GTX 1080 Ti
min:
184 fps, max:
201 fps
fps
58%
GeForce GTX 1050 Max-Q:
45 fps
219%
GeForce GTX 1080 Ti:
169 [X] DX11
Intel Core i7-4790K 4GHz
GeForce GTX 1080 Ti
min:
146 fps, max:
177 fps
fps
57%
GeForce GTX 1050 Max-Q:
41.3 fps
219%
GeForce GTX 1080 Ti:
158 [X] DX11
Intel Core i7-4790K 4GHz
GeForce GTX 1080 Ti
min:
141 fps, max:
166 fps
fps
100%
GeForce GTX 1060 Mobile:
29 32.8 ~ 31 fps
51%
GeForce GTX 1050 Max-Q:
15.9 fps
247%
GeForce GTX 1080 Ti:
76.7 [X] DX12
Intel Core i7-4790K 4GHz
GeForce GTX 1080 Ti
min:
69 fps, max:
80 fps
fps
100%
GeForce GTX 1060 Mobile:
58.1 70.3 [X] MSI GT62VR Intel Core i7-6820HK 2.7GHz
GeForce GTX 1060 Mobile
min:
58 fps
~ 64 fps
220%
GeForce GTX 1050 Max-Q:
141 fps
100%
GeForce GTX 1060 Mobile:
47.1 56.7 [X] MSI GT62VR Intel Core i7-6820HK 2.7GHz
GeForce GTX 1060 Mobile
min:
44 fps
~ 52 fps
159%
GeForce GTX 1050 Max-Q:
82.7 fps
100%
GeForce GTX 1060 Mobile:
43 50.7 [X] MSI GT62VR Intel Core i7-6820HK 2.7GHz
GeForce GTX 1060 Mobile
min:
38 fps
~ 47 fps
74%
GeForce GTX 1050 Max-Q:
35 fps
100%
GeForce GTX 1060 Mobile:
42.8 43 47.5 [X] MSI GT62VR Intel Core i7-6820HK 2.7GHz
GeForce GTX 1060 Mobile
min:
38 fps
65 71 ~ 54 fps
53%
GeForce GTX 1050 Max-Q:
28.6 fps
169%
GeForce GTX 1080 Ti:
88 [X] DX12
Intel Core i7-4790K 4GHz
GeForce GTX 1080 Ti
min:
67 fps, max:
155 fps
93 [X] DX11
Intel Core i7-4790K 4GHz
GeForce GTX 1080 Ti
min:
71 fps, max:
169 fps
~ 91 fps
100%
GeForce GTX 1060 Mobile:
37 50.6 [X] MSI GT62VR Intel Core i7-6820HK 2.7GHz
GeForce GTX 1060 Mobile
min:
41 fps
~ 44 fps
52%
GeForce GTX 1050 Max-Q:
23 fps
205%
GeForce GTX 1080 Ti:
88 [X] DX12
Intel Core i7-4790K 4GHz
GeForce GTX 1080 Ti
min:
68 fps, max:
153 fps
91 [X] DX11
Intel Core i7-4790K 4GHz
GeForce GTX 1080 Ti
min:
67 fps, max:
167 fps
~ 90 fps
100%
GeForce GTX 1060 Mobile:
51.3 fps
100%
GeForce GTX 1060 Mobile:
47.1 48 ~ 48 fps
100%
GeForce GTX 1060 Mobile:
40 40.1 40.1 41 [X] EVGA SC15 Intel Core i7-7700HQ 2.8GHz
GeForce GTX 1060 Mobile
42 42 42.2 [X] Gigabyte Aero 14 GA-K106Q416-PL-B02 Intel Core i7-7700HQ 2.8GHz
GeForce GTX 1060 Mobile
43.6 43.7 44.8 [X] Hyperbook N85-7300-8-12-1060 Intel Core i5-7300HQ 2.5GHz
GeForce GTX 1060 Mobile
45 46.7 47 47.2 [X] Smart7 Fobos GX15D G1 Intel Core i7-7700HQ 2.8GHz
GeForce GTX 1060 Mobile
47.7 [X] MSI GP72MVR 7RFX Leopard Pro Intel Core i7-7700HQ 2.8GHz
GeForce GTX 1060 Mobile
~ 44 fps
207%
GeForce GTX 1080 Ti:
91 [X] Intel Core i7-4790K 4GHz
GeForce GTX 1080 Ti
min:
73 fps, max:
112 fps
fps
100%
GeForce GTX 1060 Mobile:
13.1 fps
280%
GeForce GTX 1080 Ti:
36.7 [X] Intel Core i7-4790K 4GHz
GeForce GTX 1080 Ti
min:
34 fps, max:
40 fps
fps
100%
GeForce GTX 1060 Mobile:
50.7 fps
550%
GeForce GTX 1080 Ti:
279 [X] Intel Core i7-4790K 4GHz
GeForce GTX 1080 Ti
fps
66%
GeForce GTX 1050 Max-Q:
70.5 71.5 ~ 71 fps
121%
GeForce GTX 1080 Ti:
102 [X] DX12
AMD Ryzen 7 1700 3GHz
GeForce GTX 1080 Ti
min:
76 fps, max:
146 fps
105 [X] DX12
AMD Ryzen 7 1800X 3.6GHz
GeForce GTX 1080 Ti
min:
78 fps, max:
146 fps
121 [X] DX12 no SMT
AMD Ryzen 7 1700 3GHz
GeForce GTX 1080 Ti
min:
85 fps, max:
168 fps
124 [X] DX12 no SMT
AMD Ryzen 7 1800X 3.6GHz
GeForce GTX 1080 Ti
min:
92 fps, max:
173 fps
135 [X] i7-5960X Asus X99-E Intel Core i7-5960X 3GHz
GeForce GTX 1080 Ti
min:
101 fps, max:
194 fps
136 [X] i5-7600K Gigabyte Z270-Gaming K3 Intel Core i5-7600K 3.8GHz
GeForce GTX 1080 Ti
min:
97 fps, max:
186 fps
141 [X] i7-6950X Asus X99-E Intel Core i7-6950X 3GHz
GeForce GTX 1080 Ti
min:
103 fps, max:
201 fps
151 [X] Intel Core i7-4790K 4GHz
GeForce GTX 1080 Ti
min:
111 fps, max:
208 fps
157 [X] i7-7700K Gigabyte Z270-Gaming K3 Intel Core i7-7700K 4.2GHz
GeForce GTX 1080 Ti
min:
119 fps, max:
219 fps
~ 130 fps
58%
GeForce GTX 1050 Max-Q:
52.6 54.8 ~ 54 fps
130%
GeForce GTX 1080 Ti:
93 [X] DX12
AMD Ryzen 7 1700 3GHz
GeForce GTX 1080 Ti
min:
70 fps, max:
133 fps
108 [X] DX12 no SMT
AMD Ryzen 7 1700 3GHz
GeForce GTX 1080 Ti
min:
79 fps, max:
154 fps
114 [X] DX12 no SMT
AMD Ryzen 7 1800X 3.6GHz
GeForce GTX 1080 Ti
min:
84 fps, max:
159 fps
131 [X] i7-6950X Asus X99-E Intel Core i7-6950X 3GHz
GeForce GTX 1080 Ti
min:
96 fps, max:
189 fps
139 [X] DX12
Intel Core i7-4790K 4GHz
GeForce GTX 1080 Ti
min:
101 fps, max:
199 fps
142 [X] i7-7700K Gigabyte Z270-Gaming K3 Intel Core i7-7700K 4.2GHz
GeForce GTX 1080 Ti
min:
107 fps, max:
200 fps
~ 121 fps
54%
GeForce GTX 1050 Max-Q:
28.3 30.1 ~ 29 fps
200%
GeForce GTX 1080 Ti:
87 [X] DX12
AMD Ryzen 7 1700 3GHz
GeForce GTX 1080 Ti
min:
64 fps, max:
123 fps
98 [X] DX12 no SMT
AMD Ryzen 7 1700 3GHz
GeForce GTX 1080 Ti
min:
71 fps, max:
134 fps
105 [X] DX12 no SMT
AMD Ryzen 7 1800X 3.6GHz
GeForce GTX 1080 Ti
min:
77 fps, max:
142 fps
121 [X] DX12
Intel Core i7-4790K 4GHz
GeForce GTX 1080 Ti
min:
87 fps, max:
165 fps
129 [X] i7-7700K Gigabyte Z270-Gaming K3 Intel Core i7-7700K 4.2GHz
GeForce GTX 1080 Ti
min:
92 fps, max:
170 fps
~ 108 fps
70%
GeForce GTX 1050 Max-Q:
20.3 21.4 ~ 21 fps
247%
GeForce GTX 1080 Ti:
72.6 [X] DX12 no SMT
AMD Ryzen 7 1700 3GHz
GeForce GTX 1080 Ti
min:
57 fps, max:
92 fps
73 [X] DX12
Intel Core i7-4790K 4GHz
GeForce GTX 1080 Ti
min:
57 fps, max:
94 fps
73.9 [X] DX12
AMD Ryzen 7 1700 3GHz
GeForce GTX 1080 Ti
min:
57 fps, max:
95 fps
73.9 [X] i7-7700K Gigabyte Z270-Gaming K3 Intel Core i7-7700K 4.2GHz
GeForce GTX 1080 Ti
min:
57 fps, max:
93 fps
74.5 [X] DX12 no SMT
AMD Ryzen 7 1800X 3.6GHz
GeForce GTX 1080 Ti
min:
58 fps, max:
94 fps
75.1 [X] i5-7600K Gigabyte Z270-Gaming K3 Intel Core i5-7600K 3.8GHz
GeForce GTX 1080 Ti
min:
58 fps, max:
95 fps
~ 74 fps
100%
GeForce GTX 1060 Mobile:
19.1 fps
47%
GeForce GTX 1050 Max-Q:
9 9.6 ~ 9 fps
246%
GeForce GTX 1080 Ti:
46 [X] DX12
Intel Core i7-4790K 4GHz
GeForce GTX 1080 Ti
min:
40 fps, max:
55 fps
46 [X] DX11
Intel Core i7-4790K 4GHz
GeForce GTX 1080 Ti
min:
39 fps, max:
55 fps
46.8 [X] i7-6950X Asus X99-E Intel Core i7-6950X 3GHz
GeForce GTX 1080 Ti
min:
37 fps, max:
55 fps
47 [X] i7-5960X Asus X99-E Intel Core i7-5960X 3GHz
GeForce GTX 1080 Ti
min:
40 fps, max:
56 fps
47.3 [X] DX12 no SMT
AMD Ryzen 7 1700 3GHz
GeForce GTX 1080 Ti
min:
40 fps, max:
56 fps
47.3 [X] DX 12
AMD Ryzen 7 1800X 3.6GHz
GeForce GTX 1080 Ti
min:
40 fps, max:
56 fps
47.6 [X] i5-7600K Gigabyte Z270-Gaming K3 Intel Core i5-7600K 3.8GHz
GeForce GTX 1080 Ti
min:
40 fps, max:
56 fps
47.7 [X] DX12
AMD Ryzen 7 1700 3GHz
GeForce GTX 1080 Ti
min:
41 fps, max:
56 fps
48.1 [X] i7-7700K Gigabyte Z270-Gaming K3 Intel Core i7-7700K 4.2GHz
GeForce GTX 1080 Ti
min:
41 fps, max:
57 fps
~ 47 fps
100%
GeForce GTX 1060 Mobile:
63.6 fps
100%
GeForce GTX 1060 Mobile:
24.8 fps
GeForce GTX 1050 Max-Q:
256.9 fps
GeForce GTX 1050 Max-Q:
160 fps
100%
GeForce GTX 1060 Mobile:
169 fps
48%
GeForce GTX 1050 Max-Q:
80.5 fps
47%
GeForce GTX 1050 Max-Q:
48.9 fps
250%
GeForce GTX 1080 Ti:
263 [X] Intel Core i7-4790K 4GHz
GeForce GTX 1080 Ti
min:
210 fps, max:
302 fps
fps
100%
GeForce GTX 1060 Mobile:
54.5 54.8 ~ 55 fps
47%
GeForce GTX 1050 Max-Q:
26 fps
260%
GeForce GTX 1080 Ti:
143 [X] Intel Core i7-4790K 4GHz
GeForce GTX 1080 Ti
min:
122 fps, max:
164 fps
fps
199%
GeForce GTX 1080 Ti:
162 [X] Intel Core i7-4790K 4GHz
GeForce GTX 1080 Ti
200 [X] Vulkan
Intel Core i7-4790K 4GHz
GeForce GTX 1080 Ti
~ 181 fps
100%
GeForce GTX 1060 Mobile:
30 30.5 31.5 ~ 31 fps
316%
GeForce GTX 1080 Ti:
96 [X] OGL
Intel Core i7-4790K 4GHz
GeForce GTX 1080 Ti
99 [X] Vulkan
Intel Core i7-4790K 4GHz
GeForce GTX 1080 Ti
~ 98 fps
85%
GeForce GTX 1050 Max-Q:
53.8 fps
58%
GeForce GTX 1050 Max-Q:
33.5 fps
56%
GeForce GTX 1050 Max-Q:
29.1 fps
168%
GeForce GTX 1080 Ti:
87.5 [X] Intel Core i7-4790K 4GHz
GeForce GTX 1080 Ti
fps
100%
GeForce GTX 1060 Mobile:
24 fps
79%
GeForce GTX 1050 Max-Q:
18.9 fps
243%
GeForce GTX 1080 Ti:
58.4 [X] Intel Core i7-4790K 4GHz
GeForce GTX 1080 Ti
fps
100%
GeForce GTX 1060 Mobile:
80 87.8 ~ 84 fps
100%
GeForce GTX 1060 Mobile:
63.1 65 ~ 64 fps
100%
GeForce GTX 1060 Mobile:
31.4 fps
100%
GeForce GTX 1060 Mobile:
71 73.7 ~ 72 fps
100%
GeForce GTX 1060 Mobile:
70 72.1 ~ 71 fps
183%
GeForce GTX 1080 Ti:
95 [X] DX11
Intel Core i7-4790K 4GHz
GeForce GTX 1080 Ti
min:
69 fps, max:
122 fps
fps
100%
GeForce GTX 1060 Mobile:
23 fps
309%
GeForce GTX 1080 Ti:
70 [X] DX11
Intel Core i7-4790K 4GHz
GeForce GTX 1080 Ti
min:
57 fps, max:
82 fps
72 [X] DX12
Intel Core i7-4790K 4GHz
GeForce GTX 1080 Ti
min:
58 fps, max:
84 fps
~ 71 fps
100%
GeForce GTX 1060 Mobile:
184.6 217.3 ~ 201 fps
55%
GeForce GTX 1050 Max-Q:
109.9 fps
139%
GeForce GTX 1080 Ti:
280 [X] Intel Core i7-4790K 4GHz
GeForce GTX 1080 Ti
min:
204 fps, max:
356 fps
fps
100%
GeForce GTX 1060 Mobile:
120.7 146.3 ~ 134 fps
52%
GeForce GTX 1050 Max-Q:
69.8 fps
190%
GeForce GTX 1080 Ti:
254 [X] Intel Core i7-4790K 4GHz
GeForce GTX 1080 Ti
min:
190 fps, max:
357 fps
fps
50%
GeForce GTX 1050 Max-Q:
32.3 fps
250%
GeForce GTX 1080 Ti:
160 [X] Intel Core i7-4790K 4GHz
GeForce GTX 1080 Ti
min:
107 fps, max:
217 fps
fps
49%
GeForce GTX 1050 Max-Q:
24.8 fps
255%
GeForce GTX 1080 Ti:
130 [X] Intel Core i7-4790K 4GHz
GeForce GTX 1080 Ti
min:
75 fps, max:
180 fps
fps
100%
GeForce GTX 1060 Mobile:
24.2 26.9 ~ 26 fps
42%
GeForce GTX 1050 Max-Q:
10.9 fps
250%
GeForce GTX 1080 Ti:
65 [X] Intel Core i7-4790K 4GHz
GeForce GTX 1080 Ti
min:
31 fps, max:
89 fps
fps
139%
GeForce GTX 1080 Ti:
157 [X] Intel Core i7-4790K 4GHz
GeForce GTX 1080 Ti
min:
116 fps, max:
191 fps
fps
100%
GeForce GTX 1060 Mobile:
82 84 87 92 92 ~ 87 fps
156%
GeForce GTX 1080 Ti:
136 [X] Intel Core i7-4790K 4GHz
GeForce GTX 1080 Ti
min:
93 fps, max:
173 fps
fps
168%
GeForce GTX 1080 Ti:
129 [X] Intel Core i7-4790K 4GHz
GeForce GTX 1080 Ti
min:
93 fps, max:
154 fps
fps
205%
GeForce GTX 1080 Ti:
121 [X] Intel Core i7-4790K 4GHz
GeForce GTX 1080 Ti
min:
81 fps, max:
149 fps
fps
100%
GeForce GTX 1060 Mobile:
24 24 26 26 ~ 25 fps
256%
GeForce GTX 1080 Ti:
64 [X] Intel Core i7-4790K 4GHz
GeForce GTX 1080 Ti
min:
59 fps, max:
70 fps
fps
100%
GeForce GTX 1060 Mobile:
85.5 fps
100%
GeForce GTX 1060 Mobile:
62.8 fps
100%
GeForce GTX 1060 Mobile:
16.3 fps
67%
GeForce GTX 1050 Max-Q:
98 105.5 ~ 102 fps
44%
GeForce GTX 1050 Max-Q:
41.4 56 62 ~ 53 fps
247%
GeForce GTX 1080 Ti:
180 [X] DX12
Intel Core i7-4790K 4GHz
GeForce GTX 1080 Ti
min:
165 fps, max:
192 fps
fps
264%
GeForce GTX 1080 Ti:
161 [X] DX12
Intel Core i7-4790K 4GHz
GeForce GTX 1080 Ti
min:
148 fps, max:
173 fps
fps
54%
GeForce GTX 1050 Max-Q:
12.9 fps
292%
GeForce GTX 1080 Ti:
68.4 [X] DX12
Intel Core i7-4790K 4GHz
GeForce GTX 1080 Ti
min:
61 fps, max:
75 fps
70.9 [X] DX11
Intel Core i7-4790K 4GHz
GeForce GTX 1080 Ti
min:
63 fps, max:
78 fps
~ 70 fps
GeForce GTX 1050 Max-Q:
108 170.3 ~ 139 fps
GeForce GTX 1080 Ti:
338 [X] Intel Core i7-4790K 4GHz
GeForce GTX 1080 Ti
min:
163 fps, max:
580 fps
fps
GeForce GTX 1080 Ti:
301 [X] Intel Core i7-4790K 4GHz
GeForce GTX 1080 Ti
min:
148 fps, max:
541 fps
fps
100%
GeForce GTX 1060 Mobile:
136 fps
54%
GeForce GTX 1050 Max-Q:
67.5 80.4 ~ 74 fps
201%
GeForce GTX 1080 Ti:
274 [X] Intel Core i7-4790K 4GHz
GeForce GTX 1080 Ti
min:
144 fps, max:
474 fps
fps
58%
GeForce GTX 1050 Max-Q:
62.8 67 ~ 65 fps
219%
GeForce GTX 1080 Ti:
247 [X] Intel Core i7-4790K 4GHz
GeForce GTX 1080 Ti
min:
125 fps, max:
391 fps
fps
100%
GeForce GTX 1060 Mobile:
42.7 fps
56%
GeForce GTX 1050 Max-Q:
22.1 26.1 ~ 24 fps
255%
GeForce GTX 1080 Ti:
109 [X] Intel Core i7-4790K 4GHz
GeForce GTX 1080 Ti
min:
74 fps, max:
202 fps
fps
100%
GeForce GTX 1060 Mobile:
94.6 fps
100%
GeForce GTX 1060 Mobile:
83 fps
100%
GeForce GTX 1060 Mobile:
76.7 79 81.8 ~ 79 fps
100%
GeForce GTX 1060 Mobile:
70 70.4 71 ~ 70 fps
100%
GeForce GTX 1060 Mobile:
30.3 fps
100%
GeForce GTX 1060 Mobile:
102 fps
100%
GeForce GTX 1060 Mobile:
76.5 88.4 ~ 82 fps
100%
GeForce GTX 1060 Mobile:
33.4 fps
100%
GeForce GTX 1060 Mobile:
69.9 fps
100%
GeForce GTX 1060 Mobile:
30.8 fps
100%
GeForce GTX 1060 Mobile:
24.4 fps
100%
GeForce GTX 1060 Mobile:
102 fps
100%
GeForce GTX 1060 Mobile:
100 fps
100%
GeForce GTX 1060 Mobile:
77.4 80.1 83 ~ 80 fps
216%
GeForce GTX 1080 Ti:
149 [X] Intel Core i7-4790K 4GHz
GeForce GTX 1080 Ti
min:
121 fps, max:
211 fps
fps
274%
GeForce GTX 1080 Ti:
74 [X] Intel Core i7-4790K 4GHz
GeForce GTX 1080 Ti
min:
58 fps, max:
92 fps
fps
100%
GeForce GTX 1060 Mobile:
80.6 fps
100%
GeForce GTX 1060 Mobile:
73.2 fps
100%
GeForce GTX 1060 Mobile:
26.6 fps
100%
GeForce GTX 1060 Mobile:
81.9 110.4 ~ 96 fps
100%
GeForce GTX 1060 Mobile:
75 103.3 ~ 89 fps
100%
GeForce GTX 1060 Mobile:
32.4 fps
100%
GeForce GTX 1060 Mobile:
241 fps
100%
GeForce GTX 1060 Mobile:
111 fps
100%
GeForce GTX 1060 Mobile:
140 fps
125%
GeForce GTX 1050 Max-Q:
174.8 fps
100%
GeForce GTX 1060 Mobile:
119 fps
118%
GeForce GTX 1050 Max-Q:
140.9 fps
100%
GeForce GTX 1060 Mobile:
94 fps
116%
GeForce GTX 1050 Max-Q:
109.3 fps
100%
GeForce GTX 1060 Mobile:
85 fps
98%
GeForce GTX 1050 Max-Q:
83.3 fps
191%
GeForce GTX 1080 Ti:
162 [X] Intel Core i7-4790K 4GHz
GeForce GTX 1080 Ti
min:
99 fps, max:
248 fps
fps
100%
GeForce GTX 1060 Mobile:
52 94 [X] GTX 1060 mobile Pre-Sample Intel Core i7-6700HQ 2.6GHz
GeForce GTX 1060 Mobile
min:
55 fps, max:
135 fps
~ 73 fps
36%
GeForce GTX 1050 Max-Q:
26.1 fps
170%
GeForce GTX 1080 Ti:
124 [X] Intel Core i7-4790K 4GHz
GeForce GTX 1080 Ti
min:
95 fps, max:
177 fps
fps
100%
GeForce GTX 1060 Mobile:
60 60 ~ 60 fps
100%
GeForce GTX 1060 Mobile:
40.8 fps
100%
GeForce GTX 1060 Mobile:
124 fps
100%
GeForce GTX 1060 Mobile:
114 fps
100%
GeForce GTX 1060 Mobile:
41.3 fps
GeForce GTX 1050 Max-Q:
149.5 fps
GeForce GTX 1080 Ti:
34.5 [X] Gigabyte AX-370 Gaming 5 AMD Ryzen 5 1400 3.2GHz
GeForce GTX 1080 Ti
min:
33.1 fps
110 [X] Asus Crosshair VI Hero AMD Ryzen 5 1600 3.2GHz
GeForce GTX 1080 Ti
min:
96.4 fps
143 [X] Asus X299 Prime Desktop DDR4-3200 Intel Core i9-9980XE 3GHz
GeForce GTX 1080 Ti
min:
126.2 fps
145 [X] Asus X299 Prime Desktop DDR4-2666 Intel Core i9-9980XE 3GHz
GeForce GTX 1080 Ti
min:
128.3 fps
154 [X] Asus X299 Prime Desktop DDR4-3200 Intel Core i9-10980XE 3GHz
GeForce GTX 1080 Ti
min:
135 fps
154 [X] Aorus Z370 Ultra Gaming Desktop DDR4-2666 Intel Core i7-8086K 3.7GHz
GeForce GTX 1080 Ti
min:
136.6 fps
158 [X] Asus X299 Prime Desktop Intel Core i9-10980XE 3GHz
GeForce GTX 1080 Ti
min:
138.5 fps
220 [X] Intel Core i7-4790K 4GHz
GeForce GTX 1080 Ti
min:
198 fps
~ 140 fps
GeForce GTX 1050 Max-Q:
134.1 fps
GeForce GTX 1080 Ti:
33.8 [X] Gigabyte AX-370 Gaming 5 AMD Ryzen 5 1400 3.2GHz
GeForce GTX 1080 Ti
min:
32.4 fps
102 [X] Asus Crosshair VI Hero AMD Ryzen 5 1600 3.2GHz
GeForce GTX 1080 Ti
min:
87.9 fps
131 [X] Asus X299 Prime Desktop DDR4-3200 Intel Core i9-9980XE 3GHz
GeForce GTX 1080 Ti
min:
116.1 fps
133 [X] Asus X299 Prime Desktop DDR4-2666 Intel Core i9-9980XE 3GHz
GeForce GTX 1080 Ti
min:
115 fps
142 [X] Asus X299 Prime Desktop DDR4-3200 Intel Core i9-10980XE 3GHz
GeForce GTX 1080 Ti
min:
124.8 fps
142 [X] Aorus Z370 Ultra Gaming Desktop DDR4-2666 Intel Core i7-8086K 3.7GHz
GeForce GTX 1080 Ti
min:
125.5 fps
144 [X] Asus X299 Prime Desktop Intel Core i9-10980XE 3GHz
GeForce GTX 1080 Ti
min:
126.5 fps
193 [X] Intel Core i7-4790K 4GHz
GeForce GTX 1080 Ti
min:
173 fps
~ 128 fps
GeForce GTX 1050 Max-Q:
115.5 fps
GeForce GTX 1080 Ti:
33.5 [X] Gigabyte AX-370 Gaming 5 AMD Ryzen 5 1400 3.2GHz
GeForce GTX 1080 Ti
min:
32.1 fps
99.3 [X] Asus Crosshair VI Hero AMD Ryzen 5 1600 3.2GHz
GeForce GTX 1080 Ti
min:
85.6 fps
126 [X] Asus X299 Prime Desktop DDR4-3200 Intel Core i9-9980XE 3GHz
GeForce GTX 1080 Ti
min:
111.2 fps
127 [X] Asus X299 Prime Desktop DDR4-2666 Intel Core i9-9980XE 3GHz
GeForce GTX 1080 Ti
min:
112 fps
138 [X] Asus X299 Prime Desktop Intel Core i9-10980XE 3GHz
GeForce GTX 1080 Ti
min:
121.3 fps
139 [X] Asus X299 Prime Desktop DDR4-3200 Intel Core i9-10980XE 3GHz
GeForce GTX 1080 Ti
min:
119.4 fps
139 [X] Aorus Z370 Ultra Gaming Desktop DDR4-2666 Intel Core i7-8086K 3.7GHz
GeForce GTX 1080 Ti
min:
123 fps
191 [X] Intel Core i7-4790K 4GHz
GeForce GTX 1080 Ti
min:
171 fps
~ 124 fps
100%
GeForce GTX 1060 Mobile:
117.9 [X] EVGA SC15 Intel Core i7-7700HQ 2.8GHz
GeForce GTX 1060 Mobile
fps
88%
GeForce GTX 1050 Max-Q:
104.1 fps
98%
GeForce GTX 1080 Ti:
32.8 [X] Gigabyte AX-370 Gaming 5 AMD Ryzen 5 1400 3.2GHz
GeForce GTX 1080 Ti
min:
31.5 fps
94.1 [X] Asus Crosshair VI Hero AMD Ryzen 5 1600 3.2GHz
GeForce GTX 1080 Ti
min:
80.1 fps
120 [X] Asus X299 Prime Desktop DDR4-3200 Intel Core i9-9980XE 3GHz
GeForce GTX 1080 Ti
min:
104.8 fps
121 [X] Asus X299 Prime Desktop DDR4-2666 Intel Core i9-9980XE 3GHz
GeForce GTX 1080 Ti
min:
106.6 fps
128 [X] Asus X299 Prime Desktop DDR4-3200 Intel Core i9-10980XE 3GHz
GeForce GTX 1080 Ti
min:
112.9 fps
130 [X] Asus X299 Prime Desktop Intel Core i9-10980XE 3GHz
GeForce GTX 1080 Ti
min:
114 fps
132 [X] Aorus Z370 Ultra Gaming Desktop DDR4-2666 Intel Core i7-8086K 3.7GHz
GeForce GTX 1080 Ti
min:
114.4 fps
173 [X] Intel Core i7-4790K 4GHz
GeForce GTX 1080 Ti
min:
156 fps
~ 116 fps
GeForce GTX 1050 Max-Q:
37.1 fps
GeForce GTX 1080 Ti:
32.6 [X] Gigabyte AX-370 Gaming 5 AMD Ryzen 5 1400 3.2GHz
GeForce GTX 1080 Ti
min:
31.2 fps
92.2 [X] Asus Crosshair VI Hero AMD Ryzen 5 1600 3.2GHz
GeForce GTX 1080 Ti
min:
79.1 fps
117 [X] Asus X299 Prime Desktop DDR4-2666 Intel Core i9-9980XE 3GHz
GeForce GTX 1080 Ti
min:
100 fps
118 [X] Asus X299 Prime Desktop DDR4-3200 Intel Core i9-9980XE 3GHz
GeForce GTX 1080 Ti
min:
102.9 fps
125 [X] Asus X299 Prime Desktop Intel Core i9-10980XE 3GHz
GeForce GTX 1080 Ti
min:
108.2 fps
126 [X] Asus X299 Prime Desktop DDR4-3200 Intel Core i9-10980XE 3GHz
GeForce GTX 1080 Ti
min:
109.5 fps
126 [X] Aorus Z370 Ultra Gaming Desktop DDR4-2666 Intel Core i7-8086K 3.7GHz
GeForce GTX 1080 Ti
min:
109.2 fps
143 [X] AMD Ryzen 7 1800X 3.6GHz
GeForce GTX 1080 Ti
min:
124 fps
169 [X] Intel Core i7-4790K 4GHz
GeForce GTX 1080 Ti
min:
148 fps
~ 117 fps
100%
GeForce GTX 1060 Mobile:
78 78 [X] Gigabyte Aero 14 GA-K106Q416-PL-B02 Intel Core i7-7700HQ 2.8GHz
GeForce GTX 1060 Mobile
80 80 [X] Hyperbook N85-7300-8-12-1060 Intel Core i5-7300HQ 2.5GHz
GeForce GTX 1060 Mobile
82 [X] Hyperbook SL502 VR Intel Core i7-6700HQ 2.6GHz
GeForce GTX 1060 Mobile
83 83 83 [X] Saelic Veni G731 Intel Core i7-6700HQ 2.6GHz
GeForce GTX 1060 Mobile
84 85 86 88 88 [X] MSI GP72MVR 7RFX Leopard Pro Intel Core i7-7700HQ 2.8GHz
GeForce GTX 1060 Mobile
89 [X] EVGA SC15 Intel Core i7-7700HQ 2.8GHz
GeForce GTX 1060 Mobile
91 [X] Smart7 Fobos GX15D G1 Intel Core i7-7700HQ 2.8GHz
GeForce GTX 1060 Mobile
~ 84 fps
100%
GeForce GTX 1060 Mobile:
42 [X] Asus G752VM PL Intel Core i7-6700HQ 2.6GHz
GeForce GTX 1060 Mobile
45 50 53 [X] Hyperbook N85-7300-8-12-1060 Intel Core i5-7300HQ 2.5GHz
GeForce GTX 1060 Mobile
53 54 [X] Gigabyte Aero 14 GA-K106Q416-PL-B02 Intel Core i7-7700HQ 2.8GHz
GeForce GTX 1060 Mobile
55 [X] Saelic Veni G731 Intel Core i7-6700HQ 2.6GHz
GeForce GTX 1060 Mobile
55 56 [X] Hyperbook SL502 VR Intel Core i7-6700HQ 2.6GHz
GeForce GTX 1060 Mobile
56 57 57 58 58 58 [X] MSI GP72MVR 7RFX Leopard Pro Intel Core i7-7700HQ 2.8GHz
GeForce GTX 1060 Mobile
60 61 62 62 [X] EVGA SC15 Intel Core i7-7700HQ 2.8GHz
GeForce GTX 1060 Mobile
63 [X] Saelic Veni G531D Intel Core i7-6700K 4GHz
GeForce GTX 1060 Mobile
63 [X] Smart7 Fobos GX15D G1 Intel Core i7-7700HQ 2.8GHz
GeForce GTX 1060 Mobile
81 ~ 57 fps
100%
GeForce GTX 1060 Mobile:
28 29 ~ 29 fps
162%
GeForce GTX 1080 Ti:
150 [X] Nvidia GeForce GTX 1080 Ti Founders Edition Asus Crosshair VI Hero AMD Ryzen 5 1400 3.2GHz
GeForce GTX 1080 Ti
min:
105 fps, max:
173 fps
185 [X] AMD Ryzen 3 1200 3.1GHz
GeForce GTX 1080 Ti
min:
160 fps, max:
211 fps
202 [X] AMD Ryzen 3 1300X 3.5GHz
GeForce GTX 1080 Ti
min:
180 fps, max:
227 fps
225 [X] AMD Ryzen 5 1400 3.2GHz
GeForce GTX 1080 Ti
min:
202 fps, max:
256 fps
247 [X] AMD Ryzen 7 1700X 3.4GHz
GeForce GTX 1080 Ti
min:
226 fps, max:
273 fps
250 [X] 1500X Nvidia GeForce GTX 1080 Ti FE Asus Prime B350-PLUS AMD Ryzen 5 1500X 3.5GHz
GeForce GTX 1080 Ti
min:
226 fps, max:
287 fps
254 [X] AMD Ryzen 5 1600 3.2GHz
GeForce GTX 1080 Ti
min:
237 fps, max:
292 fps
261 [X] AMD Ryzen 7 1700 3GHz
GeForce GTX 1080 Ti
min:
238 fps, max:
293 fps
274 [X] Nvidia GeForce GTX 1080 Ti FE Asus Prime B350-PLUS AMD Ryzen 7 1700 3GHz
GeForce GTX 1080 Ti
min:
243 fps, max:
310 fps
283 [X] AMD Ryzen 7 1800X 3.6GHz
GeForce GTX 1080 Ti
min:
255 fps, max:
312 fps
297 [X] Nvidia GeForce GTX 1080 Ti FE Asus Prime B350-PLUS AMD Ryzen 7 1800X 3.6GHz
GeForce GTX 1080 Ti
min:
267 fps, max:
336 fps
303 [X] Intel Core i5-8400 2.8GHz
GeForce GTX 1080 Ti
min:
277 fps, max:
338 fps
313 [X] i7-7700K Gigabyte Z270-Gaming K3 Intel Core i7-7700K 4.2GHz
GeForce GTX 1080 Ti
min:
284 fps, max:
344 fps
313 [X] Aorus Z370 Ultra Gaming Desktop DDR4-2666 Intel Core i7-8086K 3.7GHz
GeForce GTX 1080 Ti
min:
286 fps, max:
354 fps
317 [X] i7-6950X Asus X99-E Intel Core i7-6950X 3GHz
GeForce GTX 1080 Ti
min:
279 fps, max:
360 fps
322 [X] Intel Core i7-4790K 4GHz
GeForce GTX 1080 Ti
min:
297 fps, max:
348 fps
327 [X] Intel Core i7-7740X 4.3GHz
GeForce GTX 1080 Ti
min:
258 fps, max:
363 fps
330 [X] Nvidia GeForce GTX 1080 Ti Founders Edition Intel Core i7-7740X 4.3GHz
GeForce GTX 1080 Ti
min:
285 fps, max:
374 fps
338 [X] Intel Core i7-8700K 3.7GHz
GeForce GTX 1080 Ti
min:
307 fps, max:
390 fps
349 [X] Intel Core i9-7900X 3.3GHz
GeForce GTX 1080 Ti
min:
260 fps, max:
392 fps
352 [X] Asus X299 Prime Desktop DDR4-2666 Intel Core i9-9980XE 3GHz
GeForce GTX 1080 Ti
min:
307 fps, max:
393 fps
393 [X] Asus X299 Prime Desktop Intel Core i9-10980XE 3GHz
GeForce GTX 1080 Ti
min:
363 fps, max:
418 fps
~ 286 fps
54%
GeForce GTX 1050 Max-Q:
34 34.5 41 ~ 37 fps
251%
GeForce GTX 1080 Ti:
87 [X] Nvidia GeForce GTX 1080 Ti Founders Edition Asus Crosshair VI Hero AMD Ryzen 5 1400 3.2GHz
GeForce GTX 1080 Ti
min:
28 fps, max:
101 fps
95 [X] AMD Ryzen 5 1600 3.2GHz
GeForce GTX 1080 Ti
min:
80 fps, max:
108 fps
96.3 [X] AMD Ryzen 5 1400 3.2GHz
GeForce GTX 1080 Ti
min:
83 fps, max:
110 fps
96.4 [X] AMD Ryzen 7 1700X 3.4GHz
GeForce GTX 1080 Ti
min:
83 fps, max:
111 fps
96.4 [X] 1500X Nvidia GeForce GTX 1080 Ti FE Asus Prime B350-PLUS AMD Ryzen 5 1500X 3.5GHz
GeForce GTX 1080 Ti
min:
84 fps, max:
110 fps
97 [X] Nvidia GeForce GTX 1080 Ti FE Asus Prime B350-PLUS AMD Ryzen 7 1800X 3.6GHz
GeForce GTX 1080 Ti
min:
83 fps, max:
110 fps
97 [X] Intel Core i9-7900X 3.3GHz
GeForce GTX 1080 Ti
min:
80 fps, max:
112 fps
97 [X] AMD Ryzen 3 1200 3.1GHz
GeForce GTX 1080 Ti
min:
84 fps, max:
112 fps
98 [X] Intel Core i7-4790K 4GHz
GeForce GTX 1080 Ti
min:
83 fps, max:
112 fps
98 [X] AMD Ryzen 7 1700 3GHz
GeForce GTX 1080 Ti
min:
86 fps, max:
111 fps
98 [X] Nvidia GeForce GTX 1080 Ti FE Asus Prime B350-PLUS AMD Ryzen 7 1700 3GHz
GeForce GTX 1080 Ti
98 [X] Aorus Z370 Ultra Gaming Desktop DDR4-2666 Intel Core i7-8086K 3.7GHz
GeForce GTX 1080 Ti
min:
85 fps, max:
110 fps
99 [X] AMD Ryzen 7 1800X 3.6GHz
GeForce GTX 1080 Ti
min:
85 fps, max:
110 fps
99 [X] i7-6950X Asus X99-E Intel Core i7-6950X 3GHz
GeForce GTX 1080 Ti
min:
85 fps, max:
114 fps
99 [X] Asus X299 Prime Desktop Intel Core i9-10980XE 3GHz
GeForce GTX 1080 Ti
min:
88 fps, max:
111 fps
100 [X] i7-7700K Gigabyte Z270-Gaming K3 Intel Core i7-7700K 4.2GHz
GeForce GTX 1080 Ti
min:
86 fps, max:
113 fps
101 [X] Intel Core i5-8400 2.8GHz
GeForce GTX 1080 Ti
min:
87 fps, max:
113 fps
102 [X] Intel Core i7-7740X 4.3GHz
GeForce GTX 1080 Ti
min:
87 fps, max:
116 fps
102 [X] Intel Core i7-8700K 3.7GHz
GeForce GTX 1080 Ti
min:
86 fps, max:
115 fps
102 [X] Asus X299 Prime Desktop DDR4-2666 Intel Core i9-9980XE 3GHz
GeForce GTX 1080 Ti
min:
88 fps, max:
118 fps
104 [X] Nvidia GeForce GTX 1080 Ti Founders Edition Intel Core i7-7740X 4.3GHz
GeForce GTX 1080 Ti
min:
87 fps, max:
118 fps
~ 98 fps
50%
GeForce GTX 1050 Max-Q:
12 13.1 ~ 13 fps
277%
GeForce GTX 1080 Ti:
72 [X] Intel Core i7-4790K 4GHz
GeForce GTX 1080 Ti
min:
61 fps, max:
79 fps
fps
100%
GeForce GTX 1060 Mobile:
122 fps
100%
GeForce GTX 1060 Mobile:
95.6 fps
135%
GeForce GTX 1080 Ti:
129 [X] Intel Core i7-4790K 4GHz
GeForce GTX 1080 Ti
min:
98 fps, max:
204 fps
fps
100%
GeForce GTX 1060 Mobile:
79 fps
171%
GeForce GTX 1080 Ti:
135 [X] Intel Core i7-4790K 4GHz
GeForce GTX 1080 Ti
min:
102 fps, max:
215 fps
fps
100%
GeForce GTX 1060 Mobile:
122.3 145.5 ~ 134 fps
130%
GeForce GTX 1080 Ti:
174 [X] Aorus Z370 Ultra Gaming Desktop DDR4-2666 Intel Core i7-8086K 3.7GHz
GeForce GTX 1080 Ti
min:
4.22 fps, P1:
111 fps, max:
291 fps
fps
100%
GeForce GTX 1060 Mobile:
117.7 133.1 156.4 [X] HP Omen 15-dc0006ng Intel Core i7-8750H 2.2GHz
GeForce GTX 1060 Mobile
min:
3.88 fps, P1:
83.3 fps, max:
297 fps
~ 136 fps
125%
GeForce GTX 1080 Ti:
170 [X] Aorus Z370 Ultra Gaming Desktop DDR4-2666 Intel Core i7-8086K 3.7GHz
GeForce GTX 1080 Ti
min:
30 fps, P1:
111 fps, max:
250 fps
fps
100%
GeForce GTX 1060 Mobile:
90.3 97 112.8 [X] HP Omen 15-dc0006ng Intel Core i7-8750H 2.2GHz
GeForce GTX 1060 Mobile
min:
10.3 fps, P1:
62.5 fps, max:
197.8 fps
~ 100 fps
62%
GeForce GTX 1050 Max-Q:
61.8 62.1 ~ 62 fps
153%
GeForce GTX 1080 Ti:
153 [X] Aorus Z370 Ultra Gaming Desktop DDR4-2666 Intel Core i7-8086K 3.7GHz
GeForce GTX 1080 Ti
min:
5.66 fps, P1:
100 fps, max:
265 fps
fps
100%
GeForce GTX 1060 Mobile:
48.2 51 58.3 [X] HP Omen 15-dc0006ng Intel Core i7-8750H 2.2GHz
GeForce GTX 1060 Mobile
min:
6.98 fps, P1:
34.5 fps, max:
135.8 fps
~ 53 fps
51%
GeForce GTX 1050 Max-Q:
27 27.7 ~ 27 fps
164%
GeForce GTX 1080 Ti:
85 [X] Intel Core i7-4790K 4GHz
GeForce GTX 1080 Ti
89.7 [X] Aorus Z370 Ultra Gaming Desktop DDR4-2666 Intel Core i7-8086K 3.7GHz
GeForce GTX 1080 Ti
min:
6.36 fps, P1:
62.5 fps, max:
175 fps
~ 87 fps
GeForce GTX 1080 Ti:
83.7 [X] Aorus Z370 Ultra Gaming Desktop DDR4-2666 Intel Core i7-8086K 3.7GHz
GeForce GTX 1080 Ti
min:
9.49 fps, P1:
52.6 fps, max:
164 fps
fps
GeForce GTX 1050 Max-Q:
26.1 29.1 ~ 28 fps
GeForce GTX 1080 Ti:
97.7 [X] Aorus Z370 Ultra Gaming Desktop DDR4-2666 Intel Core i7-8086K 3.7GHz
GeForce GTX 1080 Ti
min:
9.82 fps, P1:
71.4 fps, max:
172 fps
97.8 [X] Intel Core i7-4790K 4GHz
GeForce GTX 1080 Ti
~ 98 fps
100%
GeForce GTX 1060 Mobile:
90 fps
100%
GeForce GTX 1060 Mobile:
59.7 fps
285%
GeForce GTX 1080 Ti:
170 [X] Intel Core i7-4790K 4GHz
GeForce GTX 1080 Ti
min:
126 fps
fps
100%
GeForce GTX 1060 Mobile:
163 fps
100%
GeForce GTX 1060 Mobile:
115 fps
100%
GeForce GTX 1060 Mobile:
147.5 fps
100%
GeForce GTX 1060 Mobile:
130.9 fps
100%
GeForce GTX 1060 Mobile:
109 fps
100%
GeForce GTX 1060 Mobile:
85.7 fps
100%
GeForce GTX 1060 Mobile:
122 fps
100%
GeForce GTX 1060 Mobile:
119 fps
100%
GeForce GTX 1060 Mobile:
141 fps
100%
GeForce GTX 1060 Mobile:
120 fps
100%
GeForce GTX 1060 Mobile:
70.4 fps
100%
GeForce GTX 1060 Mobile:
54.4 fps
100%
GeForce GTX 1060 Mobile:
98.4 fps
108%
GeForce GTX 1050 Max-Q:
106 fps
GeForce GTX 1050 Max-Q:
56.5 76 ~ 66 fps
100%
GeForce GTX 1060 Mobile:
64.6 [X] Gigabyte Aero 14 GA-K106Q416-PL-B02 Intel Core i7-7700HQ 2.8GHz
GeForce GTX 1060 Mobile
66.2 [X] Hyperbook N85-7300-8-12-1060 Intel Core i5-7300HQ 2.5GHz
GeForce GTX 1060 Mobile
77.5 89.6 [X] Saelic Veni G731 Intel Core i7-6700HQ 2.6GHz
GeForce GTX 1060 Mobile
95 [X] Hyperbook SL502 VR Intel Core i7-6700HQ 2.6GHz
GeForce GTX 1060 Mobile
96.1 [X] MSI GP72MVR 7RFX Leopard Pro Intel Core i7-7700HQ 2.8GHz
GeForce GTX 1060 Mobile
107.5 [X] Smart7 Fobos GX15D G1 Intel Core i7-7700HQ 2.8GHz
GeForce GTX 1060 Mobile
~ 85 fps
73%
GeForce GTX 1050 Max-Q:
57.2 66 ~ 62 fps
100%
GeForce GTX 1060 Mobile:
42 60 60.2 [X] Gigabyte Aero 14 GA-K106Q416-PL-B02 Intel Core i7-7700HQ 2.8GHz
GeForce GTX 1060 Mobile
62.8 [X] Hyperbook N85-7300-8-12-1060 Intel Core i5-7300HQ 2.5GHz
GeForce GTX 1060 Mobile
63.8 65.6 65.7 66.3 [X] Asus G752VM PL Intel Core i7-6700HQ 2.6GHz
GeForce GTX 1060 Mobile
67 67.9 68.6 [X] Hyperbook SL502 VR Intel Core i7-6700HQ 2.6GHz
GeForce GTX 1060 Mobile
70.4 [X] Saelic Veni G731 Intel Core i7-6700HQ 2.6GHz
GeForce GTX 1060 Mobile
71 71.4 72.2 72.4 73.4 74 74.9 76.8 [X] MSI GP72MVR 7RFX Leopard Pro Intel Core i7-7700HQ 2.8GHz
GeForce GTX 1060 Mobile
77 [X] Smart7 Fobos GX15D G1 Intel Core i7-7700HQ 2.8GHz
GeForce GTX 1060 Mobile
77.1 77.3 77.9 78.1 [X] Saelic Veni G531D Intel Core i7-6700K 4GHz
GeForce GTX 1060 Mobile
79 [X] EVGA SC15 Intel Core i7-7700HQ 2.8GHz
GeForce GTX 1060 Mobile
~ 70 fps
54%
GeForce GTX 1050 Max-Q:
38 38.8 ~ 38 fps
100%
GeForce GTX 1060 Mobile:
81.8 fps
100%
GeForce GTX 1060 Mobile:
46.6 fps
100%
GeForce GTX 1060 Mobile:
24.5 fps
100%
GeForce GTX 1060 Mobile:
24.5 fps
202%
GeForce GTX 1080 Ti:
200 [X] Intel Core i7-4790K 4GHz
GeForce GTX 1080 Ti
min:
196 fps, max:
201 fps
fps
100%
GeForce GTX 1060 Mobile:
45.4 49.8 ~ 48 fps
244%
GeForce GTX 1080 Ti:
117 [X] Intel Core i7-4790K 4GHz
GeForce GTX 1080 Ti
min:
105 fps, max:
137 fps
fps
100%
GeForce GTX 1060 Mobile:
148.5 [X] Gigabyte Aero 14 GA-K106Q416-PL-B02 Intel Core i7-7700HQ 2.8GHz
GeForce GTX 1060 Mobile
158.2 [X] Hyperbook N85-7300-8-12-1060 Intel Core i5-7300HQ 2.5GHz
GeForce GTX 1060 Mobile
167.4 [X] Saelic Veni G731 Intel Core i7-6700HQ 2.6GHz
GeForce GTX 1060 Mobile
171 [X] Hyperbook SL502 VR Intel Core i7-6700HQ 2.6GHz
GeForce GTX 1060 Mobile
195.8 [X] MSI GP72MVR 7RFX Leopard Pro Intel Core i7-7700HQ 2.8GHz
GeForce GTX 1060 Mobile
220.6 [X] Smart7 Fobos GX15D G1 Intel Core i7-7700HQ 2.8GHz
GeForce GTX 1060 Mobile
~ 177 fps
100%
GeForce GTX 1060 Mobile:
59.5 [X] Hyperbook N85-7300-8-12-1060 Intel Core i5-7300HQ 2.5GHz
GeForce GTX 1060 Mobile
59.6 [X] Gigabyte Aero 14 GA-K106Q416-PL-B02 Intel Core i7-7700HQ 2.8GHz
GeForce GTX 1060 Mobile
60.6 [X] Asus G752VM PL Intel Core i7-6700HQ 2.6GHz
GeForce GTX 1060 Mobile
63.2 [X] Saelic Veni G731 Intel Core i7-6700HQ 2.6GHz
GeForce GTX 1060 Mobile
63.6 [X] Hyperbook SL502 VR Intel Core i7-6700HQ 2.6GHz
GeForce GTX 1060 Mobile
66.7 [X] MSI GP72MVR 7RFX Leopard Pro Intel Core i7-7700HQ 2.8GHz
GeForce GTX 1060 Mobile
69.8 [X] Smart7 Fobos GX15D G1 Intel Core i7-7700HQ 2.8GHz
GeForce GTX 1060 Mobile
70.7 [X] Saelic Veni G531D Intel Core i7-6700K 4GHz
GeForce GTX 1060 Mobile
~ 64 fps
GeForce GTX 1050 Max-Q:
79.7 fps
GeForce GTX 1050 Max-Q:
71.8 fps
GeForce GTX 1050 Max-Q:
48.7 fps
GeForce GTX 1050 Max-Q:
21.9 fps
100%
GeForce GTX 1060 Mobile:
139 fps
120%
GeForce GTX 1080 Ti:
167 [X] Intel Core i7-4790K 4GHz
GeForce GTX 1080 Ti
fps
100%
GeForce GTX 1060 Mobile:
135 fps
100%
GeForce GTX 1060 Mobile:
116 132 ~ 124 fps
194%
GeForce GTX 1080 Ti:
149 [X] Intel Core i7-4790K 4GHz
GeForce GTX 1080 Ti
min:
38 fps, max:
254 fps
fps
207%
GeForce GTX 1080 Ti:
215 [X] Intel Core i7-4790K 4GHz
GeForce GTX 1080 Ti
fps
97%
GeForce GTX 1050 Max-Q:
333.8 fps
68%
GeForce GTX 1050 Max-Q:
216.6 fps
57%
GeForce GTX 1050 Max-Q:
157.8 fps
53%
GeForce GTX 1050 Max-Q:
73.8 fps
100%
GeForce GTX 1060 Mobile:
51.7 fps
236%
GeForce GTX 1080 Ti:
122 [X] Intel Core i7-4790K 4GHz
GeForce GTX 1080 Ti
min:
95 fps, max:
156 fps
fps
100%
GeForce GTX 1060 Mobile:
248.2 fps
127%
GeForce GTX 1050 Max-Q:
316 fps
100%
GeForce GTX 1060 Mobile:
246.2 fps
120%
GeForce GTX 1050 Max-Q:
296.3 fps
100%
GeForce GTX 1060 Mobile:
252.5 fps
92%
GeForce GTX 1050 Max-Q:
233.3 fps
100%
GeForce GTX 1060 Mobile:
221.7 fps
65%
GeForce GTX 1050 Max-Q:
143.8 fps
GeForce GTX 1050 Max-Q:
93.5 fps
GeForce GTX 1050 Max-Q:
53.4 fps
100%
GeForce GTX 1060 Mobile:
77.5 fps
100%
GeForce GTX 1060 Mobile:
87 fps
100%
GeForce GTX 1060 Mobile:
139.5 [X] Saelic Veni G731 Intel Core i7-6700HQ 2.6GHz
GeForce GTX 1060 Mobile
147.6 [X] Hyperbook SL502 VR Intel Core i7-6700HQ 2.6GHz
GeForce GTX 1060 Mobile
~ 144 fps
100%
GeForce GTX 1060 Mobile:
133.5 [X] Saelic Veni G731 Intel Core i7-6700HQ 2.6GHz
GeForce GTX 1060 Mobile
137.8 [X] Asus G752VM PL Intel Core i7-6700HQ 2.6GHz
GeForce GTX 1060 Mobile
139.5 [X] Hyperbook SL502 VR Intel Core i7-6700HQ 2.6GHz
GeForce GTX 1060 Mobile
198.8 [X] Saelic Veni G531D Intel Core i7-6700K 4GHz
GeForce GTX 1060 Mobile
~ 152 fps
Average Gaming NVIDIA GeForce GTX 1060 Mobile → 100% Average Gaming 30-70 fps → 100%
Average Gaming NVIDIA GeForce GTX 1050 Max-Q → 60% Average Gaming 30-70 fps → 55%
Average Gaming NVIDIA GeForce GTX 1080 Ti (Desktop) → 203% Average Gaming 30-70 fps → 232%
 Deutsch
 English
 Español
 Français
 Italiano
 Nederlands
 Polski
 Português
 Русский
 Türkçe
 Svenska
 Chinese
 Magyar