NVIDIA GeForce GT 1030 (Desktop) vs NVIDIA GeForce GTX 1080 Max-Q vs NVIDIA GeForce GTX 1070 Max-Q
NVIDIA GeForce GT 1030 (Desktop) ► remove from comparison
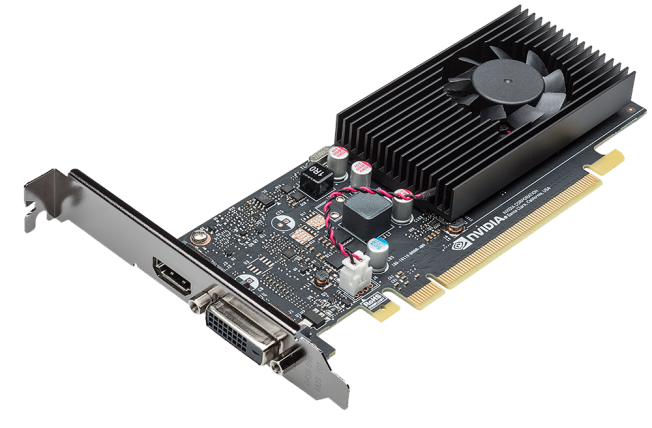
The Nvidia GeForce GT 1030 (sometime GTX 1030 called) is an entry level dedicated graphics card for desktops. It is based on the GP108 chip using the Pascal architecture in 14nm FinFET. It features three streaming multiprocessors (SMs) and therefore 384 shader cores, 24 texture units and 16 ROPs. The 2 GB GDDR5 memory are connected with two 32 Bit memory controller (48 GBit/s). The shaders are identical to other Pascal cards like the GTX 1050 and therefore also the support for DirectX 12 FL 12_1.
The performance is slightly below the Radeon RX 550 from AMD and therefore only suited for low to medium detail settings of modern games like Battlefield 1.
The TDP of the GT1030 is specified as 30 Watt.
NVIDIA GeForce GTX 1080 Max-Q ► remove from comparison
The Nvidia GeForce GTX 1080 with the Max-Q design is a mobile high-end GPU from the Pascal series. It is designed for thin and light laptops and about 10-15% slower than a regular GTX 1080 for laptops based on the cooling capabilities. The base frequency (1101-1290 MHz) is also much lower than on the regular GTX 1080 (1566 MHz, at least -18%) and the Boost (1278-1458 MHz) is also much lower compared to 1733 MHz (at least -16%) for the regular GTX 1080. The memory clock, however, is identical.
The clock is not the only difference compared to the regular GTX 1080 though. The drivers for the Max-Q version were optimized for efficiency (and not performance; only for Max-Q models), there are optimized voltage converters for 1V operation, high-end cooling methods, and a 40 dB limit for the fan noise (with clock adjustments to ensure this at all times).
The performance is nearer to the normal (Max-P) GeForce GTX 1070 than to then GTX 1080 (at least in the Asus Zephyrus). Therefore, most demanding games should be playable in full HD and maximum detail settings (see game benchmarks below).
Features
The GP104 chip is manufactured in 16nm FinFET process at TSMC and offers a range of new features. DisplayPort 1.4 (ready), HDMI 2.0b, HDR, Simultaneous Multi-Projection (SMP), improved H.265 video en- and decoders (for PlayReady 3.0) are only some of the improvements. See our detailed Pascal architecture article for more details.
The power consumption of the Max-Q design is notably lower than the normal GTX 1080 for laptops and ranges between 90 and 110 Watt (TGP) according to Nvidia.
NVIDIA GeForce GTX 1070 Max-Q ► remove from comparison
The Nvidia GeForce GTX 1070 with the Max-Q design is a mobile high-end GPU from the Pascal series. It is designed for thin and light laptops and about 10-15% slower than a regular GTX 1070 for laptops based on the cooling capabilities. The base frequency (1101-1215 MHz) is also much lower than on the regular GTX 1070 (1433 MHz, at least -10%) and the Boost (1265-1379 MHz) is also much lower compared to 1645 MHz (at least -6%) for the regular GTX 1070. The memory clock, however, is identical.
The clock is not the only difference compared to the regular GTX 1070 though. The drivers for the Max-Q version were optimized for efficiency (and not performance; only for Max-Q models), there are optimized voltage converters for 1V operation, high-end cooling methods, and a 40 dB limit for the fan noise (with clock adjustments to ensure this at all times).
Features
The GP104 chip is manufactured in 16nm FinFET process at TSMC and offers a range of new features. DisplayPort 1.4 (ready), HDMI 2.0b, HDR, Simultaneous Multi-Projection (SMP), improved H.265 video en- and decoders (for PlayReady 3.0) are only some of the improvements. See our detailed Pascal architecture article for more details.
The power consumption of the Max-Q design is notably lower than the normal GTX 1070 for laptops and ranges between 80 and 90 Watt (TGP) according to Nvidia.
NVIDIA GeForce GT 1030 (Desktop) NVIDIA GeForce GTX 1080 Max-Q NVIDIA GeForce GTX 1070 Max-Q GeForce GTX 1000 Series Codename N17P-G1 N17E-G3 Max-Q N17E-G2 Max-Q Architecture Pascal Pascal Pascal Pipelines 384 - unified 2560 - unified 2048 - unified Core Speed 1228 - 1670 (Boost) MHz 1101 - 1290 - 1278 - 1468 (Boost) MHz 1101 - 1215 - 1265 - 1379 (Boost) MHz Memory Speed 6000 MHz 10000 MHz 8000 MHz Memory Bus Width 64 Bit 256 Bit 256 Bit Memory Type GDDR5 GDDR5X GDDR5 Max. Amount of Memory 2048 MB 8 GB 8 GB Shared Memory no no no API DirectX 12_1, OpenGL 4.5 DirectX 12_1, OpenGL 4.5 DirectX 12_1, OpenGL 4.5 Power Consumption 30 Watt 90 - 110 Watt technology 14 nm 16 nm 16 nm Features Multi-Projection, VR Ready, G-SYNC, Vulkan, Multi Monitor Multi-Projection, VR Ready, G-SYNC, Vulkan, Multi Monitor Multi-Projection, VR Ready, G-SYNC, Vulkan, Multi Monitor Date of Announcement 16.05.2017 30.05.2017 30.05.2017 Link to Manufacturer Page www.geforce.com Transistors 7.2 Billion 7.2 Billion Notebook Size large large
Benchmarks Performance Rating - 3DMark 11 + Fire Strike + Time Spy - GeForce GT 1030 (Desktop)
1.7 pt (5%)
...
NVIDIA GeForce GT 1030 (Desktop)
...
Performance Rating - 3DMark 11 + Fire Strike + Time Spy - GeForce GTX 1080 Max-Q
8.3 pt (25%)
...
NVIDIA GeForce GTX 1080 Max-Q
...
Performance Rating - 3DMark 11 + Fire Strike + Time Spy - GeForce GTX 1070 Max-Q
6.7 pt (20%)
...
NVIDIA GeForce GTX 1070 Max-Q
...
3DMark - 3DMark Time Spy Score
min: 1250 avg: 1253 median: 1252.5 (4%) max: 1255 Points
min: 5390 avg: 5592 median: 5591.5 (16%) max: 5793 Points
min: 4396 avg: 4641 median: 4616 (13%) max: 4856 Points
3DMark - 3DMark Time Spy Graphics
min: 1088 avg: 1091 median: 1090.5 (3%) max: 1093 Points
min: 5636 avg: 5869 median: 5868.5 (16%) max: 6101 Points
min: 4548 avg: 4687 median: 4708 (12%) max: 4795 Points
3DMark - 3DMark Ice Storm Unlimited Graphics
min: 185323 avg: 214995 median: 219163 (25%) max: 236330 Points
387951 Points (44%)
min: 328292 avg: 351332 median: 334256 (38%) max: 398350 Points
3DMark - 3DMark Ice Storm Extreme Graphics
min: 65688 avg: 98449 median: 106982 (14%) max: 114146 Points
252862 Points (32%)
min: 91895 avg: 209959 median: 215087 (28%) max: 312206 Points
3DMark - 3DMark Cloud Gate Score
min: 18137 avg: 19902 median: 19202.5 (21%) max: 23066 Points
min: 27935 avg: 28242 median: 28375 (30%) max: 28416 Points
min: 24117 avg: 29752 median: 28582.5 (31%) max: 35886 Points
3DMark - 3DMark Cloud Gate Graphics
min: 18435 avg: 21193 median: 22069 (6%) max: 22197 Points
min: 104506 avg: 111542 median: 114542 (30%) max: 115579 Points
min: 73739 avg: 97317 median: 99551.5 (26%) max: 107807 Points
3DMark - 3DMark Fire Strike Standard Score
min: 3265 avg: 3367 median: 3381.5 (6%) max: 3440 Points
min: 13822 avg: 14269 median: 14273.5 (25%) max: 14631 Points
min: 11857 avg: 12627 median: 12598.5 (22%) max: 14119 Points
3DMark - 3DMark Fire Strike Standard Graphics
min: 3477 avg: 3614 median: 3624.5 (4%) max: 3731 Points
min: 17151 avg: 18110 median: 18191.5 (21%) max: 18505 Points
min: 14146 avg: 14910 median: 14678.5 (17%) max: 16165 Points
3DMark - 3DMark Ice Storm Graphics
min: 82100 avg: 142787 median: 158343 (19%) max: 172363 Points
min: 251370 avg: 271726 median: 281682 (34%) max: 282127 Points
min: 92053 avg: 245427 median: 241124 (29%) max: 357428 Points
3DMark 11 - 3DM11 Performance Score
min: 5208 avg: 5261 median: 5238 (7%) max: 5360 Points
min: 16333 avg: 16947 median: 16910.5 (23%) max: 17829 Points
min: 13513 avg: 15401 median: 15409 (21%) max: 17408 Points
3DMark 11 - 3DM11 Performance GPU
min: 4669 avg: 4720 median: 4727.5 (4%) max: 4757 Points
min: 21816 avg: 23358 median: 23540 (20%) max: 24425 Points
min: 17680 avg: 19016 median: 18688 (16%) max: 20829 Points
3DMark Vantage + NVIDIA GeForce GT 1030 (Desktop) 3DMark Vantage - 3DM Vant. Perf. total
min: 19650 avg: 20192 median: 20192 (6%) max: 20734 Points
3DM Vant. Perf. total + NVIDIA GeForce GTX 1080 Max-Q
39562 Points (11%)
3DM Vant. Perf. total + NVIDIA GeForce GTX 1070 Max-Q
44090 Points (13%)
3DM Vant. Perf. GPU no PhysX + NVIDIA GeForce GT 1030 (Desktop) 3DMark Vantage - 3DM Vant. Perf. GPU no PhysX
min: 16968 avg: 17074 median: 17073.5 (10%) max: 17179 Points
3DM Vant. Perf. GPU no PhysX + NVIDIA GeForce GTX 1080 Max-Q
46945 Points (27%)
3DM Vant. Perf. GPU no PhysX + NVIDIA GeForce GTX 1070 Max-Q
47227 Points (27%)
3DMark 2001SE - 3DMark 2001 - Standard
69346 Points (72%)
3DMark 03 - 3DMark 03 - Standard
min: 37359 avg: 49978 median: 49978 (26%) max: 62597 Points
3DMark 05 - 3DMark 05 - Standard
min: 19415 avg: 24212 median: 24212 (27%) max: 29009 Points
3DMark 06 3DMark 06 - Standard 1280x1024 + NVIDIA GeForce GT 1030 (Desktop)
min: 21453 avg: 24101 median: 24100.5 (32%) max: 26748 Points
3DMark 06 - Standard 1280x1024 + NVIDIA GeForce GTX 1080 Max-Q
31555 Points (42%)
3DMark 06 - Standard 1280x1024 + NVIDIA GeForce GTX 1070 Max-Q
min: 26805 avg: 30843 median: 30648.5 (40%) max: 35269 Points
Unigine Valley 1.0 - Unigine Valley 1.0 DX
17.4 fps (6%)
84.8 fps (28%)
Unigine Heaven 3.0 - Unigine Heaven 3.0 DX 11
197 fps (65%)
SPECviewperf 11 + NVIDIA GeForce GTX 1070 Max-Q SPECviewperf 11 - specvp11 snx-01
11.8 fps (7%)
specvp11 tcvis-02 + NVIDIA GeForce GTX 1070 Max-Q SPECviewperf 11 - specvp11 tcvis-02
3.4 fps (2%)
specvp11 sw-02 + NVIDIA GeForce GTX 1070 Max-Q SPECviewperf 11 - specvp11 sw-02
19.9 fps (15%)
specvp11 proe-05 + NVIDIA GeForce GTX 1070 Max-Q SPECviewperf 11 - specvp11 proe-05
2.9 fps (3%)
specvp11 maya-03 + NVIDIA GeForce GTX 1070 Max-Q SPECviewperf 11 - specvp11 maya-03
18.6 fps (14%)
specvp11 lightwave-01 + NVIDIA GeForce GTX 1070 Max-Q SPECviewperf 11 - specvp11 lightwave-01
21 fps (23%)
specvp11 ensight-04 + NVIDIA GeForce GTX 1070 Max-Q SPECviewperf 11 - specvp11 ensight-04
160.3 fps (77%)
specvp11 catia-03 + NVIDIA GeForce GTX 1070 Max-Q SPECviewperf 11 - specvp11 catia-03
20.3 fps (11%)
SPECviewperf 12 + NVIDIA GeForce GT 1030 (Desktop) SPECviewperf 12 - specvp12 sw-03
min: 23.8 avg: 25.2 median: 25.2 (6%) max: 26.51 fps
specvp12 sw-03 + NVIDIA GeForce GTX 1080 Max-Q
49.4 fps (12%)
specvp12 sw-03 + NVIDIA GeForce GTX 1070 Max-Q
min: 44.79 avg: 47.9 median: 47.8 (12%) max: 50.9 fps
specvp12 snx-02 + NVIDIA GeForce GT 1030 (Desktop) SPECviewperf 12 - specvp12 snx-02
min: 3.13 avg: 3.4 median: 3.4 (0%) max: 3.57 fps
specvp12 snx-02 + NVIDIA GeForce GTX 1080 Max-Q
7.7 fps (1%)
specvp12 snx-02 + NVIDIA GeForce GTX 1070 Max-Q
min: 6.72 avg: 6.8 median: 6.8 (1%) max: 6.96 fps
specvp12 showcase-01 + NVIDIA GeForce GT 1030 (Desktop) SPECviewperf 12 - specvp12 showcase-01
13.9 fps (3%)
specvp12 showcase-01 + NVIDIA GeForce GTX 1080 Max-Q
97.1 fps (21%)
specvp12 showcase-01 + NVIDIA GeForce GTX 1070 Max-Q
min: 71.6 avg: 75.2 median: 75.2 (16%) max: 78.8 fps
specvp12 mediacal-01 + NVIDIA GeForce GT 1030 (Desktop) SPECviewperf 12 - specvp12 mediacal-01
min: 9.7 avg: 10.1 median: 10.1 (3%) max: 10.48 fps
specvp12 mediacal-01 + NVIDIA GeForce GTX 1080 Max-Q
44.1 fps (11%)
specvp12 mediacal-01 + NVIDIA GeForce GTX 1070 Max-Q
min: 32.67 avg: 34.4 median: 34.4 (9%) max: 36.03 fps
specvp12 maya-04 + NVIDIA GeForce GT 1030 (Desktop) SPECviewperf 12 - specvp12 maya-04
min: 32 avg: 32.9 median: 32.9 (9%) max: 33.86 fps
specvp12 maya-04 + NVIDIA GeForce GTX 1080 Max-Q
122.3 fps (33%)
specvp12 maya-04 + NVIDIA GeForce GTX 1070 Max-Q
min: 83.4 avg: 92.4 median: 92.4 (25%) max: 101.4 fps
specvp12 energy-01 + NVIDIA GeForce GT 1030 (Desktop) SPECviewperf 12 - specvp12 energy-01
min: 0.47 avg: 0.5 median: 0.5 (0%) max: 0.49 fps
specvp12 energy-01 + NVIDIA GeForce GTX 1080 Max-Q
7.9 fps (7%)
specvp12 energy-01 + NVIDIA GeForce GTX 1070 Max-Q
6.9 fps (6%)
specvp12 creo-01 + NVIDIA GeForce GT 1030 (Desktop) SPECviewperf 12 - specvp12 creo-01
min: 10.48 avg: 11.7 median: 11.7 (5%) max: 12.83 fps
specvp12 creo-01 + NVIDIA GeForce GTX 1080 Max-Q
50.5 fps (20%)
specvp12 creo-01 + NVIDIA GeForce GTX 1070 Max-Q
min: 45.05 avg: 45.2 median: 45.2 (18%) max: 45.43 fps
specvp12 catia-04 + NVIDIA GeForce GT 1030 (Desktop) SPECviewperf 12 - specvp12 catia-04
min: 17.9 avg: 18.2 median: 18.2 (3%) max: 18.58 fps
specvp12 catia-04 + NVIDIA GeForce GTX 1080 Max-Q
74 fps (12%)
specvp12 catia-04 + NVIDIA GeForce GTX 1070 Max-Q
min: 62.7 avg: 63.3 median: 63.3 (10%) max: 63.9 fps
specvp12 3dsmax-05 + NVIDIA GeForce GT 1030 (Desktop) SPECviewperf 12 - specvp12 3dsmax-05
26.9 fps (5%)
specvp12 3dsmax-05 + NVIDIA GeForce GTX 1070 Max-Q
97.4 fps (17%)
SPECviewperf 13 specvp13 sw-04 + NVIDIA GeForce GT 1030 (Desktop) SPECviewperf 13 - specvp13 sw-04
39.6 fps (11%)
specvp13 snx-03 + NVIDIA GeForce GT 1030 (Desktop) SPECviewperf 13 - specvp13 snx-03
6.4 fps (1%)
specvp13 showcase-02 + NVIDIA GeForce GT 1030 (Desktop) SPECviewperf 13 - specvp13 showcase-02
13.8 fps (3%)
specvp13 medical-02 + NVIDIA GeForce GT 1030 (Desktop) SPECviewperf 13 - specvp13 medical-02
10.8 fps (2%)
specvp13 maya-05 + NVIDIA GeForce GT 1030 (Desktop) SPECviewperf 13 - specvp13 maya-05
51.1 fps (6%)
specvp13 energy-02 + NVIDIA GeForce GT 1030 (Desktop) SPECviewperf 13 - specvp13 energy-02
0.5 fps (0%)
specvp13 creo-02 + NVIDIA GeForce GT 1030 (Desktop) SPECviewperf 13 - specvp13 creo-02
26.3 fps (4%)
specvp13 catia-05 + NVIDIA GeForce GT 1030 (Desktop) SPECviewperf 13 - specvp13 catia-05
25.6 fps (3%)
specvp13 3dsmax-06 + NVIDIA GeForce GT 1030 (Desktop) SPECviewperf 13 - specvp13 3dsmax-06
26.4 fps (5%)
SPECviewperf 2020 specvp2020 solidworks-05 4k + NVIDIA GeForce GT 1030 (Desktop) SPECviewperf 2020 - specvp2020 solidworks-05 4k
1 fps (0%)
specvp2020 snx-04 4k + NVIDIA GeForce GT 1030 (Desktop) SPECviewperf 2020 - specvp2020 snx-04 4k
4 fps (0%)
specvp2020 medical-03 4k + NVIDIA GeForce GT 1030 (Desktop) SPECviewperf 2020 - specvp2020 medical-03 4k
1.6 fps (2%)
specvp2020 maya-06 4k + NVIDIA GeForce GT 1030 (Desktop) SPECviewperf 2020 - specvp2020 maya-06 4k
22.4 fps (4%)
specvp2020 energy-03 4k + NVIDIA GeForce GT 1030 (Desktop) SPECviewperf 2020 - specvp2020 energy-03 4k
0.4 fps (0%)
specvp2020 creo-03 4k + NVIDIA GeForce GT 1030 (Desktop) SPECviewperf 2020 - specvp2020 creo-03 4k
9.7 fps (5%)
specvp2020 catia-06 4k + NVIDIA GeForce GT 1030 (Desktop) SPECviewperf 2020 - specvp2020 catia-06 4k
2.1 fps (1%)
specvp2020 3dsmax-07 4k + NVIDIA GeForce GT 1030 (Desktop) SPECviewperf 2020 - specvp2020 3dsmax-07 4k
3.2 fps (1%)
Cinebench R10 Cinebench R10 Shading (32bit) + NVIDIA GeForce GTX 1080 Max-Q Cinebench R10 - Cinebench R10 Shading (32bit)
min: 6814 avg: 9138 median: 9138 (6%) max: 11462 Points
Cinebench R10 Shading (32bit) + NVIDIA GeForce GTX 1070 Max-Q
min: 6820 avg: 9726 median: 10777 (8%) max: 11810 Points
Cinebench R11.5 Cinebench R11.5 OpenGL 64 Bit + NVIDIA GeForce GTX 1080 Max-Q Cinebench R11.5 - Cinebench R11.5 OpenGL 64 Bit
min: 67.7 avg: 71.9 median: 71.9 (25%) max: 76.1 fps
Cinebench R11.5 OpenGL 64 Bit + NVIDIA GeForce GTX 1070 Max-Q
min: 62.7 avg: 68.5 median: 67.2 (23%) max: 76.3 fps
Cinebench R15 + NVIDIA GeForce GTX 1080 Max-Q Cinebench R15 - Cinebench R15 OpenGL 64 Bit
min: 101 avg: 111.2 median: 111.2 (6%) max: 121.3 fps
Cinebench R15 OpenGL 64 Bit + NVIDIA GeForce GTX 1070 Max-Q
min: 95.9 avg: 104.6 median: 102.1 (6%) max: 118.5 fps
Cinebench R15 OpenGL Ref. Match 64 Bit + NVIDIA GeForce GTX 1080 Max-Q Cinebench R15 - Cinebench R15 OpenGL Ref. Match 64 Bit
99.6 % (100%)
Cinebench R15 OpenGL Ref. Match 64 Bit + NVIDIA GeForce GTX 1070 Max-Q
99.6 % (100%)
GFXBench - GFXBench Car Chase Offscreen
294 fps (33%)
GFXBench 3.1 - GFXBench Manhattan ES 3.1 Offscreen
414 fps (9%)
GFXBench 3.0 - GFXBench 3.0 Manhattan Offscreen
min: 427 avg: 432.5 median: 432.5 (25%) max: 438 fps
459 fps (27%)
GFXBench (DX / GLBenchmark) 2.7 + NVIDIA GeForce GTX 1080 Max-Q GFXBench (DX / GLBenchmark) 2.7 - GFXBench T-Rex HD Offscreen C24Z16
1365 fps (11%)
LuxMark v2.0 64Bit - LuxMark v2.0 Room GPU
min: 528 avg: 532 median: 531.5 (2%) max: 535 Samples/s
2094 Samples/s (9%)
min: 2460 avg: 2523 median: 2523 (11%) max: 2586 Samples/s
LuxMark v2.0 64Bit - LuxMark v2.0 Sala GPU
min: 924 avg: 930 median: 929.5 (2%) max: 935 Samples/s
4618 Samples/s (8%)
min: 4877 avg: 4938 median: 4937.5 (9%) max: 4998 Samples/s
ComputeMark v2.1 - ComputeMark v2.1 Result
min: 2898 avg: 2926 median: 2925.5 (3%) max: 2953 Points
min: 13701 avg: 13756 median: 13756 (15%) max: 13811 Points
min: 10798 avg: 10998 median: 10917 (12%) max: 11390 Points
PassMark PerformanceTest 9 - PerformanceTest 9.0 3D Graphics Mark
10968 Points (39%)
Power Consumption - Furmark Stress Test Power Consumption - external Monitor *
150.5 Watt (21%)
Power Consumption - The Witcher 3 Power Consumption - external Monitor *
140 Watt (20%)
Power Consumption - Witcher 3 Power Consumption *
min: 148 avg: 155.7 median: 159 (35%) max: 160 Watt
min: 120 avg: 136.2 median: 134.2 (29%) max: 154 Watt
Power Consumption - Witcher 3 ultra Power Efficiency
min: 0.3931 avg: 0.4 median: 0.4 (40%) max: 0.4182 fps per Watt
min: 0.3221 avg: 0.4 median: 0.4 (38%) max: 0.4389 fps per Watt
Emissions Witcher 3 Fan Noise + NVIDIA GeForce GTX 1080 Max-Q Emissions - Witcher 3 Fan Noise
min: 42 avg: 44.3 median: 43 (69%) max: 48 dB(A)
Witcher 3 Fan Noise + NVIDIA GeForce GTX 1070 Max-Q
min: 41.7 avg: 46.1 median: 45 (72%) max: 55 dB(A)
Clock Speed - GPU Clock Witcher 3 ultra
min: 1430 avg: 1473 median: 1470 (58%) max: 1520 MHz
min: 1228 avg: 1344 median: 1342 (53%) max: 1480 MHz
Average Benchmarks NVIDIA GeForce GT 1030 (Desktop) → 100% n=25 Average Benchmarks NVIDIA GeForce GTX 1080 Max-Q → 415% n=25 Average Benchmarks NVIDIA GeForce GTX 1070 Max-Q → 364% n=25
- Range of benchmark values for this graphics card
- Average benchmark values for this graphics card
* Smaller numbers mean a higher performance
1 This benchmark is not used for the average calculation
Game Benchmarks The following benchmarks stem from our benchmarks of review laptops. The performance depends on the used graphics memory, clock rate, processor, system settings, drivers, and operating systems. So the results don't have to be representative for all laptops with this GPU. For detailed information on the benchmark results, click on the fps number.
100%
GeForce GT 1030 (Desktop):
18.4 [X] Zotac GeForce GT 1030 AMD Ryzen 9 7950X 4.5GHz
GeForce GT 1030 (Desktop)
fps
100%
GeForce GT 1030 (Desktop):
8 [X] Zotac GeForce GT 1030 AMD Ryzen 9 7950X 4.5GHz
GeForce GT 1030 (Desktop)
fps
100%
GeForce GT 1030 (Desktop):
4.3 [X] Zotac GeForce GT 1030 AMD Ryzen 9 7950X 4.5GHz
GeForce GT 1030 (Desktop)
fps
100%
GeForce GT 1030 (Desktop):
13.3 [X] Zotac GeForce GT 1030 AMD Ryzen 9 7950X 4.5GHz
GeForce GT 1030 (Desktop)
min:
10.9 fps, P0.1:
11 fps, P1:
11.3 fps, max:
16.6 fps
fps
100%
GeForce GT 1030 (Desktop):
14.4 [X] Zotac GeForce GT 1030 AMD Ryzen 9 7950X 4.5GHz
GeForce GT 1030 (Desktop)
min:
9.31 fps, P0.1:
9.44 fps, P1:
10.7 fps, max:
29.9 fps
fps
100%
GeForce GT 1030 (Desktop):
12 [X] Zotac GeForce GT 1030 AMD Ryzen 9 7950X 4.5GHz
GeForce GT 1030 (Desktop)
min:
7.74 fps, P0.1:
7.86 fps, P1:
8.86 fps, max:
25.9 fps
fps
100%
GeForce GT 1030 (Desktop):
10.8 [X] Zotac GeForce GT 1030 AMD Ryzen 9 7950X 4.5GHz
GeForce GT 1030 (Desktop)
min:
6.68 fps, P0.1:
6.79 fps, P1:
7.72 fps, max:
21.5 fps
fps
100%
GeForce GT 1030 (Desktop):
8.2 [X] Zotac GeForce GT 1030 AMD Ryzen 9 7950X 4.5GHz
GeForce GT 1030 (Desktop)
min:
6.54 fps, P0.1:
6.59 fps, P1:
6.78 fps, max:
14.9 fps
fps
100%
GeForce GT 1030 (Desktop):
20 [X] Zotac GeForce GT 1030 AMD Ryzen 9 7950X 4.5GHz
GeForce GT 1030 (Desktop)
fps
100%
GeForce GT 1030 (Desktop):
14 [X] Zotac GeForce GT 1030 AMD Ryzen 9 7950X 4.5GHz
GeForce GT 1030 (Desktop)
fps
100%
GeForce GT 1030 (Desktop):
11 [X] Zotac GeForce GT 1030 AMD Ryzen 9 7950X 4.5GHz
GeForce GT 1030 (Desktop)
fps
100%
GeForce GT 1030 (Desktop):
14.7 [X] Zotac GeForce GT 1030 AMD Ryzen 9 7950X 4.5GHz
GeForce GT 1030 (Desktop)
min:
9.04 fps, P0.1:
9.12 fps, P1:
10.3 fps, max:
19.5 fps
fps
100%
GeForce GT 1030 (Desktop):
9.8 [X] Zotac GeForce GT 1030 AMD Ryzen 9 7950X 4.5GHz
GeForce GT 1030 (Desktop)
min:
6.68 fps, P0.1:
6.73 fps, P1:
7.2 fps, max:
12.7 fps
fps
100%
GeForce GT 1030 (Desktop):
4.5 [X] Zotac GeForce GT 1030 AMD Ryzen 9 7950X 4.5GHz
GeForce GT 1030 (Desktop)
min:
3.56 fps, P0.1:
3.58 fps, P1:
3.8 fps, max:
5.42 fps
fps
100%
GeForce GT 1030 (Desktop):
15.4 [X] Zotac GeForce GT 1030 AMD Ryzen 9 7950X 4.5GHz
GeForce GT 1030 (Desktop)
min:
11.8 fps, P0.1:
11.9 fps, P1:
13.4 fps, max:
16.9 fps
fps
100%
GeForce GT 1030 (Desktop):
50 [X] Zotac GeForce GT 1030 AMD Ryzen 9 5900X 3.7GHz
GeForce GT 1030 (Desktop)
min:
39.1 fps, P0.1:
40.4 fps, P1:
41.5 fps, max:
72.1 fps
fps
100%
GeForce GT 1030 (Desktop):
26 [X] Zotac GeForce GT 1030 AMD Ryzen 9 5900X 3.7GHz
GeForce GT 1030 (Desktop)
min:
2.9 fps, P0.1:
7.65 fps, P1:
19.2 fps, max:
329 fps
fps
100%
GeForce GT 1030 (Desktop):
29.4 [X] Zotac GeForce GT 1030 AMD Ryzen 9 5900X 3.7GHz
GeForce GT 1030 (Desktop)
min:
18.9 fps, P0.1:
23.3 fps, P1:
24.3 fps, max:
106.2 fps
fps
100%
GeForce GT 1030 (Desktop):
11.2 [X] Zotac GeForce GT 1030 AMD Ryzen 9 5900X 3.7GHz
GeForce GT 1030 (Desktop)
min:
4.76 fps, P0.1:
4.87 fps, P1:
5.4 fps, max:
201 fps
fps
100%
GeForce GT 1030 (Desktop):
14 [X] Zotac GeForce GT 1030 AMD Ryzen 9 5900X 3.7GHz
GeForce GT 1030 (Desktop)
min:
6.15 fps, P0.1:
6.19 fps, P1:
6.68 fps, max:
191.7 fps
fps
100%
GeForce GT 1030 (Desktop):
15 [X] Zotac GeForce GT 1030 AMD Ryzen 9 5900X 3.7GHz
GeForce GT 1030 (Desktop)
min:
6.47 fps, P0.1:
6.55 fps, P1:
7.13 fps, max:
198 fps
fps
100%
GeForce GT 1030 (Desktop):
13.6 [X] Zotac GeForce GT 1030 AMD Ryzen 9 5900X 3.7GHz
GeForce GT 1030 (Desktop)
min:
6 fps, P0.1:
6.15 fps, P1:
6.66 fps, max:
188.1 fps
fps
100%
GeForce GT 1030 (Desktop):
18.2 [X] Zotac GeForce GT 1030 AMD Ryzen 9 5900X 3.7GHz
GeForce GT 1030 (Desktop)
fps
100%
GeForce GT 1030 (Desktop):
12.6 [X] Zotac GeForce GT 1030 AMD Ryzen 9 5900X 3.7GHz
GeForce GT 1030 (Desktop)
fps
100%
GeForce GT 1030 (Desktop):
7.9 [X] Zotac GeForce GT 1030 AMD Ryzen 9 5900X 3.7GHz
GeForce GT 1030 (Desktop)
fps
100%
GeForce GT 1030 (Desktop):
6.1 [X] Zotac GeForce GT 1030 AMD Ryzen 9 5900X 3.7GHz
GeForce GT 1030 (Desktop)
fps
100%
GeForce GT 1030 (Desktop):
14.7 [X] Zotac GeForce GT 1030 AMD Ryzen 9 5900X 3.7GHz
GeForce GT 1030 (Desktop)
fps
100%
GeForce GT 1030 (Desktop):
11.4 [X] Zotac GeForce GT 1030 AMD Ryzen 9 5900X 3.7GHz
GeForce GT 1030 (Desktop)
fps
100%
GeForce GT 1030 (Desktop):
7.3 [X] Zotac GeForce GT 1030 AMD Ryzen 9 5900X 3.7GHz
GeForce GT 1030 (Desktop)
fps
100%
GeForce GT 1030 (Desktop):
5.2 [X] Zotac GeForce GT 1030 AMD Ryzen 9 5900X 3.7GHz
GeForce GT 1030 (Desktop)
min:
2.88 fps, P0.1:
2.94 fps, P1:
3.43 fps, max:
7.61 fps
fps
100%
GeForce GT 1030 (Desktop):
46.9 [X] Zotac GeForce GT 1030 AMD Ryzen 9 5900X 3.7GHz
GeForce GT 1030 (Desktop)
fps
100%
GeForce GT 1030 (Desktop):
31.6 [X] Zotac GeForce GT 1030 AMD Ryzen 9 5900X 3.7GHz
GeForce GT 1030 (Desktop)
fps
100%
GeForce GT 1030 (Desktop):
18.3 [X] Zotac GeForce GT 1030 AMD Ryzen 9 5900X 3.7GHz
GeForce GT 1030 (Desktop)
fps
100%
GeForce GT 1030 (Desktop):
13.8 [X] Zotac GeForce GT 1030 AMD Ryzen 9 5900X 3.7GHz
GeForce GT 1030 (Desktop)
fps
GeForce GT 1030 (Desktop):
0 (!) [X] Zotac GeForce GT 1030 AMD Ryzen 9 5900X 3.7GHz
GeForce GT 1030 (Desktop)
fps
100%
GeForce GT 1030 (Desktop):
21 [X] Zotac GeForce GT 1030 AMD Ryzen 9 5900X 3.7GHz
GeForce GT 1030 (Desktop)
min:
14.9 fps, P0.1:
15.2 fps, P1:
18.9 fps, max:
24.4 fps
fps
100%
GeForce GT 1030 (Desktop):
8.2 [X] Zotac GeForce GT 1030 AMD Ryzen 9 5900X 3.7GHz
GeForce GT 1030 (Desktop)
min:
6.38 fps, P0.1:
6.43 fps, P1:
6.85 fps, max:
9.75 fps
fps
100%
GeForce GT 1030 (Desktop):
7 [X] Zotac GeForce GT 1030 AMD Ryzen 9 5900X 3.7GHz
GeForce GT 1030 (Desktop)
min:
5.8 fps, P0.1:
5.81 fps, P1:
6.11 fps, max:
8.14 fps
fps
100%
GeForce GT 1030 (Desktop):
19 [X] Zotac GeForce GT 1030 AMD Ryzen 9 5900X 3.7GHz
GeForce GT 1030 (Desktop)
fps
100%
GeForce GT 1030 (Desktop):
15 [X] Zotac GeForce GT 1030 AMD Ryzen 9 5900X 3.7GHz
GeForce GT 1030 (Desktop)
fps
100%
GeForce GT 1030 (Desktop):
15 [X] Zotac GeForce GT 1030 AMD Ryzen 9 5900X 3.7GHz
GeForce GT 1030 (Desktop)
fps
100%
GeForce GT 1030 (Desktop):
8 [X] Zotac GeForce GT 1030 AMD Ryzen 9 5900X 3.7GHz
GeForce GT 1030 (Desktop)
fps
100%
GeForce GT 1030 (Desktop):
15.7 [X] Zotac GeForce GT 1030 AMD Ryzen 9 5900X 3.7GHz
GeForce GT 1030 (Desktop)
min:
7.23 fps, P0.1:
7.8 fps, P1:
9.59 fps, max:
32.1 fps
fps
100%
GeForce GT 1030 (Desktop):
11.3 [X] Zotac GeForce GT 1030 AMD Ryzen 9 5900X 3.7GHz
GeForce GT 1030 (Desktop)
min:
5.97 fps, P0.1:
6.06 fps, P1:
6.85 fps, max:
14.8 fps
fps
542%
GeForce GTX 1080 Max-Q:
61.3 [X] Asus Zephyrus GX501 Intel Core i7-7700HQ 2.8GHz
GeForce GTX 1080 Max-Q
min:
33 fps, P0.1:
34.9 fps, P1:
39.3 fps, max:
156 fps
fps
100%
GeForce GT 1030 (Desktop):
6.1 [X] Zotac GeForce GT 1030 AMD Ryzen 9 5900X 3.7GHz
GeForce GT 1030 (Desktop)
min:
3.77 fps, P0.1:
3.78 fps, P1:
4.05 fps, max:
8.9 fps
fps
869%
GeForce GTX 1080 Max-Q:
53 [X] Asus Zephyrus GX501 Intel Core i7-7700HQ 2.8GHz
GeForce GTX 1080 Max-Q
min:
24.5 fps, P0.1:
31.6 fps, P1:
38.5 fps, max:
191 fps
fps
GeForce GTX 1080 Max-Q:
37.1 [X] Asus Zephyrus GX501 Intel Core i7-7700HQ 2.8GHz
GeForce GTX 1080 Max-Q
min:
12.6 fps, P0.1:
17.5 fps, P1:
24.2 fps, max:
82.5 fps
fps
100%
GeForce GT 1030 (Desktop):
27.1 [X] Zotac GeForce GT 1030 AMD Ryzen 9 5900X 3.7GHz
GeForce GT 1030 (Desktop)
min:
12.1 fps, P0.1:
15.2 fps, P1:
18.2 fps, max:
47.8 fps
fps
100%
GeForce GT 1030 (Desktop):
18.8 [X] Zotac GeForce GT 1030 AMD Ryzen 9 5900X 3.7GHz
GeForce GT 1030 (Desktop)
min:
11 fps, P0.1:
11 fps, P1:
12.4 fps, max:
28.1 fps
fps
100%
GeForce GT 1030 (Desktop):
16.6 [X] Zotac GeForce GT 1030 AMD Ryzen 9 5900X 3.7GHz
GeForce GT 1030 (Desktop)
min:
8.42 fps, P0.1:
8.49 fps, P1:
8.95 fps, max:
23 fps
fps
100%
GeForce GT 1030 (Desktop):
35.5 [X] Zotac GeForce GT 1030 AMD Ryzen 9 5900X 3.7GHz
GeForce GT 1030 (Desktop)
min:
11.7 fps, P0.1:
13.6 fps, P1:
16.9 fps, max:
214 fps
fps
100%
GeForce GT 1030 (Desktop):
25.7 [X] Zotac GeForce GT 1030 AMD Ryzen 9 5900X 3.7GHz
GeForce GT 1030 (Desktop)
min:
7.75 fps, P0.1:
10.3 fps, P1:
15.4 fps, max:
145 fps
fps
100%
GeForce GT 1030 (Desktop):
11.4 [X] Zotac GeForce GT 1030 AMD Ryzen 9 5900X 3.7GHz
GeForce GT 1030 (Desktop)
min:
6.35 fps, P0.1:
6.41 fps, P1:
7.01 fps, max:
73.9 fps
fps
100%
GeForce GT 1030 (Desktop):
33.1 [X] Zotac GeForce GT 1030 AMD Ryzen 9 5900X 3.7GHz
GeForce GT 1030 (Desktop)
min:
11.2 fps, P0.1:
11.9 fps, P1:
15.8 fps, max:
140 fps
fps
100%
GeForce GT 1030 (Desktop):
14.9 [X] Zotac GeForce GT 1030 AMD Ryzen 9 5900X 3.7GHz
GeForce GT 1030 (Desktop)
min:
7.48 fps, P0.1:
8.04 fps, P1:
9.28 fps, max:
25.4 fps
fps
100%
GeForce GT 1030 (Desktop):
5.5 [X] Zotac GeForce GT 1030 AMD Ryzen 9 5900X 3.7GHz
GeForce GT 1030 (Desktop)
min:
4.39 fps, P0.1:
4.41 fps, P1:
4.62 fps, max:
6.57 fps
fps
100%
GeForce GT 1030 (Desktop):
42 [X] Zotac GeForce GT 1030 AMD Ryzen 9 5900X 3.7GHz
GeForce GT 1030 (Desktop)
42 [X] Zotac GeForce GT 1030 AMD Ryzen 9 5900X 3.7GHz
GeForce GT 1030 (Desktop)
~ 42 fps
100%
GeForce GT 1030 (Desktop):
17 [X] Zotac GeForce GT 1030 AMD Ryzen 9 5900X 3.7GHz
GeForce GT 1030 (Desktop)
fps
100%
GeForce GT 1030 (Desktop):
13 [X] Zotac GeForce GT 1030 AMD Ryzen 9 5900X 3.7GHz
GeForce GT 1030 (Desktop)
fps
100%
GeForce GT 1030 (Desktop):
6 [X] Zotac GeForce GT 1030 AMD Ryzen 9 5900X 3.7GHz
GeForce GT 1030 (Desktop)
fps
100%
GeForce GT 1030 (Desktop):
27.3 [X] Zotac GeForce GT 1030 AMD Ryzen 9 5900X 3.7GHz
GeForce GT 1030 (Desktop)
min:
23.2 fps, P0.1:
23.4 fps, P1:
23.6 fps, max:
42.2 fps
fps
100%
GeForce GT 1030 (Desktop):
17.8 [X] Zotac GeForce GT 1030 AMD Ryzen 9 5900X 3.7GHz
GeForce GT 1030 (Desktop)
min:
15 fps, P0.1:
15 fps, P1:
15.3 fps, max:
26.8 fps
fps
100%
GeForce GT 1030 (Desktop):
14 [X] Zotac GeForce GT 1030 AMD Ryzen 9 5900X 3.7GHz
GeForce GT 1030 (Desktop)
min:
9.58 fps, P0.1:
9.87 fps, P1:
10.4 fps, max:
24.9 fps
fps
100%
GeForce GT 1030 (Desktop):
35 [X] Zotac GeForce GT 1030 AMD Ryzen 9 5900X 3.7GHz
GeForce GT 1030 (Desktop)
fps
100%
GeForce GT 1030 (Desktop):
17 [X] Zotac GeForce GT 1030 AMD Ryzen 9 5900X 3.7GHz
GeForce GT 1030 (Desktop)
fps
100%
GeForce GT 1030 (Desktop):
12 [X] Zotac GeForce GT 1030 AMD Ryzen 9 5900X 3.7GHz
GeForce GT 1030 (Desktop)
fps
100%
GeForce GT 1030 (Desktop):
11 [X] Zotac GeForce GT 1030 AMD Ryzen 9 5900X 3.7GHz
GeForce GT 1030 (Desktop)
fps
GeForce GT 1030 (Desktop):
0 (!) [X] Zotac GeForce GT 1030 AMD Ryzen 9 5900X 3.7GHz
GeForce GT 1030 (Desktop)
fps
100%
GeForce GT 1030 (Desktop):
73.4 [X] Zotac GeForce GT 1030 AMD Ryzen 9 5900X 3.7GHz
GeForce GT 1030 (Desktop)
min:
20.2 fps, P0.1:
20.9 fps, P1:
28 fps, max:
446 fps
fps
100%
GeForce GT 1030 (Desktop):
29.9 [X] Zotac GeForce GT 1030 AMD Ryzen 9 5900X 3.7GHz
GeForce GT 1030 (Desktop)
min:
12.2 fps, P0.1:
12.7 fps, P1:
13.4 fps, max:
367 fps
fps
100%
GeForce GT 1030 (Desktop):
24.6 [X] Zotac GeForce GT 1030 AMD Ryzen 9 5900X 3.7GHz
GeForce GT 1030 (Desktop)
min:
8.51 fps, P0.1:
8.79 fps, P1:
10.2 fps, max:
338 fps
fps
100%
GeForce GT 1030 (Desktop):
23.1 [X] Zotac GeForce GT 1030 AMD Ryzen 9 5900X 3.7GHz
GeForce GT 1030 (Desktop)
min:
8.04 fps, P0.1:
8.84 fps, P1:
9.95 fps, max:
320 fps
fps
100%
GeForce GT 1030 (Desktop):
28 [X] Zotac GeForce GT 1030 AMD Ryzen 9 5900X 3.7GHz
GeForce GT 1030 (Desktop)
min:
17 fps, max:
36 fps
fps
100%
GeForce GT 1030 (Desktop):
15 [X] Zotac GeForce GT 1030 AMD Ryzen 9 5900X 3.7GHz
GeForce GT 1030 (Desktop)
min:
10 fps, max:
36 fps
fps
100%
GeForce GT 1030 (Desktop):
12 [X] Zotac GeForce GT 1030 AMD Ryzen 9 5900X 3.7GHz
GeForce GT 1030 (Desktop)
min:
8 fps, max:
28 fps
fps
100%
GeForce GT 1030 (Desktop):
9 [X] Zotac GeForce GT 1030 AMD Ryzen 9 5900X 3.7GHz
GeForce GT 1030 (Desktop)
min:
7 fps, max:
27 fps
fps
100%
GeForce GT 1030 (Desktop):
13.5 [X] Zotac GeForce GT 1030 AMD Ryzen 9 5900X 3.7GHz
GeForce GT 1030 (Desktop)
min:
9.8 fps, P0.1:
9.8 fps, P1:
10.6 fps, max:
15.7 fps
fps
100%
GeForce GT 1030 (Desktop):
11.8 [X] Zotac GeForce GT 1030 AMD Ryzen 9 5900X 3.7GHz
GeForce GT 1030 (Desktop)
min:
8.09 fps, P0.1:
8.11 fps, P1:
8.26 fps, max:
16.3 fps
fps
100%
GeForce GT 1030 (Desktop):
35 [X] Zotac GeForce GT 1030 AMD Ryzen 9 5900X 3.7GHz
GeForce GT 1030 (Desktop)
min:
21.9 fps, P0.1:
26 fps, P1:
27.9 fps, max:
56.7 fps
fps
100%
GeForce GT 1030 (Desktop):
22.2 [X] Zotac GeForce GT 1030 AMD Ryzen 9 5900X 3.7GHz
GeForce GT 1030 (Desktop)
min:
15.5 fps, P0.1:
15.6 fps, P1:
16.2 fps, max:
34.5 fps
fps
100%
GeForce GT 1030 (Desktop):
17.6 [X] Zotac GeForce GT 1030 AMD Ryzen 9 5900X 3.7GHz
GeForce GT 1030 (Desktop)
min:
12.1 fps, P0.1:
12.2 fps, P1:
12.8 fps, max:
29.6 fps
fps
100%
GeForce GT 1030 (Desktop):
9.9 [X] Zotac GeForce GT 1030 AMD Ryzen 9 5900X 3.7GHz
GeForce GT 1030 (Desktop)
min:
6.29 fps, P0.1:
6.42 fps, P1:
6.99 fps, max:
22.2 fps
fps
100%
GeForce GT 1030 (Desktop):
11.9 [X] Zotac GeForce GT 1030 AMD Ryzen 9 5900X 3.7GHz
GeForce GT 1030 (Desktop)
min:
4.75 fps, P0.1:
6.04 fps, P1:
8.56 fps, max:
28.7 fps
fps
100%
GeForce GT 1030 (Desktop):
99.4 [X] Zotac GeForce GT 1030 815237
AMD Ryzen 9 5900X 3.7GHz
GeForce GT 1030 (Desktop)
min:
75 fps, P1:
75 fps, max:
119 fps
fps
100%
GeForce GT 1030 (Desktop):
33.9 [X] Zotac GeForce GT 1030 815237
AMD Ryzen 9 5900X 3.7GHz
GeForce GT 1030 (Desktop)
min:
24 fps, P1:
24 fps, max:
44 fps
fps
100%
GeForce GT 1030 (Desktop):
26.8 [X] Zotac GeForce GT 1030 815237
AMD Ryzen 9 5900X 3.7GHz
GeForce GT 1030 (Desktop)
min:
21 fps, P1:
21 fps, max:
31 fps
fps
100%
GeForce GT 1030 (Desktop):
12.9 [X] Zotac GeForce GT 1030 815237
AMD Ryzen 9 5900X 3.7GHz
GeForce GT 1030 (Desktop)
min:
1 fps, P1:
7 fps, max:
16 fps
fps
100%
GeForce GT 1030 (Desktop):
102 [X] Zotac GeForce GT 1030 AMD Ryzen 9 5900X 3.7GHz
GeForce GT 1030 (Desktop)
min:
37.8 fps, P0.1:
70.6 fps, P1:
80.3 fps, max:
134 fps
fps
100%
GeForce GT 1030 (Desktop):
60 [X] Zotac GeForce GT 1030 AMD Ryzen 9 5900X 3.7GHz
GeForce GT 1030 (Desktop)
min:
43.7 fps, P0.1:
46.9 fps, P1:
49.5 fps, max:
75.4 fps
fps
100%
GeForce GT 1030 (Desktop):
53.4 [X] Zotac GeForce GT 1030 AMD Ryzen 9 5900X 3.7GHz
GeForce GT 1030 (Desktop)
min:
36.3 fps, P0.1:
42.3 fps, P1:
44.4 fps, max:
67.5 fps
fps
100%
GeForce GT 1030 (Desktop):
39.2 [X] Zotac GeForce GT 1030 AMD Ryzen 9 5900X 3.7GHz
GeForce GT 1030 (Desktop)
min:
25.5 fps, P0.1:
26.1 fps, P1:
30 fps, max:
70.7 fps
fps
100%
GeForce GT 1030 (Desktop):
17.9 [X] Zotac GeForce GT 1030 AMD Ryzen 9 5900X 3.7GHz
GeForce GT 1030 (Desktop)
min:
12.6 fps, P0.1:
13.1 fps, P1:
13.9 fps, max:
23.3 fps
fps
100%
GeForce GT 1030 (Desktop):
16 [X] Zotac GeForce GT 1030 AMD Ryzen 9 5900X 3.7GHz
GeForce GT 1030 (Desktop)
min:
9.57 fps, P0.1:
10.8 fps, P1:
13 fps, max:
26.4 fps
fps
454%
GeForce GTX 1080 Max-Q:
72.7 [X] Asus Zephyrus GX501 Intel Core i7-7700HQ 2.8GHz
GeForce GTX 1080 Max-Q
min:
12.7 fps, P0.1:
21.2 fps, P1:
33.8 fps, max:
165 fps
fps
100%
GeForce GT 1030 (Desktop):
11.2 [X] Zotac GeForce GT 1030 AMD Ryzen 9 5900X 3.7GHz
GeForce GT 1030 (Desktop)
min:
7.33 fps, P0.1:
7.46 fps, P1:
9.14 fps, max:
20.8 fps
fps
469%
GeForce GTX 1080 Max-Q:
52.5 [X] Asus Zephyrus GX501 Intel Core i7-7700HQ 2.8GHz
GeForce GTX 1080 Max-Q
min:
6.28 fps, P0.1:
17.1 fps, P1:
24.3 fps, max:
110 fps
fps
100%
GeForce GT 1030 (Desktop):
79.6 [X] Zotac GeForce GT 1030 AMD Ryzen 9 5900X 3.7GHz
GeForce GT 1030 (Desktop)
min:
26.6 fps, P0.1:
30 fps, P1:
55.9 fps, max:
170 fps
fps
100%
GeForce GT 1030 (Desktop):
36.5 [X] Zotac GeForce GT 1030 AMD Ryzen 9 5900X 3.7GHz
GeForce GT 1030 (Desktop)
min:
14.4 fps, P0.1:
17.7 fps, P1:
21.3 fps, max:
49.9 fps
fps
100%
GeForce GT 1030 (Desktop):
27.9 [X] Zotac GeForce GT 1030 AMD Ryzen 9 5900X 3.7GHz
GeForce GT 1030 (Desktop)
min:
21.3 fps, P0.1:
22 fps, P1:
22.3 fps, max:
35.8 fps
fps
100%
GeForce GT 1030 (Desktop):
11.3 [X] Zotac GeForce GT 1030 AMD Ryzen 9 5900X 3.7GHz
GeForce GT 1030 (Desktop)
min:
8.26 fps, P0.1:
8.78 fps, P1:
9.24 fps, max:
14.3 fps
fps
100%
GeForce GT 1030 (Desktop):
50.3 [X] Zotac GeForce GT 1030 AMD Ryzen 9 5900X 3.7GHz
GeForce GT 1030 (Desktop)
min:
18.3 fps, P0.1:
21.2 fps, P1:
23.2 fps, max:
230 fps
fps
100%
GeForce GT 1030 (Desktop):
27.9 [X] Zotac GeForce GT 1030 AMD Ryzen 9 5900X 3.7GHz
GeForce GT 1030 (Desktop)
min:
10.8 fps, P0.1:
11 fps, P1:
13.5 fps, max:
191 fps
fps
100%
GeForce GT 1030 (Desktop):
17.4 [X] Zotac GeForce GT 1030 AMD Ryzen 9 5900X 3.7GHz
GeForce GT 1030 (Desktop)
min:
5.39 fps, P0.1:
5.52 fps, P1:
6.11 fps, max:
187 fps
fps
100%
GeForce GT 1030 (Desktop):
14.7 [X] Zotac GeForce GT 1030 AMD Ryzen 9 5900X 3.7GHz
GeForce GT 1030 (Desktop)
min:
4.24 fps, P0.1:
4.36 fps, P1:
4.81 fps, max:
194 fps
fps
410%
GeForce GTX 1080 Max-Q:
60.2 [X] Asus Zephyrus GX501 Intel Core i7-7700HQ 2.8GHz
GeForce GTX 1080 Max-Q
min:
7.65 fps, P0.1:
12.9 fps, P1:
29.3 fps, max:
107 fps
fps
100%
GeForce GT 1030 (Desktop):
44 [X] Zotac GeForce GT 1030 AMD Ryzen 9 5900X 3.7GHz
GeForce GT 1030 (Desktop)
fps
100%
GeForce GT 1030 (Desktop):
22 [X] Zotac GeForce GT 1030 AMD Ryzen 9 5900X 3.7GHz
GeForce GT 1030 (Desktop)
fps
100%
GeForce GT 1030 (Desktop):
17 [X] Zotac GeForce GT 1030 AMD Ryzen 9 5900X 3.7GHz
GeForce GT 1030 (Desktop)
fps
100%
GeForce GT 1030 (Desktop):
15 [X] Zotac GeForce GT 1030 AMD Ryzen 9 5900X 3.7GHz
GeForce GT 1030 (Desktop)
fps
100%
GeForce GT 1030 (Desktop):
17.6 [X] Zotac GeForce GT 1030 AMD Ryzen 9 5900X 3.7GHz
GeForce GT 1030 (Desktop)
min:
8.58 fps, P0.1:
9.89 fps, P1:
13.1 fps, max:
33.1 fps
fps
451%
GeForce GTX 1080 Max-Q:
79.3 [X] Asus Zephyrus GX501 Intel Core i7-7700HQ 2.8GHz
GeForce GTX 1080 Max-Q
min:
14.6 fps, P0.1:
45.7 fps, P1:
54.7 fps, max:
131 fps
fps
100%
GeForce GT 1030 (Desktop):
8.3 [X] Zotac GeForce GT 1030 AMD Ryzen 9 5900X 3.7GHz
GeForce GT 1030 (Desktop)
min:
5.94 fps, P0.1:
5.99 fps, P1:
6.88 fps, max:
12.5 fps
fps
680%
GeForce GTX 1080 Max-Q:
56.2 [X] Asus Zephyrus GX501 Intel Core i7-7700HQ 2.8GHz
GeForce GTX 1080 Max-Q
min:
12.5 fps, P0.1:
36.2 fps, P1:
44.2 fps, max:
78.7 fps
fps
100%
GeForce GT 1030 (Desktop):
6.6 [X] Zotac GeForce GT 1030 AMD Ryzen 9 5900X 3.7GHz
GeForce GT 1030 (Desktop)
min:
4.72 fps, P0.1:
4.8 fps, P1:
5.09 fps, max:
9.25 fps
fps
704%
GeForce GTX 1080 Max-Q:
46.1 [X] Asus Zephyrus GX501 Intel Core i7-7700HQ 2.8GHz
GeForce GTX 1080 Max-Q
min:
13.6 fps, P0.1:
29.6 fps, P1:
36.4 fps, max:
65 fps
fps
GeForce GTX 1080 Max-Q:
38 [X] Asus Zephyrus GX501 Intel Core i7-7700HQ 2.8GHz
GeForce GTX 1080 Max-Q
min:
11.8 fps, P0.1:
26.4 fps, P1:
31.4 fps, max:
67.3 fps
fps
GeForce GTX 1080 Max-Q:
23.6 [X] Asus Zephyrus GX501 Intel Core i7-7700HQ 2.8GHz
GeForce GTX 1080 Max-Q
min:
13.4 fps, P0.1:
15.4 fps, P1:
20.5 fps, max:
69.2 fps
fps
100%
GeForce GT 1030 (Desktop):
55 [X] Zotac GeForce GT 1030 AMD Ryzen 9 5900X 3.7GHz
GeForce GT 1030 (Desktop)
min:
24 fps, max:
133 fps
fps
100%
GeForce GT 1030 (Desktop):
23 [X] Zotac GeForce GT 1030 AMD Ryzen 9 5900X 3.7GHz
GeForce GT 1030 (Desktop)
min:
10 fps, max:
91 fps
fps
100%
GeForce GT 1030 (Desktop):
16 [X] Zotac GeForce GT 1030 AMD Ryzen 9 5900X 3.7GHz
GeForce GT 1030 (Desktop)
min:
6 fps, max:
39 fps
fps
GeForce GTX 1080 Max-Q:
58 [X] Asus Zephyrus GX501 Intel Core i7-7700HQ 2.8GHz
GeForce GTX 1080 Max-Q
min:
28 fps, max:
94 fps
fps
GeForce GTX 1080 Max-Q:
48 [X] Asus Zephyrus GX501 Intel Core i7-7700HQ 2.8GHz
GeForce GTX 1080 Max-Q
min:
28 fps, max:
78 fps
fps
100%
GeForce GT 1030 (Desktop):
44.6 [X] Zotac GeForce GT 1030 AMD Ryzen 9 5900X 3.7GHz
GeForce GT 1030 (Desktop)
min:
17.2 fps, P0.1:
24.9 fps, P1:
26.9 fps, max:
105 fps
fps
100%
GeForce GT 1030 (Desktop):
15.9 [X] Zotac GeForce GT 1030 AMD Ryzen 9 5900X 3.7GHz
GeForce GT 1030 (Desktop)
min:
8.42 fps, P0.1:
8.53 fps, P1:
8.83 fps, max:
59.5 fps
fps
100%
GeForce GT 1030 (Desktop):
15.4 [X] Zotac GeForce GT 1030 AMD Ryzen 9 5900X 3.7GHz
GeForce GT 1030 (Desktop)
min:
8.51 fps, P0.1:
8.61 fps, P1:
8.91 fps, max:
50.2 fps
fps
100%
GeForce GT 1030 (Desktop):
32.3 [X] Zotac GeForce GT 1030 AMD Ryzen 9 5900X 3.7GHz
GeForce GT 1030 (Desktop)
min:
23.7 fps, P0.1:
24.3 fps, P1:
25.9 fps, max:
61.4 fps
fps
100%
GeForce GT 1030 (Desktop):
15.3 [X] Zotac GeForce GT 1030 AMD Ryzen 9 5900X 3.7GHz
GeForce GT 1030 (Desktop)
min:
10.9 fps, P0.1:
11.2 fps, P1:
11.6 fps, max:
23.5 fps
fps
100%
GeForce GT 1030 (Desktop):
8.5 [X] Zotac GeForce GT 1030 AMD Ryzen 9 5900X 3.7GHz
GeForce GT 1030 (Desktop)
min:
7.01 fps, P0.1:
7.04 fps, P1:
7.15 fps, max:
13.1 fps
fps
100%
GeForce GT 1030 (Desktop):
17 [X] Zotac GeForce GT 1030 AMD Ryzen 9 5900X 3.7GHz
GeForce GT 1030 (Desktop)
min:
8 fps, max:
32 fps
fps
100%
GeForce GT 1030 (Desktop):
30.6 [X] Zotac GeForce GT 1030 AMD Ryzen 9 5900X 3.7GHz
GeForce GT 1030 (Desktop)
min:
19.9 fps, P0.1:
20.8 fps, P1:
23.6 fps, max:
43.2 fps
fps
389%
GeForce GTX 1080 Max-Q:
119 [X] Asus Zephyrus GX501 Intel Core i7-7700HQ 2.8GHz
GeForce GTX 1080 Max-Q
min:
9.5 fps, P0.1:
90.3 fps, P1:
107.5 fps, max:
142.9 fps
fps
100%
GeForce GT 1030 (Desktop):
9.8 [X] Zotac GeForce GT 1030 AMD Ryzen 9 5900X 3.7GHz
GeForce GT 1030 (Desktop)
min:
6.6 fps, P0.1:
7.3 fps, P1:
8 fps, max:
13 fps
fps
803%
GeForce GTX 1080 Max-Q:
78.7 [X] Asus Zephyrus GX501 Intel Core i7-7700HQ 2.8GHz
GeForce GTX 1080 Max-Q
min:
14.2 fps, P0.1:
56.4 fps, P1:
67.2 fps, max:
103.5 fps
fps
100%
GeForce GT 1030 (Desktop):
6.7 [X] Zotac GeForce GT 1030 AMD Ryzen 9 5900X 3.7GHz
GeForce GT 1030 (Desktop)
min:
5.6 fps, P0.1:
5.6 fps, P1:
5.8 fps, max:
8.6 fps
fps
931%
GeForce GTX 1080 Max-Q:
62.4 [X] Asus Zephyrus GX501 Intel Core i7-7700HQ 2.8GHz
GeForce GTX 1080 Max-Q
min:
10.2 fps, P0.1:
44.4 fps, P1:
54 fps, max:
92 fps
fps
GeForce GTX 1080 Max-Q:
37 [X] Asus Zephyrus GX501 Intel Core i7-7700HQ 2.8GHz
GeForce GTX 1080 Max-Q
min:
9.4 fps, P0.1:
30.9 fps, P1:
32.3 fps, max:
78.5 fps
fps
100%
GeForce GT 1030 (Desktop):
25.5 [X] Zotac GeForce GT 1030 AMD Ryzen 9 3900X 3.8GHz
GeForce GT 1030 (Desktop)
min:
14.63 fps, P1:
18.49 fps, max:
68.93 fps
fps
258%
GeForce GTX 1080 Max-Q:
65.7 [X] Asus Zephyrus GX501 Intel Core i7-7700HQ 2.8GHz
GeForce GTX 1080 Max-Q
min:
33.1 fps, P1:
50.32 fps, max:
101.31 fps
fps
100%
GeForce GT 1030 (Desktop):
13.1 [X] Zotac GeForce GT 1030 AMD Ryzen 9 3900X 3.8GHz
GeForce GT 1030 (Desktop)
min:
9.44 fps, P1:
10 fps, max:
16.55 fps
fps
501%
GeForce GTX 1080 Max-Q:
65.6 [X] Asus Zephyrus GX501 Intel Core i7-7700HQ 2.8GHz
GeForce GTX 1080 Max-Q
min:
37.55 fps, P1:
49.69 fps, max:
101.87 fps
fps
100%
GeForce GT 1030 (Desktop):
11.6 [X] Zotac GeForce GT 1030 AMD Ryzen 9 3900X 3.8GHz
GeForce GT 1030 (Desktop)
min:
6.3 fps, P1:
8.65 fps, max:
69.11 fps
fps
504%
GeForce GTX 1080 Max-Q:
58.5 [X] Asus Zephyrus GX501 Intel Core i7-7700HQ 2.8GHz
GeForce GTX 1080 Max-Q
min:
28.28 fps, P1:
45.13 fps, max:
84.57 fps
fps
100%
GeForce GT 1030 (Desktop):
5.7 [X] Zotac GeForce GT 1030 AMD Ryzen 9 3900X 3.8GHz
GeForce GT 1030 (Desktop)
min:
4.21 fps, P1:
4.47 fps, max:
7.14 fps
fps
841%
GeForce GTX 1080 Max-Q:
47.5 [X] Asus Zephyrus GX501 Intel Core i7-7700HQ 2.8GHz
GeForce GTX 1080 Max-Q
min:
28.97 fps, P1:
36.65 fps, max:
65.39 fps
fps
100%
GeForce GT 1030 (Desktop):
143 [X] Zotac GeForce GT 1030 AMD Ryzen 9 3900X 3.8GHz
GeForce GT 1030 (Desktop)
min:
12.6 fps, P1:
110 fps, max:
239 fps
fps
100%
GeForce GT 1030 (Desktop):
92.7 [X] Zotac GeForce GT 1030 AMD Ryzen 9 3900X 3.8GHz
GeForce GT 1030 (Desktop)
min:
15.6 fps, P1:
77.3 fps, max:
206 fps
fps
100%
GeForce GT 1030 (Desktop):
84.1 [X] Zotac GeForce GT 1030 AMD Ryzen 9 3900X 3.8GHz
GeForce GT 1030 (Desktop)
min:
44 fps, P1:
71.3 fps, max:
242 fps
fps
100%
GeForce GT 1030 (Desktop):
65.9 [X] Zotac GeForce GT 1030 AMD Ryzen 9 3900X 3.8GHz
GeForce GT 1030 (Desktop)
min:
47.1 fps, P1:
56.5 fps, max:
143 fps
fps
100%
GeForce GT 1030 (Desktop):
48 [X] Zotac GeForce GT 1030 AMD Ryzen 9 3900X 3.8GHz
GeForce GT 1030 (Desktop)
min:
24.5 fps, P1:
42.6 fps, max:
153 fps
fps
100%
GeForce GT 1030 (Desktop):
24 [X] Zotac GeForce GT 1030 AMD Ryzen 9 3900X 3.8GHz
GeForce GT 1030 (Desktop)
min:
10.4 fps, P1:
20.5 fps, max:
225 fps
fps
100%
GeForce GT 1030 (Desktop):
126.9 [X] Zotac GeForce GT 1030 AMD Ryzen 9 3900X 3.8GHz
GeForce GT 1030 (Desktop)
fps
100%
GeForce GT 1030 (Desktop):
51.8 [X] Zotac GeForce GT 1030 AMD Ryzen 9 3900X 3.8GHz
GeForce GT 1030 (Desktop)
fps
100%
GeForce GT 1030 (Desktop):
42.7 [X] Zotac GeForce GT 1030 AMD Ryzen 9 3900X 3.8GHz
GeForce GT 1030 (Desktop)
fps
100%
GeForce GT 1030 (Desktop):
39.7 [X] Zotac GeForce GT 1030 AMD Ryzen 9 3900X 3.8GHz
GeForce GT 1030 (Desktop)
fps
100%
GeForce GT 1030 (Desktop):
17.4 [X] Zotac GeForce GT 1030 AMD Ryzen 9 3900X 3.8GHz
GeForce GT 1030 (Desktop)
fps
100%
GeForce GT 1030 (Desktop):
15.8 [X] Zotac GeForce GT 1030 AMD Ryzen 9 3900X 3.8GHz
GeForce GT 1030 (Desktop)
fps
373%
GeForce GTX 1080 Max-Q:
59 [X] Asus Zephyrus GX501 Intel Core i7-7700HQ 2.8GHz
GeForce GTX 1080 Max-Q
min:
25.8 fps, P1:
36.4 fps, max:
127 fps
fps
100%
GeForce GT 1030 (Desktop):
80 [X] Zotac GeForce GT 1030 AMD Ryzen 9 3900X 3.8GHz
GeForce GT 1030 (Desktop)
fps
100%
GeForce GT 1030 (Desktop):
10 [X] Zotac GeForce GT 1030 AMD Ryzen 9 3900X 3.8GHz
GeForce GT 1030 (Desktop)
fps
GeForce GTX 1080 Max-Q:
52.3 [X] Asus Zephyrus GX501 Intel Core i7-7700HQ 2.8GHz
GeForce GTX 1080 Max-Q
min:
1.714 fps, P1:
35.5 fps, max:
105 fps
fps
GeForce GTX 1080 Max-Q:
44.2 [X] Asus Zephyrus GX501 Intel Core i7-7700HQ 2.8GHz
GeForce GTX 1080 Max-Q
min:
1.846 fps, P1:
28.9 fps, max:
102 fps
fps
GeForce GTX 1080 Max-Q:
31 [X] Asus Zephyrus GX501 Intel Core i7-7700HQ 2.8GHz
GeForce GTX 1080 Max-Q
min:
1.905 fps, P1:
16.2 fps, max:
96.3 fps
fps
100%
GeForce GT 1030 (Desktop):
62.1 [X] Zotac GeForce GT 1030 AMD Ryzen 9 5900X 3.7GHz
GeForce GT 1030 (Desktop)
min:
11.9 fps, P0.1:
12 fps, P1:
12.8 fps, max:
386 fps
fps
100%
GeForce GT 1030 (Desktop):
23 [X] Zotac GeForce GT 1030 AMD Ryzen 9 5900X 3.7GHz
GeForce GT 1030 (Desktop)
min:
5.05 fps, P0.1:
5.09 fps, P1:
5.29 fps, max:
378 fps
fps
100%
GeForce GT 1030 (Desktop):
10.9 [X] Zotac GeForce GT 1030 AMD Ryzen 9 5900X 3.7GHz
GeForce GT 1030 (Desktop)
min:
1.909 fps, P0.1:
2.12 fps, P1:
2.65 fps, max:
223 fps
fps
100%
GeForce GT 1030 (Desktop):
11.5 [X] Zotac GeForce GT 1030 AMD Ryzen 9 3900X 3.8GHz
GeForce GT 1030 (Desktop)
fps
464%
GeForce GTX 1080 Max-Q:
53.4 [X] Asus Zephyrus GX501 Intel Core i7-7700HQ 2.8GHz
GeForce GTX 1080 Max-Q
min:
5 fps, P1:
39.1 fps, max:
65 fps
fps
100%
GeForce GT 1030 (Desktop):
7.2 [X] Zotac GeForce GT 1030 AMD Ryzen 9 3900X 3.8GHz
GeForce GT 1030 (Desktop)
fps
693%
GeForce GTX 1080 Max-Q:
49.9 [X] Asus Zephyrus GX501 Intel Core i7-7700HQ 2.8GHz
GeForce GTX 1080 Max-Q
min:
5 fps, P1:
36.5 fps, max:
61 fps
fps
GeForce GTX 1080 Max-Q:
43 [X] Asus Zephyrus GX501 Intel Core i7-7700HQ 2.8GHz
GeForce GTX 1080 Max-Q
min:
6 fps, P1:
32.3 fps, max:
52 fps
fps
GeForce GTX 1080 Max-Q:
30.9 [X] Asus Zephyrus GX501 Intel Core i7-7700HQ 2.8GHz
GeForce GTX 1080 Max-Q
min:
8 fps, P1:
18.9 fps, max:
41.5 fps
fps
GeForce GTX 1080 Max-Q:
23.7 [X] Asus Zephyrus GX501 Intel Core i7-7700HQ 2.8GHz
GeForce GTX 1080 Max-Q
min:
10 fps, P1:
12.8 fps, max:
39 fps
fps
GeForce GTX 1080 Max-Q:
13.2 [X] Asus Zephyrus GX501 Intel Core i7-7700HQ 2.8GHz
GeForce GTX 1080 Max-Q
min:
7 fps, P1:
8 fps, max:
32 fps
fps
100%
GeForce GT 1030 (Desktop):
31 [X] Zotac GeForce GT 1030 AMD Ryzen 9 3900X 3.8GHz
GeForce GT 1030 (Desktop)
min:
17 fps, max:
61 fps
fps
100%
GeForce GT 1030 (Desktop):
15 [X] Zotac GeForce GT 1030 AMD Ryzen 9 3900X 3.8GHz
GeForce GT 1030 (Desktop)
min:
9 fps, max:
42 fps
fps
100%
GeForce GT 1030 (Desktop):
13 [X] Zotac GeForce GT 1030 AMD Ryzen 9 3900X 3.8GHz
GeForce GT 1030 (Desktop)
min:
6 fps, max:
39 fps
fps
100%
GeForce GT 1030 (Desktop):
10 [X] Zotac GeForce GT 1030 AMD Ryzen 9 3900X 3.8GHz
GeForce GT 1030 (Desktop)
min:
4 fps, max:
29 fps
fps
610%
GeForce GTX 1080 Max-Q:
61 [X] Asus Zephyrus GX501 Intel Core i7-7700HQ 2.8GHz
GeForce GTX 1080 Max-Q
min:
21 fps, max:
118 fps
fps
100%
GeForce GT 1030 (Desktop):
18.5 [X] Zotac GeForce GT 1030 AMD Ryzen 9 3900X 3.8GHz
GeForce GT 1030 (Desktop)
P1:
14.9 fps
fps
100%
GeForce GT 1030 (Desktop):
11.8 [X] Zotac GeForce GT 1030 AMD Ryzen 9 3900X 3.8GHz
GeForce GT 1030 (Desktop)
P1:
7.9 fps
fps
100%
GeForce GT 1030 (Desktop):
9.5 [X] Zotac GeForce GT 1030 AMD Ryzen 9 3900X 3.8GHz
GeForce GT 1030 (Desktop)
P1:
6.2 fps
fps
GeForce GTX 1080 Max-Q:
94.6 [X] Asus Zephyrus GX501 Intel Core i7-7700HQ 2.8GHz
GeForce GTX 1080 Max-Q
P1:
69.4 fps
fps
GeForce GTX 1080 Max-Q:
67 [X] Asus Zephyrus GX501 Intel Core i7-7700HQ 2.8GHz
GeForce GTX 1080 Max-Q
P1:
34.1 fps
fps
GeForce GTX 1080 Max-Q:
36 [X] Asus Zephyrus GX501 Intel Core i7-7700HQ 2.8GHz
GeForce GTX 1080 Max-Q
P1:
19.7 fps
fps
100%
GeForce GT 1030 (Desktop):
92.7 [X] Zotac GeForce GT 1030 675864
AMD Ryzen 9 3900X 3.8GHz
GeForce GT 1030 (Desktop)
min:
82 fps, max:
103 fps
fps
100%
GeForce GT 1030 (Desktop):
41.6 [X] Zotac GeForce GT 1030 675864
AMD Ryzen 9 3900X 3.8GHz
GeForce GT 1030 (Desktop)
min:
32 fps, max:
49 fps
fps
100%
GeForce GT 1030 (Desktop):
30.7 [X] Zotac GeForce GT 1030 675864
AMD Ryzen 9 3900X 3.8GHz
GeForce GT 1030 (Desktop)
min:
25 fps, max:
35 fps
fps
100%
GeForce GT 1030 (Desktop):
18.6 [X] Zotac GeForce GT 1030 675864
AMD Ryzen 9 3900X 3.8GHz
GeForce GT 1030 (Desktop)
min:
13 fps, max:
23 fps
fps
575%
GeForce GTX 1080 Max-Q:
107 [X] Asus Zephyrus GX501 670054
Intel Core i7-7700HQ 2.8GHz
GeForce GTX 1080 Max-Q
min:
80 fps, max:
129 fps
fps
100%
GeForce GT 1030 (Desktop):
13.7 [X] Zotac GeForce GT 1030 675864
AMD Ryzen 9 3900X 3.8GHz
GeForce GT 1030 (Desktop)
min:
10 fps, max:
16 fps
fps
555%
GeForce GTX 1080 Max-Q:
76.1 [X] Asus Zephyrus GX501 670054
Intel Core i7-7700HQ 2.8GHz
GeForce GTX 1080 Max-Q
min:
61 fps, max:
92 fps
fps
100%
GeForce GT 1030 (Desktop):
4.8 [X] Zotac GeForce GT 1030 675864
AMD Ryzen 9 3900X 3.8GHz
GeForce GT 1030 (Desktop)
min:
3 fps, max:
6 fps
fps
963%
GeForce GTX 1080 Max-Q:
46.4 [X] Asus Zephyrus GX501 670054
Intel Core i7-7700HQ 2.8GHz
GeForce GTX 1080 Max-Q
min:
37 fps, max:
55 fps
fps
100%
GeForce GT 1030 (Desktop):
306.2 [X] Zotac GeForce GT 1030 AMD Ryzen 9 3900X 3.8GHz
GeForce GT 1030 (Desktop)
fps
100%
GeForce GT 1030 (Desktop):
151.5 [X] Zotac GeForce GT 1030 AMD Ryzen 9 3900X 3.8GHz
GeForce GT 1030 (Desktop)
fps
100%
GeForce GT 1030 (Desktop):
122.6 [X] Zotac GeForce GT 1030 AMD Ryzen 9 3900X 3.8GHz
GeForce GT 1030 (Desktop)
fps
166%
GeForce GTX 1080 Max-Q:
203 [X] Asus Zephyrus GX501 Intel Core i7-7700HQ 2.8GHz
GeForce GTX 1080 Max-Q
P1:
112.4 fps
fps
GeForce GTX 1080 Max-Q:
194 [X] Asus Zephyrus GX501 Intel Core i7-7700HQ 2.8GHz
GeForce GTX 1080 Max-Q
P1:
138.9 fps
fps
GeForce GTX 1080 Max-Q:
185 [X] Asus Zephyrus GX501 Intel Core i7-7700HQ 2.8GHz
GeForce GTX 1080 Max-Q
P1:
126.6 fps
fps
100%
GeForce GT 1030 (Desktop):
105.9 [X] Zotac GeForce GT 1030 AMD Ryzen 9 3900X 3.8GHz
GeForce GT 1030 (Desktop)
fps
100%
GeForce GT 1030 (Desktop):
35.7 [X] Zotac GeForce GT 1030 AMD Ryzen 9 3900X 3.8GHz
GeForce GT 1030 (Desktop)
fps
429%
GeForce GTX 1080 Max-Q:
153 [X] Asus Zephyrus GX501 Intel Core i7-7700HQ 2.8GHz
GeForce GTX 1080 Max-Q
fps
100%
GeForce GT 1030 (Desktop):
24.2 [X] Zotac GeForce GT 1030 AMD Ryzen 9 3900X 3.8GHz
GeForce GT 1030 (Desktop)
fps
388%
GeForce GTX 1080 Max-Q:
93.9 [X] Asus Zephyrus GX501 Intel Core i7-7700HQ 2.8GHz
GeForce GTX 1080 Max-Q
fps
100%
GeForce GT 1030 (Desktop):
15.4 [X] Zotac GeForce GT 1030 AMD Ryzen 9 3900X 3.8GHz
GeForce GT 1030 (Desktop)
fps
511%
GeForce GTX 1080 Max-Q:
78.7 [X] Asus Zephyrus GX501 Intel Core i7-7700HQ 2.8GHz
GeForce GTX 1080 Max-Q
fps
100%
GeForce GT 1030 (Desktop):
8.9 [X] Zotac GeForce GT 1030 AMD Ryzen 9 3900X 3.8GHz
GeForce GT 1030 (Desktop)
fps
100%
GeForce GT 1030 (Desktop):
38.4 [X] Zotac GeForce GT 1030 AMD Ryzen 9 3900X 3.8GHz
GeForce GT 1030 (Desktop)
P1:
26.7 fps
fps
100%
GeForce GT 1030 (Desktop):
17.6 [X] Zotac GeForce GT 1030 AMD Ryzen 9 3900X 3.8GHz
GeForce GT 1030 (Desktop)
P1:
13.2 fps
fps
100%
GeForce GT 1030 (Desktop):
14.9 [X] Zotac GeForce GT 1030 AMD Ryzen 9 3900X 3.8GHz
GeForce GT 1030 (Desktop)
P1:
11.1 fps
fps
100%
GeForce GT 1030 (Desktop):
14.2 [X] Zotac GeForce GT 1030 AMD Ryzen 9 3900X 3.8GHz
GeForce GT 1030 (Desktop)
P1:
10.4 fps
fps
901%
GeForce GTX 1080 Max-Q:
128 [X] Asus Zephyrus GX501 Intel Core i7-7700HQ 2.8GHz
GeForce GTX 1080 Max-Q
P1:
82.6 fps
fps
GeForce GTX 1080 Max-Q:
96.6 [X] Asus Zephyrus GX501 Intel Core i7-7700HQ 2.8GHz
GeForce GTX 1080 Max-Q
P1:
72.5 fps
fps
GeForce GTX 1080 Max-Q:
51.6 [X] Asus Zephyrus GX501 Intel Core i7-7700HQ 2.8GHz
GeForce GTX 1080 Max-Q
P1:
42.9 fps
fps
100%
GeForce GT 1030 (Desktop):
51.6 [X] Zotac GeForce GT 1030 AMD Ryzen 9 3900X 3.8GHz
GeForce GT 1030 (Desktop)
min:
45 fps, max:
56 fps
fps
100%
GeForce GT 1030 (Desktop):
17 [X] Zotac GeForce GT 1030 AMD Ryzen 9 3900X 3.8GHz
GeForce GT 1030 (Desktop)
min:
15 fps, max:
19 fps
fps
100%
GeForce GT 1030 (Desktop):
14.6 [X] Zotac GeForce GT 1030 AMD Ryzen 9 3900X 3.8GHz
GeForce GT 1030 (Desktop)
min:
12 fps, max:
17 fps
fps
685%
GeForce GTX 1080 Max-Q:
100 [X] Asus Zephyrus GX501 Intel Core i7-7700HQ 2.8GHz
GeForce GTX 1080 Max-Q
min:
93 fps, max:
110 fps
fps
GeForce GTX 1080 Max-Q:
50.7 [X] Asus Zephyrus GX501 Intel Core i7-7700HQ 2.8GHz
GeForce GTX 1080 Max-Q
min:
48 fps, max:
54 fps
fps
GeForce GTX 1080 Max-Q:
23.8 [X] Asus Zephyrus GX501 Intel Core i7-7700HQ 2.8GHz
GeForce GTX 1080 Max-Q
min:
22 fps, max:
25 fps
fps
100%
GeForce GT 1030 (Desktop):
68.9 [X] Zotac GeForce GT 1030 AMD Ryzen 9 3900X 3.8GHz
GeForce GT 1030 (Desktop)
min:
55 fps, max:
76 fps
fps
100%
GeForce GT 1030 (Desktop):
29.1 [X] Zotac GeForce GT 1030 AMD Ryzen 9 3900X 3.8GHz
GeForce GT 1030 (Desktop)
min:
24 fps, max:
34 fps
fps
100%
GeForce GT 1030 (Desktop):
29 [X] Zotac GeForce GT 1030 AMD Ryzen 9 3900X 3.8GHz
GeForce GT 1030 (Desktop)
min:
26 fps, max:
33 fps
fps
100%
GeForce GT 1030 (Desktop):
23.5 [X] Zotac GeForce GT 1030 AMD Ryzen 9 3900X 3.8GHz
GeForce GT 1030 (Desktop)
min:
17 fps, max:
30 fps
fps
GeForce GTX 1080 Max-Q:
119 [X] Asus Zephyrus GX501 Intel Core i7-7700HQ 2.8GHz
GeForce GTX 1080 Max-Q
min:
107 fps, max:
122 fps
fps
GeForce GTX 1080 Max-Q:
119 [X] Asus Zephyrus GX501 Intel Core i7-7700HQ 2.8GHz
GeForce GTX 1080 Max-Q
min:
102 fps, max:
122 fps
fps
GeForce GTX 1080 Max-Q:
59.5 [X] Asus Zephyrus GX501 Intel Core i7-7700HQ 2.8GHz
GeForce GTX 1080 Max-Q
min:
48.3 fps, P0.1:
50.7 fps, P1:
53.4 fps, max:
78.7 fps
fps
GeForce GTX 1080 Max-Q:
59.5 [X] Asus Zephyrus GX501 Intel Core i7-7700HQ 2.8GHz
GeForce GTX 1080 Max-Q
min:
17.9 fps, P0.1:
47.4 fps, P1:
51.8 fps, max:
87.7 fps
fps
GeForce GTX 1080 Max-Q:
59.4 [X] Asus Zephyrus GX501 Intel Core i7-7700HQ 2.8GHz
GeForce GTX 1080 Max-Q
min:
46.7 fps, P0.1:
47.3 fps, P1:
50.4 fps, max:
83.5 fps
fps
100%
GeForce GT 1030 (Desktop):
35.6 [X] Zotac GeForce GT 1030 AMD Ryzen 9 3900X 3.8GHz
GeForce GT 1030 (Desktop)
min:
27.6 fps, P1:
29.4 fps, max:
46.3 fps
fps
GeForce GTX 1080 Max-Q:
31.4 [X] Asus Zephyrus GX501 Intel Core i7-7700HQ 2.8GHz
GeForce GTX 1080 Max-Q
min:
13.5 fps, P1:
18.2 fps, max:
43.1 fps
fps
100%
GeForce GT 1030 (Desktop):
31.4 [X] Zotac GeForce GT 1030 AMD Ryzen 9 3900X 3.8GHz
GeForce GT 1030 (Desktop)
min:
24 fps, max:
38 fps
fps
100%
GeForce GT 1030 (Desktop):
24.1 [X] Zotac GeForce GT 1030 AMD Ryzen 9 3900X 3.8GHz
GeForce GT 1030 (Desktop)
min:
21 fps, max:
29 fps
fps
100%
GeForce GT 1030 (Desktop):
19 [X] Zotac GeForce GT 1030 AMD Ryzen 9 3900X 3.8GHz
GeForce GT 1030 (Desktop)
min:
16 fps, max:
22 fps
fps
100%
GeForce GT 1030 (Desktop):
48.6 [X] Zotac GeForce GT 1030 AMD Ryzen 9 3900X 3.8GHz
GeForce GT 1030 (Desktop)
min:
37 fps, max:
55 fps
fps
100%
GeForce GT 1030 (Desktop):
20 [X] Zotac GeForce GT 1030 AMD Ryzen 9 3900X 3.8GHz
GeForce GT 1030 (Desktop)
min:
8 fps, max:
26 fps
fps
100%
GeForce GT 1030 (Desktop):
14.8 [X] Zotac GeForce GT 1030 AMD Ryzen 9 3900X 3.8GHz
GeForce GT 1030 (Desktop)
min:
2 fps, max:
23 fps
fps
100%
GeForce GT 1030 (Desktop):
39.3 [X] Zotac GeForce GT 1030 AMD Ryzen 9 3900X 3.8GHz
GeForce GT 1030 (Desktop)
P1:
28.8 fps
fps
100%
GeForce GT 1030 (Desktop):
23.4 [X] Zotac GeForce GT 1030 AMD Ryzen 9 3900X 3.8GHz
GeForce GT 1030 (Desktop)
P1:
18.8 fps
fps
100%
GeForce GT 1030 (Desktop):
70 [X] Zotac GeForce GT 1030 AMD Ryzen 9 3900X 3.8GHz
GeForce GT 1030 (Desktop)
P1:
49 fps
fps
100%
GeForce GT 1030 (Desktop):
26.7 [X] Zotac GeForce GT 1030 AMD Ryzen 9 3900X 3.8GHz
GeForce GT 1030 (Desktop)
P1:
21.1 fps
fps
100%
GeForce GT 1030 (Desktop):
19.8 [X] Zotac GeForce GT 1030 AMD Ryzen 9 3900X 3.8GHz
GeForce GT 1030 (Desktop)
P1:
9.8 fps
fps
GeForce GTX 1080 Max-Q:
58 [X] Asus Zephyrus GX501 Intel Core i7-7700HQ 2.8GHz
GeForce GTX 1080 Max-Q
P1:
33.8 fps
fps
100%
GeForce GT 1030 (Desktop):
40 [X] Zotac GeForce GT 1030 AMD Ryzen 9 3900X 3.8GHz
GeForce GT 1030 (Desktop)
min:
17 fps, max:
67 fps
fps
100%
GeForce GT 1030 (Desktop):
18 [X] Zotac GeForce GT 1030 AMD Ryzen 9 3900X 3.8GHz
GeForce GT 1030 (Desktop)
min:
14 fps, max:
25 fps
fps
100%
GeForce GT 1030 (Desktop):
16 [X] Zotac GeForce GT 1030 AMD Ryzen 9 3900X 3.8GHz
GeForce GT 1030 (Desktop)
min:
8 fps, max:
23 fps
fps
100%
GeForce GT 1030 (Desktop):
5 [X] Zotac GeForce GT 1030 AMD Ryzen 9 3900X 3.8GHz
GeForce GT 1030 (Desktop)
min:
3 fps, max:
13 fps
fps
100%
GeForce GT 1030 (Desktop):
167 [X] Zotac GeForce GT 1030 AMD Ryzen 9 3900X 3.8GHz
GeForce GT 1030 (Desktop)
P1:
131.6 fps
fps
100%
GeForce GT 1030 (Desktop):
98 [X] Zotac GeForce GT 1030 AMD Ryzen 9 3900X 3.8GHz
GeForce GT 1030 (Desktop)
P1:
82 fps
fps
100%
GeForce GT 1030 (Desktop):
89 [X] Zotac GeForce GT 1030 AMD Ryzen 9 3900X 3.8GHz
GeForce GT 1030 (Desktop)
P1:
76.3 fps
fps
100%
GeForce GT 1030 (Desktop):
73 [X] Zotac GeForce GT 1030 AMD Ryzen 9 3900X 3.8GHz
GeForce GT 1030 (Desktop)
P1:
62.9 fps
fps
100%
GeForce GT 1030 (Desktop):
49.1 [X] Zotac GeForce GT 1030 AMD Ryzen 9 3900X 3.8GHz
GeForce GT 1030 (Desktop)
P1:
44.2 fps
fps
253%
GeForce GTX 1080 Max-Q:
124 [X] Asus Zephyrus GX501 Intel Core i7-7700HQ 2.8GHz
GeForce GTX 1080 Max-Q
P1:
89.3 fps
fps
100%
GeForce GT 1030 (Desktop):
17.4 [X] Zotac GeForce GT 1030 AMD Ryzen 9 3900X 3.8GHz
GeForce GT 1030 (Desktop)
P1:
9.4 fps
fps
655%
GeForce GTX 1080 Max-Q:
114 [X] Asus Zephyrus GX501 Intel Core i7-7700HQ 2.8GHz
GeForce GTX 1080 Max-Q
P1:
81.3 fps
fps
100%
GeForce GT 1030 (Desktop):
59.5 [X] Zotac GeForce GT 1030 AMD Ryzen 9 3900X 3.8GHz
GeForce GT 1030 (Desktop)
fps
153%
GeForce GTX 1080 Max-Q:
91 [X] Asus Zephyrus GX501 Intel Core i7-7700HQ 2.8GHz
GeForce GTX 1080 Max-Q
fps
100%
GeForce GT 1030 (Desktop):
22.4 [X] Zotac GeForce GT 1030 AMD Ryzen 9 3900X 3.8GHz
GeForce GT 1030 (Desktop)
fps
366%
GeForce GTX 1080 Max-Q:
82 [X] Asus Zephyrus GX501 Intel Core i7-7700HQ 2.8GHz
GeForce GTX 1080 Max-Q
fps
100%
GeForce GT 1030 (Desktop):
14.2 [X] Zotac GeForce GT 1030 AMD Ryzen 9 3900X 3.8GHz
GeForce GT 1030 (Desktop)
fps
479%
GeForce GTX 1080 Max-Q:
68 [X] Asus Zephyrus GX501 Intel Core i7-7700HQ 2.8GHz
GeForce GTX 1080 Max-Q
fps
100%
GeForce GT 1030 (Desktop):
10.6 [X] Zotac GeForce GT 1030 AMD Ryzen 9 3900X 3.8GHz
GeForce GT 1030 (Desktop)
fps
521%
GeForce GTX 1080 Max-Q:
55.2 [X] Asus Zephyrus GX501 Intel Core i7-7700HQ 2.8GHz
GeForce GTX 1080 Max-Q
fps
100%
GeForce GT 1030 (Desktop):
7.1 [X] Zotac GeForce GT 1030 AMD Ryzen 9 3900X 3.8GHz
GeForce GT 1030 (Desktop)
fps
552%
GeForce GTX 1080 Max-Q:
39.2 [X] Asus Zephyrus GX501 Intel Core i7-7700HQ 2.8GHz
GeForce GTX 1080 Max-Q
fps
GeForce GTX 1080 Max-Q:
20.7 [X] Asus Zephyrus GX501 Intel Core i7-7700HQ 2.8GHz
GeForce GTX 1080 Max-Q
fps
100%
GeForce GT 1030 (Desktop):
43.2 [X] Zotac GeForce GT 1030 AMD Ryzen 9 3900X 3.8GHz
GeForce GT 1030 (Desktop)
min:
38 fps, max:
51 fps
fps
465%
GeForce GTX 1080 Max-Q:
201 [X] Asus Zephyrus GX501 Intel Core i7-7700HQ 2.8GHz
GeForce GTX 1080 Max-Q
min:
159 fps, max:
237 fps
fps
100%
GeForce GT 1030 (Desktop):
13.6 [X] Zotac GeForce GT 1030 AMD Ryzen 9 3900X 3.8GHz
GeForce GT 1030 (Desktop)
min:
11 fps, max:
16 fps
fps
522%
GeForce GTX 1080 Max-Q:
71 [X] Asus Zephyrus GX501 Intel Core i7-7700HQ 2.8GHz
GeForce GTX 1080 Max-Q
min:
62 fps, max:
80 fps
fps
100%
GeForce GT 1030 (Desktop):
9.4 [X] Zotac GeForce GT 1030 AMD Ryzen 9 3900X 3.8GHz
GeForce GT 1030 (Desktop)
min:
7 fps, max:
12 fps
fps
570%
GeForce GTX 1080 Max-Q:
53.6 [X] Asus Zephyrus GX501 Intel Core i7-7700HQ 2.8GHz
GeForce GTX 1080 Max-Q
min:
48 fps, max:
59 fps
fps
GeForce GTX 1080 Max-Q:
32.6 [X] Asus Zephyrus GX501 Intel Core i7-7700HQ 2.8GHz
GeForce GTX 1080 Max-Q
min:
28 fps, max:
37 fps
fps
GeForce GTX 1080 Max-Q:
16 [X] Asus Zephyrus GX501 Intel Core i7-7700HQ 2.8GHz
GeForce GTX 1080 Max-Q
min:
14 fps, max:
19 fps
fps
100%
GeForce GT 1030 (Desktop):
82 [X] Zotac GT 1030 AMD Ryzen 7 2700X 3.7GHz
GeForce GT 1030 (Desktop)
min:
72 fps, max:
94 fps
fps
100%
GeForce GT 1030 (Desktop):
34 [X] Zotac GT 1030 AMD Ryzen 7 2700X 3.7GHz
GeForce GT 1030 (Desktop)
min:
29 fps, max:
41 fps
fps
100%
GeForce GT 1030 (Desktop):
27 [X] Zotac GT 1030 AMD Ryzen 7 2700X 3.7GHz
GeForce GT 1030 (Desktop)
min:
22 fps, max:
33 fps
fps
100%
GeForce GT 1030 (Desktop):
13 [X] Zotac GT 1030 AMD Ryzen 7 2700X 3.7GHz
GeForce GT 1030 (Desktop)
min:
9 fps, max:
17 fps
fps
GeForce GTX 1080 Max-Q:
145 fps
GeForce GTX 1080 Max-Q:
144 fps
100%
GeForce GT 1030 (Desktop):
78 [X] Zotac GeForce GT 1030 AMD Ryzen 9 3900X 3.8GHz
GeForce GT 1030 (Desktop)
fps
100%
GeForce GT 1030 (Desktop):
22.8 [X] Zotac GeForce GT 1030 AMD Ryzen 9 3900X 3.8GHz
GeForce GT 1030 (Desktop)
fps
100%
GeForce GT 1030 (Desktop):
17.5 [X] Zotac GeForce GT 1030 AMD Ryzen 9 3900X 3.8GHz
GeForce GT 1030 (Desktop)
fps
100%
GeForce GT 1030 (Desktop):
13.6 [X] Zotac GeForce GT 1030 AMD Ryzen 9 3900X 3.8GHz
GeForce GT 1030 (Desktop)
fps
408%
GeForce GTX 1080 Max-Q:
55.5 [X] Asus Zephyrus GX501 Intel Core i7-7700HQ 2.8GHz
GeForce GTX 1080 Max-Q
min:
41 fps, max:
68 fps
fps
100%
GeForce GT 1030 (Desktop):
11.3 [X] Zotac GeForce GT 1030 AMD Ryzen 9 3900X 3.8GHz
GeForce GT 1030 (Desktop)
fps
336%
GeForce GTX 1080 Max-Q:
38 [X] Asus Zephyrus GX501 Intel Core i7-7700HQ 2.8GHz
GeForce GTX 1080 Max-Q
min:
23 fps, max:
44 fps
fps
100%
GeForce GT 1030 (Desktop):
2.3 [X] Zotac GeForce GT 1030 AMD Ryzen 9 3900X 3.8GHz
GeForce GT 1030 (Desktop)
fps
822%
GeForce GTX 1080 Max-Q:
18.9 [X] Asus Zephyrus GX501 Intel Core i7-7700HQ 2.8GHz
GeForce GTX 1080 Max-Q
min:
16 fps, max:
21 fps
fps
100%
GeForce GT 1030 (Desktop):
39.8 [X] Zotac GT 1030 AMD Ryzen 7 2700X 3.7GHz
GeForce GT 1030 (Desktop)
P1:
32.8 fps
fps
508%
GeForce GTX 1080 Max-Q:
202 [X] Acer Predator Triton 700 Intel Core i7-7700HQ 2.8GHz
GeForce GTX 1080 Max-Q
min:
120 fps
fps
100%
GeForce GT 1030 (Desktop):
15.2 [X] Zotac GT 1030 AMD Ryzen 7 2700X 3.7GHz
GeForce GT 1030 (Desktop)
P1:
13.4 fps
fps
644%
GeForce GTX 1080 Max-Q:
97.9 [X] Acer Predator Triton 700 Intel Core i7-7700HQ 2.8GHz
GeForce GTX 1080 Max-Q
min:
80 fps
fps
100%
GeForce GT 1030 (Desktop):
13.2 [X] Zotac GT 1030 AMD Ryzen 7 2700X 3.7GHz
GeForce GT 1030 (Desktop)
P1:
12.9 fps
fps
627%
GeForce GTX 1080 Max-Q:
82.7 [X] Acer Predator Triton 700 Intel Core i7-7700HQ 2.8GHz
GeForce GTX 1080 Max-Q
min:
67 fps
fps
GeForce GTX 1080 Max-Q:
80.6 [X] Acer Predator Triton 700 Intel Core i7-7700HQ 2.8GHz
GeForce GTX 1080 Max-Q
min:
65 fps
fps
GeForce GTX 1080 Max-Q:
50.8 [X] Acer Predator Triton 700 Intel Core i7-7700HQ 2.8GHz
GeForce GTX 1080 Max-Q
min:
41 fps
fps
GeForce GTX 1080 Max-Q:
24.3 [X] Acer Predator Triton 700 Intel Core i7-7700HQ 2.8GHz
GeForce GTX 1080 Max-Q
min:
20 fps
fps
100%
GeForce GT 1030 (Desktop):
16.3 [X] Zotac GT 1030 AMD Ryzen 7 2700X 3.7GHz
GeForce GT 1030 (Desktop)
min:
12 fps, max:
20 fps
fps
479%
GeForce GTX 1080 Max-Q:
78.1 [X] Acer Predator Triton 700 Intel Core i7-7700HQ 2.8GHz
GeForce GTX 1080 Max-Q
min:
71 fps
fps
100%
GeForce GT 1030 (Desktop):
12.4 [X] Zotac GT 1030 AMD Ryzen 7 2700X 3.7GHz
GeForce GT 1030 (Desktop)
min:
10 fps, max:
16 fps
fps
595%
GeForce GTX 1080 Max-Q:
73.8 [X] Acer Predator Triton 700 Intel Core i7-7700HQ 2.8GHz
GeForce GTX 1080 Max-Q
min:
66 fps
fps
100%
GeForce GT 1030 (Desktop):
7.9 [X] Zotac GT 1030 AMD Ryzen 7 2700X 3.7GHz
GeForce GT 1030 (Desktop)
min:
4 fps, max:
11 fps
fps
823%
GeForce GTX 1080 Max-Q:
65 [X] Acer Predator Triton 700 Intel Core i7-7700HQ 2.8GHz
GeForce GTX 1080 Max-Q
min:
59 fps
fps
100%
GeForce GT 1030 (Desktop):
7.8 [X] Zotac GT 1030 AMD Ryzen 7 2700X 3.7GHz
GeForce GT 1030 (Desktop)
min:
5 fps, max:
10 fps
fps
436%
GeForce GTX 1080 Max-Q:
33.5 [X] Asus Zephyrus GX501 Intel Core i7-7700HQ 2.8GHz
GeForce GTX 1080 Max-Q
min:
28 fps, max:
40 fps
34.6 [X] Acer Predator Triton 700 Intel Core i7-7700HQ 2.8GHz
GeForce GTX 1080 Max-Q
min:
31 fps
~ 34 fps
GeForce GTX 1080 Max-Q:
29.5 [X] Acer Predator Triton 700 Intel Core i7-7700HQ 2.8GHz
GeForce GTX 1080 Max-Q
min:
27 fps
fps
GeForce GTX 1080 Max-Q:
17.6 [X] Acer Predator Triton 700 Intel Core i7-7700HQ 2.8GHz
GeForce GTX 1080 Max-Q
min:
15 fps
fps
100%
GeForce GT 1030 (Desktop):
47 [X] Zotac GT 1030 AMD Ryzen 7 2700X 3.7GHz
GeForce GT 1030 (Desktop)
fps
304%
GeForce GTX 1080 Max-Q:
143 [X] Acer Predator Triton 700 Intel Core i7-7700HQ 2.8GHz
GeForce GTX 1080 Max-Q
fps
100%
GeForce GT 1030 (Desktop):
19 [X] Zotac GT 1030 AMD Ryzen 7 2700X 3.7GHz
GeForce GT 1030 (Desktop)
fps
595%
GeForce GTX 1080 Max-Q:
113 [X] Acer Predator Triton 700 Intel Core i7-7700HQ 2.8GHz
GeForce GTX 1080 Max-Q
fps
100%
GeForce GT 1030 (Desktop):
12 [X] Zotac GT 1030 AMD Ryzen 7 2700X 3.7GHz
GeForce GT 1030 (Desktop)
fps
758%
GeForce GTX 1080 Max-Q:
91 [X] Acer Predator Triton 700 Intel Core i7-7700HQ 2.8GHz
GeForce GTX 1080 Max-Q
fps
GeForce GTX 1080 Max-Q:
73 [X] Acer Predator Triton 700 Intel Core i7-7700HQ 2.8GHz
GeForce GTX 1080 Max-Q
74 [X] Asus Zephyrus GX501 Intel Core i7-7700HQ 2.8GHz
GeForce GTX 1080 Max-Q
min:
35.1 fps, P1:
52.1 fps, max:
152 fps
~ 74 fps
GeForce GTX 1080 Max-Q:
51 [X] Acer Predator Triton 700 Intel Core i7-7700HQ 2.8GHz
GeForce GTX 1080 Max-Q
51.5 [X] Asus Zephyrus GX501 Intel Core i7-7700HQ 2.8GHz
GeForce GTX 1080 Max-Q
min:
23.9 fps, P1:
34.8 fps, max:
77.5 fps
~ 51 fps
GeForce GTX 1080 Max-Q:
27 [X] Acer Predator Triton 700 Intel Core i7-7700HQ 2.8GHz
GeForce GTX 1080 Max-Q
27.8 [X] Asus Zephyrus GX501 Intel Core i7-7700HQ 2.8GHz
GeForce GTX 1080 Max-Q
min:
18 fps, P1:
22.4 fps, max:
48.8 fps
~ 27 fps
100%
GeForce GT 1030 (Desktop):
87.4 [X] Zotac GT 1030 AMD Ryzen 7 2700X 3.7GHz
GeForce GT 1030 (Desktop)
min:
78 fps, max:
110 fps
fps
221%
GeForce GTX 1080 Max-Q:
193 [X] Acer Predator Triton 700 Intel Core i7-7700HQ 2.8GHz
GeForce GTX 1080 Max-Q
min:
178 fps
fps
100%
GeForce GT 1030 (Desktop):
33.8 [X] Zotac GT 1030 AMD Ryzen 7 2700X 3.7GHz
GeForce GT 1030 (Desktop)
min:
29 fps, max:
38 fps
fps
388%
GeForce GTX 1080 Max-Q:
131 [X] Acer Predator Triton 700 Intel Core i7-7700HQ 2.8GHz
GeForce GTX 1080 Max-Q
min:
115 fps
fps
100%
GeForce GT 1030 (Desktop):
28.1 [X] Zotac GT 1030 AMD Ryzen 7 2700X 3.7GHz
GeForce GT 1030 (Desktop)
min:
24 fps, max:
32 fps
fps
384%
GeForce GTX 1080 Max-Q:
108 [X] Acer Predator Triton 700 Intel Core i7-7700HQ 2.8GHz
GeForce GTX 1080 Max-Q
min:
86 fps
fps
100%
GeForce GT 1030 (Desktop):
16 [X] Zotac GT 1030 AMD Ryzen 7 2700X 3.7GHz
GeForce GT 1030 (Desktop)
min:
14 fps, max:
19 fps
fps
456%
GeForce GTX 1080 Max-Q:
70.6 [X] Acer Predator Triton 700 Intel Core i7-7700HQ 2.8GHz
GeForce GTX 1080 Max-Q
min:
57 fps
75 ~ 73 fps
GeForce GTX 1080 Max-Q:
54.9 [X] Acer Predator Triton 700 Intel Core i7-7700HQ 2.8GHz
GeForce GTX 1080 Max-Q
min:
47 fps
55.9 ~ 55 fps
GeForce GTX 1080 Max-Q:
33.7 fps
100%
GeForce GT 1030 (Desktop):
32.8 [X] Zotac GT 1030 AMD Ryzen 7 2700X 3.7GHz
GeForce GT 1030 (Desktop)
min:
18 fps, max:
46 fps
fps
282%
GeForce GTX 1080 Max-Q:
92.5 [X] Acer Predator Triton 700 Intel Core i7-7700HQ 2.8GHz
GeForce GTX 1080 Max-Q
min:
76 fps
fps
100%
GeForce GT 1030 (Desktop):
17.2 [X] Zotac GT 1030 AMD Ryzen 7 2700X 3.7GHz
GeForce GT 1030 (Desktop)
min:
14 fps, max:
23 fps
fps
484%
GeForce GTX 1080 Max-Q:
83.3 [X] Acer Predator Triton 700 Intel Core i7-7700HQ 2.8GHz
GeForce GTX 1080 Max-Q
min:
70 fps
fps
100%
GeForce GT 1030 (Desktop):
14.3 [X] Zotac GT 1030 AMD Ryzen 7 2700X 3.7GHz
GeForce GT 1030 (Desktop)
min:
9 fps, max:
18 fps
fps
548%
GeForce GTX 1080 Max-Q:
78.4 [X] Acer Predator Triton 700 Intel Core i7-7700HQ 2.8GHz
GeForce GTX 1080 Max-Q
min:
58 fps
fps
GeForce GTX 1080 Max-Q:
72.3 [X] Acer Predator Triton 700 Intel Core i7-7700HQ 2.8GHz
GeForce GTX 1080 Max-Q
min:
53 fps
fps
GeForce GTX 1080 Max-Q:
54.5 [X] Acer Predator Triton 700 Intel Core i7-7700HQ 2.8GHz
GeForce GTX 1080 Max-Q
min:
47 fps
fps
GeForce GTX 1080 Max-Q:
29 [X] Acer Predator Triton 700 Intel Core i7-7700HQ 2.8GHz
GeForce GTX 1080 Max-Q
min:
26 fps
fps
100%
GeForce GT 1030 (Desktop):
48 [X] Zotac GT 1030 AMD Ryzen 7 2700X 3.7GHz
GeForce GT 1030 (Desktop)
min:
34 fps, max:
59 fps
fps
204%
GeForce GTX 1080 Max-Q:
98 [X] Acer Predator Triton 700 Intel Core i7-7700HQ 2.8GHz
GeForce GTX 1080 Max-Q
min:
76 fps
fps
100%
GeForce GT 1030 (Desktop):
23 [X] Zotac GT 1030 AMD Ryzen 7 2700X 3.7GHz
GeForce GT 1030 (Desktop)
min:
18 fps, max:
27 fps
fps
365%
GeForce GTX 1080 Max-Q:
84 [X] Acer Predator Triton 700 Intel Core i7-7700HQ 2.8GHz
GeForce GTX 1080 Max-Q
min:
67 fps
fps
100%
GeForce GT 1030 (Desktop):
22 [X] Zotac GT 1030 AMD Ryzen 7 2700X 3.7GHz
GeForce GT 1030 (Desktop)
min:
17 fps, max:
26 fps
fps
368%
GeForce GTX 1080 Max-Q:
81 [X] Acer Predator Triton 700 Intel Core i7-7700HQ 2.8GHz
GeForce GTX 1080 Max-Q
min:
64 fps
fps
100%
GeForce GT 1030 (Desktop):
18 [X] Zotac GT 1030 AMD Ryzen 7 2700X 3.7GHz
GeForce GT 1030 (Desktop)
min:
14 fps, max:
23 fps
fps
389%
GeForce GTX 1080 Max-Q:
66 74 [X] Acer Predator Triton 700 Intel Core i7-7700HQ 2.8GHz
GeForce GTX 1080 Max-Q
min:
54 fps
~ 70 fps
GeForce GTX 1080 Max-Q:
67 [X] Acer Predator Triton 700 Intel Core i7-7700HQ 2.8GHz
GeForce GTX 1080 Max-Q
min:
52 fps
fps
GeForce GTX 1080 Max-Q:
38 [X] Acer Predator Triton 700 Intel Core i7-7700HQ 2.8GHz
GeForce GTX 1080 Max-Q
min:
31 fps
38 ~ 38 fps
100%
GeForce GT 1030 (Desktop):
10.8 [X] Zotac GT 1030 AMD Ryzen 7 2700X 3.7GHz
GeForce GT 1030 (Desktop)
min:
4 fps, max:
22 fps
fps
1028%
GeForce GTX 1080 Max-Q:
111 [X] Acer Predator Triton 700 Intel Core i7-7700HQ 2.8GHz
GeForce GTX 1080 Max-Q
min:
60 fps
fps
100%
GeForce GT 1030 (Desktop):
7.6 [X] Zotac GT 1030 AMD Ryzen 7 2700X 3.7GHz
GeForce GT 1030 (Desktop)
min:
2 fps, max:
13 fps
fps
1067%
GeForce GTX 1080 Max-Q:
81.1 [X] Acer Predator Triton 700 Intel Core i7-7700HQ 2.8GHz
GeForce GTX 1080 Max-Q
min:
39 fps
fps
100%
GeForce GT 1030 (Desktop):
6.5 [X] Zotac GT 1030 AMD Ryzen 7 2700X 3.7GHz
GeForce GT 1030 (Desktop)
min:
3 fps, max:
11 fps
fps
926%
GeForce GTX 1080 Max-Q:
60.2 [X] Acer Predator Triton 700 Intel Core i7-7700HQ 2.8GHz
GeForce GTX 1080 Max-Q
min:
30 fps
fps
100%
GeForce GT 1030 (Desktop):
5.5 [X] Zotac GT 1030 AMD Ryzen 7 2700X 3.7GHz
GeForce GT 1030 (Desktop)
min:
2 fps, max:
5 fps
fps
895%
GeForce GTX 1080 Max-Q:
49.2 [X] Acer Predator Triton 700 Intel Core i7-7700HQ 2.8GHz
GeForce GTX 1080 Max-Q
min:
26 fps
fps
GeForce GTX 1080 Max-Q:
37.3 [X] Acer Predator Triton 700 Intel Core i7-7700HQ 2.8GHz
GeForce GTX 1080 Max-Q
min:
22 fps
fps
GeForce GTX 1080 Max-Q:
22.5 [X] Acer Predator Triton 700 Intel Core i7-7700HQ 2.8GHz
GeForce GTX 1080 Max-Q
min:
15 fps
fps
100%
GeForce GT 1030 (Desktop):
63 [X] Zotac GT 1030 AMD Ryzen 7 2700X 3.7GHz
GeForce GT 1030 (Desktop)
min:
55 fps, max:
75 fps
fps
229%
GeForce GTX 1080 Max-Q:
144 [X] Acer Predator Triton 700 Intel Core i7-7700HQ 2.8GHz
GeForce GTX 1080 Max-Q
min:
143 fps
fps
100%
GeForce GT 1030 (Desktop):
26.4 [X] Zotac GT 1030 AMD Ryzen 7 2700X 3.7GHz
GeForce GT 1030 (Desktop)
min:
23 fps, max:
34 fps
fps
504%
GeForce GTX 1080 Max-Q:
133 [X] Acer Predator Triton 700 Intel Core i7-7700HQ 2.8GHz
GeForce GTX 1080 Max-Q
min:
121 fps
fps
100%
GeForce GT 1030 (Desktop):
20.7 [X] Zotac GT 1030 AMD Ryzen 7 2700X 3.7GHz
GeForce GT 1030 (Desktop)
min:
13 fps, max:
25 fps
fps
536%
GeForce GTX 1080 Max-Q:
111 [X] Acer Predator Triton 700 Intel Core i7-7700HQ 2.8GHz
GeForce GTX 1080 Max-Q
min:
98 fps
fps
100%
GeForce GT 1030 (Desktop):
19.1 [X] Zotac GT 1030 AMD Ryzen 7 2700X 3.7GHz
GeForce GT 1030 (Desktop)
min:
16 fps, max:
24 fps
fps
571%
GeForce GTX 1080 Max-Q:
109 [X] Acer Predator Triton 700 Intel Core i7-7700HQ 2.8GHz
GeForce GTX 1080 Max-Q
min:
89 fps
fps
GeForce GTX 1080 Max-Q:
71.6 [X] Acer Predator Triton 700 Intel Core i7-7700HQ 2.8GHz
GeForce GTX 1080 Max-Q
min:
57 fps
fps
GeForce GTX 1080 Max-Q:
36.5 [X] Acer Predator Triton 700 Intel Core i7-7700HQ 2.8GHz
GeForce GTX 1080 Max-Q
min:
32 fps
fps
100%
GeForce GT 1030 (Desktop):
42.1 [X] Zotac GT 1030 AMD Ryzen 7 2700X 3.7GHz
GeForce GT 1030 (Desktop)
min:
33 fps, max:
46 fps
fps
373%
GeForce GTX 1080 Max-Q:
157 [X] Acer Predator Triton 700 Intel Core i7-7700HQ 2.8GHz
GeForce GTX 1080 Max-Q
min:
145 fps
fps
300%
GeForce GTX 1070 Max-Q:
126.1 fps
100%
GeForce GT 1030 (Desktop):
27.1 [X] Zotac GT 1030 AMD Ryzen 7 2700X 3.7GHz
GeForce GT 1030 (Desktop)
min:
24 fps, max:
31 fps
fps
435%
GeForce GTX 1080 Max-Q:
118 [X] Acer Predator Triton 700 Intel Core i7-7700HQ 2.8GHz
GeForce GTX 1080 Max-Q
min:
108 fps
fps
318%
GeForce GTX 1070 Max-Q:
86.1 fps
100%
GeForce GT 1030 (Desktop):
20.5 [X] Zotac GT 1030 AMD Ryzen 7 2700X 3.7GHz
GeForce GT 1030 (Desktop)
min:
17 fps, max:
23 fps
fps
439%
GeForce GTX 1080 Max-Q:
90 [X] Acer Predator Triton 700 Intel Core i7-7700HQ 2.8GHz
GeForce GTX 1080 Max-Q
min:
83 fps
fps
384%
GeForce GTX 1070 Max-Q:
78.8 fps
100%
GeForce GT 1030 (Desktop):
18.5 [X] Zotac GT 1030 AMD Ryzen 7 2700X 3.7GHz
GeForce GT 1030 (Desktop)
min:
16 fps, max:
21 fps
fps
472%
GeForce GTX 1080 Max-Q:
87.4 [X] Acer Predator Triton 700 Intel Core i7-7700HQ 2.8GHz
GeForce GTX 1080 Max-Q
min:
78 fps
fps
409%
GeForce GTX 1070 Max-Q:
75.7 fps
GeForce GTX 1080 Max-Q:
58.3 [X] Acer Predator Triton 700 Intel Core i7-7700HQ 2.8GHz
GeForce GTX 1080 Max-Q
min:
54 fps
fps
100%
GeForce GT 1030 (Desktop):
4.2 [X] Zotac GT 1030 AMD Ryzen 7 2700X 3.7GHz
GeForce GT 1030 (Desktop)
min:
3 fps, max:
5 fps
fps
764%
GeForce GTX 1080 Max-Q:
32.1 [X] Acer Predator Triton 700 Intel Core i7-7700HQ 2.8GHz
GeForce GTX 1080 Max-Q
min:
27 fps
fps
100%
GeForce GT 1030 (Desktop):
125 [X] Zotac GT 1030 AMD Ryzen 7 2700X 3.7GHz
GeForce GT 1030 (Desktop)
min:
67 fps, max:
169 fps
fps
141%
GeForce GTX 1080 Max-Q:
176 [X] Acer Predator Triton 700 Intel Core i7-7700HQ 2.8GHz
GeForce GTX 1080 Max-Q
min:
97 fps
fps
135%
GeForce GTX 1070 Max-Q:
169.2 fps
100%
GeForce GT 1030 (Desktop):
32.7 [X] Zotac GT 1030 AMD Ryzen 7 2700X 3.7GHz
GeForce GT 1030 (Desktop)
min:
28 fps, max:
38 fps
fps
330%
GeForce GTX 1080 Max-Q:
108 [X] Acer Predator Triton 700 Intel Core i7-7700HQ 2.8GHz
GeForce GTX 1080 Max-Q
min:
72 fps
fps
257%
GeForce GTX 1070 Max-Q:
83.9 fps
100%
GeForce GT 1030 (Desktop):
25.6 [X] Zotac GT 1030 AMD Ryzen 7 2700X 3.7GHz
GeForce GT 1030 (Desktop)
min:
22 fps, max:
29 fps
fps
402%
GeForce GTX 1080 Max-Q:
103 [X] Acer Predator Triton 700 Intel Core i7-7700HQ 2.8GHz
GeForce GTX 1080 Max-Q
min:
67 fps
fps
267%
GeForce GTX 1070 Max-Q:
68.3 fps
100%
GeForce GT 1030 (Desktop):
21.4 [X] Zotac GT 1030 AMD Ryzen 7 2700X 3.7GHz
GeForce GT 1030 (Desktop)
min:
19 fps, max:
24 fps
fps
437%
GeForce GTX 1080 Max-Q:
93.6 [X] Acer Predator Triton 700 Intel Core i7-7700HQ 2.8GHz
GeForce GTX 1080 Max-Q
min:
61 fps
fps
279%
GeForce GTX 1070 Max-Q:
59.7 fps
GeForce GTX 1080 Max-Q:
68.9 [X] Acer Predator Triton 700 Intel Core i7-7700HQ 2.8GHz
GeForce GTX 1080 Max-Q
min:
57 fps
fps
100%
GeForce GT 1030 (Desktop):
4.6 [X] Zotac GT 1030 AMD Ryzen 7 2700X 3.7GHz
GeForce GT 1030 (Desktop)
min:
3 fps, max:
6 fps
fps
730%
GeForce GTX 1080 Max-Q:
33.6 [X] Acer Predator Triton 700 Intel Core i7-7700HQ 2.8GHz
GeForce GTX 1080 Max-Q
min:
29 fps
fps
100%
GeForce GT 1030 (Desktop):
71.5 [X] Zotac GT 1030 AMD Ryzen 7 2700X 3.7GHz
GeForce GT 1030 (Desktop)
min:
54 fps, max:
105 fps
fps
234%
GeForce GTX 1080 Max-Q:
167 [X] Acer Predator Triton 700 Intel Core i7-7700HQ 2.8GHz
GeForce GTX 1080 Max-Q
min:
113 fps
fps
197%
GeForce GTX 1070 Max-Q:
140.7 fps
100%
GeForce GT 1030 (Desktop):
30.7 [X] Zotac GT 1030 AMD Ryzen 7 2700X 3.7GHz
GeForce GT 1030 (Desktop)
min:
25 fps, max:
46 fps
fps
433%
GeForce GTX 1080 Max-Q:
133 [X] Acer Predator Triton 700 Intel Core i7-7700HQ 2.8GHz
GeForce GTX 1080 Max-Q
min:
86 fps
fps
263%
GeForce GTX 1070 Max-Q:
80.6 fps
100%
GeForce GT 1030 (Desktop):
25.7 [X] Zotac GT 1030 AMD Ryzen 7 2700X 3.7GHz
GeForce GT 1030 (Desktop)
min:
21 fps, max:
40 fps
fps
471%
GeForce GTX 1080 Max-Q:
121 [X] Acer Predator Triton 700 Intel Core i7-7700HQ 2.8GHz
GeForce GTX 1080 Max-Q
min:
81 fps
fps
315%
GeForce GTX 1070 Max-Q:
70 91.7 ~ 81 fps
100%
GeForce GT 1030 (Desktop):
20.2 [X] Zotac GT 1030 AMD Ryzen 7 2700X 3.7GHz
GeForce GT 1030 (Desktop)
min:
12 fps, max:
37 fps
fps
535%
GeForce GTX 1080 Max-Q:
108 [X] Acer Predator Triton 700 Intel Core i7-7700HQ 2.8GHz
GeForce GTX 1080 Max-Q
min:
77 fps
fps
371%
GeForce GTX 1070 Max-Q:
64.7 85.2 ~ 75 fps
GeForce GTX 1080 Max-Q:
81.7 [X] Acer Predator Triton 700 Intel Core i7-7700HQ 2.8GHz
GeForce GTX 1080 Max-Q
min:
65 fps
fps
100%
GeForce GT 1030 (Desktop):
1.2 [X] Zotac GT 1030 AMD Ryzen 7 2700X 3.7GHz
GeForce GT 1030 (Desktop)
max:
2 fps
fps
3733%
GeForce GTX 1080 Max-Q:
44.8 [X] Acer Predator Triton 700 Intel Core i7-7700HQ 2.8GHz
GeForce GTX 1080 Max-Q
min:
36 fps
fps
100%
GeForce GT 1030 (Desktop):
175.9 [X] Zotac GT 1030 AMD Ryzen 7 2700X 3.7GHz
GeForce GT 1030 (Desktop)
min:
147 fps, max:
224 fps
fps
95%
GeForce GTX 1080 Max-Q:
167 [X] Acer Predator Triton 700 Intel Core i7-7700HQ 2.8GHz
GeForce GTX 1080 Max-Q
min:
142 fps
fps
122%
GeForce GTX 1070 Max-Q:
214.4 fps
100%
GeForce GT 1030 (Desktop):
66.6 [X] Zotac GT 1030 AMD Ryzen 7 2700X 3.7GHz
GeForce GT 1030 (Desktop)
min:
56 fps, max:
89 fps
fps
195%
GeForce GTX 1080 Max-Q:
130 [X] Acer Predator Triton 700 Intel Core i7-7700HQ 2.8GHz
GeForce GTX 1080 Max-Q
min:
119 fps
fps
252%
GeForce GTX 1070 Max-Q:
167.6 fps
100%
GeForce GT 1030 (Desktop):
39.3 [X] Zotac GT 1030 AMD Ryzen 7 2700X 3.7GHz
GeForce GT 1030 (Desktop)
min:
33 fps, max:
58 fps
fps
290%
GeForce GTX 1080 Max-Q:
114 [X] Acer Predator Triton 700 Intel Core i7-7700HQ 2.8GHz
GeForce GTX 1080 Max-Q
min:
102 fps
fps
281%
GeForce GTX 1070 Max-Q:
110.4 fps
100%
GeForce GT 1030 (Desktop):
29.4 [X] Zotac GT 1030 AMD Ryzen 7 2700X 3.7GHz
GeForce GT 1030 (Desktop)
min:
23 fps, max:
45 fps
fps
347%
GeForce GTX 1080 Max-Q:
102 [X] Acer Predator Triton 700 Intel Core i7-7700HQ 2.8GHz
GeForce GTX 1080 Max-Q
min:
93 fps
fps
305%
GeForce GTX 1070 Max-Q:
89.6 fps
GeForce GTX 1080 Max-Q:
97 [X] Acer Predator Triton 700 Intel Core i7-7700HQ 2.8GHz
GeForce GTX 1080 Max-Q
min:
84 fps
fps
100%
GeForce GT 1030 (Desktop):
9 [X] Zotac GT 1030 AMD Ryzen 7 2700X 3.7GHz
GeForce GT 1030 (Desktop)
min:
7 fps, max:
17 fps
fps
100%
GeForce GT 1030 (Desktop):
54.3 [X] Zotac GT 1030 AMD Ryzen 7 2700X 3.7GHz
GeForce GT 1030 (Desktop)
min:
44 fps, max:
61 fps
fps
110%
GeForce GTX 1080 Max-Q:
60 [X] Acer Predator Triton 700 Intel Core i7-7700HQ 2.8GHz
GeForce GTX 1080 Max-Q
min:
57 fps
fps
100%
GeForce GT 1030 (Desktop):
21.6 [X] Zotac GT 1030 AMD Ryzen 7 2700X 3.7GHz
GeForce GT 1030 (Desktop)
min:
10 fps, max:
33 fps
fps
277%
GeForce GTX 1080 Max-Q:
59.9 [X] Acer Predator Triton 700 Intel Core i7-7700HQ 2.8GHz
GeForce GTX 1080 Max-Q
min:
55 fps
fps
100%
GeForce GT 1030 (Desktop):
16.5 [X] Zotac GT 1030 AMD Ryzen 7 2700X 3.7GHz
GeForce GT 1030 (Desktop)
min:
8 fps, max:
24 fps
fps
363%
GeForce GTX 1080 Max-Q:
59.9 [X] Acer Predator Triton 700 Intel Core i7-7700HQ 2.8GHz
GeForce GTX 1080 Max-Q
min:
54 fps
fps
364%
GeForce GTX 1070 Max-Q:
60 fps
GeForce GTX 1080 Max-Q:
59.8 [X] Acer Predator Triton 700 Intel Core i7-7700HQ 2.8GHz
GeForce GTX 1080 Max-Q
min:
54 fps
fps
GeForce GTX 1070 Max-Q:
60 fps
GeForce GTX 1080 Max-Q:
59.8 [X] Acer Predator Triton 700 Intel Core i7-7700HQ 2.8GHz
GeForce GTX 1080 Max-Q
min:
53 fps
fps
GeForce GTX 1080 Max-Q:
44.6 [X] Acer Predator Triton 700 Intel Core i7-7700HQ 2.8GHz
GeForce GTX 1080 Max-Q
min:
38 fps
fps
100%
GeForce GT 1030 (Desktop):
41.4 [X] Zotac GT 1030 AMD Ryzen 7 2700X 3.7GHz
GeForce GT 1030 (Desktop)
min:
32 fps, max:
63 fps
fps
183%
GeForce GTX 1080 Max-Q:
75.7 [X] Acer Predator Triton 700 Intel Core i7-7700HQ 2.8GHz
GeForce GTX 1080 Max-Q
min:
57 fps
fps
222%
GeForce GTX 1070 Max-Q:
92 fps
100%
GeForce GT 1030 (Desktop):
21.3 [X] Zotac GT 1030 AMD Ryzen 7 2700X 3.7GHz
GeForce GT 1030 (Desktop)
min:
18 fps, max:
26 fps
fps
349%
GeForce GTX 1080 Max-Q:
74.3 [X] Acer Predator Triton 700 Intel Core i7-7700HQ 2.8GHz
GeForce GTX 1080 Max-Q
min:
52 fps
fps
378%
GeForce GTX 1070 Max-Q:
80.5 fps
GeForce GTX 1080 Max-Q:
68.5 [X] Acer Predator Triton 700 Intel Core i7-7700HQ 2.8GHz
GeForce GTX 1080 Max-Q
min:
51 fps
fps
GeForce GTX 1070 Max-Q:
68.1 74.8 ~ 71 fps
GeForce GTX 1080 Max-Q:
68.1 [X] Acer Predator Triton 700 Intel Core i7-7700HQ 2.8GHz
GeForce GTX 1080 Max-Q
min:
50 fps
fps
GeForce GTX 1070 Max-Q:
66.3 68.8 ~ 68 fps
GeForce GTX 1080 Max-Q:
62.8 [X] Acer Predator Triton 700 Intel Core i7-7700HQ 2.8GHz
GeForce GTX 1080 Max-Q
min:
48 fps
fps
GeForce GTX 1080 Max-Q:
35.2 [X] Acer Predator Triton 700 Intel Core i7-7700HQ 2.8GHz
GeForce GTX 1080 Max-Q
min:
29 fps
fps
100%
GeForce GT 1030 (Desktop):
65.5 [X] Zotac GT 1030 AMD Ryzen 7 2700X 3.7GHz
GeForce GT 1030 (Desktop)
min:
40 fps, max:
90 fps
fps
208%
GeForce GTX 1080 Max-Q:
136 [X] Acer Predator Triton 700 Intel Core i7-7700HQ 2.8GHz
GeForce GTX 1080 Max-Q
min:
121 fps
fps
259%
GeForce GTX 1070 Max-Q:
169.8 fps
100%
GeForce GT 1030 (Desktop):
22 [X] Zotac GT 1030 AMD Ryzen 7 2700X 3.7GHz
GeForce GT 1030 (Desktop)
min:
12 fps, max:
30 fps
fps
527%
GeForce GTX 1080 Max-Q:
116 [X] Acer Predator Triton 700 Intel Core i7-7700HQ 2.8GHz
GeForce GTX 1080 Max-Q
min:
95 fps
fps
477%
GeForce GTX 1070 Max-Q:
105 fps
GeForce GTX 1080 Max-Q:
106 [X] Acer Predator Triton 700 Intel Core i7-7700HQ 2.8GHz
GeForce GTX 1080 Max-Q
min:
87 fps
fps
GeForce GTX 1070 Max-Q:
91.4 98.9 ~ 95 fps
GeForce GTX 1080 Max-Q:
102 [X] Acer Predator Triton 700 Intel Core i7-7700HQ 2.8GHz
GeForce GTX 1080 Max-Q
min:
80 fps
fps
GeForce GTX 1070 Max-Q:
84.7 93.3 ~ 89 fps
GeForce GTX 1080 Max-Q:
72.4 [X] Acer Predator Triton 700 Intel Core i7-7700HQ 2.8GHz
GeForce GTX 1080 Max-Q
min:
55 fps
fps
GeForce GTX 1080 Max-Q:
35.4 [X] Acer Predator Triton 700 Intel Core i7-7700HQ 2.8GHz
GeForce GTX 1080 Max-Q
min:
24 fps
fps
100%
GeForce GT 1030 (Desktop):
41 [X] Zotac GT 1030 AMD Ryzen 7 2700X 3.7GHz
GeForce GT 1030 (Desktop)
min:
26 fps, max:
66 fps
fps
210%
GeForce GTX 1080 Max-Q:
86 [X] Acer Predator Triton 700 Intel Core i7-7700HQ 2.8GHz
GeForce GTX 1080 Max-Q
min:
44 fps
fps
156%
GeForce GTX 1070 Max-Q:
64 fps
100%
GeForce GT 1030 (Desktop):
18 [X] Zotac GT 1030 AMD Ryzen 7 2700X 3.7GHz
GeForce GT 1030 (Desktop)
min:
11 fps, max:
26 fps
fps
433%
GeForce GTX 1080 Max-Q:
78 [X] Acer Predator Triton 700 Intel Core i7-7700HQ 2.8GHz
GeForce GTX 1080 Max-Q
min:
42 fps
fps
344%
GeForce GTX 1070 Max-Q:
62 fps
100%
GeForce GT 1030 (Desktop):
12 [X] Zotac GT 1030 AMD Ryzen 7 2700X 3.7GHz
GeForce GT 1030 (Desktop)
min:
4 fps, max:
20 fps
fps
592%
GeForce GTX 1080 Max-Q:
71 [X] Acer Predator Triton 700 Intel Core i7-7700HQ 2.8GHz
GeForce GTX 1080 Max-Q
min:
38 fps
fps
475%
GeForce GTX 1070 Max-Q:
52 61 ~ 57 fps
100%
GeForce GT 1030 (Desktop):
7 [X] Zotac GT 1030 AMD Ryzen 7 2700X 3.7GHz
GeForce GT 1030 (Desktop)
min:
4 fps, max:
12 fps
fps
771%
GeForce GTX 1080 Max-Q:
54 [X] Acer Predator Triton 700 Intel Core i7-7700HQ 2.8GHz
GeForce GTX 1080 Max-Q
min:
30 fps
fps
600%
GeForce GTX 1070 Max-Q:
39 44 ~ 42 fps
GeForce GTX 1080 Max-Q:
43 [X] Acer Predator Triton 700 Intel Core i7-7700HQ 2.8GHz
GeForce GTX 1080 Max-Q
min:
24 fps
fps
100%
GeForce GT 1030 (Desktop):
1 [X] Zotac GT 1030 AMD Ryzen 7 2700X 3.7GHz
GeForce GT 1030 (Desktop)
max:
31 fps
fps
2600%
GeForce GTX 1080 Max-Q:
26 [X] Acer Predator Triton 700 Intel Core i7-7700HQ 2.8GHz
GeForce GTX 1080 Max-Q
min:
17 fps
fps
2100%
GeForce GTX 1070 Max-Q:
21 fps
100%
GeForce GT 1030 (Desktop):
55 [X] Zotac GT 1030 AMD Ryzen 7 2700X 3.7GHz
GeForce GT 1030 (Desktop)
fps
262%
GeForce GTX 1080 Max-Q:
144 [X] Acer Predator Triton 700 Intel Core i7-7700HQ 2.8GHz
GeForce GTX 1080 Max-Q
min:
129 fps
fps
231%
GeForce GTX 1070 Max-Q:
127 fps
100%
GeForce GT 1030 (Desktop):
27 [X] Zotac GT 1030 AMD Ryzen 7 2700X 3.7GHz
GeForce GT 1030 (Desktop)
fps
459%
GeForce GTX 1080 Max-Q:
124 [X] Acer Predator Triton 700 Intel Core i7-7700HQ 2.8GHz
GeForce GTX 1080 Max-Q
min:
105 fps
fps
374%
GeForce GTX 1070 Max-Q:
101 fps
100%
GeForce GT 1030 (Desktop):
24 [X] Zotac GT 1030 AMD Ryzen 7 2700X 3.7GHz
GeForce GT 1030 (Desktop)
fps
508%
GeForce GTX 1080 Max-Q:
122 [X] Acer Predator Triton 700 Intel Core i7-7700HQ 2.8GHz
GeForce GTX 1080 Max-Q
min:
103 fps
fps
404%
GeForce GTX 1070 Max-Q:
95 99 ~ 97 fps
100%
GeForce GT 1030 (Desktop):
16 [X] Zotac GT 1030 AMD Ryzen 7 2700X 3.7GHz
GeForce GT 1030 (Desktop)
fps
663%
GeForce GTX 1080 Max-Q:
106 [X] Acer Predator Triton 700 Intel Core i7-7700HQ 2.8GHz
GeForce GTX 1080 Max-Q
min:
92 fps
fps
494%
GeForce GTX 1070 Max-Q:
78 80 ~ 79 fps
GeForce GTX 1080 Max-Q:
84 [X] Acer Predator Triton 700 Intel Core i7-7700HQ 2.8GHz
GeForce GTX 1080 Max-Q
min:
74 fps
fps
100%
GeForce GT 1030 (Desktop):
7 [X] Zotac GT 1030 AMD Ryzen 7 2700X 3.7GHz
GeForce GT 1030 (Desktop)
fps
786%
GeForce GTX 1080 Max-Q:
55 [X] Acer Predator Triton 700 Intel Core i7-7700HQ 2.8GHz
GeForce GTX 1080 Max-Q
min:
47 fps
fps
614%
GeForce GTX 1070 Max-Q:
43 fps
100%
GeForce GT 1030 (Desktop):
171.2 [X] Zotac GT 1030 AMD Ryzen 7 2700X 3.7GHz
GeForce GT 1030 (Desktop)
min:
147 fps, max:
190 fps
fps
167%
GeForce GTX 1080 Max-Q:
286 [X] Acer Predator Triton 700 Intel Core i7-7700HQ 2.8GHz
GeForce GTX 1080 Max-Q
min:
263 fps
fps
100%
GeForce GT 1030 (Desktop):
93 [X] Zotac GT 1030 AMD Ryzen 7 2700X 3.7GHz
GeForce GT 1030 (Desktop)
min:
86 fps, max:
102 fps
fps
280%
GeForce GTX 1080 Max-Q:
260 [X] Acer Predator Triton 700 Intel Core i7-7700HQ 2.8GHz
GeForce GTX 1080 Max-Q
min:
238 fps
fps
100%
GeForce GT 1030 (Desktop):
84.1 [X] Zotac GT 1030 AMD Ryzen 7 2700X 3.7GHz
GeForce GT 1030 (Desktop)
min:
67 fps, max:
95 fps
fps
285%
GeForce GTX 1080 Max-Q:
240 [X] Acer Predator Triton 700 Intel Core i7-7700HQ 2.8GHz
GeForce GTX 1080 Max-Q
min:
216 fps
fps
237%
GeForce GTX 1070 Max-Q:
199 fps
100%
GeForce GT 1030 (Desktop):
80.1 [X] Zotac GT 1030 AMD Ryzen 7 2700X 3.7GHz
GeForce GT 1030 (Desktop)
min:
73 fps, max:
95 fps
fps
298%
GeForce GTX 1080 Max-Q:
239 [X] Acer Predator Triton 700 Intel Core i7-7700HQ 2.8GHz
GeForce GTX 1080 Max-Q
min:
212 fps
fps
242%
GeForce GTX 1070 Max-Q:
194 fps
GeForce GTX 1080 Max-Q:
238 [X] Acer Predator Triton 700 Intel Core i7-7700HQ 2.8GHz
GeForce GTX 1080 Max-Q
min:
210 fps
fps
100%
GeForce GT 1030 (Desktop):
26 [X] Zotac GT 1030 AMD Ryzen 7 2700X 3.7GHz
GeForce GT 1030 (Desktop)
min:
24 fps, max:
30 fps
fps
538%
GeForce GTX 1080 Max-Q:
140 [X] Acer Predator Triton 700 Intel Core i7-7700HQ 2.8GHz
GeForce GTX 1080 Max-Q
min:
113 fps
fps
100%
GeForce GT 1030 (Desktop):
54 [X] Zotac GT 1030 AMD Ryzen 7 2700X 3.7GHz
GeForce GT 1030 (Desktop)
fps
217%
GeForce GTX 1080 Max-Q:
117 [X] Acer Predator Triton 700 Intel Core i7-7700HQ 2.8GHz
GeForce GTX 1080 Max-Q
min:
85 fps
fps
206%
GeForce GTX 1070 Max-Q:
91 130 ~ 111 fps
100%
GeForce GT 1030 (Desktop):
17 [X] Zotac GT 1030 AMD Ryzen 7 2700X 3.7GHz
GeForce GT 1030 (Desktop)
fps
547%
GeForce GTX 1080 Max-Q:
93 [X] Acer Predator Triton 700 Intel Core i7-7700HQ 2.8GHz
GeForce GTX 1080 Max-Q
min:
79 fps
fps
424%
GeForce GTX 1070 Max-Q:
65 78 ~ 72 fps
100%
GeForce GT 1030 (Desktop):
13 [X] Zotac GT 1030 AMD Ryzen 7 2700X 3.7GHz
GeForce GT 1030 (Desktop)
fps
677%
GeForce GTX 1080 Max-Q:
88 [X] Acer Predator Triton 700 Intel Core i7-7700HQ 2.8GHz
GeForce GTX 1080 Max-Q
min:
76 fps
fps
515%
GeForce GTX 1070 Max-Q:
62 67 72 ~ 67 fps
100%
GeForce GT 1030 (Desktop):
10 [X] Zotac GT 1030 AMD Ryzen 7 2700X 3.7GHz
GeForce GT 1030 (Desktop)
fps
780%
GeForce GTX 1080 Max-Q:
78 [X] Acer Predator Triton 700 Intel Core i7-7700HQ 2.8GHz
GeForce GTX 1080 Max-Q
min:
64 fps
fps
590%
GeForce GTX 1070 Max-Q:
58 58 61 ~ 59 fps
GeForce GTX 1080 Max-Q:
40.3 [X] Asus Zephyrus GX501 Intel Core i7-7700HQ 2.8GHz
GeForce GTX 1080 Max-Q
max:
85.8 fps
50 [X] Acer Predator Triton 700 Intel Core i7-7700HQ 2.8GHz
GeForce GTX 1080 Max-Q
min:
43 fps
~ 45 fps
100%
GeForce GT 1030 (Desktop):
2 [X] Zotac GT 1030 AMD Ryzen 7 2700X 3.7GHz
GeForce GT 1030 (Desktop)
fps
1350%
GeForce GTX 1080 Max-Q:
27 [X] Acer Predator Triton 700 Intel Core i7-7700HQ 2.8GHz
GeForce GTX 1080 Max-Q
min:
22 fps
fps
1000%
GeForce GTX 1070 Max-Q:
20 fps
100%
GeForce GT 1030 (Desktop):
79 [X] Zotac GeForce GT 1030 1.47.22.14 D3D12
AMD Ryzen 9 3900X 3.8GHz
GeForce GT 1030 (Desktop)
min:
66.4 fps, P1:
67.9 fps, max:
102 fps
fps
286%
GeForce GTX 1080 Max-Q:
226 [X] Asus Zephyrus GX501 1.47.22.14 D3D12
Intel Core i7-7700HQ 2.8GHz
GeForce GTX 1080 Max-Q
min:
121 fps, P1:
143 fps, max:
348 fps
fps
100%
GeForce GT 1030 (Desktop):
28 [X] Zotac GeForce GT 1030 1.47.22.14 D3D12
AMD Ryzen 9 3900X 3.8GHz
GeForce GT 1030 (Desktop)
min:
24.7 fps, P1:
25.2 fps, max:
34.7 fps
fps
611%
GeForce GTX 1080 Max-Q:
171 [X] Asus Zephyrus GX501 1.47.22.14 D3D12
Intel Core i7-7700HQ 2.8GHz
GeForce GTX 1080 Max-Q
min:
59.2 fps, P1:
102 fps, max:
290 fps
fps
100%
GeForce GT 1030 (Desktop):
18.8 [X] Zotac GeForce GT 1030 1.47.22.14 D3D12
AMD Ryzen 9 3900X 3.8GHz
GeForce GT 1030 (Desktop)
min:
14.7 fps, P1:
15 fps, max:
25.9 fps
fps
702%
GeForce GTX 1080 Max-Q:
132 [X] Asus Zephyrus GX501 1.47.22.14 D3D12
Intel Core i7-7700HQ 2.8GHz
GeForce GTX 1080 Max-Q
min:
41.1 fps, P1:
56.3 fps, max:
275 fps
fps
100%
GeForce GT 1030 (Desktop):
16.3 [X] Zotac GeForce GT 1030 1.47.22.14 D3D12
AMD Ryzen 9 3900X 3.8GHz
GeForce GT 1030 (Desktop)
min:
12.9 fps, P1:
13 fps, max:
22.4 fps
fps
687%
GeForce GTX 1080 Max-Q:
112 [X] Asus Zephyrus GX501 1.47.22.14 D3D12
Intel Core i7-7700HQ 2.8GHz
GeForce GTX 1080 Max-Q
min:
41 fps, P1:
56.7 fps, max:
216 fps
fps
100%
GeForce GT 1030 (Desktop):
11 [X] Zotac GeForce GT 1030 1.47.22.14 D3D12
AMD Ryzen 9 3900X 3.8GHz
GeForce GT 1030 (Desktop)
min:
8.6 fps, P1:
8.64 fps, max:
14.9 fps
fps
736%
GeForce GTX 1080 Max-Q:
81 [X] Asus Zephyrus GX501 1.47.22.14 D3D12
Intel Core i7-7700HQ 2.8GHz
GeForce GTX 1080 Max-Q
min:
49 fps, P1:
66.7 fps, max:
170 fps
fps
100%
GeForce GT 1030 (Desktop):
5.9 [X] Zotac GeForce GT 1030 1.47.22.14 D3D12
AMD Ryzen 9 3900X 3.8GHz
GeForce GT 1030 (Desktop)
min:
5 fps, P1:
5 fps, max:
8.4 fps
fps
786%
GeForce GTX 1080 Max-Q:
46.4 [X] Asus Zephyrus GX501 1.47.22.14 D3D12
Intel Core i7-7700HQ 2.8GHz
GeForce GTX 1080 Max-Q
min:
37.5 fps, P1:
39.4 fps, max:
63.1 fps
fps
100%
GeForce GT 1030 (Desktop):
72 [X] Zotac GT 1030 AMD Ryzen 7 2700X 3.7GHz
GeForce GT 1030 (Desktop)
min:
62 fps, max:
87 fps
fps
283%
GeForce GTX 1080 Max-Q:
204 [X] Acer Predator Triton 700 Intel Core i7-7700HQ 2.8GHz
GeForce GTX 1080 Max-Q
min:
156 fps
fps
226%
GeForce GTX 1070 Max-Q:
163 fps
100%
GeForce GT 1030 (Desktop):
37 [X] Zotac GT 1030 AMD Ryzen 7 2700X 3.7GHz
GeForce GT 1030 (Desktop)
min:
32 fps, max:
46 fps
fps
468%
GeForce GTX 1080 Max-Q:
173 [X] Acer Predator Triton 700 Intel Core i7-7700HQ 2.8GHz
GeForce GTX 1080 Max-Q
min:
148 fps
fps
351%
GeForce GTX 1070 Max-Q:
130 fps
100%
GeForce GT 1030 (Desktop):
29 [X] Zotac GT 1030 AMD Ryzen 7 2700X 3.7GHz
GeForce GT 1030 (Desktop)
min:
25 fps, max:
33 fps
fps
476%
GeForce GTX 1080 Max-Q:
138 [X] Acer Predator Triton 700 Intel Core i7-7700HQ 2.8GHz
GeForce GTX 1080 Max-Q
min:
118 fps
fps
366%
GeForce GTX 1070 Max-Q:
100 108 110 ~ 106 fps
100%
GeForce GT 1030 (Desktop):
17 [X] Zotac GT 1030 AMD Ryzen 7 2700X 3.7GHz
GeForce GT 1030 (Desktop)
min:
14 fps, max:
19 fps
fps
559%
GeForce GTX 1080 Max-Q:
95 [X] Acer Predator Triton 700 Intel Core i7-7700HQ 2.8GHz
GeForce GTX 1080 Max-Q
min:
78 fps
fps
435%
GeForce GTX 1070 Max-Q:
70 76 76 ~ 74 fps
GeForce GTX 1080 Max-Q:
74 [X] Acer Predator Triton 700 Intel Core i7-7700HQ 2.8GHz
GeForce GTX 1080 Max-Q
min:
67 fps
fps
100%
GeForce GT 1030 (Desktop):
7 [X] Zotac GT 1030 AMD Ryzen 7 2700X 3.7GHz
GeForce GT 1030 (Desktop)
min:
3 fps, max:
12 fps
fps
843%
GeForce GTX 1070 Max-Q:
59 fps
100%
GeForce GT 1030 (Desktop):
57 [X] Zotac GT 1030 AMD Ryzen 7 2700X 3.7GHz
GeForce GT 1030 (Desktop)
min:
47 fps, max:
61 fps
fps
172%
GeForce GTX 1080 Max-Q:
97.8 [X] Acer Predator Triton 700 Intel Core i7-7700HQ 2.8GHz
GeForce GTX 1080 Max-Q
min:
91 fps
fps
275%
GeForce GTX 1070 Max-Q:
156.5 fps
100%
GeForce GT 1030 (Desktop):
21.3 [X] Zotac GT 1030 AMD Ryzen 7 2700X 3.7GHz
GeForce GT 1030 (Desktop)
min:
17 fps, max:
25 fps
fps
431%
GeForce GTX 1080 Max-Q:
91.8 [X] Acer Predator Triton 700 Intel Core i7-7700HQ 2.8GHz
GeForce GTX 1080 Max-Q
min:
80 fps
fps
415%
GeForce GTX 1070 Max-Q:
88.4 fps
100%
GeForce GT 1030 (Desktop):
19.3 [X] Zotac GT 1030 AMD Ryzen 7 2700X 3.7GHz
GeForce GT 1030 (Desktop)
min:
16 fps, max:
23 fps
fps
451%
GeForce GTX 1080 Max-Q:
87.1 [X] Acer Predator Triton 700 Intel Core i7-7700HQ 2.8GHz
GeForce GTX 1080 Max-Q
min:
71 fps
fps
404%
GeForce GTX 1070 Max-Q:
74.8 80.4 ~ 78 fps
100%
GeForce GT 1030 (Desktop):
14.2 [X] Zotac GT 1030 AMD Ryzen 7 2700X 3.7GHz
GeForce GT 1030 (Desktop)
min:
11 fps, max:
19 fps
fps
522%
GeForce GTX 1080 Max-Q:
74.1 [X] Acer Predator Triton 700 Intel Core i7-7700HQ 2.8GHz
GeForce GTX 1080 Max-Q
min:
60 fps
fps
415%
GeForce GTX 1070 Max-Q:
56.9 60.3 ~ 59 fps
GeForce GTX 1080 Max-Q:
44.8 [X] Acer Predator Triton 700 Intel Core i7-7700HQ 2.8GHz
GeForce GTX 1080 Max-Q
min:
38 fps
fps
GeForce GTX 1080 Max-Q:
21.3 [X] Acer Predator Triton 700 Intel Core i7-7700HQ 2.8GHz
GeForce GTX 1080 Max-Q
min:
18 fps
fps
GeForce GTX 1080 Max-Q:
60 [X] Asus Zephyrus GX501 Intel Core i7-7700HQ 2.8GHz
GeForce GTX 1080 Max-Q
fps
GeForce GTX 1080 Max-Q:
60 [X] Asus Zephyrus GX501 Intel Core i7-7700HQ 2.8GHz
GeForce GTX 1080 Max-Q
fps
GeForce GTX 1080 Max-Q:
60 [X] Asus Zephyrus GX501 Intel Core i7-7700HQ 2.8GHz
GeForce GTX 1080 Max-Q
fps
GeForce GTX 1070 Max-Q:
60 60 ~ 60 fps
GeForce GTX 1080 Max-Q:
60 [X] Asus Zephyrus GX501 Intel Core i7-7700HQ 2.8GHz
GeForce GTX 1080 Max-Q
min:
59 fps, max:
62 fps
fps
GeForce GTX 1070 Max-Q:
60 60 ~ 60 fps
GeForce GTX 1080 Max-Q:
60 [X] Asus Zephyrus GX501 Intel Core i7-7700HQ 2.8GHz
GeForce GTX 1080 Max-Q
min:
58 fps, max:
61 fps
fps
GeForce GTX 1080 Max-Q:
36.4 [X] Asus Zephyrus GX501 Intel Core i7-7700HQ 2.8GHz
GeForce GTX 1080 Max-Q
min:
30 fps, max:
40 fps
fps
100%
GeForce GT 1030 (Desktop):
47 [X] Zotac GT 1030 AMD Ryzen 7 2700X 3.7GHz
GeForce GT 1030 (Desktop)
min:
38 fps, max:
55 fps
fps
219%
GeForce GTX 1080 Max-Q:
103 [X] Asus Zephyrus GX501 Intel Core i7-7700HQ 2.8GHz
GeForce GTX 1080 Max-Q
min:
82 fps, max:
135 fps
fps
219%
GeForce GTX 1070 Max-Q:
103 fps
100%
GeForce GT 1030 (Desktop):
19 [X] Zotac GT 1030 AMD Ryzen 7 2700X 3.7GHz
GeForce GT 1030 (Desktop)
min:
14 fps, max:
29 fps
fps
479%
GeForce GTX 1080 Max-Q:
91 [X] Asus Zephyrus GX501 Intel Core i7-7700HQ 2.8GHz
GeForce GTX 1080 Max-Q
min:
76 fps, max:
111 fps
fps
426%
GeForce GTX 1070 Max-Q:
81 fps
100%
GeForce GT 1030 (Desktop):
17 [X] Zotac GT 1030 AMD Ryzen 7 2700X 3.7GHz
GeForce GT 1030 (Desktop)
min:
12 fps, max:
24 fps
fps
524%
GeForce GTX 1080 Max-Q:
89 [X] Asus Zephyrus GX501 Intel Core i7-7700HQ 2.8GHz
GeForce GTX 1080 Max-Q
min:
73 fps, max:
108 fps
fps
465%
GeForce GTX 1070 Max-Q:
76 77 79 83 ~ 79 fps
100%
GeForce GT 1030 (Desktop):
15 [X] Zotac GT 1030 AMD Ryzen 7 2700X 3.7GHz
GeForce GT 1030 (Desktop)
min:
11 fps, max:
21 fps
fps
567%
GeForce GTX 1080 Max-Q:
85 [X] Asus Zephyrus GX501 Intel Core i7-7700HQ 2.8GHz
GeForce GTX 1080 Max-Q
min:
67 fps, max:
104 fps
fps
500%
GeForce GTX 1070 Max-Q:
72 74 75 78 ~ 75 fps
GeForce GTX 1080 Max-Q:
66 [X] Asus Zephyrus GX501 Intel Core i7-7700HQ 2.8GHz
GeForce GTX 1080 Max-Q
min:
58 fps, max:
77 fps
fps
GeForce GTX 1080 Max-Q:
34 [X] Asus Zephyrus GX501 Intel Core i7-7700HQ 2.8GHz
GeForce GTX 1080 Max-Q
min:
28 fps, max:
42 fps
fps
GeForce GTX 1070 Max-Q:
27 fps
GeForce GTX 1080 Max-Q:
82.3 89.5 [X] Asus Zephyrus GX501 Intel Core i7-7700HQ 2.8GHz
GeForce GTX 1080 Max-Q
~ 86 fps
GeForce GTX 1070 Max-Q:
109 fps
GeForce GTX 1080 Max-Q:
79.2 80 [X] Asus Zephyrus GX501 Intel Core i7-7700HQ 2.8GHz
GeForce GTX 1080 Max-Q
~ 80 fps
GeForce GTX 1070 Max-Q:
96.5 fps
GeForce GTX 1080 Max-Q:
66.9 [X] Asus Zephyrus GX501 Intel Core i7-7700HQ 2.8GHz
GeForce GTX 1080 Max-Q
68.8 ~ 68 fps
GeForce GTX 1070 Max-Q:
81.1 fps
GeForce GTX 1080 Max-Q:
58.7 [X] Asus Zephyrus GX501 Intel Core i7-7700HQ 2.8GHz
GeForce GTX 1080 Max-Q
60.4 ~ 60 fps
100%
GeForce GT 1030 (Desktop):
50.4 [X] Intel Xeon E5-2680 v4 2.4GHz
GeForce GT 1030 (Desktop)
min:
40 fps, max:
59 fps
fps
240%
GeForce GTX 1080 Max-Q:
121 [X] Asus Zephyrus GX501 Intel Core i7-7700HQ 2.8GHz
GeForce GTX 1080 Max-Q
min:
103 fps, max:
145 fps
fps
100%
GeForce GT 1030 (Desktop):
20.5 [X] Intel Xeon E5-2680 v4 2.4GHz
GeForce GT 1030 (Desktop)
min:
15 fps, max:
25 fps
fps
463%
GeForce GTX 1080 Max-Q:
95 [X] Asus Zephyrus GX501 Intel Core i7-7700HQ 2.8GHz
GeForce GTX 1080 Max-Q
min:
74 fps, max:
115 fps
fps
GeForce GTX 1080 Max-Q:
77 [X] Asus Zephyrus GX501 Intel Core i7-7700HQ 2.8GHz
GeForce GTX 1080 Max-Q
min:
56 fps, max:
103 fps
fps
GeForce GTX 1080 Max-Q:
62 [X] Asus Zephyrus GX501 Intel Core i7-7700HQ 2.8GHz
GeForce GTX 1080 Max-Q
min:
49 fps, max:
73 fps
fps
GeForce GTX 1080 Max-Q:
42 [X] Asus Zephyrus GX501 Intel Core i7-7700HQ 2.8GHz
GeForce GTX 1080 Max-Q
min:
35 fps, max:
49 fps
fps
GeForce GTX 1080 Max-Q:
20.2 [X] Asus Zephyrus GX501 Intel Core i7-7700HQ 2.8GHz
GeForce GTX 1080 Max-Q
min:
16 fps, max:
24 fps
fps
100%
GeForce GT 1030 (Desktop):
32 [X] Intel Xeon E5-2680 v4 2.4GHz
GeForce GT 1030 (Desktop)
min:
23 fps, max:
41 fps
fps
375%
GeForce GTX 1080 Max-Q:
110 [X] Asus Zephyrus GX501 1.3
Intel Core i7-7700HQ 2.8GHz
GeForce GTX 1080 Max-Q
130 ~ 120 fps
100%
GeForce GT 1030 (Desktop):
15.3 [X] Intel Xeon E5-2680 v4 2.4GHz
GeForce GT 1030 (Desktop)
min:
6 fps, max:
21 fps
fps
575%
GeForce GTX 1080 Max-Q:
86 89.6 [X] Asus Zephyrus GX501 1.3
Intel Core i7-7700HQ 2.8GHz
GeForce GTX 1080 Max-Q
~ 88 fps
GeForce GTX 1080 Max-Q:
64 70.8 [X] Asus Zephyrus GX501 1.3
Intel Core i7-7700HQ 2.8GHz
GeForce GTX 1080 Max-Q
~ 67 fps
GeForce GTX 1080 Max-Q:
54 [X] Asus Zephyrus GX501 1.3
Intel Core i7-7700HQ 2.8GHz
GeForce GTX 1080 Max-Q
fps
GeForce GTX 1080 Max-Q:
27.2 29.9 [X] Asus Zephyrus GX501 1.3
Intel Core i7-7700HQ 2.8GHz
GeForce GTX 1080 Max-Q
~ 29 fps
100%
GeForce GT 1030 (Desktop):
162.4 [X] Intel Xeon E5-2680 v4 2.4GHz
GeForce GT 1030 (Desktop)
min:
114 fps, max:
217 fps
fps
159%
GeForce GTX 1080 Max-Q:
258 [X] Asus Zephyrus GX501 Intel Core i7-7700HQ 2.8GHz
GeForce GTX 1080 Max-Q
min:
189 fps, max:
335 fps
fps
100%
GeForce GT 1030 (Desktop):
47 [X] Intel Xeon E5-2680 v4 2.4GHz
GeForce GT 1030 (Desktop)
min:
6 fps, max:
59 fps
fps
400%
GeForce GTX 1080 Max-Q:
188 [X] Asus Zephyrus GX501 Intel Core i7-7700HQ 2.8GHz
GeForce GTX 1080 Max-Q
min:
157 fps, max:
257 fps
fps
100%
GeForce GT 1030 (Desktop):
36 [X] Intel Xeon E5-2680 v4 2.4GHz
GeForce GT 1030 (Desktop)
min:
28 fps, max:
42 fps
fps
353%
GeForce GTX 1080 Max-Q:
127 [X] Asus Zephyrus GX501 Intel Core i7-7700HQ 2.8GHz
GeForce GTX 1080 Max-Q
min:
110 fps, max:
155 fps
fps
336%
GeForce GTX 1070 Max-Q:
113 122 127 ~ 121 fps
100%
GeForce GT 1030 (Desktop):
24.5 [X] Intel Xeon E5-2680 v4 2.4GHz
GeForce GT 1030 (Desktop)
min:
1 fps, max:
29 fps
fps
445%
GeForce GTX 1080 Max-Q:
109 [X] Asus Zephyrus GX501 Intel Core i7-7700HQ 2.8GHz
GeForce GTX 1080 Max-Q
min:
98 fps, max:
126 fps
fps
412%
GeForce GTX 1070 Max-Q:
96.1 101 105 ~ 101 fps
GeForce GTX 1080 Max-Q:
64 [X] Asus Zephyrus GX501 Intel Core i7-7700HQ 2.8GHz
GeForce GTX 1080 Max-Q
min:
59 fps, max:
71 fps
fps
GeForce GTX 1080 Max-Q:
33.5 [X] Asus Zephyrus GX501 Intel Core i7-7700HQ 2.8GHz
GeForce GTX 1080 Max-Q
min:
31 fps, max:
36 fps
fps
100%
GeForce GT 1030 (Desktop):
97.9 [X] Intel Xeon E5-2680 v4 2.4GHz
GeForce GT 1030 (Desktop)
min:
88 fps, max:
107 fps
fps
210%
GeForce GTX 1080 Max-Q:
206 [X] Asus Zephyrus GX501 Intel Core i7-7700HQ 2.8GHz
GeForce GTX 1080 Max-Q
min:
170 fps, max:
237 fps
fps
100%
GeForce GT 1030 (Desktop):
23.1 [X] Intel Xeon E5-2680 v4 2.4GHz
GeForce GT 1030 (Desktop)
min:
16 fps, max:
28 fps
fps
623%
GeForce GTX 1080 Max-Q:
144 [X] Asus Zephyrus GX501 Intel Core i7-7700HQ 2.8GHz
GeForce GTX 1080 Max-Q
min:
128 fps, max:
159 fps
fps
100%
GeForce GT 1030 (Desktop):
19.1 [X] Intel Xeon E5-2680 v4 2.4GHz
GeForce GT 1030 (Desktop)
min:
12 fps, max:
23 fps
fps
670%
GeForce GTX 1080 Max-Q:
128 [X] Asus Zephyrus GX501 Intel Core i7-7700HQ 2.8GHz
GeForce GTX 1080 Max-Q
min:
113 fps, max:
142 fps
fps
100%
GeForce GT 1030 (Desktop):
15.8 [X] Intel Xeon E5-2680 v4 2.4GHz
GeForce GT 1030 (Desktop)
min:
7 fps, max:
21 fps
fps
677%
GeForce GTX 1080 Max-Q:
107 [X] Asus Zephyrus GX501 Intel Core i7-7700HQ 2.8GHz
GeForce GTX 1080 Max-Q
min:
92 fps, max:
119 fps
fps
GeForce GTX 1080 Max-Q:
71 [X] Asus Zephyrus GX501 Intel Core i7-7700HQ 2.8GHz
GeForce GTX 1080 Max-Q
min:
63 fps, max:
79 fps
fps
100%
GeForce GT 1030 (Desktop):
3.5 [X] Intel Xeon E5-2680 v4 2.4GHz
GeForce GT 1030 (Desktop)
min:
2 fps, max:
6 fps
fps
1014%
GeForce GTX 1080 Max-Q:
35.5 [X] Asus Zephyrus GX501 Intel Core i7-7700HQ 2.8GHz
GeForce GTX 1080 Max-Q
min:
31 fps, max:
41 fps
fps
100%
GeForce GT 1030 (Desktop):
69.5 [X] Intel Xeon E5-2680 v4 2.4GHz
GeForce GT 1030 (Desktop)
min:
51 fps, max:
94 fps
fps
162%
GeForce GTX 1070 Max-Q:
112.4 fps
100%
GeForce GT 1030 (Desktop):
33 [X] Intel Xeon E5-2680 v4 2.4GHz
GeForce GT 1030 (Desktop)
min:
19 fps, max:
39 fps
fps
291%
GeForce GTX 1070 Max-Q:
95.9 fps
100%
GeForce GT 1030 (Desktop):
28 [X] Intel Xeon E5-2680 v4 2.4GHz
GeForce GT 1030 (Desktop)
min:
17 fps, max:
34 fps
fps
100%
GeForce GT 1030 (Desktop):
25.1 [X] Intel Xeon E5-2680 v4 2.4GHz
GeForce GT 1030 (Desktop)
min:
15 fps, max:
31 fps
fps
442%
GeForce GTX 1080 Max-Q:
111 [X] Asus Zephyrus GX501 Intel Core i7-7700HQ 2.8GHz
GeForce GTX 1080 Max-Q
min:
74 fps, max:
143 fps
fps
100%
GeForce GT 1030 (Desktop):
3.8 [X] Intel Xeon E5-2680 v4 2.4GHz
GeForce GT 1030 (Desktop)
min:
2 fps, max:
5 fps
fps
1108%
GeForce GTX 1080 Max-Q:
42.1 [X] Asus Zephyrus GX501 Intel Core i7-7700HQ 2.8GHz
GeForce GTX 1080 Max-Q
min:
27 fps, max:
51 fps
fps
GeForce GTX 1080 Max-Q:
190 [X] Asus Zephyrus GX501 Intel Core i7-7700HQ 2.8GHz
GeForce GTX 1080 Max-Q
min:
121 fps, max:
280 fps
fps
GeForce GTX 1070 Max-Q:
163.3 fps
GeForce GTX 1080 Max-Q:
199 [X] Asus Zephyrus GX501 Intel Core i7-7700HQ 2.8GHz
GeForce GTX 1080 Max-Q
min:
121 fps, max:
262 fps
fps
GeForce GTX 1070 Max-Q:
133.5 fps
GeForce GTX 1080 Max-Q:
134 [X] Asus Zephyrus GX501 Intel Core i7-7700HQ 2.8GHz
GeForce GTX 1080 Max-Q
min:
85 fps, max:
166 fps
fps
GeForce GTX 1080 Max-Q:
111 [X] Asus Zephyrus GX501 Intel Core i7-7700HQ 2.8GHz
GeForce GTX 1080 Max-Q
min:
74 fps, max:
145 fps
fps
GeForce GTX 1070 Max-Q:
86 94 101 ~ 94 fps
GeForce GTX 1080 Max-Q:
88 [X] Asus Zephyrus GX501 Intel Core i7-7700HQ 2.8GHz
GeForce GTX 1080 Max-Q
min:
71 fps, max:
105 fps
fps
GeForce GTX 1080 Max-Q:
53.3 [X] Asus Zephyrus GX501 Intel Core i7-7700HQ 2.8GHz
GeForce GTX 1080 Max-Q
min:
43 fps, max:
63 fps
fps
100%
GeForce GT 1030 (Desktop):
30.6 [X] Intel Xeon E5-2680 v4 2.4GHz
GeForce GT 1030 (Desktop)
fps
100%
GeForce GT 1030 (Desktop):
17.8 [X] Intel Xeon E5-2680 v4 2.4GHz
GeForce GT 1030 (Desktop)
fps
100%
GeForce GT 1030 (Desktop):
15.3 [X] Intel Xeon E5-2680 v4 2.4GHz
GeForce GT 1030 (Desktop)
fps
100%
GeForce GT 1030 (Desktop):
13 [X] Intel Xeon E5-2680 v4 2.4GHz
GeForce GT 1030 (Desktop)
fps
GeForce GTX 1080 Max-Q:
39.7 [X] Asus Zephyrus GX501 Intel Core i7-7700HQ 2.8GHz
GeForce GTX 1080 Max-Q
fps
100%
GeForce GT 1030 (Desktop):
46 [X] Intel Xeon E5-2680 v4 2.4GHz
GeForce GT 1030 (Desktop)
fps
154%
GeForce GTX 1080 Max-Q:
71 [X] Asus Zephyrus GX501 Intel Core i7-7700HQ 2.8GHz
GeForce GTX 1080 Max-Q
min:
37 fps, max:
91 fps
fps
146%
GeForce GTX 1070 Max-Q:
63 70 ~ 67 fps
100%
GeForce GT 1030 (Desktop):
22 [X] Intel Xeon E5-2680 v4 2.4GHz
GeForce GT 1030 (Desktop)
fps
300%
GeForce GTX 1080 Max-Q:
66 [X] Asus Zephyrus GX501 Intel Core i7-7700HQ 2.8GHz
GeForce GTX 1080 Max-Q
min:
35 fps, max:
84 fps
fps
268%
GeForce GTX 1070 Max-Q:
53 64 ~ 59 fps
100%
GeForce GT 1030 (Desktop):
17 [X] Intel Xeon E5-2680 v4 2.4GHz
GeForce GT 1030 (Desktop)
fps
365%
GeForce GTX 1080 Max-Q:
62 [X] Asus Zephyrus GX501 Intel Core i7-7700HQ 2.8GHz
GeForce GTX 1080 Max-Q
min:
30 fps, max:
97 fps
fps
376%
GeForce GTX 1070 Max-Q:
52 62 71 71 ~ 64 fps
100%
GeForce GT 1030 (Desktop):
13 [X] Intel Xeon E5-2680 v4 2.4GHz
GeForce GT 1030 (Desktop)
fps
446%
GeForce GTX 1080 Max-Q:
58 [X] Asus Zephyrus GX501 Intel Core i7-7700HQ 2.8GHz
GeForce GTX 1080 Max-Q
min:
30 fps, max:
98 fps
fps
423%
GeForce GTX 1070 Max-Q:
44 53 61 61 ~ 55 fps
GeForce GTX 1080 Max-Q:
52 [X] Asus Zephyrus GX501 Intel Core i7-7700HQ 2.8GHz
GeForce GTX 1080 Max-Q
min:
21 fps, max:
79 fps
fps
GeForce GTX 1080 Max-Q:
35 [X] Asus Zephyrus GX501 Intel Core i7-7700HQ 2.8GHz
GeForce GTX 1080 Max-Q
min:
11 fps, max:
65 fps
fps
GeForce GTX 1070 Max-Q:
26 fps
100%
GeForce GT 1030 (Desktop):
68.6 [X] Intel Xeon E5-2680 v4 2.4GHz
GeForce GT 1030 (Desktop)
fps
181%
GeForce GTX 1080 Max-Q:
124 [X] Asus Zephyrus GX501 Intel Core i7-7700HQ 2.8GHz
GeForce GTX 1080 Max-Q
fps
222%
GeForce GTX 1070 Max-Q:
152.6 fps
100%
GeForce GT 1030 (Desktop):
35.9 [X] Intel Xeon E5-2680 v4 2.4GHz
GeForce GT 1030 (Desktop)
fps
340%
GeForce GTX 1080 Max-Q:
122 [X] Asus Zephyrus GX501 Intel Core i7-7700HQ 2.8GHz
GeForce GTX 1080 Max-Q
fps
383%
GeForce GTX 1070 Max-Q:
137.4 fps
100%
GeForce GT 1030 (Desktop):
32.6 [X] Intel Xeon E5-2680 v4 2.4GHz
GeForce GT 1030 (Desktop)
fps
374%
GeForce GTX 1080 Max-Q:
122 [X] Asus Zephyrus GX501 Intel Core i7-7700HQ 2.8GHz
GeForce GTX 1080 Max-Q
fps
401%
GeForce GTX 1070 Max-Q:
130.8 fps
100%
GeForce GT 1030 (Desktop):
25.5 [X] Intel Xeon E5-2680 v4 2.4GHz
GeForce GT 1030 (Desktop)
fps
451%
GeForce GTX 1080 Max-Q:
115 [X] Asus Zephyrus GX501 Intel Core i7-7700HQ 2.8GHz
GeForce GTX 1080 Max-Q
fps
435%
GeForce GTX 1070 Max-Q:
111 fps
100%
GeForce GT 1030 (Desktop):
7.3 [X] Intel Xeon E5-2680 v4 2.4GHz
GeForce GT 1030 (Desktop)
fps
438%
GeForce GTX 1080 Max-Q:
32 [X] Asus Zephyrus GX501 Intel Core i7-7700HQ 2.8GHz
GeForce GTX 1080 Max-Q
fps
100%
GeForce GT 1030 (Desktop):
55.7 [X] Intel Xeon E5-2680 v4 2.4GHz
GeForce GT 1030 (Desktop)
min:
51 fps, max:
65 fps
fps
196%
GeForce GTX 1080 Max-Q:
109 [X] Asus Zephyrus GX501 Intel Core i7-7700HQ 2.8GHz
GeForce GTX 1080 Max-Q
min:
96 fps, max:
121 fps
fps
100%
GeForce GT 1030 (Desktop):
28.6 [X] Intel Xeon E5-2680 v4 2.4GHz
GeForce GT 1030 (Desktop)
min:
26 fps, max:
32 fps
fps
385%
GeForce GTX 1080 Max-Q:
110 [X] Asus Zephyrus GX501 Intel Core i7-7700HQ 2.8GHz
GeForce GTX 1080 Max-Q
min:
100 fps, max:
121 fps
fps
343%
GeForce GTX 1070 Max-Q:
87.7 107.3 ~ 98 fps
100%
GeForce GT 1030 (Desktop):
22 [X] Intel Xeon E5-2680 v4 2.4GHz
GeForce GT 1030 (Desktop)
min:
20 fps, max:
25 fps
fps
509%
GeForce GTX 1080 Max-Q:
112 [X] Asus Zephyrus GX501 Intel Core i7-7700HQ 2.8GHz
GeForce GTX 1080 Max-Q
min:
104 fps, max:
122 fps
fps
100%
GeForce GT 1030 (Desktop):
15.1 [X] Intel Xeon E5-2680 v4 2.4GHz
GeForce GT 1030 (Desktop)
min:
13 fps, max:
17 fps
fps
576%
GeForce GTX 1080 Max-Q:
87 [X] Asus Zephyrus GX501 Intel Core i7-7700HQ 2.8GHz
GeForce GTX 1080 Max-Q
min:
79 fps, max:
98 fps
fps
GeForce GTX 1080 Max-Q:
54.6 [X] Asus Zephyrus GX501 Intel Core i7-7700HQ 2.8GHz
GeForce GTX 1080 Max-Q
min:
51 fps, max:
59 fps
fps
100%
GeForce GT 1030 (Desktop):
2.5 [X] Intel Xeon E5-2680 v4 2.4GHz
GeForce GT 1030 (Desktop)
min:
2 fps, max:
4 fps
fps
1144%
GeForce GTX 1080 Max-Q:
28.6 [X] Asus Zephyrus GX501 Intel Core i7-7700HQ 2.8GHz
GeForce GTX 1080 Max-Q
min:
26 fps, max:
32 fps
fps
100%
GeForce GT 1030 (Desktop):
32.4 [X] Intel Xeon E5-2680 v4 2.4GHz
GeForce GT 1030 (Desktop)
min:
27 fps, max:
37 fps
fps
259%
GeForce GTX 1080 Max-Q:
78 [X] Asus Zephyrus GX501 Intel Core i7-7700HQ 2.8GHz
GeForce GTX 1080 Max-Q
min:
63 fps, max:
95 fps
90.1 ~ 84 fps
273%
GeForce GTX 1070 Max-Q:
88.5 fps
100%
GeForce GT 1030 (Desktop):
18.4 [X] Intel Xeon E5-2680 v4 2.4GHz
GeForce GT 1030 (Desktop)
min:
16 fps, max:
21 fps
fps
359%
GeForce GTX 1080 Max-Q:
66 [X] Asus Zephyrus GX501 Intel Core i7-7700HQ 2.8GHz
GeForce GTX 1080 Max-Q
min:
54 fps, max:
75 fps
66.6 ~ 66 fps
290%
GeForce GTX 1070 Max-Q:
53.3 fps
100%
GeForce GT 1030 (Desktop):
16.3 [X] Intel Xeon E5-2680 v4 2.4GHz
GeForce GT 1030 (Desktop)
min:
14 fps, max:
18 fps
fps
387%
GeForce GTX 1080 Max-Q:
62.3 [X] Asus Zephyrus GX501 Intel Core i7-7700HQ 2.8GHz
GeForce GTX 1080 Max-Q
min:
53 fps, max:
70 fps
64 ~ 63 fps
100%
GeForce GT 1030 (Desktop):
14.8 [X] Intel Xeon E5-2680 v4 2.4GHz
GeForce GT 1030 (Desktop)
min:
13 fps, max:
16 fps
fps
419%
GeForce GTX 1080 Max-Q:
61.4 [X] Asus Zephyrus GX501 Intel Core i7-7700HQ 2.8GHz
GeForce GTX 1080 Max-Q
min:
51 fps, max:
71 fps
62.6 ~ 62 fps
GeForce GTX 1080 Max-Q:
25.5 [X] Asus Zephyrus GX501 Intel Core i7-7700HQ 2.8GHz
GeForce GTX 1080 Max-Q
min:
23 fps, max:
28 fps
fps
100%
GeForce GT 1030 (Desktop):
72 [X] Intel Xeon E5-2680 v4 2.4GHz
GeForce GT 1030 (Desktop)
min:
28 fps, max:
129 fps
fps
192%
GeForce GTX 1080 Max-Q:
130 [X] Asus Zephyrus GX501 Intel Core i7-7700HQ 2.8GHz
GeForce GTX 1080 Max-Q
min:
75 fps, max:
161 fps
146 ~ 138 fps
156%
GeForce GTX 1070 Max-Q:
91 132 ~ 112 fps
100%
GeForce GT 1030 (Desktop):
29 [X] Intel Xeon E5-2680 v4 2.4GHz
GeForce GT 1030 (Desktop)
min:
18 fps, max:
43 fps
fps
438%
GeForce GTX 1080 Max-Q:
122 [X] Asus Zephyrus GX501 Intel Core i7-7700HQ 2.8GHz
GeForce GTX 1080 Max-Q
min:
62 fps, max:
170 fps
132 ~ 127 fps
338%
GeForce GTX 1070 Max-Q:
82 114 ~ 98 fps
100%
GeForce GT 1030 (Desktop):
18 [X] Intel Xeon E5-2680 v4 2.4GHz
GeForce GT 1030 (Desktop)
min:
4 fps, max:
28 fps
fps
600%
GeForce GTX 1080 Max-Q:
105 [X] Asus Zephyrus GX501 Intel Core i7-7700HQ 2.8GHz
GeForce GTX 1080 Max-Q
min:
38 fps, max:
153 fps
111 ~ 108 fps
472%
GeForce GTX 1070 Max-Q:
74 90 91 ~ 85 fps
100%
GeForce GT 1030 (Desktop):
11 [X] Intel Xeon E5-2680 v4 2.4GHz
GeForce GT 1030 (Desktop)
min:
4 fps, max:
15 fps
fps
791%
GeForce GTX 1080 Max-Q:
85 [X] Asus Zephyrus GX501 Intel Core i7-7700HQ 2.8GHz
GeForce GTX 1080 Max-Q
min:
27 fps, max:
149 fps
88 ~ 87 fps
609%
GeForce GTX 1070 Max-Q:
62 69 71 ~ 67 fps
100%
GeForce GT 1030 (Desktop):
6 [X] Intel Xeon E5-2680 v4 2.4GHz
GeForce GT 1030 (Desktop)
min:
1 fps, max:
46 fps
fps
550%
GeForce GTX 1080 Max-Q:
33 [X] Asus Zephyrus GX501 Intel Core i7-7700HQ 2.8GHz
GeForce GTX 1080 Max-Q
min:
16 fps, max:
84 fps
fps
100%
GeForce GT 1030 (Desktop):
241.2 [X] Intel Xeon E5-2680 v4 2.4GHz
GeForce GT 1030 (Desktop)
min:
226 fps, max:
252 fps
fps
118%
GeForce GTX 1080 Max-Q:
284 [X] Asus Zephyrus GX501 Intel Core i7-7700HQ 2.8GHz
GeForce GTX 1080 Max-Q
min:
260 fps, max:
320 fps
fps
100%
GeForce GT 1030 (Desktop):
101.6 [X] Intel Xeon E5-2680 v4 2.4GHz
GeForce GT 1030 (Desktop)
min:
92 fps, max:
131 fps
fps
275%
GeForce GTX 1080 Max-Q:
279 [X] Asus Zephyrus GX501 Intel Core i7-7700HQ 2.8GHz
GeForce GTX 1080 Max-Q
min:
254 fps, max:
301 fps
fps
100%
GeForce GT 1030 (Desktop):
94.7 [X] Intel Xeon E5-2680 v4 2.4GHz
GeForce GT 1030 (Desktop)
min:
70 fps, max:
103 fps
fps
267%
GeForce GTX 1080 Max-Q:
253 [X] Asus Zephyrus GX501 Intel Core i7-7700HQ 2.8GHz
GeForce GTX 1080 Max-Q
fps
210%
GeForce GTX 1070 Max-Q:
153 222 223 ~ 199 fps
100%
GeForce GT 1030 (Desktop):
76.3 [X] Intel Xeon E5-2680 v4 2.4GHz
GeForce GT 1030 (Desktop)
min:
71 fps, max:
79 fps
fps
315%
GeForce GTX 1080 Max-Q:
240 [X] Asus Zephyrus GX501 Intel Core i7-7700HQ 2.8GHz
GeForce GTX 1080 Max-Q
min:
224 fps, max:
263 fps
fps
254%
GeForce GTX 1070 Max-Q:
152 214 217 ~ 194 fps
100%
GeForce GT 1030 (Desktop):
31.3 [X] Intel Xeon E5-2680 v4 2.4GHz
GeForce GT 1030 (Desktop)
min:
29 fps, max:
33 fps
fps
530%
GeForce GTX 1080 Max-Q:
166 [X] Asus Zephyrus GX501 Intel Core i7-7700HQ 2.8GHz
GeForce GTX 1080 Max-Q
min:
145 fps, max:
175 fps
fps
100%
GeForce GT 1030 (Desktop):
64.1 [X] Intel Xeon E5-2680 v4 2.4GHz
GeForce GT 1030 (Desktop)
min:
54 fps, max:
71 fps
fps
247%
GeForce GTX 1070 Max-Q:
158.3 fps
100%
GeForce GT 1030 (Desktop):
14.2 [X] Intel Xeon E5-2680 v4 2.4GHz
GeForce GT 1030 (Desktop)
min:
13 fps, max:
15 fps
fps
442%
GeForce GTX 1070 Max-Q:
62.7 fps
100%
GeForce GT 1030 (Desktop):
10.9 [X] Intel Xeon E5-2680 v4 2.4GHz
GeForce GT 1030 (Desktop)
min:
10 fps, max:
12 fps
fps
519%
GeForce GTX 1080 Max-Q:
56.6 fps
419%
GeForce GTX 1070 Max-Q:
45.7 fps
GeForce GTX 1080 Max-Q:
38.6 fps
GeForce GTX 1070 Max-Q:
31.9 fps
100%
GeForce GT 1030 (Desktop):
112 [X] Intel Xeon E5-2680 v4 2.4GHz
GeForce GT 1030 (Desktop)
min:
94 fps, max:
131 fps
fps
100%
GeForce GT 1030 (Desktop):
50 [X] Intel Xeon E5-2680 v4 2.4GHz
GeForce GT 1030 (Desktop)
min:
42 fps, max:
61 fps
fps
100%
GeForce GT 1030 (Desktop):
39 [X] Intel Xeon E5-2680 v4 2.4GHz
GeForce GT 1030 (Desktop)
min:
32 fps, max:
46 fps
fps
308%
GeForce GTX 1080 Max-Q:
104 [X] Asus Zephyrus GX501 Intel Core i7-7700HQ 2.8GHz
GeForce GTX 1080 Max-Q
min:
89 fps, max:
114 fps
135 ~ 120 fps
305%
GeForce GTX 1070 Max-Q:
112 125 ~ 119 fps
100%
GeForce GT 1030 (Desktop):
38 [X] Intel Xeon E5-2680 v4 2.4GHz
GeForce GT 1030 (Desktop)
min:
31 fps, max:
45 fps
fps
255%
GeForce GTX 1080 Max-Q:
92 [X] Asus Zephyrus GX501 Intel Core i7-7700HQ 2.8GHz
GeForce GTX 1080 Max-Q
min:
76 fps, max:
101 fps
101 ~ 97 fps
211%
GeForce GTX 1070 Max-Q:
79 80 81 ~ 80 fps
100%
GeForce GT 1030 (Desktop):
13 [X] Intel Xeon E5-2680 v4 2.4GHz
GeForce GT 1030 (Desktop)
min:
9 fps, max:
14 fps
fps
369%
GeForce GTX 1080 Max-Q:
48 [X] Asus Zephyrus GX501 Intel Core i7-7700HQ 2.8GHz
GeForce GTX 1080 Max-Q
min:
43 fps, max:
51 fps
fps
277%
GeForce GTX 1070 Max-Q:
36 fps
100%
GeForce GT 1030 (Desktop):
73 [X] Intel Xeon E5-2680 v4 2.4GHz
GeForce GT 1030 (Desktop)
min:
16 fps, max:
91 fps
fps
171%
GeForce GTX 1080 Max-Q:
125 fps
149%
GeForce GTX 1070 Max-Q:
109 [X] MSI GS63VR 7RG Intel Core i7-7700HQ 2.8GHz
GeForce GTX 1070 Max-Q
min:
66 fps
fps
100%
GeForce GT 1030 (Desktop):
28 [X] Intel Xeon E5-2680 v4 2.4GHz
GeForce GT 1030 (Desktop)
min:
22 fps, max:
32 fps
fps
396%
GeForce GTX 1080 Max-Q:
111 fps
335%
GeForce GTX 1070 Max-Q:
93.7 [X] MSI GS63VR 7RG Intel Core i7-7700HQ 2.8GHz
GeForce GTX 1070 Max-Q
min:
54 fps
fps
100%
GeForce GT 1030 (Desktop):
23.9 [X] Intel Xeon E5-2680 v4 2.4GHz
GeForce GT 1030 (Desktop)
min:
18 fps, max:
28 fps
fps
435%
GeForce GTX 1080 Max-Q:
103 104 ~ 104 fps
448%
GeForce GTX 1070 Max-Q:
86.3 [X] MSI GS63VR 7RG Intel Core i7-7700HQ 2.8GHz
GeForce GTX 1070 Max-Q
min:
56 fps
116 120 ~ 107 fps
100%
GeForce GT 1030 (Desktop):
16 [X] Intel Xeon E5-2680 v4 2.4GHz
GeForce GT 1030 (Desktop)
min:
10 fps, max:
19 fps
fps
500%
GeForce GTX 1080 Max-Q:
79 81.8 ~ 80 fps
481%
GeForce GTX 1070 Max-Q:
68.2 [X] MSI GS63VR 7RG Intel Core i7-7700HQ 2.8GHz
GeForce GTX 1070 Max-Q
min:
51 fps
78.7 84.6 ~ 77 fps
GeForce GTX 1080 Max-Q:
27.1 fps
GeForce GTX 1070 Max-Q:
22.4 [X] MSI GS63VR 7RG Intel Core i7-7700HQ 2.8GHz
GeForce GTX 1070 Max-Q
min:
17 fps
fps
GeForce GTX 1080 Max-Q:
133 [X] Asus Zephyrus GX501 Intel Core i7-7700HQ 2.8GHz
GeForce GTX 1080 Max-Q
min:
115.2 fps
137 ~ 135 fps
GeForce GTX 1070 Max-Q:
128.4 fps
GeForce GTX 1080 Max-Q:
131 [X] Asus Zephyrus GX501 Intel Core i7-7700HQ 2.8GHz
GeForce GTX 1080 Max-Q
min:
112.1 fps
136 ~ 134 fps
GeForce GTX 1070 Max-Q:
126.3 fps
GeForce GTX 1080 Max-Q:
128 [X] Asus Zephyrus GX501 Intel Core i7-7700HQ 2.8GHz
GeForce GTX 1080 Max-Q
min:
108.4 fps
132 ~ 130 fps
GeForce GTX 1070 Max-Q:
122 fps
GeForce GTX 1080 Max-Q:
124 125 [X] Asus Zephyrus GX501 Intel Core i7-7700HQ 2.8GHz
GeForce GTX 1080 Max-Q
min:
105.4 fps
132 ~ 127 fps
GeForce GTX 1070 Max-Q:
120.8 fps
GeForce GTX 1080 Max-Q:
111 [X] Asus Zephyrus GX501 Intel Core i7-7700HQ 2.8GHz
GeForce GTX 1080 Max-Q
min:
96 fps
125 130 ~ 122 fps
100%
GeForce GT 1030 (Desktop):
144.1 [X] Intel Xeon E5-2680 v4 2.4GHz
GeForce GT 1030 (Desktop)
min:
130 fps, max:
157 fps
145.1 [X] AMD Ryzen 7 1800X 3.6GHz
GeForce GT 1030 (Desktop)
~ 145 fps
100%
GeForce GT 1030 (Desktop):
58.9 [X] Intel Xeon E5-2680 v4 2.4GHz
GeForce GT 1030 (Desktop)
min:
52 fps, max:
67 fps
59.5 [X] AMD Ryzen 7 1800X 3.6GHz
GeForce GT 1030 (Desktop)
~ 59 fps
100%
GeForce GT 1030 (Desktop):
37.4 [X] Intel Xeon E5-2680 v4 2.4GHz
GeForce GT 1030 (Desktop)
min:
34 fps, max:
44 fps
37.7 [X] AMD Ryzen 7 1800X 3.6GHz
GeForce GT 1030 (Desktop)
~ 38 fps
376%
GeForce GTX 1080 Max-Q:
136 149 ~ 143 fps
311%
GeForce GTX 1070 Max-Q:
115.4 121 [X] MSI GS63VR 7RG Intel Core i7-7700HQ 2.8GHz
GeForce GTX 1070 Max-Q
~ 118 fps
100%
GeForce GT 1030 (Desktop):
18.9 [X] Intel Xeon E5-2680 v4 2.4GHz
GeForce GT 1030 (Desktop)
min:
16 fps, max:
26 fps
19 [X] AMD Ryzen 7 1800X 3.6GHz
GeForce GT 1030 (Desktop)
~ 19 fps
458%
GeForce GTX 1080 Max-Q:
85.3 88.4 ~ 87 fps
400%
GeForce GTX 1070 Max-Q:
71.8 72.8 76.9 [X] MSI GS63VR 7RG Intel Core i7-7700HQ 2.8GHz
GeForce GTX 1070 Max-Q
82.7 ~ 76 fps
GeForce GTX 1070 Max-Q:
40.5 fps
100%
GeForce GT 1030 (Desktop):
186.2 [X] Intel Xeon E5-2680 v4 2.4GHz
GeForce GT 1030 (Desktop)
min:
145 fps, max:
241 fps
187.2 [X] AMD Ryzen 7 1800X 3.6GHz
GeForce GT 1030 (Desktop)
~ 187 fps
100%
GeForce GT 1030 (Desktop):
74.3 [X] Intel Xeon E5-2680 v4 2.4GHz
GeForce GT 1030 (Desktop)
min:
57 fps, max:
103 fps
74.7 [X] AMD Ryzen 7 1800X 3.6GHz
GeForce GT 1030 (Desktop)
~ 75 fps
100%
GeForce GT 1030 (Desktop):
51.3 [X] Intel Xeon E5-2680 v4 2.4GHz
GeForce GT 1030 (Desktop)
min:
38 fps, max:
76 fps
51.5 [X] AMD Ryzen 7 1800X 3.6GHz
GeForce GT 1030 (Desktop)
~ 51 fps
455%
GeForce GTX 1080 Max-Q:
228 235 ~ 232 fps
392%
GeForce GTX 1070 Max-Q:
196 196 208 [X] MSI GS63VR 7RG Intel Core i7-7700HQ 2.8GHz
GeForce GTX 1070 Max-Q
~ 200 fps
GeForce GTX 1080 Max-Q:
103 fps
GeForce GTX 1070 Max-Q:
83.8 [X] MSI GS63VR 7RG Intel Core i7-7700HQ 2.8GHz
GeForce GTX 1070 Max-Q
fps
100%
GeForce GT 1030 (Desktop):
109.3 [X] Intel Xeon E5-2680 v4 2.4GHz
GeForce GT 1030 (Desktop)
min:
74 fps, max:
145 fps
109.9 [X] AMD Ryzen 7 1800X 3.6GHz
GeForce GT 1030 (Desktop)
~ 110 fps
129%
GeForce GTX 1080 Max-Q:
141.7 fps
100%
GeForce GT 1030 (Desktop):
35.1 [X] Intel Xeon E5-2680 v4 2.4GHz
GeForce GT 1030 (Desktop)
min:
29 fps, max:
49 fps
35.3 [X] AMD Ryzen 7 1800X 3.6GHz
GeForce GT 1030 (Desktop)
~ 35 fps
406%
GeForce GTX 1080 Max-Q:
142 fps
100%
GeForce GT 1030 (Desktop):
31.1 [X] Intel Xeon E5-2680 v4 2.4GHz
GeForce GT 1030 (Desktop)
min:
25 fps, max:
44 fps
31.4 [X] AMD Ryzen 7 1800X 3.6GHz
GeForce GT 1030 (Desktop)
~ 31 fps
442%
GeForce GTX 1070 Max-Q:
137 [X] MSI GS63VR 7RG Intel Core i7-7700HQ 2.8GHz
GeForce GTX 1070 Max-Q
fps
100%
GeForce GT 1030 (Desktop):
28.9 [X] Intel Xeon E5-2680 v4 2.4GHz
GeForce GT 1030 (Desktop)
min:
24 fps, max:
39 fps
29.1 [X] AMD Ryzen 7 1800X 3.6GHz
GeForce GT 1030 (Desktop)
~ 29 fps
466%
GeForce GTX 1070 Max-Q:
130 [X] MSI GS63VR 7RG Intel Core i7-7700HQ 2.8GHz
GeForce GTX 1070 Max-Q
132 138.7 140.8 ~ 135 fps
100%
GeForce GT 1030 (Desktop):
10 [X] Intel Xeon E5-2680 v4 2.4GHz
GeForce GT 1030 (Desktop)
min:
8 fps, max:
14 fps
10 [X] AMD Ryzen 7 1800X 3.6GHz
GeForce GT 1030 (Desktop)
~ 10 fps
505%
GeForce GTX 1080 Max-Q:
50.5 fps
480%
GeForce GTX 1070 Max-Q:
46.9 [X] MSI GS63VR 7RG Intel Core i7-7700HQ 2.8GHz
GeForce GTX 1070 Max-Q
48.1 ~ 48 fps
100%
GeForce GT 1030 (Desktop):
49.9 [X] Intel Xeon E5-2680 v4 2.4GHz
GeForce GT 1030 (Desktop)
min:
40 fps, max:
80 fps
fps
335%
GeForce GTX 1070 Max-Q:
167.3 fps
100%
GeForce GT 1030 (Desktop):
22.1 [X] Intel Xeon E5-2680 v4 2.4GHz
GeForce GT 1030 (Desktop)
min:
17 fps, max:
34 fps
fps
481%
GeForce GTX 1070 Max-Q:
106.4 fps
100%
GeForce GT 1030 (Desktop):
14.4 [X] Intel Xeon E5-2680 v4 2.4GHz
GeForce GT 1030 (Desktop)
min:
10 fps, max:
23 fps
fps
611%
GeForce GTX 1080 Max-Q:
88 fps
701%
GeForce GTX 1070 Max-Q:
100.9 fps
100%
GeForce GT 1030 (Desktop):
11.7 [X] Intel Xeon E5-2680 v4 2.4GHz
GeForce GT 1030 (Desktop)
min:
9 fps, max:
15 fps
fps
735%
GeForce GTX 1080 Max-Q:
86 fps
768%
GeForce GTX 1070 Max-Q:
89.9 fps
GeForce GTX 1080 Max-Q:
41.9 fps
100%
GeForce GT 1030 (Desktop):
67.2 [X] Intel Xeon E5-2680 v4 2.4GHz
GeForce GT 1030 (Desktop)
min:
56 fps, max:
107 fps
67.5 [X] AMD Ryzen 7 1800X 3.6GHz
GeForce GT 1030 (Desktop)
~ 67 fps
224%
GeForce GTX 1070 Max-Q:
150.1 fps
100%
GeForce GT 1030 (Desktop):
24.5 [X] Intel Xeon E5-2680 v4 2.4GHz
GeForce GT 1030 (Desktop)
min:
26 fps, max:
43 fps
24.7 [X] AMD Ryzen 7 1800X 3.6GHz
GeForce GT 1030 (Desktop)
~ 25 fps
443%
GeForce GTX 1070 Max-Q:
110.8 fps
100%
GeForce GT 1030 (Desktop):
13 [X] Intel Xeon E5-2680 v4 2.4GHz
GeForce GT 1030 (Desktop)
min:
10 fps, max:
23 fps
13.1 [X] AMD Ryzen 7 1800X 3.6GHz
GeForce GT 1030 (Desktop)
~ 13 fps
626%
GeForce GTX 1080 Max-Q:
81.4 fps
597%
GeForce GTX 1070 Max-Q:
77.6 fps
100%
GeForce GT 1030 (Desktop):
8.9 [X] Intel Xeon E5-2680 v4 2.4GHz
GeForce GT 1030 (Desktop)
min:
6 fps, max:
18 fps
9 [X] AMD Ryzen 7 1800X 3.6GHz
GeForce GT 1030 (Desktop)
~ 9 fps
813%
GeForce GTX 1080 Max-Q:
73.2 fps
761%
GeForce GTX 1070 Max-Q:
68.5 fps
100%
GeForce GT 1030 (Desktop):
10 [X] AMD Ryzen 7 1800X 3.6GHz
GeForce GT 1030 (Desktop)
10.2 [X] Intel Xeon E5-2680 v4 2.4GHz
GeForce GT 1030 (Desktop)
min:
8 fps, max:
18 fps
~ 10 fps
351%
GeForce GTX 1080 Max-Q:
35.1 fps
100%
GeForce GT 1030 (Desktop):
57.3 [X] Intel Xeon E5-2680 v4 2.4GHz
GeForce GT 1030 (Desktop)
min:
42 fps, max:
68 fps
57.5 [X] AMD Ryzen 7 1800X 3.6GHz
GeForce GT 1030 (Desktop)
~ 57 fps
231%
GeForce GTX 1080 Max-Q:
131.7 fps
260%
GeForce GTX 1070 Max-Q:
148.4 fps
100%
GeForce GT 1030 (Desktop):
22.9 [X] Intel Xeon E5-2680 v4 2.4GHz
GeForce GT 1030 (Desktop)
min:
18 fps, max:
27 fps
23 [X] AMD Ryzen 7 1800X 3.6GHz
GeForce GT 1030 (Desktop)
~ 23 fps
441%
GeForce GTX 1080 Max-Q:
101.4 fps
374%
GeForce GTX 1070 Max-Q:
86 fps
100%
GeForce GT 1030 (Desktop):
18.7 [X] Intel Xeon E5-2680 v4 2.4GHz
GeForce GT 1030 (Desktop)
min:
15 fps, max:
22 fps
18.8 [X] AMD Ryzen 7 1800X 3.6GHz
GeForce GT 1030 (Desktop)
~ 19 fps
479%
GeForce GTX 1080 Max-Q:
86.7 90 [X] Asus Zephyrus GX501 Intel Core i7-7700HQ 2.8GHz
GeForce GTX 1080 Max-Q
min:
82 fps, max:
102 fps
92.1 94.9 ~ 91 fps
411%
GeForce GTX 1070 Max-Q:
75.7 78.6 79.7 [X] MSI GS63VR 7RG Intel Core i7-7700HQ 2.8GHz
GeForce GTX 1070 Max-Q
~ 78 fps
100%
GeForce GT 1030 (Desktop):
15.8 [X] Intel Xeon E5-2680 v4 2.4GHz
GeForce GT 1030 (Desktop)
min:
13 fps, max:
19 fps
15.8 [X] AMD Ryzen 7 1800X 3.6GHz
GeForce GT 1030 (Desktop)
~ 16 fps
338%
GeForce GTX 1080 Max-Q:
51.9 54.5 54.6 54.9 [X] Asus Zephyrus GX501 Intel Core i7-7700HQ 2.8GHz
GeForce GTX 1080 Max-Q
min:
41 fps, max:
63 fps
~ 54 fps
275%
GeForce GTX 1070 Max-Q:
42.8 43.7 45.4 [X] MSI GS63VR 7RG Intel Core i7-7700HQ 2.8GHz
GeForce GTX 1070 Max-Q
~ 44 fps
100%
GeForce GT 1030 (Desktop):
5.6 [X] Intel Xeon E5-2680 v4 2.4GHz
GeForce GT 1030 (Desktop)
min:
4 fps, max:
7 fps
5.6 [X] AMD Ryzen 7 1800X 3.6GHz
GeForce GT 1030 (Desktop)
~ 6 fps
568%
GeForce GTX 1080 Max-Q:
34.1 fps
483%
GeForce GTX 1070 Max-Q:
29 [X] MSI GS63VR 7RG Intel Core i7-7700HQ 2.8GHz
GeForce GTX 1070 Max-Q
fps
100%
GeForce GT 1030 (Desktop):
97.9 [X] Intel Xeon E5-2680 v4 2.4GHz
GeForce GT 1030 (Desktop)
min:
44 fps, max:
158 fps
fps
235%
GeForce GTX 1080 Max-Q:
229.6 fps
208%
GeForce GTX 1070 Max-Q:
203.9 fps
100%
GeForce GT 1030 (Desktop):
33.4 [X] Intel Xeon E5-2680 v4 2.4GHz
GeForce GT 1030 (Desktop)
min:
26 fps, max:
44 fps
fps
483%
GeForce GTX 1080 Max-Q:
161.2 fps
385%
GeForce GTX 1070 Max-Q:
128.6 fps
100%
GeForce GT 1030 (Desktop):
31.8 [X] Intel Xeon E5-2680 v4 2.4GHz
GeForce GT 1030 (Desktop)
min:
25 fps, max:
39 fps
fps
390%
GeForce GTX 1070 Max-Q:
121 122.7 127 [X] MSI GS63VR 7RG Intel Core i7-7700HQ 2.8GHz
GeForce GTX 1070 Max-Q
~ 124 fps
100%
GeForce GT 1030 (Desktop):
23.1 [X] Intel Xeon E5-2680 v4 2.4GHz
GeForce GT 1030 (Desktop)
min:
16 fps, max:
32 fps
fps
411%
GeForce GTX 1070 Max-Q:
93.4 [X] MSI GS63VR 7RG Intel Core i7-7700HQ 2.8GHz
GeForce GTX 1070 Max-Q
94.2 96 ~ 95 fps
100%
GeForce GT 1030 (Desktop):
7.2 [X] Intel Xeon E5-2680 v4 2.4GHz
GeForce GT 1030 (Desktop)
min:
6 fps, max:
9 fps
fps
665%
GeForce GTX 1080 Max-Q:
47.9 fps
543%
GeForce GTX 1070 Max-Q:
39.1 [X] MSI GS63VR 7RG Intel Core i7-7700HQ 2.8GHz
GeForce GTX 1070 Max-Q
fps
100%
GeForce GT 1030 (Desktop):
118.3 [X] Intel Xeon E5-2680 v4 2.4GHz
GeForce GT 1030 (Desktop)
min:
100 fps, max:
135 fps
119 [X] AMD Ryzen 7 1800X 3.6GHz
GeForce GT 1030 (Desktop)
~ 119 fps
100%
GeForce GT 1030 (Desktop):
57.7 [X] Intel Xeon E5-2680 v4 2.4GHz
GeForce GT 1030 (Desktop)
min:
47 fps, max:
69 fps
57.9 [X] AMD Ryzen 7 1800X 3.6GHz
GeForce GT 1030 (Desktop)
~ 58 fps
100%
GeForce GT 1030 (Desktop):
34.5 [X] Intel Xeon E5-2680 v4 2.4GHz
GeForce GT 1030 (Desktop)
min:
28 fps, max:
43 fps
34.6 [X] AMD Ryzen 7 1800X 3.6GHz
GeForce GT 1030 (Desktop)
~ 35 fps
483%
GeForce GTX 1080 Max-Q:
166 171 ~ 169 fps
394%
GeForce GTX 1070 Max-Q:
135 138 [X] MSI GS63VR 7RG Intel Core i7-7700HQ 2.8GHz
GeForce GTX 1070 Max-Q
142 ~ 138 fps
100%
GeForce GT 1030 (Desktop):
8.9 [X] Intel Xeon E5-2680 v4 2.4GHz
GeForce GT 1030 (Desktop)
min:
2 fps, max:
17 fps
8.9 [X] AMD Ryzen 7 1800X 3.6GHz
GeForce GT 1030 (Desktop)
~ 9 fps
1567%
GeForce GTX 1080 Max-Q:
140 142 ~ 141 fps
1289%
GeForce GTX 1070 Max-Q:
116 [X] MSI GS63VR 7RG Intel Core i7-7700HQ 2.8GHz
GeForce GTX 1070 Max-Q
116 117 ~ 116 fps
100%
GeForce GT 1030 (Desktop):
8.4 [X] Intel Xeon E5-2680 v4 2.4GHz
GeForce GT 1030 (Desktop)
min:
4 fps, max:
12 fps
8.5 [X] AMD Ryzen 7 1800X 3.6GHz
GeForce GT 1030 (Desktop)
~ 8 fps
593%
GeForce GTX 1080 Max-Q:
47.4 fps
483%
GeForce GTX 1070 Max-Q:
38.6 [X] MSI GS63VR 7RG Intel Core i7-7700HQ 2.8GHz
GeForce GTX 1070 Max-Q
fps
100%
GeForce GT 1030 (Desktop):
55.4 [X] Intel Xeon E5-2680 v4 2.4GHz
GeForce GT 1030 (Desktop)
min:
31 fps, max:
65 fps
55.7 [X] AMD Ryzen 7 1800X 3.6GHz
GeForce GT 1030 (Desktop)
~ 56 fps
100%
GeForce GT 1030 (Desktop):
47.3 [X] Intel Xeon E5-2680 v4 2.4GHz
GeForce GT 1030 (Desktop)
min:
39 fps, max:
54 fps
47.5 [X] AMD Ryzen 7 1800X 3.6GHz
GeForce GT 1030 (Desktop)
~ 47 fps
100%
GeForce GT 1030 (Desktop):
21.7 [X] Intel Xeon E5-2680 v4 2.4GHz
GeForce GT 1030 (Desktop)
min:
19 fps, max:
25 fps
21.9 [X] AMD Ryzen 7 1800X 3.6GHz
GeForce GT 1030 (Desktop)
~ 22 fps
394%
GeForce GTX 1080 Max-Q:
86.7 fps
318%
GeForce GTX 1070 Max-Q:
68.8 [X] SCHENKER Key 15 Coffee Lake Intel Core i7-8750H 2.2GHz
GeForce GTX 1070 Max-Q
71.1 [X] MSI GS63VR 7RG Intel Core i7-7700HQ 2.8GHz
GeForce GTX 1070 Max-Q
~ 70 fps
100%
GeForce GT 1030 (Desktop):
14.8 [X] Intel Xeon E5-2680 v4 2.4GHz
GeForce GT 1030 (Desktop)
min:
11 fps, max:
17 fps
14.8 [X] AMD Ryzen 7 1800X 3.6GHz
GeForce GT 1030 (Desktop)
~ 15 fps
445%
GeForce GTX 1080 Max-Q:
66.7 fps
353%
GeForce GTX 1070 Max-Q:
51.5 [X] SCHENKER Key 15 Coffee Lake Intel Core i7-8750H 2.2GHz
GeForce GTX 1070 Max-Q
55.3 [X] MSI GS63VR 7RG Intel Core i7-7700HQ 2.8GHz
GeForce GTX 1070 Max-Q
~ 53 fps
100%
GeForce GT 1030 (Desktop):
6.2 [X] Intel Xeon E5-2680 v4 2.4GHz
GeForce GT 1030 (Desktop)
min:
4 fps, max:
8 fps
6.2 [X] AMD Ryzen 7 1800X 3.6GHz
GeForce GT 1030 (Desktop)
~ 6 fps
582%
GeForce GTX 1080 Max-Q:
34.9 fps
467%
GeForce GTX 1070 Max-Q:
28 [X] MSI GS63VR 7RG Intel Core i7-7700HQ 2.8GHz
GeForce GTX 1070 Max-Q
fps
100%
GeForce GT 1030 (Desktop):
54.2 [X] Intel Xeon E5-2680 v4 2.4GHz
GeForce GT 1030 (Desktop)
min:
43 fps, max:
62 fps
fps
100%
GeForce GT 1030 (Desktop):
49.4 [X] Intel Xeon E5-2680 v4 2.4GHz
GeForce GT 1030 (Desktop)
min:
35 fps, max:
61 fps
fps
100%
GeForce GT 1030 (Desktop):
22.4 [X] Intel Xeon E5-2680 v4 2.4GHz
GeForce GT 1030 (Desktop)
min:
17 fps, max:
29 fps
fps
349%
GeForce GTX 1080 Max-Q:
78.2 fps
357%
GeForce GTX 1070 Max-Q:
79.5 [X] SCHENKER Key 15 Coffee Lake Intel Core i7-8750H 2.2GHz
GeForce GTX 1070 Max-Q
81.2 [X] MSI GS63VR 7RG Intel Core i7-7700HQ 2.8GHz
GeForce GTX 1070 Max-Q
~ 80 fps
100%
GeForce GT 1030 (Desktop):
21.1 [X] Intel Xeon E5-2680 v4 2.4GHz
GeForce GT 1030 (Desktop)
min:
15 fps, max:
28 fps
fps
315%
GeForce GTX 1080 Max-Q:
66.5 fps
336%
GeForce GTX 1070 Max-Q:
68 [X] SCHENKER Key 15 Coffee Lake Intel Core i7-8750H 2.2GHz
GeForce GTX 1070 Max-Q
73.4 [X] MSI GS63VR 7RG Intel Core i7-7700HQ 2.8GHz
GeForce GTX 1070 Max-Q
~ 71 fps
100%
GeForce GT 1030 (Desktop):
8.9 [X] Intel Xeon E5-2680 v4 2.4GHz
GeForce GT 1030 (Desktop)
min:
7 fps, max:
11 fps
fps
488%
GeForce GTX 1080 Max-Q:
43.4 fps
100%
GeForce GT 1030 (Desktop):
73.7 [X] Intel Xeon E5-2680 v4 2.4GHz
GeForce GT 1030 (Desktop)
min:
52 fps, max:
126 fps
fps
100%
GeForce GT 1030 (Desktop):
67 [X] Intel Xeon E5-2680 v4 2.4GHz
GeForce GT 1030 (Desktop)
min:
48 fps, max:
107 fps
fps
100%
GeForce GT 1030 (Desktop):
36.3 [X] Intel Xeon E5-2680 v4 2.4GHz
GeForce GT 1030 (Desktop)
min:
27 fps, max:
54 fps
fps
339%
GeForce GTX 1080 Max-Q:
123 fps
317%
GeForce GTX 1070 Max-Q:
115 [X] MSI GS63VR 7RG Intel Core i7-7700HQ 2.8GHz
GeForce GTX 1070 Max-Q
fps
100%
GeForce GT 1030 (Desktop):
32 [X] Intel Xeon E5-2680 v4 2.4GHz
GeForce GT 1030 (Desktop)
min:
24 fps, max:
52 fps
fps
369%
GeForce GTX 1080 Max-Q:
118 fps
331%
GeForce GTX 1070 Max-Q:
106 [X] MSI GS63VR 7RG Intel Core i7-7700HQ 2.8GHz
GeForce GTX 1070 Max-Q
fps
100%
GeForce GT 1030 (Desktop):
14.4 [X] Intel Xeon E5-2680 v4 2.4GHz
GeForce GT 1030 (Desktop)
min:
6 fps, max:
20 fps
fps
442%
GeForce GTX 1080 Max-Q:
63.7 fps
364%
GeForce GTX 1070 Max-Q:
52.4 [X] MSI GS63VR 7RG Intel Core i7-7700HQ 2.8GHz
GeForce GTX 1070 Max-Q
fps
100%
GeForce GT 1030 (Desktop):
114.6 [X] Intel Xeon E5-2680 v4 2.4GHz
GeForce GT 1030 (Desktop)
fps
100%
GeForce GT 1030 (Desktop):
80 [X] Intel Xeon E5-2680 v4 2.4GHz
GeForce GT 1030 (Desktop)
fps
100%
GeForce GT 1030 (Desktop):
35.2 [X] Intel Xeon E5-2680 v4 2.4GHz
GeForce GT 1030 (Desktop)
fps
372%
GeForce GTX 1080 Max-Q:
131 fps
335%
GeForce GTX 1070 Max-Q:
118 [X] MSI GS63VR 7RG Intel Core i7-7700HQ 2.8GHz
GeForce GTX 1070 Max-Q
fps
100%
GeForce GT 1030 (Desktop):
30 [X] Intel Xeon E5-2680 v4 2.4GHz
GeForce GT 1030 (Desktop)
fps
377%
GeForce GTX 1080 Max-Q:
113 fps
347%
GeForce GTX 1070 Max-Q:
104 [X] MSI GS63VR 7RG Intel Core i7-7700HQ 2.8GHz
GeForce GTX 1070 Max-Q
fps
100%
GeForce GT 1030 (Desktop):
7.9 [X] Intel Xeon E5-2680 v4 2.4GHz
GeForce GT 1030 (Desktop)
fps
590%
GeForce GTX 1080 Max-Q:
46.6 fps
473%
GeForce GTX 1070 Max-Q:
37.4 [X] MSI GS63VR 7RG Intel Core i7-7700HQ 2.8GHz
GeForce GTX 1070 Max-Q
fps
100%
GeForce GT 1030 (Desktop):
233.9 [X] Intel Xeon E5-2680 v4 2.4GHz
GeForce GT 1030 (Desktop)
min:
200 fps, max:
270 fps
234.5 [X] AMD Ryzen 7 1800X 3.6GHz
GeForce GT 1030 (Desktop)
~ 234 fps
100%
GeForce GT 1030 (Desktop):
174.3 [X] Intel Xeon E5-2680 v4 2.4GHz
GeForce GT 1030 (Desktop)
min:
161 fps, max:
219 fps
174.6 [X] AMD Ryzen 7 1800X 3.6GHz
GeForce GT 1030 (Desktop)
~ 174 fps
100%
GeForce GT 1030 (Desktop):
83.3 [X] Intel Xeon E5-2680 v4 2.4GHz
GeForce GT 1030 (Desktop)
min:
63 fps, max:
123 fps
83.5 [X] AMD Ryzen 7 1800X 3.6GHz
GeForce GT 1030 (Desktop)
~ 83 fps
100%
GeForce GT 1030 (Desktop):
56.5 [X] Intel Xeon E5-2680 v4 2.4GHz
GeForce GT 1030 (Desktop)
min:
46 fps, max:
87 fps
56.6 [X] AMD Ryzen 7 1800X 3.6GHz
GeForce GT 1030 (Desktop)
~ 57 fps
342%
GeForce GTX 1080 Max-Q:
195 fps
100%
GeForce GT 1030 (Desktop):
17.8 [X] Intel Xeon E5-2680 v4 2.4GHz
GeForce GT 1030 (Desktop)
min:
16 fps, max:
22 fps
17.9 [X] AMD Ryzen 7 1800X 3.6GHz
GeForce GT 1030 (Desktop)
~ 18 fps
700%
GeForce GTX 1080 Max-Q:
126 fps
100%
GeForce GT 1030 (Desktop):
104.8 [X] Intel Xeon E5-2680 v4 2.4GHz
GeForce GT 1030 (Desktop)
min:
98 fps, max:
111 fps
fps
118%
GeForce GTX 1070 Max-Q:
123.2 fps
100%
GeForce GT 1030 (Desktop):
64.3 [X] Intel Xeon E5-2680 v4 2.4GHz
GeForce GT 1030 (Desktop)
min:
60 fps, max:
69 fps
fps
164%
GeForce GTX 1070 Max-Q:
105.5 fps
100%
GeForce GT 1030 (Desktop):
26.5 [X] Intel Xeon E5-2680 v4 2.4GHz
GeForce GT 1030 (Desktop)
min:
25 fps, max:
29 fps
fps
491%
GeForce GTX 1080 Max-Q:
130 fps
385%
GeForce GTX 1070 Max-Q:
91.5 106 [X] SCHENKER Key 15 Coffee Lake Intel Core i7-8750H 2.2GHz
GeForce GTX 1070 Max-Q
108 [X] MSI GS63VR 7RG Intel Core i7-7700HQ 2.8GHz
GeForce GTX 1070 Max-Q
~ 102 fps
100%
GeForce GT 1030 (Desktop):
24.6 [X] Intel Xeon E5-2680 v4 2.4GHz
GeForce GT 1030 (Desktop)
min:
22 fps, max:
27 fps
fps
459%
GeForce GTX 1080 Max-Q:
113 fps
386%
GeForce GTX 1070 Max-Q:
90.7 96.4 [X] SCHENKER Key 15 Coffee Lake Intel Core i7-8750H 2.2GHz
GeForce GTX 1070 Max-Q
96.6 [X] MSI GS63VR 7RG Intel Core i7-7700HQ 2.8GHz
GeForce GTX 1070 Max-Q
~ 95 fps
100%
GeForce GT 1030 (Desktop):
7.8 [X] Intel Xeon E5-2680 v4 2.4GHz
GeForce GT 1030 (Desktop)
min:
2 fps, max:
10 fps
fps
628%
GeForce GTX 1080 Max-Q:
49 fps
500%
GeForce GTX 1070 Max-Q:
38.9 [X] MSI GS63VR 7RG Intel Core i7-7700HQ 2.8GHz
GeForce GTX 1070 Max-Q
39.1 ~ 39 fps
GeForce GTX 1070 Max-Q:
51.6 51.8 [X] Smart7 Deimos GX15E G1 Intel Core i7-7700HQ 2.8GHz
GeForce GTX 1070 Max-Q
55.1 56 ~ 54 fps
GeForce GTX 1070 Max-Q:
20.6 fps
100%
GeForce GT 1030 (Desktop):
250 [X] Intel Xeon E5-2680 v4 2.4GHz
GeForce GT 1030 (Desktop)
min:
213 fps, max:
268 fps
252 [X] AMD Ryzen 7 1800X 3.6GHz
GeForce GT 1030 (Desktop)
~ 251 fps
0%
GeForce GTX 1080 Max-Q:
0 (!) [X] Asus Zephyrus GX501 Intel Core i7-7700HQ 2.8GHz
GeForce GTX 1080 Max-Q
fps
100%
GeForce GT 1030 (Desktop):
187.9 [X] Intel Xeon E5-2680 v4 2.4GHz
GeForce GT 1030 (Desktop)
min:
153 fps, max:
205 fps
188.4 [X] AMD Ryzen 7 1800X 3.6GHz
GeForce GT 1030 (Desktop)
~ 188 fps
100%
GeForce GT 1030 (Desktop):
102.8 [X] Intel Xeon E5-2680 v4 2.4GHz
GeForce GT 1030 (Desktop)
min:
97 fps, max:
109 fps
103 [X] AMD Ryzen 7 1800X 3.6GHz
GeForce GT 1030 (Desktop)
~ 103 fps
209%
GeForce GTX 1070 Max-Q:
215 [X] MSI GS63VR 7RG Intel Core i7-7700HQ 2.8GHz
GeForce GTX 1070 Max-Q
fps
100%
GeForce GT 1030 (Desktop):
97.3 [X] Intel Xeon E5-2680 v4 2.4GHz
GeForce GT 1030 (Desktop)
min:
91 fps, max:
103 fps
97.6 [X] AMD Ryzen 7 1800X 3.6GHz
GeForce GT 1030 (Desktop)
~ 97 fps
309%
GeForce GTX 1080 Max-Q:
300 [X] Asus Zephyrus GX501 Intel Core i7-7700HQ 2.8GHz
GeForce GTX 1080 Max-Q
min:
90 fps, max:
128 fps
fps
219%
GeForce GTX 1070 Max-Q:
212 [X] MSI GS63VR 7RG Intel Core i7-7700HQ 2.8GHz
GeForce GTX 1070 Max-Q
fps
100%
GeForce GT 1030 (Desktop):
34.7 [X] Intel Xeon E5-2680 v4 2.4GHz
GeForce GT 1030 (Desktop)
min:
29 fps, max:
37 fps
34.8 [X] AMD Ryzen 7 1800X 3.6GHz
GeForce GT 1030 (Desktop)
~ 35 fps
509%
GeForce GTX 1080 Max-Q:
178 [X] Asus Zephyrus GX501 Intel Core i7-7700HQ 2.8GHz
GeForce GTX 1080 Max-Q
min:
143 fps, max:
196 fps
fps
411%
GeForce GTX 1070 Max-Q:
144 [X] MSI GS63VR 7RG Intel Core i7-7700HQ 2.8GHz
GeForce GTX 1070 Max-Q
fps
100%
GeForce GT 1030 (Desktop):
50.1 [X] Intel Xeon E5-2680 v4 2.4GHz
GeForce GT 1030 (Desktop)
min:
38 fps, max:
66 fps
51.1 [X] AMD Ryzen 7 1800X 3.6GHz
GeForce GT 1030 (Desktop)
min:
14.1 fps, max:
68 fps
~ 51 fps
100%
GeForce GT 1030 (Desktop):
36.1 [X] Intel Xeon E5-2680 v4 2.4GHz
GeForce GT 1030 (Desktop)
min:
19 fps, max:
47 fps
36.6 [X] AMD Ryzen 7 1800X 3.6GHz
GeForce GT 1030 (Desktop)
min:
28.4 fps, max:
47.8 fps
~ 36 fps
100%
GeForce GT 1030 (Desktop):
18.2 [X] Intel Xeon E5-2680 v4 2.4GHz
GeForce GT 1030 (Desktop)
min:
15 fps, max:
23 fps
18.6 [X] AMD Ryzen 7 1800X 3.6GHz
GeForce GT 1030 (Desktop)
min:
15.4 fps, max:
23.1 fps
~ 18 fps
494%
GeForce GTX 1080 Max-Q:
87.3 90.3 [X] Asus Zephyrus GX501 DX11
Intel Core i7-7700HQ 2.8GHz
GeForce GTX 1080 Max-Q
min:
70 fps, max:
114 fps
~ 89 fps
394%
GeForce GTX 1070 Max-Q:
68.1 [X] SCHENKER Key 15 Coffee Lake Intel Core i7-8750H 2.2GHz
GeForce GTX 1070 Max-Q
73.9 [X] MSI GS63VR 7RG Intel Core i7-7700HQ 2.8GHz
GeForce GTX 1070 Max-Q
~ 71 fps
100%
GeForce GT 1030 (Desktop):
11.7 [X] Intel Xeon E5-2680 v4 2.4GHz
GeForce GT 1030 (Desktop)
min:
8 fps, max:
16 fps
12 [X] AMD Ryzen 7 1800X 3.6GHz
GeForce GT 1030 (Desktop)
min:
6.1 fps, max:
12.5 fps
~ 12 fps
408%
GeForce GTX 1080 Max-Q:
47.9 49 [X] Asus Zephyrus GX501 Intel Core i7-7700HQ 2.8GHz
GeForce GTX 1080 Max-Q
min:
38 fps, max:
63 fps
50.4 [X] Asus Zephyrus GX501 DX11
Intel Core i7-7700HQ 2.8GHz
GeForce GTX 1080 Max-Q
min:
39 fps, max:
64 fps
~ 49 fps
325%
GeForce GTX 1070 Max-Q:
37.9 [X] SCHENKER Key 15 Coffee Lake Intel Core i7-8750H 2.2GHz
GeForce GTX 1070 Max-Q
40.4 [X] MSI GS63VR 7RG Intel Core i7-7700HQ 2.8GHz
GeForce GTX 1070 Max-Q
~ 39 fps
100%
GeForce GT 1030 (Desktop):
4.6 [X] Intel Xeon E5-2680 v4 2.4GHz
GeForce GT 1030 (Desktop)
min:
1 fps, max:
7 fps
4.9 [X] AMD Ryzen 7 1800X 3.6GHz
GeForce GT 1030 (Desktop)
min:
3.1 fps, max:
5.2 fps
~ 5 fps
600%
GeForce GTX 1080 Max-Q:
29.3 [X] Asus Zephyrus GX501 DX12
Intel Core i7-7700HQ 2.8GHz
GeForce GTX 1080 Max-Q
min:
25 fps, max:
35 fps
29.6 30.6 [X] Asus Zephyrus GX501 DX11
Intel Core i7-7700HQ 2.8GHz
GeForce GTX 1080 Max-Q
min:
26 fps, max:
36 fps
~ 30 fps
490%
GeForce GTX 1070 Max-Q:
24.5 [X] MSI GS63VR 7RG Intel Core i7-7700HQ 2.8GHz
GeForce GTX 1070 Max-Q
fps
GeForce GTX 1080 Max-Q:
106 fps
GeForce GTX 1070 Max-Q:
86.4 [X] SCHENKER Key 15 Coffee Lake Intel Core i7-8750H 2.2GHz
GeForce GTX 1070 Max-Q
87.3 [X] MSI GS63VR 7RG Intel Core i7-7700HQ 2.8GHz
GeForce GTX 1070 Max-Q
~ 87 fps
GeForce GTX 1080 Max-Q:
97.8 fps
GeForce GTX 1070 Max-Q:
78.6 [X] SCHENKER Key 15 Coffee Lake Intel Core i7-8750H 2.2GHz
GeForce GTX 1070 Max-Q
80.2 [X] MSI GS63VR 7RG Intel Core i7-7700HQ 2.8GHz
GeForce GTX 1070 Max-Q
~ 79 fps
GeForce GTX 1080 Max-Q:
38.8 fps
GeForce GTX 1070 Max-Q:
31.5 [X] MSI GS63VR 7RG Intel Core i7-7700HQ 2.8GHz
GeForce GTX 1070 Max-Q
fps
100%
GeForce GT 1030 (Desktop):
183.4 [X] Intel Xeon E5-2680 v4 2.4GHz
GeForce GT 1030 (Desktop)
min:
138 fps, max:
213 fps
fps
100%
GeForce GT 1030 (Desktop):
119.2 [X] Intel Xeon E5-2680 v4 2.4GHz
GeForce GT 1030 (Desktop)
min:
95 fps, max:
142 fps
fps
100%
GeForce GT 1030 (Desktop):
54.5 [X] Intel Xeon E5-2680 v4 2.4GHz
GeForce GT 1030 (Desktop)
min:
45 fps, max:
64 fps
fps
100%
GeForce GT 1030 (Desktop):
33.8 [X] Intel Xeon E5-2680 v4 2.4GHz
GeForce GT 1030 (Desktop)
min:
28 fps, max:
40 fps
fps
509%
GeForce GTX 1080 Max-Q:
172 [X] Asus Zephyrus GX501 Intel Core i7-7700HQ 2.8GHz
GeForce GTX 1080 Max-Q
min:
142 fps, max:
207 fps
fps
100%
GeForce GT 1030 (Desktop):
16.5 [X] Intel Xeon E5-2680 v4 2.4GHz
GeForce GT 1030 (Desktop)
min:
14 fps, max:
19 fps
fps
425%
GeForce GTX 1070 Max-Q:
70.1 fps
100%
GeForce GT 1030 (Desktop):
81 [X] Intel Xeon E5-2680 v4 2.4GHz
GeForce GT 1030 (Desktop)
min:
61 fps, max:
109 fps
93.3 [X] AMD Ryzen 7 1800X 3.6GHz
GeForce GT 1030 (Desktop)
min:
70 fps, max:
125 fps
~ 87 fps
100%
GeForce GT 1030 (Desktop):
61.7 [X] Intel Xeon E5-2680 v4 2.4GHz
GeForce GT 1030 (Desktop)
min:
51 fps, max:
88 fps
66.4 [X] AMD Ryzen 7 1800X 3.6GHz
GeForce GT 1030 (Desktop)
min:
49 fps, max:
96 fps
~ 64 fps
100%
GeForce GT 1030 (Desktop):
29.3 [X] Intel Xeon E5-2680 v4 2.4GHz
GeForce GT 1030 (Desktop)
min:
21 fps, max:
46 fps
29.8 [X] AMD Ryzen 7 1800X 3.6GHz
GeForce GT 1030 (Desktop)
min:
22 fps, max:
42 fps
~ 30 fps
447%
GeForce GTX 1080 Max-Q:
134 fps
383%
GeForce GTX 1070 Max-Q:
115 [X] MSI GS63VR 7RG Intel Core i7-7700HQ 2.8GHz
GeForce GTX 1070 Max-Q
115 [X] SCHENKER Key 15 Coffee Lake Intel Core i7-8750H 2.2GHz
GeForce GTX 1070 Max-Q
~ 115 fps
100%
GeForce GT 1030 (Desktop):
20.8 [X] Intel Xeon E5-2680 v4 2.4GHz
GeForce GT 1030 (Desktop)
min:
13 fps, max:
34 fps
21.5 [X] AMD Ryzen 7 1800X 3.6GHz
GeForce GT 1030 (Desktop)
min:
14 fps, max:
34 fps
~ 21 fps
610%
GeForce GTX 1080 Max-Q:
128 fps
519%
GeForce GTX 1070 Max-Q:
106 [X] SCHENKER Key 15 Coffee Lake Intel Core i7-8750H 2.2GHz
GeForce GTX 1070 Max-Q
112 [X] MSI GS63VR 7RG Intel Core i7-7700HQ 2.8GHz
GeForce GTX 1070 Max-Q
~ 109 fps
100%
GeForce GT 1030 (Desktop):
8.7 [X] Intel Xeon E5-2680 v4 2.4GHz
GeForce GT 1030 (Desktop)
min:
6 fps, max:
13 fps
10.2 [X] AMD Ryzen 7 1800X 3.6GHz
GeForce GT 1030 (Desktop)
min:
7 fps, max:
16 fps
~ 9 fps
599%
GeForce GTX 1080 Max-Q:
53.9 fps
493%
GeForce GTX 1070 Max-Q:
44.4 [X] MSI GS63VR 7RG Intel Core i7-7700HQ 2.8GHz
GeForce GTX 1070 Max-Q
fps
GeForce GTX 1080 Max-Q:
105.3 [X] NVIDIA GeForce GTX 1080 Max-Q (Nvidia Reference GX501) DX12
Intel Core i7-7700HQ 2.8GHz
GeForce GTX 1080 Max-Q
fps
100%
GeForce GT 1030 (Desktop):
78 [X] Intel Xeon E5-2680 v4 2.4GHz
GeForce GT 1030 (Desktop)
78.3 [X] AMD Ryzen 7 1800X 3.6GHz
GeForce GT 1030 (Desktop)
~ 78 fps
100%
GeForce GT 1030 (Desktop):
47.5 [X] Intel Xeon E5-2680 v4 2.4GHz
GeForce GT 1030 (Desktop)
47.6 [X] AMD Ryzen 7 1800X 3.6GHz
GeForce GT 1030 (Desktop)
~ 48 fps
100%
GeForce GT 1030 (Desktop):
11.8 [X] Intel Xeon E5-2680 v4 2.4GHz
GeForce GT 1030 (Desktop)
11.9 [X] AMD Ryzen 7 1800X 3.6GHz
GeForce GT 1030 (Desktop)
~ 12 fps
908%
GeForce GTX 1080 Max-Q:
107 110 [X] Asus Zephyrus GX501 Intel Core i7-7700HQ 2.8GHz
GeForce GTX 1080 Max-Q
min:
74 fps
~ 109 fps
717%
GeForce GTX 1070 Max-Q:
83.9 [X] SCHENKER Key 15 Coffee Lake Intel Core i7-8750H 2.2GHz
GeForce GTX 1070 Max-Q
88.6 [X] MSI GS63VR 7RG Intel Core i7-7700HQ 2.8GHz
GeForce GTX 1070 Max-Q
~ 86 fps
100%
GeForce GT 1030 (Desktop):
8.3 [X] Intel Xeon E5-2680 v4 2.4GHz
GeForce GT 1030 (Desktop)
8.3 [X] AMD Ryzen 7 1800X 3.6GHz
GeForce GT 1030 (Desktop)
~ 8 fps
1075%
GeForce GTX 1080 Max-Q:
83.8 85.4 [X] NVIDIA GeForce GTX 1080 Max-Q (Nvidia Reference GX501) DX12, Very High Preset
Intel Core i7-7700HQ 2.8GHz
GeForce GTX 1080 Max-Q
87.8 [X] Asus Zephyrus GX501 Intel Core i7-7700HQ 2.8GHz
GeForce GTX 1080 Max-Q
min:
58 fps
~ 86 fps
863%
GeForce GTX 1070 Max-Q:
65.3 [X] SCHENKER Key 15 Coffee Lake Intel Core i7-8750H 2.2GHz
GeForce GTX 1070 Max-Q
72 [X] MSI GS63VR 7RG Intel Core i7-7700HQ 2.8GHz
GeForce GTX 1070 Max-Q
~ 69 fps
100%
GeForce GT 1030 (Desktop):
6.8 [X] Intel Xeon E5-2680 v4 2.4GHz
GeForce GT 1030 (Desktop)
6.9 [X] AMD Ryzen 7 1800X 3.6GHz
GeForce GT 1030 (Desktop)
~ 7 fps
600%
GeForce GTX 1080 Max-Q:
40.8 42.5 [X] Asus Zephyrus GX501 Intel Core i7-7700HQ 2.8GHz
GeForce GTX 1080 Max-Q
min:
18 fps, max:
54 fps
~ 42 fps
480%
GeForce GTX 1070 Max-Q:
33.6 [X] MSI GS63VR 7RG Intel Core i7-7700HQ 2.8GHz
GeForce GTX 1070 Max-Q
fps
100%
GeForce GT 1030 (Desktop):
67 [X] Intel Xeon E5-2680 v4 2.4GHz
GeForce GT 1030 (Desktop)
min:
61 fps, max:
77 fps
68 [X] AMD Ryzen 7 1800X 3.6GHz
GeForce GT 1030 (Desktop)
~ 68 fps
100%
GeForce GT 1030 (Desktop):
30 [X] Intel Xeon E5-2680 v4 2.4GHz
GeForce GT 1030 (Desktop)
min:
28 fps, max:
34 fps
31 [X] AMD Ryzen 7 1800X 3.6GHz
GeForce GT 1030 (Desktop)
~ 31 fps
100%
GeForce GT 1030 (Desktop):
27 [X] Intel Xeon E5-2680 v4 2.4GHz
GeForce GT 1030 (Desktop)
min:
24 fps, max:
30 fps
27 [X] AMD Ryzen 7 1800X 3.6GHz
GeForce GT 1030 (Desktop)
~ 27 fps
341%
GeForce GTX 1080 Max-Q:
92 fps
341%
GeForce GTX 1070 Max-Q:
92 [X] MSI GS63VR 7RG Intel Core i7-7700HQ 2.8GHz
GeForce GTX 1070 Max-Q
fps
100%
GeForce GT 1030 (Desktop):
19 [X] Intel Xeon E5-2680 v4 2.4GHz
GeForce GT 1030 (Desktop)
min:
15 fps, max:
24 fps
20 [X] AMD Ryzen 7 1800X 3.6GHz
GeForce GT 1030 (Desktop)
~ 20 fps
435%
GeForce GTX 1080 Max-Q:
87 fps
380%
GeForce GTX 1070 Max-Q:
76 [X] MSI GS63VR 7RG Intel Core i7-7700HQ 2.8GHz
GeForce GTX 1070 Max-Q
fps
100%
GeForce GT 1030 (Desktop):
7 [X] Intel Xeon E5-2680 v4 2.4GHz
GeForce GT 1030 (Desktop)
min:
6 fps, max:
8 fps
7 [X] AMD Ryzen 7 1800X 3.6GHz
GeForce GT 1030 (Desktop)
~ 7 fps
586%
GeForce GTX 1080 Max-Q:
41 fps
486%
GeForce GTX 1070 Max-Q:
34 [X] MSI GS63VR 7RG Intel Core i7-7700HQ 2.8GHz
GeForce GTX 1070 Max-Q
fps
100%
GeForce GT 1030 (Desktop):
72.9 [X] Intel Xeon E5-2680 v4 2.4GHz
GeForce GT 1030 (Desktop)
min:
68 fps, max:
81 fps
75.3 [X] AMD Ryzen 7 1800X 3.6GHz
GeForce GT 1030 (Desktop)
min:
69 fps, max:
81 fps
~ 74 fps
100%
GeForce GT 1030 (Desktop):
45 [X] Intel Xeon E5-2680 v4 2.4GHz
GeForce GT 1030 (Desktop)
min:
42 fps, max:
50 fps
45.9 [X] AMD Ryzen 7 1800X 3.6GHz
GeForce GT 1030 (Desktop)
min:
42 fps, max:
51 fps
~ 45 fps
100%
GeForce GT 1030 (Desktop):
23.9 [X] AMD Ryzen 7 1800X 3.6GHz
GeForce GT 1030 (Desktop)
min:
23 fps, max:
26 fps
24.3 [X] Intel Xeon E5-2680 v4 2.4GHz
GeForce GT 1030 (Desktop)
min:
22 fps, max:
28 fps
~ 24 fps
521%
GeForce GTX 1080 Max-Q:
125 fps
404%
GeForce GTX 1070 Max-Q:
85.7 97.7 97.8 100 [X] MSI GS63VR 7RG Intel Core i7-7700HQ 2.8GHz
GeForce GTX 1070 Max-Q
102.8 ~ 97 fps
100%
GeForce GT 1030 (Desktop):
19.3 [X] Intel Xeon E5-2680 v4 2.4GHz
GeForce GT 1030 (Desktop)
min:
17 fps, max:
22 fps
20.1 [X] AMD Ryzen 7 1800X 3.6GHz
GeForce GT 1030 (Desktop)
min:
17 fps, max:
23 fps
~ 20 fps
550%
GeForce GTX 1080 Max-Q:
105 114.2 [X] NVIDIA GeForce GTX 1080 Max-Q (Nvidia Reference GX501) DX12, Very High Preset, FXAA
Intel Core i7-7700HQ 2.8GHz
GeForce GTX 1080 Max-Q
~ 110 fps
100%
GeForce GT 1030 (Desktop):
7.2 [X] Intel Xeon E5-2680 v4 2.4GHz
GeForce GT 1030 (Desktop)
min:
6 fps, max:
9 fps
8 [X] AMD Ryzen 7 1800X 3.6GHz
GeForce GT 1030 (Desktop)
min:
7 fps, max:
10 fps
~ 8 fps
545%
GeForce GTX 1080 Max-Q:
43.6 fps
425%
GeForce GTX 1070 Max-Q:
32.1 33.6 36 [X] MSI GS63VR 7RG Intel Core i7-7700HQ 2.8GHz
GeForce GTX 1070 Max-Q
~ 34 fps
100%
GeForce GT 1030 (Desktop):
143.6 [X] Intel Xeon E5-2680 v4 2.4GHz
GeForce GT 1030 (Desktop)
min:
10 fps, max:
298 fps
144.1 [X] AMD Ryzen 7 1800X 3.6GHz
GeForce GT 1030 (Desktop)
~ 144 fps
100%
GeForce GT 1030 (Desktop):
89.9 [X] Intel Xeon E5-2680 v4 2.4GHz
GeForce GT 1030 (Desktop)
min:
54.3 fps, max:
154.9 fps
90.2 [X] AMD Ryzen 7 1800X 3.6GHz
GeForce GT 1030 (Desktop)
~ 90 fps
100%
GeForce GT 1030 (Desktop):
46.2 [X] Intel Xeon E5-2680 v4 2.4GHz
GeForce GT 1030 (Desktop)
min:
25 fps, max:
65 fps
46.5 [X] AMD Ryzen 7 1800X 3.6GHz
GeForce GT 1030 (Desktop)
~ 46 fps
439%
GeForce GTX 1080 Max-Q:
197 206 [X] Asus Zephyrus GX501 Intel Core i7-7700HQ 2.8GHz
GeForce GTX 1080 Max-Q
min:
122 fps, max:
331 fps
~ 202 fps
359%
GeForce GTX 1070 Max-Q:
161 [X] SCHENKER Key 15 Coffee Lake Intel Core i7-8750H 2.2GHz
GeForce GTX 1070 Max-Q
168 [X] MSI GS63VR 7RG Intel Core i7-7700HQ 2.8GHz
GeForce GTX 1070 Max-Q
~ 165 fps
100%
GeForce GT 1030 (Desktop):
36.2 [X] Intel Xeon E5-2680 v4 2.4GHz
GeForce GT 1030 (Desktop)
min:
10 fps, max:
47 fps
36.3 [X] AMD Ryzen 7 1800X 3.6GHz
GeForce GT 1030 (Desktop)
~ 36 fps
483%
GeForce GTX 1080 Max-Q:
172 176 [X] Asus Zephyrus GX501 Intel Core i7-7700HQ 2.8GHz
GeForce GTX 1080 Max-Q
min:
108 fps, max:
270 fps
~ 174 fps
400%
GeForce GTX 1070 Max-Q:
143 [X] SCHENKER Key 15 Coffee Lake Intel Core i7-8750H 2.2GHz
GeForce GTX 1070 Max-Q
144 [X] MSI GS63VR 7RG Intel Core i7-7700HQ 2.8GHz
GeForce GTX 1070 Max-Q
~ 144 fps
100%
GeForce GT 1030 (Desktop):
10.8 [X] Intel Xeon E5-2680 v4 2.4GHz
GeForce GT 1030 (Desktop)
min:
8 fps, max:
13 fps
11 [X] AMD Ryzen 7 1800X 3.6GHz
GeForce GT 1030 (Desktop)
~ 11 fps
618%
GeForce GTX 1080 Max-Q:
65.7 70 [X] Asus Zephyrus GX501 Intel Core i7-7700HQ 2.8GHz
GeForce GTX 1080 Max-Q
min:
46 fps, max:
141 fps
~ 68 fps
495%
GeForce GTX 1070 Max-Q:
54.4 [X] MSI GS63VR 7RG Intel Core i7-7700HQ 2.8GHz
GeForce GTX 1070 Max-Q
fps
GeForce GTX 1080 Max-Q:
164 fps
GeForce GTX 1070 Max-Q:
136 [X] MSI GS63VR 7RG Intel Core i7-7700HQ 2.8GHz
GeForce GTX 1070 Max-Q
fps
GeForce GTX 1080 Max-Q:
144 fps
GeForce GTX 1070 Max-Q:
121 [X] MSI GS63VR 7RG Intel Core i7-7700HQ 2.8GHz
GeForce GTX 1070 Max-Q
fps
GeForce GTX 1080 Max-Q:
55.6 fps
GeForce GTX 1070 Max-Q:
44.7 [X] MSI GS63VR 7RG Intel Core i7-7700HQ 2.8GHz
GeForce GTX 1070 Max-Q
fps
GeForce GTX 1080 Max-Q:
74.4 fps
GeForce GTX 1070 Max-Q:
78.8 [X] MSI GS63VR 7RG Intel Core i7-7700HQ 2.8GHz
GeForce GTX 1070 Max-Q
fps
GeForce GTX 1080 Max-Q:
50.3 fps
GeForce GTX 1070 Max-Q:
43.6 [X] MSI GS63VR 7RG Intel Core i7-7700HQ 2.8GHz
GeForce GTX 1070 Max-Q
fps
GeForce GTX 1080 Max-Q:
40 fps
GeForce GTX 1070 Max-Q:
33.4 [X] MSI GS63VR 7RG Intel Core i7-7700HQ 2.8GHz
GeForce GTX 1070 Max-Q
fps
GeForce GTX 1070 Max-Q:
34.3 fps
GeForce GTX 1070 Max-Q:
205.4 fps
GeForce GTX 1070 Max-Q:
169.8 fps
GeForce GTX 1070 Max-Q:
146.3 fps
GeForce GTX 1070 Max-Q:
140.7 fps
GeForce GTX 1070 Max-Q:
60 fps
GeForce GTX 1070 Max-Q:
60 60 60 ~ 60 fps
GeForce GTX 1070 Max-Q:
59 fps
GeForce GTX 1080 Max-Q:
116.9 [X] Asus Zephyrus GX501 Intel Core i7-7700HQ 2.8GHz
GeForce GTX 1080 Max-Q
min:
100.9 fps
fps
GeForce GTX 1070 Max-Q:
126.9 fps
GeForce GTX 1080 Max-Q:
110.2 [X] Asus Zephyrus GX501 Intel Core i7-7700HQ 2.8GHz
GeForce GTX 1080 Max-Q
min:
95.1 fps
fps
GeForce GTX 1070 Max-Q:
118.2 fps
GeForce GTX 1080 Max-Q:
106 [X] Asus Zephyrus GX501 Intel Core i7-7700HQ 2.8GHz
GeForce GTX 1080 Max-Q
min:
91.2 fps
fps
GeForce GTX 1070 Max-Q:
111.7 fps
GeForce GTX 1080 Max-Q:
102.4 [X] Asus Zephyrus GX501 Intel Core i7-7700HQ 2.8GHz
GeForce GTX 1080 Max-Q
min:
88.9 fps
fps
GeForce GTX 1070 Max-Q:
109.7 fps
GeForce GTX 1080 Max-Q:
124 fps
GeForce GTX 1070 Max-Q:
94 [X] Smart7 Deimos GX15E G1 Intel Core i7-7700HQ 2.8GHz
GeForce GTX 1070 Max-Q
106 111 112 [X] MSI GS63VR 7RG Intel Core i7-7700HQ 2.8GHz
GeForce GTX 1070 Max-Q
~ 106 fps
GeForce GTX 1080 Max-Q:
88 fps
GeForce GTX 1070 Max-Q:
56 64 [X] Smart7 Deimos GX15E G1 Intel Core i7-7700HQ 2.8GHz
GeForce GTX 1070 Max-Q
73 [X] MSI GS63VR 7RG Intel Core i7-7700HQ 2.8GHz
GeForce GTX 1070 Max-Q
73 79 ~ 69 fps
GeForce GTX 1080 Max-Q:
48 fps
GeForce GTX 1070 Max-Q:
37 40 [X] MSI GS63VR 7RG Intel Core i7-7700HQ 2.8GHz
GeForce GTX 1070 Max-Q
~ 39 fps
100%
GeForce GT 1030 (Desktop):
68.7 [X] Intel Xeon E5-2680 v4 2.4GHz
GeForce GT 1030 (Desktop)
min:
46 fps, max:
76 fps
69 [X] AMD Ryzen 7 1800X 3.6GHz
GeForce GT 1030 (Desktop)
~ 69 fps
404%
GeForce GTX 1080 Max-Q:
278.6 fps
100%
GeForce GT 1030 (Desktop):
41.5 [X] Intel Xeon E5-2680 v4 2.4GHz
GeForce GT 1030 (Desktop)
min:
37 fps, max:
46 fps
42.1 [X] AMD Ryzen 7 1800X 3.6GHz
GeForce GT 1030 (Desktop)
~ 42 fps
480%
GeForce GTX 1080 Max-Q:
201.6 fps
100%
GeForce GT 1030 (Desktop):
21.1 [X] Intel Xeon E5-2680 v4 2.4GHz
GeForce GT 1030 (Desktop)
min:
17 fps, max:
24 fps
21.5 [X] AMD Ryzen 7 1800X 3.6GHz
GeForce GT 1030 (Desktop)
~ 21 fps
448%
GeForce GTX 1070 Max-Q:
71.2 [X] Smart7 Deimos GX15E G1 Intel Core i7-7700HQ 2.8GHz
GeForce GTX 1070 Max-Q
89.9 [X] SCHENKER Key 15 Coffee Lake Intel Core i7-8750H 2.2GHz
GeForce GTX 1070 Max-Q
90.3 90.4 91.3 [X] SCHENKER Key 15 Coffee Lake Intel Core i7-8750H 2.2GHz
GeForce GTX 1070 Max-Q
91.6 92.8 93.2 94.5 95.5 96 97 97.1 [X] MSI GS63VR 7RG Intel Core i7-7700HQ 2.8GHz
GeForce GTX 1070 Max-Q
97.7 98.2 99.4 100 [X] Asus Zephyrus S GX531GS Turbo Mode Intel Core i7-8750H 2.2GHz
GeForce GTX 1070 Max-Q
101.6 ~ 94 fps
100%
GeForce GT 1030 (Desktop):
11.8 [X] Intel Xeon E5-2680 v4 2.4GHz
GeForce GT 1030 (Desktop)
min:
8 fps, max:
15 fps
12 [X] AMD Ryzen 7 1800X 3.6GHz
GeForce GT 1030 (Desktop)
~ 12 fps
533%
GeForce GTX 1080 Max-Q:
61.9 62.9 64.2 68.1 [X] Asus Zephyrus GX501 Intel Core i7-7700HQ 2.8GHz
GeForce GTX 1080 Max-Q
min:
56 fps, max:
77 fps
~ 64 fps
425%
GeForce GTX 1070 Max-Q:
46 48.9 49.2 49.6 49.8 [X] SCHENKER Key 15 Coffee Lake Intel Core i7-8750H 2.2GHz
GeForce GTX 1070 Max-Q
50.2 50.2 [X] SCHENKER Key 15 Coffee Lake Intel Core i7-8750H 2.2GHz
GeForce GTX 1070 Max-Q
50.7 [X] Smart7 Deimos GX15E G1 Intel Core i7-7700HQ 2.8GHz
GeForce GTX 1070 Max-Q
51 51.3 51.5 52.4 52.4 52.7 53.5 53.7 [X] MSI GS63VR 7RG Intel Core i7-7700HQ 2.8GHz
GeForce GTX 1070 Max-Q
54.2 55.3 [X] Asus Zephyrus S GX531GS Turbo Mode Intel Core i7-8750H 2.2GHz
GeForce GTX 1070 Max-Q
55.3 ~ 51 fps
GeForce GTX 1080 Max-Q:
43.7 45.3 [X] Asus Zephyrus GX501 Intel Core i7-7700HQ 2.8GHz
GeForce GTX 1080 Max-Q
min:
40 fps, max:
50 fps
~ 45 fps
GeForce GTX 1070 Max-Q:
27.7 35.4 [X] MSI GS63VR 7RG Intel Core i7-7700HQ 2.8GHz
GeForce GTX 1070 Max-Q
~ 32 fps
100%
GeForce GT 1030 (Desktop):
162.4 [X] Intel Xeon E5-2680 v4 2.4GHz
GeForce GT 1030 (Desktop)
min:
6 fps, max:
315 fps
162.9 [X] AMD Ryzen 7 1800X 3.6GHz
GeForce GT 1030 (Desktop)
~ 163 fps
98%
GeForce GTX 1080 Max-Q:
151 [X] Asus Zephyrus GX501 Intel Core i7-7700HQ 2.8GHz
GeForce GTX 1080 Max-Q
min:
4.15 fps, P1:
90.9 fps, max:
290 fps
167 ~ 159 fps
102%
GeForce GTX 1070 Max-Q:
166.7 fps
100%
GeForce GT 1030 (Desktop):
144.4 [X] Intel Xeon E5-2680 v4 2.4GHz
GeForce GT 1030 (Desktop)
min:
32 fps, max:
286 fps
144.6 [X] AMD Ryzen 7 1800X 3.6GHz
GeForce GT 1030 (Desktop)
~ 145 fps
105%
GeForce GTX 1080 Max-Q:
144 [X] Asus Zephyrus GX501 Intel Core i7-7700HQ 2.8GHz
GeForce GTX 1080 Max-Q
min:
5.01 fps, P1:
83.3 fps, max:
266 fps
159 ~ 152 fps
110%
GeForce GTX 1070 Max-Q:
159.8 fps
100%
GeForce GT 1030 (Desktop):
38.9 [X] Intel Xeon E5-2680 v4 2.4GHz
GeForce GT 1030 (Desktop)
min:
7 fps, max:
194 fps
39 [X] AMD Ryzen 7 1800X 3.6GHz
GeForce GT 1030 (Desktop)
~ 39 fps
310%
GeForce GTX 1080 Max-Q:
112 [X] Asus Zephyrus GX501 Intel Core i7-7700HQ 2.8GHz
GeForce GTX 1080 Max-Q
min:
10.1 fps, P1:
71.4 fps, max:
172 fps
129 ~ 121 fps
374%
GeForce GTX 1070 Max-Q:
145.9 fps
100%
GeForce GT 1030 (Desktop):
19.4 [X] Intel Xeon E5-2680 v4 2.4GHz
GeForce GT 1030 (Desktop)
min:
3 fps, max:
105 fps
19.6 [X] AMD Ryzen 7 1800X 3.6GHz
GeForce GT 1030 (Desktop)
~ 20 fps
340%
GeForce GTX 1080 Max-Q:
63.9 [X] Asus Zephyrus GX501 Intel Core i7-7700HQ 2.8GHz
GeForce GTX 1080 Max-Q
min:
9.58 fps, P1:
43.5 fps, max:
137 fps
72 ~ 68 fps
323%
GeForce GTX 1070 Max-Q:
64.6 fps
GeForce GTX 1080 Max-Q:
61.1 [X] Asus Zephyrus GX501 Intel Core i7-7700HQ 2.8GHz
GeForce GTX 1080 Max-Q
min:
5.32 fps, P1:
40 fps, max:
133 fps
fps
100%
GeForce GT 1030 (Desktop):
11.9 [X] Intel Xeon E5-2680 v4 2.4GHz
GeForce GT 1030 (Desktop)
min:
2 fps, max:
250 fps
12.1 [X] AMD Ryzen 7 1800X 3.6GHz
GeForce GT 1030 (Desktop)
~ 12 fps
533%
GeForce GTX 1080 Max-Q:
64 64.1 [X] Asus Zephyrus GX501 Intel Core i7-7700HQ 2.8GHz
GeForce GTX 1080 Max-Q
min:
20.8 fps, P1:
47.6 fps, max:
112 fps
~ 64 fps
100%
GeForce GT 1030 (Desktop):
188.5 [X] Intel Xeon E5-2680 v4 2.4GHz
GeForce GT 1030 (Desktop)
min:
140 fps, max:
200 fps
189.1 [X] AMD Ryzen 7 1800X 3.6GHz
GeForce GT 1030 (Desktop)
~ 189 fps
100%
GeForce GT 1030 (Desktop):
155 [X] Intel Xeon E5-2680 v4 2.4GHz
GeForce GT 1030 (Desktop)
min:
81 fps, max:
199 fps
156 [X] AMD Ryzen 7 1800X 3.6GHz
GeForce GT 1030 (Desktop)
~ 156 fps
100%
GeForce GT 1030 (Desktop):
110 [X] Intel Xeon E5-2680 v4 2.4GHz
GeForce GT 1030 (Desktop)
min:
57 fps, max:
129 fps
110.5 [X] AMD Ryzen 7 1800X 3.6GHz
GeForce GT 1030 (Desktop)
~ 110 fps
100%
GeForce GT 1030 (Desktop):
72 [X] Intel Xeon E5-2680 v4 2.4GHz
GeForce GT 1030 (Desktop)
min:
17 fps, max:
92 fps
72.3 [X] AMD Ryzen 7 1800X 3.6GHz
GeForce GT 1030 (Desktop)
~ 72 fps
GeForce GTX 1070 Max-Q:
70.8 [X] Smart7 Deimos GX15E G1 Intel Core i7-7700HQ 2.8GHz
GeForce GTX 1070 Max-Q
fps
GeForce GTX 1070 Max-Q:
68.3 [X] Smart7 Deimos GX15E G1 Intel Core i7-7700HQ 2.8GHz
GeForce GTX 1070 Max-Q
93.3 95.1 98.8 ~ 89 fps
100%
GeForce GT 1030 (Desktop):
160.9 [X] Intel Xeon E5-2680 v4 2.4GHz
GeForce GT 1030 (Desktop)
min:
142 fps, max:
201 fps
171.5 [X] AMD Ryzen 7 1800X 3.6GHz
GeForce GT 1030 (Desktop)
~ 166 fps
100%
GeForce GT 1030 (Desktop):
109.3 [X] Intel Xeon E5-2680 v4 2.4GHz
GeForce GT 1030 (Desktop)
min:
101 fps, max:
134 fps
110 [X] AMD Ryzen 7 1800X 3.6GHz
GeForce GT 1030 (Desktop)
~ 110 fps
100%
GeForce GT 1030 (Desktop):
76.8 [X] Intel Xeon E5-2680 v4 2.4GHz
GeForce GT 1030 (Desktop)
min:
71 fps, max:
96 fps
77.2 [X] AMD Ryzen 7 1800X 3.6GHz
GeForce GT 1030 (Desktop)
~ 77 fps
100%
GeForce GT 1030 (Desktop):
31.8 [X] Intel Xeon E5-2680 v4 2.4GHz
GeForce GT 1030 (Desktop)
min:
28 fps, max:
41 fps
32.1 [X] AMD Ryzen 7 1800X 3.6GHz
GeForce GT 1030 (Desktop)
~ 32 fps
GeForce GTX 1070 Max-Q:
170.4 [X] Smart7 Deimos GX15E G1 Intel Core i7-7700HQ 2.8GHz
GeForce GTX 1070 Max-Q
fps
GeForce GTX 1070 Max-Q:
72.8 [X] Smart7 Deimos GX15E G1 Intel Core i7-7700HQ 2.8GHz
GeForce GTX 1070 Max-Q
fps
100%
GeForce GT 1030 (Desktop):
218.9 [X] Intel Xeon E5-2680 v4 2.4GHz
GeForce GT 1030 (Desktop)
min:
58.4 fps, max:
425.4 fps
221 [X] AMD Ryzen 7 1800X 3.6GHz
GeForce GT 1030 (Desktop)
~ 220 fps
124%
GeForce GTX 1080 Max-Q:
272.3 fps
100%
GeForce GT 1030 (Desktop):
120 [X] AMD Ryzen 7 1800X 3.6GHz
GeForce GT 1030 (Desktop)
120.4 [X] Intel Xeon E5-2680 v4 2.4GHz
GeForce GT 1030 (Desktop)
min:
57.2 fps, max:
233.2 fps
~ 120 fps
203%
GeForce GTX 1080 Max-Q:
243.6 fps
100%
GeForce GT 1030 (Desktop):
101.2 [X] AMD Ryzen 7 1800X 3.6GHz
GeForce GT 1030 (Desktop)
101.8 [X] Intel Xeon E5-2680 v4 2.4GHz
GeForce GT 1030 (Desktop)
min:
44.4 fps, max:
186.1 fps
~ 102 fps
227%
GeForce GTX 1080 Max-Q:
232 fps
100%
GeForce GT 1030 (Desktop):
37.1 [X] AMD Ryzen 7 1800X 3.6GHz
GeForce GT 1030 (Desktop)
37.2 [X] Intel Xeon E5-2680 v4 2.4GHz
GeForce GT 1030 (Desktop)
min:
20.2 fps, max:
54.9 fps
~ 37 fps
441%
GeForce GTX 1080 Max-Q:
151.7 175 [X] Asus Zephyrus GX501 Intel Core i7-7700HQ 2.8GHz
GeForce GTX 1080 Max-Q
~ 163 fps
GeForce GTX 1080 Max-Q:
486.5 fps
GeForce GTX 1080 Max-Q:
461.9 fps
GeForce GTX 1080 Max-Q:
419.2 fps
GeForce GTX 1080 Max-Q:
230.4 fps
GeForce GTX 1070 Max-Q:
62.2 70 ~ 66 fps
Average Gaming NVIDIA GeForce GT 1030 (Desktop) → 100% Average Gaming 30-70 fps → 100%
Average Gaming NVIDIA GeForce GTX 1080 Max-Q → 499% Average Gaming 30-70 fps → 603%
Average Gaming NVIDIA GeForce GTX 1070 Max-Q → 390% Average Gaming 30-70 fps → 438%
For more games that might be playable and a list of all games and graphics cards visit our Gaming List
v1.26
log 18. 05:52:06
#0 checking url part for id 7996 +0s ... 0s
#1 checking url part for id 8006 +0s ... 0s
#2 checking url part for id 8008 +0s ... 0s
#3 not redirecting to Ajax server +0s ... 0s
#4 did not recreate cache, as it is less than 5 days old! Created at Tue, 16 Apr 2024 05:39:00 +0200 +0.001s ... 0.001s
#5 composed specs +0.15s ... 0.151s
#6 did output specs +0s ... 0.151s
#7 start showIntegratedCPUs +0s ... 0.151s
#8 getting avg benchmarks for device 7996 +0.074s ... 0.225s
#9 got single benchmarks 7996 +0.018s ... 0.242s
#10 getting avg benchmarks for device 8006 +0.019s ... 0.262s
#11 got single benchmarks 8006 +0.022s ... 0.284s
#12 getting avg benchmarks for device 8008 +0.018s ... 0.301s
#13 got single benchmarks 8008 +0.052s ... 0.354s
#14 got avg benchmarks for devices +0s ... 0.354s
#15 min, max, avg, median took s +0.602s ... 0.955s
#16 before gaming benchmark output +0s ... 0.955s
#17 Got 1566 rows for game benchmarks. +0.19s ... 1.145s
#18 composed SQL query for gamebenchmarks +0s ... 1.145s
#19 got data and put it in $dataArray +0.136s ... 1.281s
#20 benchmarks composed for output. +0.401s ... 1.682s
#21 calculated avg scores. +0s ... 1.682s
#22 return log +0.006s ... 1.688s
Please share our article, every link counts!
Redaktion, 2017-09- 8 (Update: 2023-07- 1)
 Deutsch
 English
 Español
 Français
 Italiano
 Nederlands
 Polski
 Português
 Русский
 Türkçe
 Svenska
 Chinese
 Magyar