ERROR: No GPU found with the ID:9200

getGPUInfos: Perhaps the translation is missing or the German GPU is not selected in the page header (or a wrong one is selected) NVIDIA GeForce 9200M GS vs vs Vivante GC1000+ Dual-Core
Notebookcheck Logo

NVIDIA GeForce 9200M GS vs vs Vivante GC1000+ Dual-Core

NVIDIA GeForce 9200M GS

► remove from comparison NVIDIA GeForce 9200M GS

The Nvidia GeForce 9200M GS is a slower clocked 9300M GS chip and therefore also DirectX 10 capable.

Compared to the old 8400M series or the 9300M G, the 9200M GS features only 8 unified shaders and is produced in 65nm. Furthermore, it integrates the new VP3 video processor (8400M, 9300M G had VP2) with more video features and better hd-video decoding support.

In conjunction with the Nvidia 9100M G integrated graphics, the 9200M GS supports Hybrid-SLI (HybridPower and GeForceBoost). HybridPower is a technique to choose between the integrated and dedicated graphics core, if performance or battery runtime is needed. This works only in Windows Vista. Up to now the user has to use a tool to switch between the GPUs. Later Nvidia wants to switch automatically in the drivers. GeForceBoost uses the integrated graphics core of the 9100M G and the dedicated of the 9200M in SLI mode to achieve better frame rates.

As the 8400M G, the 9200M GS features 8 stream processors that do the work of the former dedicated pixel- and vertex-shaders. The unified shaders of Nvidia are 1-dimensional (AMD has 5-dimensional shaders which leads to the higher number of shaders).

Compared to the old 8400M G, the 9200M GS has a higher core speed and is therefore faster. Modern DirectX 10 games will run only in low details and resolutions. Older DirectX 9 games, like HalfLife 2 or Far Cry run fluently in medium to high details.

Compared to desktop graphics cards, the upcoming 9300 GE / GS should be similar, as it will also stem from the G98 core. Still the desktop counterparts are usually higher clocked and therefore faster.

Vivante GC1000+ Dual-Core

► remove from comparison Vivante Vivante GC1000+ Dual-Core

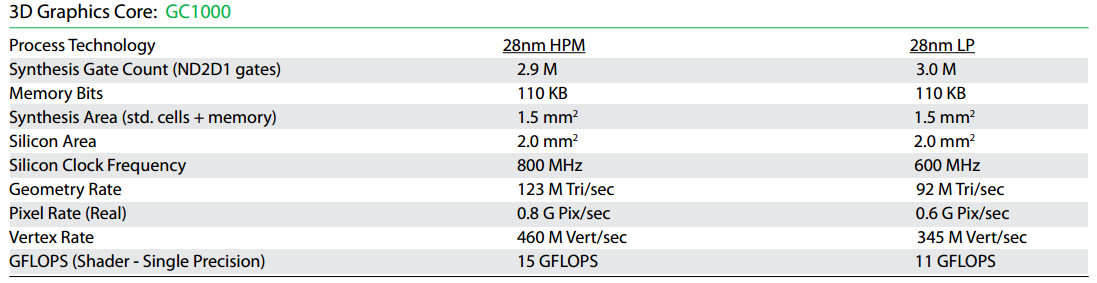
The Vivante GC1000+ Dual-Core is an integrated graphics card for ARM based SoCs. It supports Android, Windows Mobile 6, Windows CE and Linux and the standards OpenGL ES 2.0, OpenGL 2.1, OpenVG 1.1, and DirectX 11 (9_3). The chip is can be clocked with up to 600 MHz (28nm LP) or 800 MHz (28nm HPM). The theoretical calculating power of the GPU is 50 Mio triangles / s, 650 Mio pixels / s and 12 GFLOPS (according to cnx-software.com). According to Vivante however the GC1000 is capable of 345 to 460 Mio triangles /s and 11 to 15 GFLOPS.

NVIDIA GeForce 9200M GSVivante GC1000+ Dual-Core
CodenameNB9M-GE
Pipelines8 - unified2 - unified
Core Speed550 MHz600 / 800 MHz
Shader Speed1300 MHz
Memory Speed700 MHz
Memory Bus Width64 Bit
Memory TypeGDDR2, GDDR3
Max. Amount of Memory256 MB
Shared Memorynono
APIDirectX 10, Shader 4.0DirectX 9_3, OpenGL 2.1 / ES 2.0
Power Consumption13 Watt
technology65 nm
Date of Announcement03.06.2008 12.09.2013
Link to Manufacturer Pagewww.nvidia.com
Series
Vivante GC1000+ Dual-Core 2 @ 0.6 GHz
GC800 1 @ 0.32 - 0.58 GHz
Extreme Graphics 2 @ 0.13 GHz
PXP
unknown

Benchmarks

3DMark - 3DMark Ice Storm Unlimited Graphics
min: 2237     avg: 2329     median: 2373 (0%)     max: 2377 Points
3DMark - 3DMark Ice Storm Extreme Graphics
min: 997     avg: 1177     median: 1207.5 (0%)     max: 1295 Points
3DMark Vantage
3DM Vant. Perf. total + NVIDIA GeForce 9200M GS
3DMark Vantage - 3DM Vant. Perf. total
min: 326     avg: 372.5     median: 372.5 (0%)     max: 419 Points
3DM Vant. Perf. GPU no PhysX + NVIDIA GeForce 9200M GS
3DMark Vantage - 3DM Vant. Perf. GPU no PhysX
min: 249     avg: 286     median: 286 (0%)     max: 323 Points
3DMark 2001SE - 3DMark 2001 - Standard
min: 12603     avg: 13979     median: 14224 (15%)     max: 14700 Points
3DMark 03 - 3DMark 03 - Standard
min: 5178     avg: 5832     median: 5960 (3%)     max: 6070 Points
3DMark 05 - 3DMark 05 - Standard
min: 3139     avg: 3495     median: 3559 (4%)     max: 3600 Points
3DMark 06 3DMark 06 - Score Unknown Settings + NVIDIA GeForce 9200M GS
3DMark 06
min: 1300     avg: 1633     median: 1500 (2%)     max: 2100 Points
3DMark 06 - Standard 1280x1024 + NVIDIA GeForce 9200M GS
3DMark 06
min: 1810     avg: 1818     median: 1817.5 (2%)     max: 1825 Points
3DMark 06 - Standard 1280x800 + NVIDIA GeForce 9200M GS
3DMark 06
min: 2068     avg: 2083     median: 2083 (3%)     max: 2098 Points
3DMark 06 - Standard 1280x768 + NVIDIA GeForce 9200M GS
3DMark 06
1883 Points (2%)
Cinebench R10 Cinebench R10 Shading (32bit) + NVIDIA GeForce 9200M GS
Cinebench R10 - Cinebench R10 Shading (32bit)
min: 2040     avg: 2296     median: 2335 (2%)     max: 2512 Points
GFXBench 3.0 - GFXBench 3.0 Manhattan Offscreen
0 fps (0%)
GFXBench (DX / GLBenchmark) 2.7
GFXBench T-Rex HD Offscreen C24Z16 + Vivante GC1000+ Dual-Core
GFXBench (DX / GLBenchmark) 2.7 - GFXBench T-Rex HD Offscreen C24Z16
min: 2.5     avg: 2.8     median: 2.7 (0%)     max: 3.3 fps
AnTuTu 3DRating - Antutu 3DRating Off-screen
1651 Points (57%)
AnTuTu 3DRating - Antutu 3DRating Score
4981 Points (44%)
AnTuTu v3 - AnTuTu v3 GPU
5503 Points (57%)
Basemark ES 2.0 - Basemark ES 2.0
min: 13.87     avg: 18     median: 20.1 (33%)     max: 20.09 fps
Basemark X 1.0 - Basemark X 1.0 Off-Screen
min: 1.246     avg: 1.8     median: 1.8 (8%)     max: 2.262 fps
PassMark PerformanceTest Mobile V1 - PerformanceTest Mobile V1 2D Graphics Tests
min: 1549     avg: 1910     median: 1798 (2%)     max: 2667 Points
PassMark PerformanceTest Mobile V1 - PerformanceTest Mobile V1 3D Graphics Tests
min: 682     avg: 707     median: 688 (1%)     max: 753 Points
Smartbench 2012 - Smartbench 2012 Gaming Index
min: 1832     avg: 2304     median: 2322 (50%)     max: 2758 Points

Average Benchmarks NVIDIA GeForce 9200M GS → 0% n=

Average Benchmarks Vivante GC1000+ Dual-Core → 0% n=

- Range of benchmark values for this graphics card
- Average benchmark values for this graphics card
* Smaller numbers mean a higher performance
1 This benchmark is not used for the average calculation

Game Benchmarks

The following benchmarks stem from our benchmarks of review laptops. The performance depends on the used graphics memory, clock rate, processor, system settings, drivers, and operating systems. So the results don't have to be representative for all laptops with this GPU. For detailed information on the benchmark results, click on the fps number.

F.E.A.R.

F.E.A.R.

2005
low 640x480
100%
GeForce 9200M GS:
277 309 314 ~ 300 fps
med. 800x600
100%
GeForce 9200M GS:
56 63 64 ~ 61 fps
high 1024x768
100%
GeForce 9200M GS:
17 22 23 ~ 21 fps
Counter-Strike Source

Counter-Strike Source

2004
high 1024x768
100%
GeForce 9200M GS:
120  fps
Quake 3 Arena - Timedemo

Quake 3 Arena - Timedemo

1999
high 1024x768
100%
GeForce 9200M GS:
185 192.2 192.6 195.7 ~ 191 fps

Average Gaming NVIDIA GeForce 9200M GS → 100%

Average Gaming 30-70 fps → 100%

NVIDIA GeForce 9200M GSlowmed.highultraQHD4K
F.E.A.R.3006121
Counter-Strike Source120
Quake 3 Arena - Timedemo191
< 30 fps
< 60 fps
< 120 fps
≥ 120 fps


1


1
1


2


For more games that might be playable and a list of all games and graphics cards visit our Gaming List

v1.26
log 25. 03:54:34

#0 checking url part for id 753 +0s ... 0s

#1 checking url part for id 9200 +0s ... 0s

#2 checking url part for id 4572 +0s ... 0s

#3 not redirecting to Ajax server +0s ... 0s

#4 did not recreate cache, as it is less than 5 days old! Created at Mon, 22 Apr 2024 05:40:21 +0200 +0.001s ... 0.001s

#5 composed specs +0.103s ... 0.104s

#6 did output specs +0s ... 0.104s

#7 start showIntegratedCPUs +0s ... 0.104s

#8 getting avg benchmarks for device 753 +0.039s ... 0.143s

#9 got single benchmarks 753 +0.025s ... 0.169s

#10 getting avg benchmarks for device 9200 +0.002s ... 0.17s

#11 got single benchmarks 9200 +0s ... 0.171s

#12 getting avg benchmarks for device 4572 +0.002s ... 0.172s

#13 got single benchmarks 4572 +0.014s ... 0.187s

#14 got avg benchmarks for devices +0s ... 0.187s

#15 No cached benchmark found, getting uncached values +0.206s ... 0.393s

#16 min, max, avg, median took s +0.015s ... 0.408s

#17 before gaming benchmark output +0s ... 0.408s

#18 Got 14 rows for game benchmarks. +0.004s ... 0.412s

#19 composed SQL query for gamebenchmarks +0s ... 0.412s

#20 got data and put it in $dataArray +0.002s ... 0.413s

#21 benchmarks composed for output. +0.008s ... 0.421s

#22 calculated avg scores. +0s ... 0.421s

#23 return log +0.002s ... 0.423s

Please share our article, every link counts!
> Expert Reviews and News on Laptops, Smartphones and Tech Innovations > Benchmarks / Tech > Graphics Card Comparison - Head 2 Head
Redaktion, 2017-09- 8 (Update: 2023-07- 1)