NVIDIA GeForce 910M vs AMD Radeon R7 M440 vs NVIDIA Maxwell GPU Surface Book
NVIDIA GeForce 910M ► remove from comparison
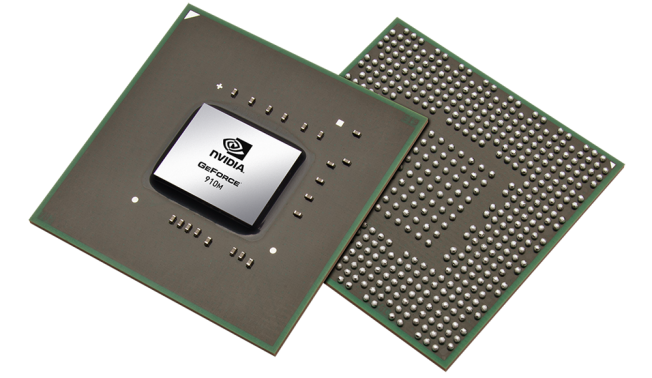
The NVIDIA GeForce 910M is an entry-level DirectX 12 compatible graphics card announced in late 2015. Its core is based on the 28nm GF117 chip (Fermi architecture) and is equipped with 64-bit DDR3 memory. The 910M is a renamed GeForce 820M, which already was based on the the old GT 620M, GT 720M and GeForce 710M.
Architecture
The GF117 is based on the optimized GF108 Fermi chip (GeForce GT 540M ) and offers 96 shaders, 16 TMUs and 4 ROPs. Each shader core is clocked twice as fast as the rest of the graphics chip, a technique known as hot clocking . More detailed information on Fermi can be found on the GT 435M GPU page.
It should be noted that the GF117 does not offer dedicated graphic ports and can therefore only be used in conjunction with Optimus.
The 820M supports GPU Boost 2.0, which can automatically overclock the card if the laptop cooling system allows it.
The shader cores (also called CUDA cores) can be used for general calculations with APIs such as CUDA, DirectCompute 2.1 and OpenCL. PhysX is theoretically possible, but the 910M is too slow to handle both PhysX and 3D rendering in modern games. 3D Vision is not supported according to Nvidia.
Power consumption
The power consumption of the Geforce 910M should be similar to the old 820M and GT 720M. As a result, the GPU is best suited for notebooks 13 inches in size or greater. The efficiency however cant be compared to a modern Maxwell based GPU like the GeForce 920MX .
AMD Radeon R7 M440 ► remove from comparison
The AMD Radeon R7 M440 is a entry level dedicated graphics card for laptops introduced in mid 2016. The technical details are the same as the previous Radeon R9 M340 . Therefore it offers 320 shader cores clocked at 1,120 MHz and 2 GB DDR3 graphics memory at 1000 MHz with a 64 Bit interface. The chip is produced in 28 nm and not the new 14 nm process as the Polaris RX 400M series cards.
The gaming performance is comparable to the Radeon R7 M340 (as it has the same specs) or an Nvidia GeForce 920M . Therefore, demanding games of 2015 and 2016 may only be playable in the lowest detail settings and low resolutions.
NVIDIA Maxwell GPU Surface Book ► remove from comparison
The Nvidia Maxwell GPU is a dedicated graphics card in the Microsoft Surface Book laptop. It is based on the Maxwell GM108 chip as the Geforce 940M with 384 shaders. Instead of the DDR3 graphics memory, the Surface Book graphics card features faster GDDR5 memory (both 64 Bit though).
Thanks to the faster graphics memory, the Surface Book Geforce is performing better than the average GeForce 940M . However, the 945M and GTX 950M are still noticeably faster. Demanding games therefore only run in low settings fluently.
More details can be found in our extensive review of the 2015 Microsoft Surface Book with the dedicated Maxwell GPU .
NVIDIA GeForce 910M AMD Radeon R7 M440 NVIDIA Maxwell GPU Surface Book GeForce 900M Series Codename N15V-GM Surface Book Architecture Kepler GCN 1.0 Maxwell Pipelines 384 - unified 320 - unified 384 - unified Core Speed 641 MHz 1021 MHz 954 - 993 (Boost) MHz Memory Speed 2000 MHz 2000 MHz 5012 MHz Memory Bus Width 64 Bit 64 Bit 64 Bit Memory Type DDR3 DDR3 GDDR5 Max. Amount of Memory 2048 MB 1024 MB Shared Memory no no no API DirectX 12 (FL 11_0), Shader 5.0 DirectX 12 DirectX 12 (FL 11_0), Shader 5.0, OpenGL 4.5 Power Consumption 15 Watt Transistors 900 Million technology 28 nm 28 nm 28 nm Features PhysX, Verde Drivers,
CUDA, Play, Optimus, GPU Boost 2.0 DirectX 12, Mantle, OpenGL, OpenCL 1.2, Vulkan, AMD Enduro GPU Boost 2.0, Optimus, PhysX, CUDA, GeForce Experience Date of Announcement 01.09.2015 01.06.2016 01.10.2015 Link to Manufacturer Page www.amd.com
Benchmarks Performance Rating - 3DMark 11 + Fire Strike + Time Spy - GeForce 910M
0.5 pt (1%)
...
...
max:
Performance Rating - 3DMark 11 + Fire Strike + Time Spy - Radeon R7 M440
0.5 pt (2%)
...
...
max:
Performance Rating - 3DMark 11 + Fire Strike + Time Spy - Maxwell GPU (940M, GDDR5)
0.9 pt (3%)
...
NVIDIA Maxwell GPU Surface Book
...
max:
3DMark - 3DMark Time Spy Score
433 Points (1%)
3DMark - 3DMark Time Spy Graphics
381 Points (1%)
3DMark - 3DMark Ice Storm Unlimited Graphics
42738 Points (5%)
min: 73952 avg: 87171 median: 87170.5 (10%) max: 100389 Points
123411 Points (14%)
3DMark - 3DMark Ice Storm Extreme Graphics
24517 Points (3%)
min: 40562 avg: 41699 median: 41699 (5%) max: 42836 Points
15597 Points (2%)
3DMark - 3DMark Cloud Gate Score
3677 Points (4%)
min: 4399 avg: 4784 median: 4783.5 (5%) max: 5168 Points
min: 7424 avg: 7465 median: 7464.5 (8%) max: 7505 Points
3DMark - 3DMark Cloud Gate Graphics
6636 Points (2%)
min: 5953 avg: 6040 median: 6040 (2%) max: 6127 Points
min: 11340 avg: 11380 median: 11380 (3%) max: 11420 Points
3DMark - 3DMark Fire Strike Standard Score
913 Points (2%)
min: 1075 avg: 1079 median: 1079 (2%) max: 1083 Points
min: 1886 avg: 1919 median: 1919 (3%) max: 1952 Points
3DMark - 3DMark Fire Strike Standard Graphics
1022 Points (1%)
min: 1190 avg: 1198 median: 1197.5 (1%) max: 1205 Points
min: 2031 avg: 2076 median: 2075.5 (2%) max: 2120 Points
3DMark - 3DMark Ice Storm Graphics
28613 Points (3%)
min: 44621 avg: 46244 median: 46243.5 (6%) max: 47866 Points
min: 54088 avg: 54397 median: 54397 (7%) max: 54706 Points
3DMark 11 - 3DM11 Performance Score
1432 Points (2%)
min: 2212 avg: 2305 median: 2305 (3%) max: 2398 Points
min: 2711 avg: 2736 median: 2736 (4%) max: 2761 Points
3DMark 11 - 3DM11 Performance GPU
1413 Points (1%)
min: 2210 avg: 2245 median: 2245 (2%) max: 2280 Points
min: 2548 avg: 2577 median: 2577 (2%) max: 2606 Points
3DMark Vantage + NVIDIA GeForce 910M 3DMark Vantage - 3DM Vant. Perf. total
4325 Points (1%)
3DM Vant. Perf. total + AMD Radeon R7 M440
min: 5470 avg: 5584 median: 5584 (2%) max: 5698 Points
3DM Vant. Perf. GPU no PhysX + NVIDIA GeForce 910M 3DMark Vantage - 3DM Vant. Perf. GPU no PhysX
4151 Points (2%)
3DM Vant. Perf. GPU no PhysX + AMD Radeon R7 M440
min: 4846 avg: 4903 median: 4903 (3%) max: 4960 Points
3DMark 03 - 3DMark 03 - Standard
18884 Points (10%)
3DMark 05 - 3DMark 05 - Standard
16534 Points (18%)
3DMark 06 3DMark 06 - Standard 1280x1024 + NVIDIA GeForce 910M
6741 Points (9%)
3DMark 06 - Standard 1280x1024 + AMD Radeon R7 M440
min: 8650 avg: 8800 median: 8800 (11%) max: 8950 Points
3DMark 06 - Standard 1280x1024 + NVIDIA Maxwell GPU Surface Book
15111 Points (20%)
Unigine Heaven 3.0 - Unigine Heaven 3.0 DX 11
14.4 fps (5%)
Unigine Heaven 3.0 - Unigine Heaven 3.0 OpenGL
13.3 fps (6%)
Unigine Heaven 2.1 - Heaven 2.1 high
18 fps (3%)
Cinebench R10 Cinebench R10 Shading (32bit) + NVIDIA GeForce 910M Cinebench R10 - Cinebench R10 Shading (32bit)
2500 Points (2%)
Cinebench R10 Shading (32bit) + AMD Radeon R7 M440
8207 Points (6%)
Cinebench R10 Shading (32bit) + NVIDIA Maxwell GPU Surface Book
min: 5247 avg: 5704 median: 5703.5 (4%) max: 6160 Points
Cinebench R11.5 Cinebench R11.5 OpenGL 64 Bit + AMD Radeon R7 M440 Cinebench R11.5 - Cinebench R11.5 OpenGL 64 Bit
min: 24.36 avg: 25.4 median: 25.4 (9%) max: 26.42 fps
Cinebench R11.5 OpenGL 64 Bit + NVIDIA Maxwell GPU Surface Book
min: 29.03 avg: 30.3 median: 30.3 (10%) max: 31.49 fps
Cinebench R15 + NVIDIA GeForce 910M Cinebench R15 - Cinebench R15 OpenGL 64 Bit
24 fps (1%)
Cinebench R15 OpenGL 64 Bit + AMD Radeon R7 M440
min: 31.54 avg: 33 median: 33 (2%) max: 34.47 fps
Cinebench R15 OpenGL 64 Bit + NVIDIA Maxwell GPU Surface Book
min: 32.35 avg: 35 median: 35 (2%) max: 37.6 fps
Cinebench R15 OpenGL Ref. Match 64 Bit + NVIDIA GeForce 910M Cinebench R15 - Cinebench R15 OpenGL Ref. Match 64 Bit
99.6 % (100%)
Cinebench R15 OpenGL Ref. Match 64 Bit + AMD Radeon R7 M440
98 % (98%)
Cinebench R15 OpenGL Ref. Match 64 Bit + NVIDIA Maxwell GPU Surface Book
99.6 % (100%)
GFXBench - GFXBench Car Chase Offscreen
22.3 fps (3%)
GFXBench 3.1 - GFXBench Manhattan ES 3.1 Offscreen
30.9 fps (1%)
GFXBench 3.0 - GFXBench 3.0 Manhattan Offscreen
42.6 fps (2%)
27.1 fps (2%)
GFXBench (DX / GLBenchmark) 2.7 + NVIDIA GeForce 910M GFXBench (DX / GLBenchmark) 2.7 - GFXBench T-Rex HD Offscreen C24Z16
78.7 fps (1%)
GFXBench T-Rex HD Offscreen C24Z16 + AMD Radeon R7 M440
112.1 fps (1%)
LuxMark v2.0 64Bit - LuxMark v2.0 Room GPU
95 Samples/s (0%)
168 Samples/s (1%)
513 Samples/s (2%)
LuxMark v2.0 64Bit - LuxMark v2.0 Sala GPU
189 Samples/s (0%)
289 Samples/s (1%)
1065 Samples/s (2%)
ComputeMark v2.1 - ComputeMark v2.1 Result
929 Points (1%)
1516 Points (2%)
1676 Points (2%)
Power Consumption - The Witcher 3 Power Consumption - external Monitor *
47.8 Watt (7%)
Average Benchmarks NVIDIA GeForce 910M → 100% n=16 Average Benchmarks AMD Radeon R7 M440 → 156% n=16 Average Benchmarks NVIDIA Maxwell GPU Surface Book → 230% n=16
- Range of benchmark values for this graphics card
- Average benchmark values for this graphics card
* Smaller numbers mean a higher performance
1 This benchmark is not used for the average calculation
Game Benchmarks The following benchmarks stem from our benchmarks of review laptops. The performance depends on the used graphics memory, clock rate, processor, system settings, drivers, and operating systems. So the results don't have to be representative for all laptops with this GPU. For detailed information on the benchmark results, click on the fps number.
Radeon R7 M440:
15.8 [X] Acer Aspire E15 E5-553G-15FM AMD A12-9700P 2.5GHz
Radeon R7 M440
min:
14 fps, max:
17 fps
fps
Radeon R7 M440:
22.3 [X] Acer Aspire E15 E5-553G-15FM AMD A12-9700P 2.5GHz
Radeon R7 M440
min:
12 fps, max:
28 fps
fps
Radeon R7 M440:
48.4 [X] Acer Aspire E15 E5-553G-15FM AMD A12-9700P 2.5GHz
Radeon R7 M440
min:
42 fps
fps
Radeon R7 M440:
42.9 [X] Acer Aspire E15 E5-553G-15FM AMD A12-9700P 2.5GHz
Radeon R7 M440
min:
37 fps
fps
Radeon R7 M440:
45.2 [X] Acer Aspire E15 E5-553G-15FM AMD A12-9700P 2.5GHz
Radeon R7 M440
min:
39 fps
fps
Radeon R7 M440:
33.8 [X] Acer Aspire E15 E5-553G-15FM AMD A12-9700P 2.5GHz
Radeon R7 M440
min:
29 fps
fps
Radeon R7 M440:
11.5 [X] Acer Aspire E15 E5-553G-15FM AMD A12-9700P 2.5GHz
Radeon R7 M440
min:
10 fps
fps
Radeon R7 M440:
40.5 40.7 [X] Acer Aspire E15 E5-553G-15FM AMD A12-9700P 2.5GHz
Radeon R7 M440
min:
37 fps, max:
46 fps
~ 41 fps
100%
GeForce 910M:
22.6 fps
100%
GeForce 910M:
13.8 fps
100%
GeForce 910M:
6.5 fps
100%
GeForce 910M:
3.9 fps
100%
GeForce 910M:
19.6 fps
118%
Radeon R7 M440:
23.1 fps
100%
GeForce 910M:
11.5 fps
136%
Radeon R7 M440:
15.6 fps
100%
GeForce 910M:
5.6 fps
111%
Radeon R7 M440:
6.2 fps
100%
GeForce 910M:
3.1 fps
129%
Radeon R7 M440:
20.6 fps
124%
Radeon R7 M440:
9.9 fps
127%
Radeon R7 M440:
8.9 fps
100%
GeForce 910M:
13.5 fps
100%
GeForce 910M:
7.1 fps
113%
Radeon R7 M440:
7.9 7.9 ~ 8 fps
100%
GeForce 910M:
4.9 fps
102%
Radeon R7 M440:
5.2 5.2 ~ 5 fps
100%
GeForce 910M:
2.1 fps
238%
Radeon R7 M440:
4.9 4.9 ~ 5 fps
100%
GeForce 910M:
14.5 fps
152%
Radeon R7 M440:
22 22.5 [X] HP Pavilion 15-aw004ng AMD A10-9600P 2.4GHz
Radeon R7 M440
~ 22 fps
100%
GeForce 910M:
9.4 fps
128%
Radeon R7 M440:
11.9 12.7 [X] HP Pavilion 15-aw004ng AMD A10-9600P 2.4GHz
Radeon R7 M440
~ 12 fps
100%
GeForce 910M:
6.1 fps
98%
Radeon R7 M440:
6 6.4 [X] HP Pavilion 15-aw004ng AMD A10-9600P 2.4GHz
Radeon R7 M440
~ 6 fps
100%
GeForce 910M:
3.5 fps
100%
Radeon R7 M440:
3.5 fps
100%
GeForce 910M:
38.8 fps
139%
Radeon R7 M440:
54 fps
100%
GeForce 910M:
25.3 fps
170%
Radeon R7 M440:
42.9 fps
100%
GeForce 910M:
12.6 fps
213%
Radeon R7 M440:
26.9 fps
100%
GeForce 910M:
10.7 fps
190%
Radeon R7 M440:
20.3 fps
100%
GeForce 910M:
16.6 fps
135%
Radeon R7 M440:
22.4 [X] HP Pavilion 15-aw004ng AMD A10-9600P 2.4GHz
Radeon R7 M440
fps
100%
GeForce 910M:
14.8 fps
122%
Radeon R7 M440:
18 [X] HP Pavilion 15-aw004ng AMD A10-9600P 2.4GHz
Radeon R7 M440
fps
100%
GeForce 910M:
8.1 fps
149%
Radeon R7 M440:
12.1 [X] HP Pavilion 15-aw004ng AMD A10-9600P 2.4GHz
Radeon R7 M440
fps
100%
GeForce 910M:
5.7 fps
100%
GeForce 910M:
23.2 fps
110%
Radeon R7 M440:
25.6 [X] HP Pavilion 15-aw004ng AMD A10-9600P 2.4GHz
Radeon R7 M440
fps
100%
GeForce 910M:
16.2 fps
115%
Radeon R7 M440:
18.6 [X] HP Pavilion 15-aw004ng AMD A10-9600P 2.4GHz
Radeon R7 M440
fps
100%
GeForce 910M:
7.7 fps
118%
Radeon R7 M440:
9.1 [X] HP Pavilion 15-aw004ng AMD A10-9600P 2.4GHz
Radeon R7 M440
fps
100%
GeForce 910M:
4.3 fps
Radeon R7 M440:
25.6 [X] HP Pavilion 15-aw004ng AMD A10-9600P 2.4GHz
Radeon R7 M440
fps
Radeon R7 M440:
15.8 [X] HP Pavilion 15-aw004ng AMD A10-9600P 2.4GHz
Radeon R7 M440
fps
Radeon R7 M440:
8.3 [X] HP Pavilion 15-aw004ng AMD A10-9600P 2.4GHz
Radeon R7 M440
fps
100%
GeForce 910M:
22.1 fps
160%
Radeon R7 M440:
35.3 fps
100%
GeForce 910M:
13.7 fps
125%
Radeon R7 M440:
17.1 fps
100%
GeForce 910M:
6.3 fps
111%
Radeon R7 M440:
7 fps
100%
GeForce 910M:
3.1 fps
100%
GeForce 910M:
33.8 fps
156%
Radeon R7 M440:
52.6 [X] HP Pavilion 15-aw004ng AMD A10-9600P 2.4GHz
Radeon R7 M440
fps
100%
GeForce 910M:
27.2 fps
161%
Radeon R7 M440:
43.8 [X] HP Pavilion 15-aw004ng AMD A10-9600P 2.4GHz
Radeon R7 M440
fps
114%
Radeon R7 M440:
22.7 [X] HP Pavilion 15-aw004ng AMD A10-9600P 2.4GHz
Radeon R7 M440
fps
100%
GeForce 910M:
13.9 fps
109%
Radeon R7 M440:
15.2 [X] HP Pavilion 15-aw004ng AMD A10-9600P 2.4GHz
Radeon R7 M440
fps
100%
GeForce 910M:
40.9 fps
103%
Maxwell GPU (940M, GDDR5):
42 fps
100%
GeForce 910M:
29.3 fps
123%
Maxwell GPU (940M, GDDR5):
35.9 fps
100%
GeForce 910M:
13.2 fps
149%
Maxwell GPU (940M, GDDR5):
19.7 fps
100%
GeForce 910M:
8.7 fps
153%
Maxwell GPU (940M, GDDR5):
13.3 fps
Radeon R7 M440:
25.7 [X] HP Pavilion 15-aw004ng AMD A10-9600P 2.4GHz
Radeon R7 M440
fps
Radeon R7 M440:
12 [X] HP Pavilion 15-aw004ng AMD A10-9600P 2.4GHz
Radeon R7 M440
fps
Radeon R7 M440:
10 [X] HP Pavilion 15-aw004ng AMD A10-9600P 2.4GHz
Radeon R7 M440
fps
Radeon R7 M440:
49.5 [X] Acer Aspire E15 E5-553G-15FM AMD A12-9700P 2.5GHz
Radeon R7 M440
min:
38 fps
fps
Radeon R7 M440:
22.5 [X] Acer Aspire E15 E5-553G-15FM AMD A12-9700P 2.5GHz
Radeon R7 M440
min:
20 fps
fps
Radeon R7 M440:
21 [X] Acer Aspire E15 E5-553G-15FM AMD A12-9700P 2.5GHz
Radeon R7 M440
min:
18 fps
fps
177%
Maxwell GPU (940M, GDDR5):
23 fps
117%
Maxwell GPU (940M, GDDR5):
14 fps
Radeon R7 M440:
21.1 21.5 [X] HP Pavilion 15-aw004ng AMD A10-9600P 2.4GHz
Radeon R7 M440
~ 21 fps
Radeon R7 M440:
13.4 13.9 [X] HP Pavilion 15-aw004ng AMD A10-9600P 2.4GHz
Radeon R7 M440
~ 14 fps
Radeon R7 M440:
6.9 7.3 [X] HP Pavilion 15-aw004ng AMD A10-9600P 2.4GHz
Radeon R7 M440
~ 7 fps
100%
GeForce 910M:
46.8 fps
200%
Radeon R7 M440:
93.4 [X] HP Pavilion 15-aw004ng AMD A10-9600P 2.4GHz
Radeon R7 M440
fps
152%
Radeon R7 M440:
36.4 [X] HP Pavilion 15-aw004ng AMD A10-9600P 2.4GHz
Radeon R7 M440
fps
100%
GeForce 910M:
16.8 fps
113%
Radeon R7 M440:
18.9 [X] HP Pavilion 15-aw004ng AMD A10-9600P 2.4GHz
Radeon R7 M440
fps
100%
GeForce 910M:
12.5 fps
100%
Radeon R7 M440:
12.5 [X] HP Pavilion 15-aw004ng AMD A10-9600P 2.4GHz
Radeon R7 M440
fps
100%
GeForce 910M:
7.9 fps
100%
GeForce 910M:
7.6 fps
100%
GeForce 910M:
6.1 fps
100%
GeForce 910M:
5.9 fps
100%
GeForce 910M:
28.2 fps
100%
GeForce 910M:
20.1 fps
100%
GeForce 910M:
7.2 fps
100%
GeForce 910M:
4.4 fps
285%
Maxwell GPU (940M, GDDR5):
117 fps
294%
Maxwell GPU (940M, GDDR5):
94 fps
317%
Maxwell GPU (940M, GDDR5):
76 fps
306%
Maxwell GPU (940M, GDDR5):
49 fps
Radeon R7 M440:
81.9 [X] HP Pavilion 15-aw004ng AMD A10-9600P 2.4GHz
Radeon R7 M440
fps
Radeon R7 M440:
40.4 [X] HP Pavilion 15-aw004ng AMD A10-9600P 2.4GHz
Radeon R7 M440
fps
Radeon R7 M440:
19.9 [X] HP Pavilion 15-aw004ng AMD A10-9600P 2.4GHz
Radeon R7 M440
fps
Radeon R7 M440:
16.2 [X] HP Pavilion 15-aw004ng AMD A10-9600P 2.4GHz
Radeon R7 M440
fps
Maxwell GPU (940M, GDDR5):
45.6 fps
Maxwell GPU (940M, GDDR5):
28.2 fps
Maxwell GPU (940M, GDDR5):
22.3 fps
Maxwell GPU (940M, GDDR5):
9.4 fps
100%
GeForce 910M:
33.7 fps
151%
Radeon R7 M440:
51.2 51.6 [X] HP Pavilion 15-aw004ng AMD A10-9600P 2.4GHz
Radeon R7 M440
~ 51 fps
100%
GeForce 910M:
24.6 fps
150%
Radeon R7 M440:
36.9 37.5 [X] HP Pavilion 15-aw004ng AMD A10-9600P 2.4GHz
Radeon R7 M440
~ 37 fps
100%
GeForce 910M:
18.6 fps
129%
Radeon R7 M440:
23.3 23.7 [X] HP Pavilion 15-aw004ng AMD A10-9600P 2.4GHz
Radeon R7 M440
~ 24 fps
100%
GeForce 910M:
7.3 fps
110%
Radeon R7 M440:
7.6 8.1 [X] HP Pavilion 15-aw004ng AMD A10-9600P 2.4GHz
Radeon R7 M440
~ 8 fps
Radeon R7 M440:
32.7 [X] HP Pavilion 15-aw004ng AMD A10-9600P 2.4GHz
Radeon R7 M440
fps
Maxwell GPU (940M, GDDR5):
59.6 fps
Radeon R7 M440:
25.6 [X] HP Pavilion 15-aw004ng AMD A10-9600P 2.4GHz
Radeon R7 M440
fps
Maxwell GPU (940M, GDDR5):
44.7 fps
Radeon R7 M440:
14.1 [X] HP Pavilion 15-aw004ng AMD A10-9600P 2.4GHz
Radeon R7 M440
fps
Maxwell GPU (940M, GDDR5):
30.7 fps
Radeon R7 M440:
6.1 [X] HP Pavilion 15-aw004ng AMD A10-9600P 2.4GHz
Radeon R7 M440
fps
Maxwell GPU (940M, GDDR5):
15.7 fps
100%
GeForce 910M:
50.4 fps
147%
Radeon R7 M440:
73.6 74.7 [X] HP Pavilion 15-aw004ng AMD A10-9600P 2.4GHz
Radeon R7 M440
~ 74 fps
187%
Maxwell GPU (940M, GDDR5):
94.2 fps
100%
GeForce 910M:
29.9 fps
140%
Radeon R7 M440:
42 42.8 [X] HP Pavilion 15-aw004ng AMD A10-9600P 2.4GHz
Radeon R7 M440
~ 42 fps
217%
Maxwell GPU (940M, GDDR5):
64.8 fps
100%
GeForce 910M:
25.8 fps
128%
Radeon R7 M440:
32.6 33.7 [X] HP Pavilion 15-aw004ng AMD A10-9600P 2.4GHz
Radeon R7 M440
~ 33 fps
219%
Maxwell GPU (940M, GDDR5):
56.5 fps
100%
GeForce 910M:
8.6 fps
128%
Radeon R7 M440:
9.6 11.4 [X] HP Pavilion 15-aw004ng AMD A10-9600P 2.4GHz
Radeon R7 M440
~ 11 fps
242%
Maxwell GPU (940M, GDDR5):
20.8 fps
Maxwell GPU (940M, GDDR5):
258 fps
Maxwell GPU (940M, GDDR5):
141.2 fps
Maxwell GPU (940M, GDDR5):
74.2 fps
Maxwell GPU (940M, GDDR5):
37.5 fps
100%
GeForce 910M:
73.6 fps
219%
Maxwell GPU (940M, GDDR5):
161.5 fps
100%
GeForce 910M:
38.3 fps
216%
Maxwell GPU (940M, GDDR5):
82.8 fps
100%
GeForce 910M:
24.9 fps
222%
Maxwell GPU (940M, GDDR5):
55.2 fps
100%
GeForce 910M:
10.7 fps
241%
Maxwell GPU (940M, GDDR5):
25.8 fps
Radeon R7 M440:
29 [X] HP Pavilion 15-aw004ng AMD A10-9600P 2.4GHz
Radeon R7 M440
fps
Radeon R7 M440:
18 [X] HP Pavilion 15-aw004ng AMD A10-9600P 2.4GHz
Radeon R7 M440
fps
Radeon R7 M440:
12.8 [X] HP Pavilion 15-aw004ng AMD A10-9600P 2.4GHz
Radeon R7 M440
fps
Radeon R7 M440:
4.8 [X] HP Pavilion 15-aw004ng AMD A10-9600P 2.4GHz
Radeon R7 M440
fps
100%
GeForce 910M:
39.1 fps
100%
GeForce 910M:
36.3 fps
100%
GeForce 910M:
34.2 fps
100%
GeForce 910M:
29.7 fps
Maxwell GPU (940M, GDDR5):
112.4 fps
Maxwell GPU (940M, GDDR5):
85.6 fps
Maxwell GPU (940M, GDDR5):
42.8 fps
Maxwell GPU (940M, GDDR5):
10.9 fps
100%
GeForce 910M:
52.8 fps
111%
Radeon R7 M440:
58.7 [X] HP Pavilion 15-aw004ng AMD A10-9600P 2.4GHz
Radeon R7 M440
fps
100%
GeForce 910M:
48.6 fps
107%
Radeon R7 M440:
52 [X] HP Pavilion 15-aw004ng AMD A10-9600P 2.4GHz
Radeon R7 M440
fps
100%
GeForce 910M:
45.5 fps
100%
Radeon R7 M440:
45.7 [X] HP Pavilion 15-aw004ng AMD A10-9600P 2.4GHz
Radeon R7 M440
fps
100%
GeForce 910M:
30.6 fps
91%
Radeon R7 M440:
27.8 [X] HP Pavilion 15-aw004ng AMD A10-9600P 2.4GHz
Radeon R7 M440
fps
Average Gaming NVIDIA GeForce 910M → 100% Average Gaming 30-70 fps → 100%
Average Gaming AMD Radeon R7 M440 → 134% Average Gaming 30-70 fps → 140%
Average Gaming NVIDIA Maxwell GPU Surface Book → 210% Average Gaming 30-70 fps → 198%
NVIDIA GeForce 910M low med. high ultra QHD 4K Mirror's Edge Catalyst 22.6 13.8 6.5 3.9 The Division 19.6 11.5 5.6 3.1 Far Cry Primal 16 8 7 5 XCOM 2 13.5 7.1 4.9 2.1 Rise of the Tomb Raider 14.5 9.4 6.1 3.5 Rainbow Six Siege 38.8 25.3 12.6 10.7 Just Cause 3 16.6 14.8 8.1 5.7 Star Wars Battlefront 23.2 16.2 7.7 4.3 Anno 2205 22.1 13.7 6.3 3.1 World of Warships 33.8 27.2 20 13.9 Metal Gear Solid V 40.9 29.3 13.2 8.7 Batman: Arkham Knight 13 12 7 4 Dirt Rally 46.8 24 16.8 12.5 Battlefield Hardline 7.9 7.6 6.1 5.9 Dragon Age: Inquisition 28.2 20.1 7.2 4.4 F1 2014 41 32 24 16 Battlefield 4 33.7 24.6 18.6 7.3 BioShock Infinite 50.4 29.9 25.8 8.6 Tomb Raider 73.6 38.3 24.9 10.7 Counter-Strike: GO 39.1 36.3 34.2 29.7 Diablo III 52.8 48.6 45.5 30.6 < 30 fps < 60 fps < 120 fps ≥ 120 fps 11 9 1 17 4 19 2 20 1
NVIDIA Maxwell GPU Surface Book low med. high ultra QHD 4K Metal Gear Solid V 42 35.9 19.7 13.3 Batman: Arkham Knight 23 14 F1 2014 117 94 76 49 Thief 45.6 28.2 22.3 9.4 Metro: Last Light 59.6 44.7 30.7 15.7 BioShock Infinite 94.2 64.8 56.5 20.8 StarCraft II: Heart of the Swarm 258 141.2 74.2 37.5 Tomb Raider 161.5 82.8 55.2 25.8 Sleeping Dogs 112.4 85.6 42.8 10.9 < 30 fps < 60 fps < 120 fps ≥ 120 fps 1 3 3 2 2 2 4 1 2 4 2 6 2
For more games that might be playable and a list of all games and graphics cards visit our Gaming List
v1.26
log 25. 21:48:12
#0 checking url part for id 7366 +0s ... 0s
#1 checking url part for id 7339 +0s ... 0s
#2 checking url part for id 6927 +0s ... 0s
#3 not redirecting to Ajax server +0s ... 0s
#4 did not recreate cache, as it is less than 5 days old! Created at Thu, 25 Apr 2024 05:40:10 +0200 +0.001s ... 0.001s
#5 composed specs +0.129s ... 0.13s
#6 did output specs +0s ... 0.13s
#7 start showIntegratedCPUs +0s ... 0.13s
#8 getting avg benchmarks for device 7366 +0.048s ... 0.178s
#9 got single benchmarks 7366 +0.006s ... 0.184s
#10 getting avg benchmarks for device 7339 +0.015s ... 0.199s
#11 got single benchmarks 7339 +0.016s ... 0.215s
#12 getting avg benchmarks for device 6927 +0.016s ... 0.231s
#13 got single benchmarks 6927 +0.007s ... 0.238s
#14 got avg benchmarks for devices +0s ... 0.238s
#15 min, max, avg, median took s +0.279s ... 0.517s
#16 before gaming benchmark output +0s ... 0.517s
#17 Got 256 rows for game benchmarks. +0.014s ... 0.532s
#18 composed SQL query for gamebenchmarks +0s ... 0.532s
#19 got data and put it in $dataArray +0.036s ... 0.568s
#20 benchmarks composed for output. +0.115s ... 0.683s
#21 calculated avg scores. +0s ... 0.683s
#22 return log +0.003s ... 0.685s
Please share our article, every link counts!
Redaktion, 2017-09- 8 (Update: 2023-07- 1)
 Deutsch
 English
 Español
 Français
 Italiano
 Nederlands
 Polski
 Português
 Русский
 Türkçe
 Svenska
 Chinese
 Magyar