AMD FirePro W5170M vs AMD FirePro W4190M vs AMD FirePro W5130M
AMD FirePro W5170M ► remove from comparison
The AMD FirePro W5170M is a high-end graphics card for mobile workstations . It is based on the same chip as the AMD Radeon R9 M370X, but it is higher clocked.
The FirePro series offers certified drivers that are optimized for stability and performance in professional applications like CAD or DCC. OpenGL performance, for example, should be significantly better compared to GeForce graphics cards of similar specifications.
AMD FirePro W4190M ► remove from comparison
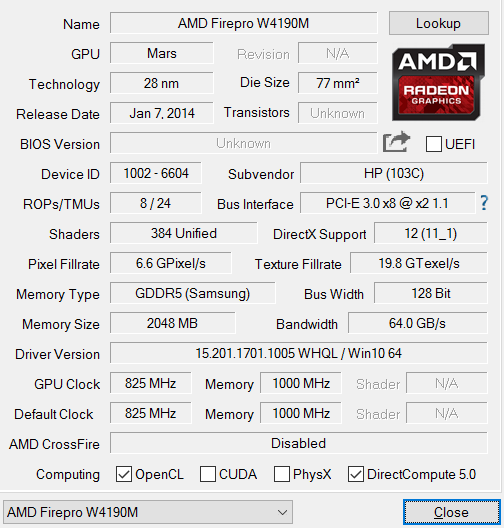
The AMD FirePro W4190M is a professional workstation graphics card for laptops . It is based on the same Mars chip as the AMD Radeon HD 8790M and AMD FirePro W4170M and similarly clocked. Therefore, the GPU takes position in the lower mid-range of mobile laptop graphics cards as of 2015. Thanks to its optimized drivers, the W4190M offers a very good performance in professional 3D applications like CAD, while the gaming performance is similar to a Nvidia GeForce 840M / Radeon HD 8790M .
The AMD FirePro M4100 series is based on the GCN architecture and therefore supports DirectX 12. The 384 shader cores can also be used with OpenCL as 6 compute units.
AMD FirePro W5130M ► remove from comparison
The AMD FirePro W5130M is a mid-range graphics card for mobile workstations. It offers 512 shader cores and a 128-bit GDDR5 graphics memory system. Therefore, currently there is no direct consumer counterpart. The Radeon R9 M265X for example offers 640 shaders at a lower clock speed.
The FirePro series offers certified drivers that are optimized for stability and performance in professional applications like CAD or DCC. OpenGL performance, for example, should be significantly better compared to GeForce graphics cards of similar specifications.
AMD FirePro W5170M AMD FirePro W4190M AMD FirePro W5130M FirePro W Series Architecture GCN GCN GCN Pipelines 640 - unified 384 - unified 512 - unified Core Speed 925 (Boost) MHz 825 - 900 (Boost) MHz 925 (Boost) MHz Memory Speed 4500 MHz 4000 MHz 4000 MHz Memory Bus Width 128 Bit 128 Bit 128 Bit Memory Type GDDR5 GDDR5 GDDR5 Max. Amount of Memory 2048 MB 2048 MB 2048 MB Shared Memory no no no API DirectX 12 (FL 12_0), Shader 5.0, OpenGL 4.3 / Vulkan DirectX 11.2, Shader 5.0 DirectX 12 (FL 12_0), Shader 5.0, OpenGL 4.3 / Vulkan technology 28 nm 28 nm 28 nm Features DirectX 12, OpenCL 1.2, OpenGL 4.3, Vulkan, Mantle, Eyefinity, Enduro, App Acceleration, HD3D App Acceleration, PowerPlay, PowerTune, ZeroCore, Enduro, PCI Express 3.0 x16 DirectX 12, OpenCL 1.2, OpenGL 4.3, Vulkan, Mantle, Eyefinity, Enduro, App Acceleration, HD3D Notebook Size large medium sized medium sized Date of Announcement 02.10.2015 12.11.2015 02.10.2015 Link to Manufacturer Page www.amd.com www.amd.com Codename Mars XTX? Transistors 900 Million
Benchmarks Performance Rating - 3DMark 11 + Fire Strike + Time Spy - FirePro W5170M
1.3 pt (4%)
...
...
max:
Performance Rating - 3DMark 11 + Fire Strike + Time Spy - FirePro W4190M
0.8 pt (2%)
...
...
max:
Performance Rating - 3DMark 11 + Fire Strike + Time Spy - FirePro W5130M
1 pt (3%)
...
...
max:
3DMark - 3DMark Ice Storm Extreme Graphics
112381 Points (14%)
64248 Points (8%)
3DMark - 3DMark Cloud Gate Score
14139 Points (15%)
min: 6567 avg: 7603 median: 7894 (8%) max: 8348 Points
min: 9931 avg: 10836 median: 10835.5 (12%) max: 11740 Points
3DMark - 3DMark Cloud Gate Graphics
19095 Points (5%)
min: 8513 avg: 11144 median: 12317 (3%) max: 12601 Points
min: 14260 avg: 14381 median: 14380.5 (4%) max: 14501 Points
3DMark - 3DMark Fire Strike Standard Score
2736 Points (5%)
min: 1517 avg: 1630 median: 1663 (3%) max: 1711 Points
min: 1993 avg: 1997 median: 1997 (4%) max: 2001 Points
3DMark - 3DMark Fire Strike Standard Graphics
2909 Points (3%)
min: 1588 avg: 1713 median: 1745 (2%) max: 1806 Points
min: 2099 avg: 2110 median: 2110 (2%) max: 2121 Points
3DMark - 3DMark Ice Storm Graphics
144473 Points (17%)
min: 35930 avg: 39704 median: 39703.5 (5%) max: 43477 Points
81500 Points (10%)
3DMark 11 - 3DM11 Performance Score
4564 Points (6%)
min: 2173 avg: 2451 median: 2570 (4%) max: 2611 Points
3383 Points (5%)
3DMark 11 - 3DM11 Performance GPU
4197 Points (4%)
min: 1932 avg: 2221 median: 2351 (2%) max: 2379 Points
3106 Points (3%)
3DMark 06 3DMark 06 - Standard 1280x1024 + AMD FirePro W4190M
12929 Points (17%)
3DMark 06 - Standard 1280x1024 + AMD FirePro W5130M
15680 Points (21%)
Unigine Valley 1.0 - Unigine Valley 1.0 DX
min: 6.2 avg: 7.3 median: 7.3 (2%) max: 8.3 fps
Unigine Heaven 2.1 - Heaven 2.1 high
36 fps (7%)
SPECviewperf 11 + AMD FirePro W5170M SPECviewperf 11 - specvp11 snx-01
36.5 fps (22%)
specvp11 snx-01 + AMD FirePro W4190M
28.7 fps (17%)
specvp11 snx-01 + AMD FirePro W5130M
min: 11.77 avg: 20.9 median: 20.9 (12%) max: 30 fps
specvp11 tcvis-02 + AMD FirePro W5170M SPECviewperf 11 - specvp11 tcvis-02
27 fps (15%)
specvp11 tcvis-02 + AMD FirePro W4190M
23.4 fps (13%)
specvp11 tcvis-02 + AMD FirePro W5130M
min: 6.75 avg: 7.4 median: 7.4 (4%) max: 8 fps
specvp11 sw-02 + AMD FirePro W5170M SPECviewperf 11 - specvp11 sw-02
59.3 fps (45%)
specvp11 sw-02 + AMD FirePro W4190M
51.2 fps (39%)
specvp11 sw-02 + AMD FirePro W5130M
min: 26.6 avg: 28.3 median: 28.3 (22%) max: 30 fps
specvp11 proe-05 + AMD FirePro W5170M SPECviewperf 11 - specvp11 proe-05
8.3 fps (10%)
specvp11 proe-05 + AMD FirePro W4190M
8.7 fps (10%)
specvp11 proe-05 + AMD FirePro W5130M
min: 3.91 avg: 4.1 median: 4.1 (5%) max: 4.3 fps
specvp11 maya-03 + AMD FirePro W5170M SPECviewperf 11 - specvp11 maya-03
78.5 fps (59%)
specvp11 maya-03 + AMD FirePro W4190M
65.5 fps (49%)
specvp11 maya-03 + AMD FirePro W5130M
min: 15.05 avg: 18 median: 18 (14%) max: 21 fps
specvp11 lightwave-01 + AMD FirePro W5170M SPECviewperf 11 - specvp11 lightwave-01
75.7 fps (81%)
specvp11 lightwave-01 + AMD FirePro W4190M
67.5 fps (72%)
specvp11 lightwave-01 + AMD FirePro W5130M
min: 30.95 avg: 33.5 median: 33.5 (36%) max: 36 fps
specvp11 ensight-04 + AMD FirePro W5170M SPECviewperf 11 - specvp11 ensight-04
26.3 fps (13%)
specvp11 ensight-04 + AMD FirePro W4190M
21.1 fps (10%)
specvp11 ensight-04 + AMD FirePro W5130M
min: 24 avg: 24.7 median: 24.7 (12%) max: 25.37 fps
specvp11 catia-03 + AMD FirePro W5170M SPECviewperf 11 - specvp11 catia-03
35.4 fps (19%)
specvp11 catia-03 + AMD FirePro W4190M
29.6 fps (16%)
specvp11 catia-03 + AMD FirePro W5130M
min: 9.46 avg: 11.2 median: 11.2 (6%) max: 13 fps
SPECviewperf 12 + AMD FirePro W4190M SPECviewperf 12 - specvp12 sw-03
min: 30.12 avg: 30.8 median: 30.8 (8%) max: 31.41 fps
specvp12 sw-03 + AMD FirePro W5130M
32 fps (8%)
specvp12 snx-02 + AMD FirePro W4190M SPECviewperf 12 - specvp12 snx-02
min: 19.89 avg: 19.9 median: 19.9 (3%) max: 19.91 fps
specvp12 snx-02 + AMD FirePro W5130M
26 fps (4%)
specvp12 showcase-01 + AMD FirePro W4190M SPECviewperf 12 - specvp12 showcase-01
min: 4.98 avg: 7.6 median: 7.6 (2%) max: 10.21 fps
specvp12 showcase-01 + AMD FirePro W5130M
14 fps (3%)
specvp12 mediacal-01 + AMD FirePro W4190M SPECviewperf 12 - specvp12 mediacal-01
min: 4.51 avg: 5.3 median: 5.3 (1%) max: 6.09 fps
specvp12 mediacal-01 + AMD FirePro W5130M
5.9 fps (2%)
specvp12 maya-04 + AMD FirePro W4190M SPECviewperf 12 - specvp12 maya-04
min: 16.38 avg: 16.5 median: 16.5 (5%) max: 16.66 fps
specvp12 maya-04 + AMD FirePro W5130M
22 fps (6%)
specvp12 energy-01 + AMD FirePro W4190M SPECviewperf 12 - specvp12 energy-01
min: 0.34 avg: 0.4 median: 0.4 (0%) max: 0.41 fps
specvp12 energy-01 + AMD FirePro W5130M 0.4 fps (0%)
specvp12 creo-01 + AMD FirePro W4190M SPECviewperf 12 - specvp12 creo-01
16.9 fps (7%)
specvp12 creo-01 + AMD FirePro W5130M
20 fps (8%)
specvp12 catia-04 + AMD FirePro W4190M SPECviewperf 12 - specvp12 catia-04
min: 18.13 avg: 18.4 median: 18.4 (3%) max: 18.62 fps
specvp12 catia-04 + AMD FirePro W5130M
23 fps (4%)
specvp12 3dsmax-05 + AMD FirePro W4190M SPECviewperf 12 - specvp12 3dsmax-05
11.4 fps (2%)
Cinebench R10 Cinebench R10 Shading (32bit) + AMD FirePro W4190M Cinebench R10 - Cinebench R10 Shading (32bit)
9490 Points (7%)
Cinebench R10 Shading (32bit) + AMD FirePro W5130M
9635 Points (7%)
Cinebench R11.5 Cinebench R11.5 OpenGL 64 Bit + AMD FirePro W4190M Cinebench R11.5 - Cinebench R11.5 OpenGL 64 Bit
49.6 fps (17%)
Cinebench R11.5 OpenGL 64 Bit + AMD FirePro W5130M
62.3 fps (22%)
Cinebench R15 + AMD FirePro W5170M Cinebench R15 - Cinebench R15 OpenGL 64 Bit
82.3 fps (5%)
Cinebench R15 OpenGL 64 Bit + AMD FirePro W4190M
min: 48.12 avg: 48.6 median: 48.7 (3%) max: 48.99 fps
Cinebench R15 OpenGL 64 Bit + AMD FirePro W5130M
min: 61.8 avg: 62.4 median: 62.4 (4%) max: 63 fps
Cinebench R15 OpenGL Ref. Match 64 Bit + AMD FirePro W5170M Cinebench R15 - Cinebench R15 OpenGL Ref. Match 64 Bit
98 % (98%)
Cinebench R15 OpenGL Ref. Match 64 Bit + AMD FirePro W4190M
98 % (98%)
Cinebench R15 OpenGL Ref. Match 64 Bit + AMD FirePro W5130M
98 % (98%)
LuxMark v2.0 64Bit - LuxMark v2.0 Room GPU
min: 415 avg: 423 median: 423 (2%) max: 431 Samples/s
358 Samples/s (2%)
LuxMark v2.0 64Bit - LuxMark v2.0 Sala GPU
min: 924 avg: 981 median: 984 (2%) max: 1034 Samples/s
629 Samples/s (1%)
ComputeMark v2.1 - ComputeMark v2.1 Result
902 Points (1%)
896 Points (1%)
Power Consumption - Witcher 3 Power Consumption *
46.7 Watt (10%)
Power Consumption - Witcher 3 ultra Power Efficiency
0.1 fps per Watt (13%)
Emissions Witcher 3 Fan Noise + AMD FirePro W4190M Emissions - Witcher 3 Fan Noise
37.4 dB(A) (60%)
Average Benchmarks AMD FirePro W5170M → 100% n=17 Average Benchmarks AMD FirePro W4190M → 73% n=17 Average Benchmarks AMD FirePro W5130M → 62% n=17
- Range of benchmark values for this graphics card
- Average benchmark values for this graphics card
* Smaller numbers mean a higher performance
1 This benchmark is not used for the average calculation
Game Benchmarks The following benchmarks stem from our benchmarks of review laptops. The performance depends on the used graphics memory, clock rate, processor, system settings, drivers, and operating systems. So the results don't have to be representative for all laptops with this GPU. For detailed information on the benchmark results, click on the fps number.
FirePro W4190M:
33.3 (!) [X] HP ZBook 14u G4 Intel Core i7-7500U 2.7GHz
FirePro W4190M
fps
FirePro W4190M:
10.5 (!) [X] HP ZBook 14u G4 Intel Core i7-7500U 2.7GHz
FirePro W4190M
fps
FirePro W4190M:
7.7 (!) [X] HP ZBook 14u G4 Intel Core i7-7500U 2.7GHz
FirePro W4190M
fps
FirePro W4190M:
14 17.4 ~ 16 fps
FirePro W4190M:
8 9.9 ~ 9 fps
FirePro W5130M:
30 [X] Dell Precision 3510 52452051.2 Intel Core i5-6440HQ 2.6GHz
FirePro W5130M
fps
100%
FirePro W5170M:
45 [X] Dell Precision 15 7510 50751340 Intel Xeon E3-1505M v5 2.8GHz
FirePro W5170M
fps
38%
FirePro W5130M:
17 [X] Dell Precision 3510 52452051.2 Intel Core i5-6440HQ 2.6GHz
FirePro W5130M
fps
100%
FirePro W5170M:
24 [X] Dell Precision 15 7510 50751340 Intel Xeon E3-1505M v5 2.8GHz
FirePro W5170M
fps
100%
FirePro W5170M:
31 [X] Dell Precision 15 7510 50751340 Intel Xeon E3-1505M v5 2.8GHz
FirePro W5170M
fps
68%
FirePro W5130M:
21 fps
100%
FirePro W5170M:
14.8 [X] Dell Precision 15 7510 50751340 Intel Xeon E3-1505M v5 2.8GHz
FirePro W5170M
fps
68%
FirePro W4190M:
9.7 9.7 ~ 10 fps
68%
FirePro W5130M:
10 fps
FirePro W4190M:
5.7 6 ~ 6 fps
100%
FirePro W5170M:
43.8 [X] Dell Precision 15 7510 50751340 Intel Xeon E3-1505M v5 2.8GHz
FirePro W5170M
fps
100%
FirePro W5170M:
37.7 [X] Dell Precision 15 7510 50751340 Intel Xeon E3-1505M v5 2.8GHz
FirePro W5170M
fps
100%
FirePro W5170M:
20 [X] Dell Precision 15 7510 50751340 Intel Xeon E3-1505M v5 2.8GHz
FirePro W5170M
fps
100%
FirePro W5170M:
113.6 [X] Dell Precision 15 7510 50751340 Intel Xeon E3-1505M v5 2.8GHz
FirePro W5170M
fps
69%
FirePro W5130M:
76.1 [X] Dell Precision 3510 52452051.2 Intel Core i5-6440HQ 2.6GHz
FirePro W5130M
80 ~ 78 fps
100%
FirePro W5170M:
99.6 [X] Dell Precision 15 7510 50751340 Intel Xeon E3-1505M v5 2.8GHz
FirePro W5170M
fps
65%
FirePro W5130M:
64.3 [X] Dell Precision 3510 52452051.2 Intel Core i5-6440HQ 2.6GHz
FirePro W5130M
66 ~ 65 fps
100%
FirePro W5170M:
16.4 [X] Dell Precision 15 7510 50751340 Intel Xeon E3-1505M v5 2.8GHz
FirePro W5170M
fps
104%
FirePro W5130M:
10.5 [X] Dell Precision 3510 52452051.2 Intel Core i5-6440HQ 2.6GHz
FirePro W5130M
23 ~ 17 fps
100%
FirePro W5170M:
95.2 [X] Dell Precision 15 7510 50751340 Intel Xeon E3-1505M v5 2.8GHz
FirePro W5170M
fps
68%
FirePro W5130M:
64.8 [X] Dell Precision 3510 52452051.2 Intel Core i5-6440HQ 2.6GHz
FirePro W5130M
66 ~ 65 fps
100%
FirePro W5170M:
80.9 [X] Dell Precision 15 7510 50751340 Intel Xeon E3-1505M v5 2.8GHz
FirePro W5170M
fps
69%
FirePro W5130M:
55.5 [X] Dell Precision 3510 52452051.2 Intel Core i5-6440HQ 2.6GHz
FirePro W5130M
57 ~ 56 fps
100%
FirePro W5170M:
28.7 [X] Dell Precision 15 7510 50751340 Intel Xeon E3-1505M v5 2.8GHz
FirePro W5170M
fps
73%
FirePro W5130M:
20.9 [X] Dell Precision 3510 52452051.2 Intel Core i5-6440HQ 2.6GHz
FirePro W5130M
22 ~ 21 fps
100%
FirePro W5170M:
102.7 [X] Dell Precision 15 7510 50751340 Intel Xeon E3-1505M v5 2.8GHz
FirePro W5170M
fps
75%
FirePro W5130M:
77.5 [X] Dell Precision 3510 52452051.2 Intel Core i5-6440HQ 2.6GHz
FirePro W5130M
fps
100%
FirePro W5170M:
88.4 [X] Dell Precision 15 7510 50751340 Intel Xeon E3-1505M v5 2.8GHz
FirePro W5170M
fps
74%
FirePro W5130M:
65.1 [X] Dell Precision 3510 52452051.2 Intel Core i5-6440HQ 2.6GHz
FirePro W5130M
fps
100%
FirePro W5170M:
55.5 [X] Dell Precision 15 7510 50751340 Intel Xeon E3-1505M v5 2.8GHz
FirePro W5170M
fps
70%
FirePro W5130M:
38.8 [X] Dell Precision 3510 52452051.2 Intel Core i5-6440HQ 2.6GHz
FirePro W5130M
fps
Average Gaming AMD FirePro W5170M → 100% Average Gaming 30-70 fps → 100%
Average Gaming AMD FirePro W4190M → 56% Average Gaming 30-70 fps → 52%
Average Gaming AMD FirePro W5130M → 70% Average Gaming 30-70 fps → 69%
AMD FirePro W4190M low med. high ultra QHD 4K The Evil Within 2 9.3 5.1 4.7 Ark Survival Evolved 19.4 9 6.2 3.6 F1 2017 40 18 14 13 Dirt 4 33.3 10.5 7.7 Rocket League 101.7 39.1 26.5 Resident Evil 7 23.7 10.9 9.4 5.4 Doom 23.5 13.9 8.9 4.9 Rise of the Tomb Raider 25.6 16 9 7.9 Metal Gear Solid V 59.9 42.3 18.9 13 The Witcher 3 29 18 10 6 GTA V 72.7 61 17.3 7.1 Middle-earth: Shadow of Mordor 20 16 11 2 Company of Heroes 2 39.32 30.51 17.17 BioShock Infinite 96 49 42 15 < 30 fps < 60 fps < 120 fps ≥ 120 fps 7 4 3 9 4 1 13 1 10
AMD FirePro W5130M low med. high ultra QHD 4K Batman: Arkham Knight 30 17 The Witcher 3 31 21 10 Dirt Rally 216 71 47 19 Middle-earth: Shadow of Mordor 66 41 23 21 Total War: Rome II 106 78 65 17 BioShock Infinite 137 65 56 21 Tomb Raider 158 75 58 25 Mafia 2 77.5 65.1 38.8 < 30 fps < 60 fps < 120 fps ≥ 120 fps 2 2 3 2 1 5 2 3 2 5 1
AMD FirePro W5170M low med. high ultra QHD 4K Batman: Arkham Knight 45 24 The Witcher 3 31 14.8 Thief 43.8 37.7 20 Total War: Rome II 113.6 99.6 16.4 BioShock Infinite 95.2 80.9 28.7 Mafia 2 102.7 88.4 55.5 < 30 fps < 60 fps < 120 fps ≥ 120 fps 3 3 2 1 3 3 1
For more games that might be playable and a list of all games and graphics cards visit our Gaming List
v1.26
log 19. 12:36:11
#0 checking url part for id 6518 +0s ... 0s
#1 checking url part for id 7246 +0s ... 0s
#2 checking url part for id 6519 +0s ... 0s
#3 not redirecting to Ajax server +0s ... 0s
#4 did not recreate cache, as it is less than 5 days old! Created at Fri, 19 Apr 2024 05:40:26 +0200 +0.001s ... 0.001s
#5 composed specs +0.139s ... 0.14s
#6 did output specs +0s ... 0.14s
#7 start showIntegratedCPUs +0s ... 0.14s
#8 getting avg benchmarks for device 6518 +0.082s ... 0.222s
#9 got single benchmarks 6518 +0.007s ... 0.229s
#10 getting avg benchmarks for device 7246 +0.019s ... 0.249s
#11 got single benchmarks 7246 +0.016s ... 0.265s
#12 getting avg benchmarks for device 6519 +0.021s ... 0.286s
#13 got single benchmarks 6519 +0.011s ... 0.297s
#14 got avg benchmarks for devices +0s ... 0.297s
#15 min, max, avg, median took s +0.371s ... 0.668s
#16 before gaming benchmark output +0s ... 0.668s
#17 Got 116 rows for game benchmarks. +0.011s ... 0.679s
#18 composed SQL query for gamebenchmarks +0s ... 0.679s
#19 got data and put it in $dataArray +0.017s ... 0.697s
#20 benchmarks composed for output. +0.05s ... 0.746s
#21 calculated avg scores. +0s ... 0.746s
#22 return log +0.002s ... 0.749s
Please share our article, every link counts!
Redaktion, 2017-09- 8 (Update: 2023-07- 1)
 Deutsch
 English
 Español
 Français
 Italiano
 Nederlands
 Polski
 Português
 Русский
 Türkçe
 Svenska
 Chinese
 Magyar