Samsung Exynos 7904 vs Qualcomm Snapdragon 636
Samsung Exynos 7904 ► remove from comparison
The Samsung Exynos 7904 (also called Exynos 7 Series ) is a upper mid-range system-on-a-chip (SoC) for smartphones and tablets. It was launched early 2019 and features two Cortex-A73 cores clocked at up to 1.8 GHz. Furthermore, there are six power efficient Cortex-A53 cores at up to 1.6 GHz, an ARM Mali-G71 MP2 GPU and a LPDDR4x memory controller. The integrated LTE modem supports LTE Cat.12 3CA 600 Mbps download speeds and Cat.13 2CA 150 Mbps upload. 802.11ac WiFi, Bluetooth 5.0 and FM Radio are also in the chip. Compared to the older and faster Exynos 7885 , the 7904 offers a slower clocked A73 cores (1.8 versus 2.2 GHz).
It is manufactured in 14nm FinFET at Samsung and therefore a rather power efficient SoC.
Qualcomm Snapdragon 636 ► remove from comparison
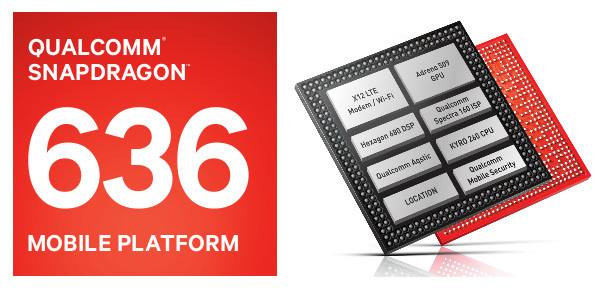
The Qualcomm Snapdragon 636 (SDM636) is a mid-range octa-core SoC with eight custom Kryo 260 cores at up to 1.8 GHz, an Adreno 509 GPU, a LPDDR4-2666 memory controller (1333 MHz) and a X12 LTE (Cat 12/13, 300 Mbps down, 150 Mbps up) modem. Furthermore, the chip supports 802.11ac WiFi and Bluetooth 5.0. It is manufactured in 14nm FinFet. Qualcomm states a 40% faster performance compared to the old Snapdragon 630 (8x ARM Cortex-A53).
Model Samsung Exynos 7904 Qualcomm Snapdragon 636 Series Samsung Exynos Qualcomm Snapdragon Codename Cortex-A73/-A53 Kryo 260 Series: Snapdragon Kryo 260 Clock 1800 MHz 1800 MHz Cores / Threads 8 / 8 8 / 8 Technology 14 nm 14 nm Features ARM Mali-G71 MP2, 2x Cortex-A73 (2.2 GHz) + 6x Cortex-A53 (1.6 GHz, big.LITTLE), 2x 32 Bit LPDDR4 Memory Controller Adreno 509 GPU, X12 LTE Modem, Hexagon 680 DSP, Spectra 160 ISP iGPU ARM Mali-G71 MP2 Qualcomm Adreno 509 Architecture ARM ARM Announced Manufacturer www.qualcomm.com
Benchmarks Performance Rating - Geekbench 5.5, PCM Work, Sling Shot Physics, Antutu v8 CPU - Exynos 7904
0.2 pt (16%)
...
3DMark - 3DMark Ice Storm Extreme Physics
12500 Points (10%)
3DMark - 3DMark Ice Storm Unlimited Physics
min: 12321 avg: 12706 median: 12747 (11%) max: 13009 Points
min: 15766 avg: 17020 median: 16939 (14%) max: 19365 Points
3DMark - 3DMark Sling Shot Extreme (ES 3.1) Unlimited Physics
min: 1657 avg: 1708 median: 1710 (20%) max: 1755 Points
min: 2258 avg: 2372 median: 2345 (28%) max: 2644 Points
3DMark - 3DMark Sling Shot (ES 3.0) Unlimited Physics
min: 1677 avg: 1712 median: 1713 (20%) max: 1745 Points
min: 2288 avg: 2386 median: 2359 (27%) max: 2683 Points
Geekbench 5.5 - Geekbench 5.1 - 5.4 64 Bit Single-Core
239 Points (10%)
Geekbench 5.5 - Geekbench 5.1 - 5.4 64 Bit Multi-Core
596 Points (1%)
Geekbench 5.0 - Geekbench 5.0 64 Bit Single-Core
273 Points (1%)
278 Points (1%)
Geekbench 5.0 - Geekbench 5.0 64 Bit Multi-Core
1010 Points (3%)
1256 Points (4%)
Geekbench 4.4 - Geekbench 4.1 - 4.4 64 Bit Single-Core
min: 1268 avg: 1306 median: 1320 (13%) max: 1329 Points
min: 1323 avg: 1351 median: 1337 (13%) max: 1506 Points
Geekbench 4.4 - Geekbench 4.1 - 4.4 64 Bit Multi-Core
min: 4017 avg: 4073 median: 4096 (5%) max: 4105 Points
min: 4781 avg: 4960 median: 4941 (6%) max: 5426 Points
Geekbench 4.0 - Geekbench 4.0 64 Bit Single-Core
1247 Points (17%)
Geekbench 4.0 - Geekbench 4.0 64 Bit Multi-Core
3702 Points (9%)
Geekbench 3 - Geekbench 3 64 Bit Multi-Core
3799 Points (6%)
Geekbench 3 - Geekbench 3 64 Bit Single-Core
1263 Points (19%)
Geekbench 2 - 32 Bit - Geekbench Stream
598 Points (5%)
2016 Points (16%)
Geekbench 2 - 32 Bit - Geekbench Memory
1860 Points (17%)
2801 Points (25%)
Geekbench 2 - 32 Bit - Geekbench Floating Point
7368 Points (14%)
8155 Points (16%)
Geekbench 2 - 32 Bit - Geekbench Integer
3613 Points (7%)
4063 Points (8%)
Geekbench 2 - 32 Bit - Geekbench Total Score
4275 Points (11%)
5063 Points (13%)
Mozilla Kraken 1.1 - Kraken 1.1 Total Score *
min: 3703 avg: 4610 median: 4515.5 (5%) max: 5707 ms
min: 4105 avg: 4688 median: 4739.5 (6%) max: 5066 ms
Sunspider - Sunspider 1.0 Total Score *
9121 ms (100%)
Octane V2 - Octane V2 Total Score
min: 7798 avg: 8407 median: 8372 (8%) max: 9087 Points
min: 8163 avg: 8665 median: 8559 (8%) max: 9746 Points
WebXPRT 3 - WebXPRT 3 Score
min: 43 avg: 50.8 median: 52 (11%) max: 56 Points
min: 46 avg: 54.4 median: 54 (11%) max: 61 Points
AnTuTu v6 - AnTuTu v6 Total Score
min: 71303 avg: 73318 median: 73318 (25%) max: 75333 Points
min: 92015 avg: 98051 median: 95445 (33%) max: 125213 Points
AnTuTu v7 - AnTuTu v7 MEM
min: 2712 avg: 5838 median: 6029.5 (19%) max: 8580 Points
min: 6157 avg: 7167 median: 6810 (21%) max: 8905 Points
min: 27074 avg: 30317 median: 31150.5 (38%) max: 31891 Points
min: 31418 avg: 33672 median: 32826 (40%) max: 45201 Points
AnTuTu v7 - AnTuTu v7 GPU
min: 21269 avg: 22734 median: 23138.5 (7%) max: 23389 Points
min: 20870 avg: 21261 median: 21253 (7%) max: 21422 Points
AnTuTu v7 - AnTuTu v7 CPU
min: 45380 avg: 46822 median: 46737 (29%) max: 48432 Points
min: 54858 avg: 56762 median: 56113 (34%) max: 63874 Points
AnTuTu v7 - AnTuTu v7 Total Score
min: 101367 avg: 105710 median: 105782 (19%) max: 109906 Points
min: 115565 avg: 118863 median: 116748 (21%) max: 138661 Points
23506 Points (20%)
27466 Points (23%)
AnTuTu v8 - AnTuTu v8 MEM
27124 Points (22%)
30326 Points (24%)
AnTuTu v8 - AnTuTu v8 GPU
6105 Points (1%)
24483 Points (4%)
AnTuTu v8 - AnTuTu v8 CPU
49105 Points (18%)
62945 Points (23%)
AnTuTu v8 - AnTuTu v8 Total Score
105840 Points (10%)
145220 Points (14%)
PassMark PerformanceTest Mobile V1 - PerformanceTest Mobile V1 CPU Tests
min: 131628 avg: 133094 median: 133094 (18%) max: 134560 Points
min: 157795 avg: 157981 median: 157981 (21%) max: 158167 Points
PCMark for Android - PCM f. Android Storage 2.0 random write internal
4.5 MB/s (3%)
PCMark for Android - PCM f. Android Storage 2.0 seq write internal
72.8 MB/s (2%)
PCMark for Android - PCM f. Android Storage 2.0 random read internal
13.9 MB/s (17%)
PCMark for Android - PCM f. Android Storage 2.0 seq read internal
259.3 MB/s (7%)
PCMark for Android - PCM f. Android Storage 2.0 score
4843 Points (8%)
PCMark for Android - PCM f. Android Work Score 3.0
5089 Points (24%)
PCMark for Android - PCM f. Android Computer Vision
min: 2527 avg: 2548 median: 2547.5 (13%) max: 2568 Points
min: 3056 avg: 3090 median: 3071.5 (16%) max: 3160 Points
PCMark for Android - PCM f. Android Storage
min: 4371 avg: 5078 median: 5077.5 (11%) max: 5784 Points
min: 3406 avg: 5546 median: 5299.5 (11%) max: 8180 Points
PCMark for Android - PCM f. Android Work Score 2.0
min: 5269 avg: 5372 median: 5372.5 (35%) max: 5474 Points
min: 5611 avg: 5833 median: 5730 (37%) max: 6277 Points
PCMark for Android - PCM f. Android Work Score
min: 5802 avg: 6452 median: 6542 (33%) max: 6923 Points
min: 6040 avg: 6624 median: 6457 (32%) max: 7618 Points
Average Benchmarks Samsung Exynos 7904 → 100% n=31 Average Benchmarks Qualcomm Snapdragon 636 → 132% n=31
- Range of benchmark values for this graphics card
- Average benchmark values for this graphics card
* Smaller numbers mean a higher performance
1 This benchmark is not used for the average calculation
v1.26
log 24. 18:54:04
#0 checking url part for id 11376 +0s ... 0s
#1 checking url part for id 9956 +0s ... 0s
#2 not redirecting to Ajax server +0s ... 0s
#3 did not recreate cache, as it is less than 5 days old! Created at Tue, 23 Apr 2024 05:40:15 +0200 +0.001s ... 0.001s
#4 composed specs +0.016s ... 0.017s
#5 did output specs +0s ... 0.018s
#6 getting avg benchmarks for device 11376 +0.014s ... 0.032s
#7 got single benchmarks 11376 +0.014s ... 0.045s
#8 getting avg benchmarks for device 9956 +0.003s ... 0.049s
#9 got single benchmarks 9956 +0.031s ... 0.08s
#10 got avg benchmarks for devices +0s ... 0.08s
#11 min, max, avg, median took s +0.19s ... 0.27s
#12 return log +0.023s ... 0.293s
Please share our article, every link counts!
Redaktion, 2017-09- 8 (Update: 2023-07- 1)
 Deutsch
 English
 Español
 Français
 Italiano
 Nederlands
 Polski
 Português
 Русский
 Türkçe
 Svenska
 Chinese
 Magyar