

Intel Core i5-14501E vs AMD Ryzen 9 7950X3D vs Intel Core i5-13500T
Intel Core i5-14501E
► remove from comparisonThe Intel Core i5-14501E is a peculiar Raptor Lake family desktop processor (SoC) that has 6 performance cores but 0 efficient cores. It's the lack of E-cores that makes 14X01 chips special.
The product has decently sized level 2 and 3 caches at 12 MB and 24 MB, respectively. Its CPU cores run at up to 5.2 GHz. The UHD 770 serves as the integrated graphics solution. There is no 'proper' NPU here, however, vPro Enterprise features such as RPE (Remote Platform Erase) are onboard.
The i5 chip is manufactured built with the Intel 7 process which is fairly old, as of mid 2025. Its base TDP sits at 65 W which is the standard value for desktop CPUs.
Performance
While we have not tested a single 14X01 processor as of July 2025, we do know that a single 4.6 GHz Raptor Cove core, such as that of an Core i7-14650HX is good for 116 Cinebench 2024 points and 285 Cinebench R15 points. (The 14501E can run at up to 5.2 GHz, too, to remind you.) If we multiply the values by 6, we get a reasonably fair projection that sees the 14501E being about as fast as lower mid-range laptop AMD chips of 2025, such as the AMD Ryzen AI 5 340. While not particularly impressive, this is definitely sufficient for any tasks and applications one could run in 2025, top games included.
AMD Ryzen 9 7950X3D
► remove from comparison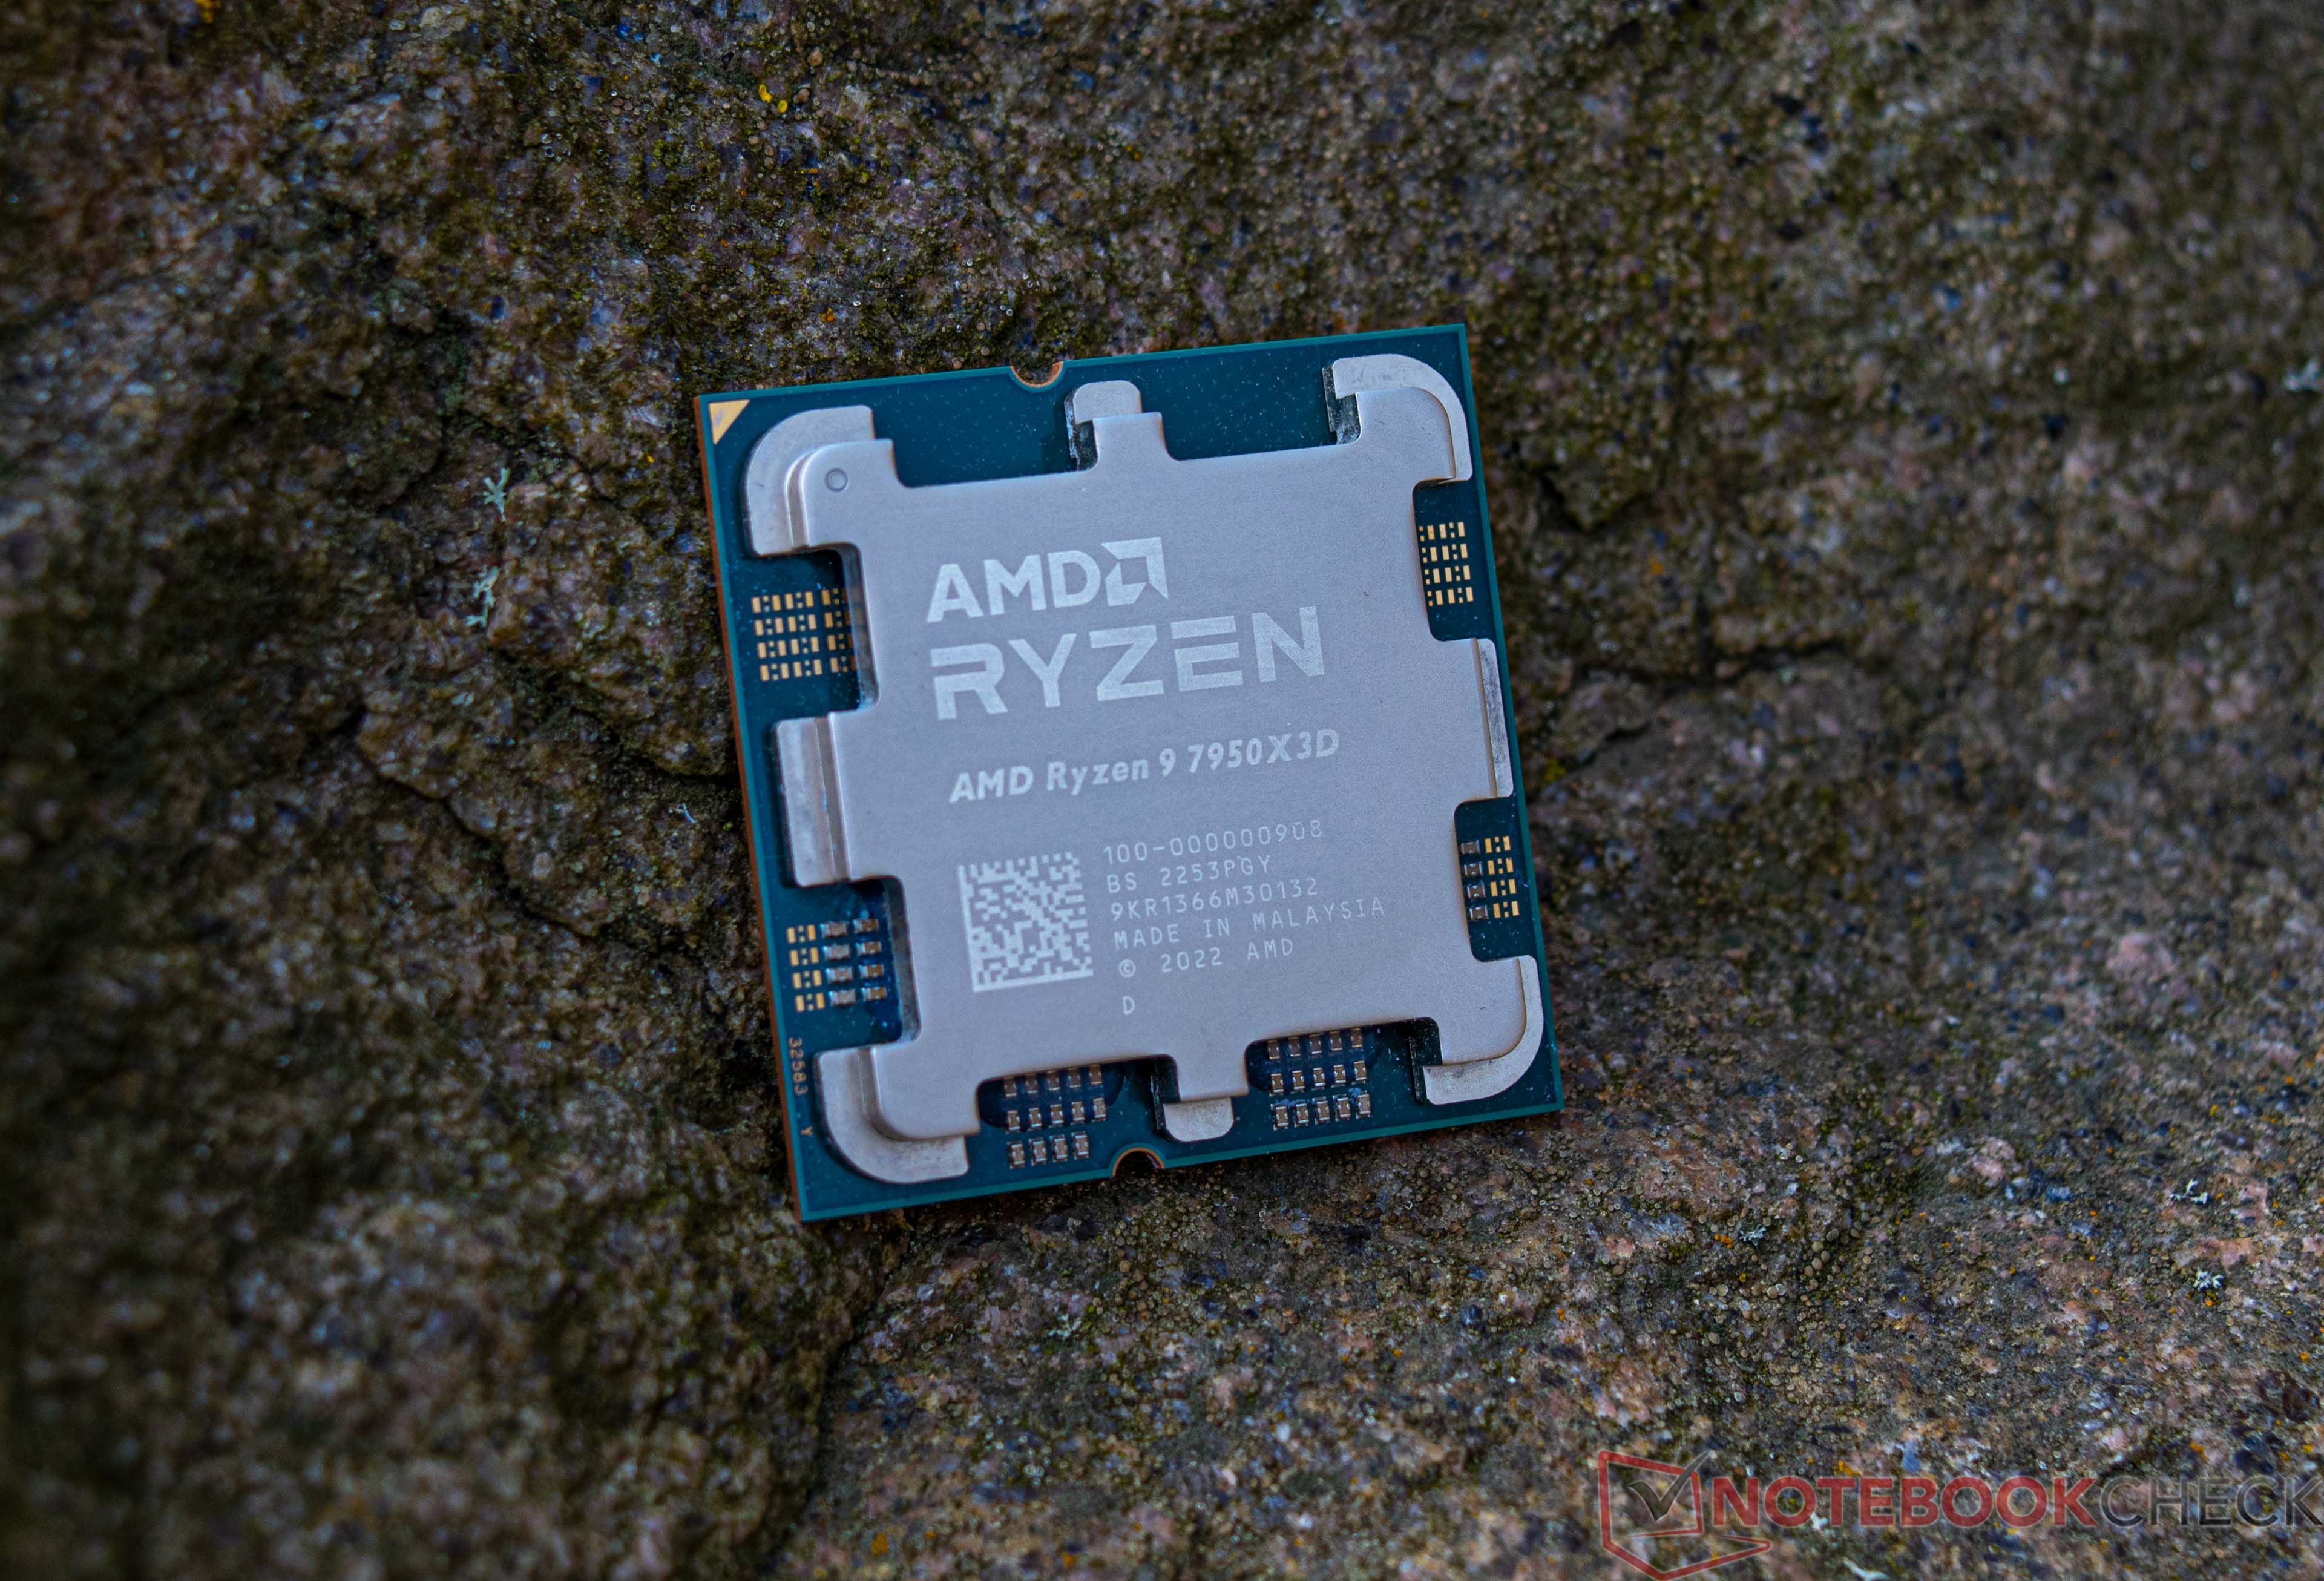
The AMD Ryzen 9 7950X3D is a high-end desktop processor of the Raphael series with 16 cores and SMT (Simultaneous Multithreading), which means it can process up to 32 threads simultaneously. With the release in February 2023, the Ryzen 9 7950X3D is AMD's fastest consumer processor and the new top model of the 7000 series. The CPU cores clock from 4.2 GHz (base clock) up to 5.7 GHz (single core Turbo). In addition, the AMD Ryzen 9 7950X3D has a CCD with 8 cores that can access the fast 3D V-cache, which offers considerably more gaming performance.
The performance of the AMD Ryzen 9 7950X3D is consistently excellent in all applications tested. In addition, AMD was again able to increase the single-thread performance compared to the non-X3D models. Nevertheless, the lower base clock compared to the AMD Ryzen 9 7950X means that a small drop in multi-thread performance has to be accepted.
The internal structure of the processor is comparable to the previous AMD Ryzen 9 7950X. The AMD Ryzen 9 7950X3D is also still based on the chiplet design consisting of two CCD clusters with 8 cores each. However, the two CCDs differ significantly from each other because one offers the fast 3D V-Cache, which primarily improves gaming performance. In testing, the AMD Ryzen 9 7950X3D was able to put the Intel Core i9-13900K in second place and is the fastest gaming CPU on the market at the time of testing.
The AMD Ryzen 9 7950X3D is an extremely energy-efficient CPU with up to 162 watts (PPT) and is significantly more frugal under load than an AMD Ryzen 9 7950X (max. 230 watts).
Intel Core i5-13500T
► remove from comparisonThe Intel Core i5-13500T is a fast and very economical desktop processor based on the Raptor Lake architecture, which was introduced in October 2022. The processor offers a base clock of 1.6 GHz and reaches up to 4.6 GHz in Turbo. The hybrid CPU architecture, which was introduced with Alder Lake, also benefits the Raptor Lake processors. The suffix T stands for a particularly economical CPU model, and with a TDP of just 35 watts (PL1 = 35 watts), these processors are ideally suited for small, compact systems.
Performance
The low power consumption ultimately results in slightly lower performance compared to the Intel Core i5-13500. Depending on how the PL2 (92 watts) is defined, there may be noticeable differences in multi-core performance. Compared to the Intel Core i5-12500T, the Intel Core i5-13500T is superior due to the higher number of physical computing units.
Graphics unit
Like the Intel Core i5-12500T, the Intel Core i5-13500T offers an integrated graphics unit. The Intel Iris Xe architecture continues to serve as the basis. In terms of performance, however, not much has changed with the new Intel UHD Graphics 770. The iGPU of the Intel Core i5-13500T also clocks 100 MHz higher, but this does not make a noticeable difference in everyday use.
Power consumption
The TDP of the Intel Core i5-13500T is 35 watts, with the option to increase this to up to 92 watts in Turbo mode. Compared to the Intel Core i5-12500T (PL2 = 74 watts), the maximum possible energy requirement increases slightly.
| Model | Intel Core i5-14501E | AMD Ryzen 9 7950X3D | Intel Core i5-13500T | ||||||||||||||||||||||||||||||||||||||||||||||||||||||||||||||||||||||||||||||||||||||||||||||||||||||||
| Codename | Raptor Lake | Raphael (Zen4) | Raptor Lake | ||||||||||||||||||||||||||||||||||||||||||||||||||||||||||||||||||||||||||||||||||||||||||||||||||||||||
| Series | Intel Raptor Lake-S | AMD Raphael (Zen 4, Ryzen 7000) | Intel Raptor Lake-S | ||||||||||||||||||||||||||||||||||||||||||||||||||||||||||||||||||||||||||||||||||||||||||||||||||||||||
| Series: Raptor Lake-S Raptor Lake |
|
|
| ||||||||||||||||||||||||||||||||||||||||||||||||||||||||||||||||||||||||||||||||||||||||||||||||||||||||
| Clock | 3300 - 5200 MHz | 4200 - 5700 MHz | 1600 - 4600 MHz | ||||||||||||||||||||||||||||||||||||||||||||||||||||||||||||||||||||||||||||||||||||||||||||||||||||||||
| L2 Cache | 12 MB | 16 MB | 11.5 MB | ||||||||||||||||||||||||||||||||||||||||||||||||||||||||||||||||||||||||||||||||||||||||||||||||||||||||
| L3 Cache | 24 MB | 128 MB | 24 MB | ||||||||||||||||||||||||||||||||||||||||||||||||||||||||||||||||||||||||||||||||||||||||||||||||||||||||
| Cores / Threads | 6 / 12 6 x 5.2 GHz Intel Raptor Cove P-Core | 16 / 32 16 x 5.7 GHz AMD Zen 4 | 14 / 20 6 x 4.6 GHz Intel Golden Cove P-Core 8 x 3.2 GHz Intel Gracemont E-Core | ||||||||||||||||||||||||||||||||||||||||||||||||||||||||||||||||||||||||||||||||||||||||||||||||||||||||
| TDP | 65 Watt | 120 Watt | 35 Watt | ||||||||||||||||||||||||||||||||||||||||||||||||||||||||||||||||||||||||||||||||||||||||||||||||||||||||
| Technology | 10 nm | 5 nm | 10 nm | ||||||||||||||||||||||||||||||||||||||||||||||||||||||||||||||||||||||||||||||||||||||||||||||||||||||||
| Socket | LGA1700 | AM5 (LGA 1718) | LGA 1700 | ||||||||||||||||||||||||||||||||||||||||||||||||||||||||||||||||||||||||||||||||||||||||||||||||||||||||
| Features | DDR4-3200/DDR5-4800 RAM, PCIe 5 + PCIe 4, DL Boost, GNA, vPro En., RPE, MMX, SSE, SSE2, SSE3, SSSE3, SSE4.1, SSE4.2, AVX, AVX2, BMI2, ABM, FMA, ADX, SMEP, SMAP, EIST, TM1, TM2, HT, Turbo, SST, AES-NI, RDRAND, RDSEED, SHA | MMX(+), SSE, SSE2, SSE3, SSSE3, SSE4.1, SSE4.2, SSE4A, x86-64, AMD-V, AES, AVX, AVX2, AVX512F, FMA3, SHA, XFR2, Precision Boost 2 | Intel UHD Graphics 770, DDR5 4800 MT/s, DDR4 3200 MT/s | ||||||||||||||||||||||||||||||||||||||||||||||||||||||||||||||||||||||||||||||||||||||||||||||||||||||||
| iGPU | Intel UHD Graphics 770 ( - 1550 MHz) | AMD Radeon Graphics (Ryzen 7000) (400 - 2200 MHz) | Intel UHD Graphics 770 (300 - 1550 MHz) | ||||||||||||||||||||||||||||||||||||||||||||||||||||||||||||||||||||||||||||||||||||||||||||||||||||||||
| Architecture | x86 | x86 | x86 | ||||||||||||||||||||||||||||||||||||||||||||||||||||||||||||||||||||||||||||||||||||||||||||||||||||||||
| Announced | |||||||||||||||||||||||||||||||||||||||||||||||||||||||||||||||||||||||||||||||||||||||||||||||||||||||||||
| Manufacturer | www.intel.com | www.amd.com | |||||||||||||||||||||||||||||||||||||||||||||||||||||||||||||||||||||||||||||||||||||||||||||||||||||||||
| L1 Cache | 1 MB | ||||||||||||||||||||||||||||||||||||||||||||||||||||||||||||||||||||||||||||||||||||||||||||||||||||||||||
| Transistors | 13140 Million | ||||||||||||||||||||||||||||||||||||||||||||||||||||||||||||||||||||||||||||||||||||||||||||||||||||||||||
| Die Size | 263 mm2 | 215 mm2 | |||||||||||||||||||||||||||||||||||||||||||||||||||||||||||||||||||||||||||||||||||||||||||||||||||||||||
| max. Temp. | 89 °C | 100 °C | |||||||||||||||||||||||||||||||||||||||||||||||||||||||||||||||||||||||||||||||||||||||||||||||||||||||||
| $699 U.S. | |||||||||||||||||||||||||||||||||||||||||||||||||||||||||||||||||||||||||||||||||||||||||||||||||||||||||||
| TDP Turbo PL2 | 92 Watt |

Benchmarks
Average Benchmarks AMD Ryzen 9 7950X3D → 0% n=0
Average Benchmarks Intel Core i5-13500T → 0% n=0
* Smaller numbers mean a higher performance
1 This benchmark is not used for the average calculation