Notebookcheck Logo

Broadcom BCM28155 vs Texas Instruments OMAP 4470 vs Apple A5x

Broadcom BCM28155

► remove from comparison Broadcom BCM28155

The Broadcom BCM28155 is a Dual-Core Cortex-A9 SoC with an integrated VideoCore-IV graphics card and UMTS/HSPA+ (no LTE). The two ARM Cortex-A9 processor cores run with up to 1.2 GHz. The integrated modem supports UMTS and HSPA+ but no LTE.

Texas Instruments OMAP 4470

► remove from comparison  OMAP 4470

The OMAP 4470 is a fourth generation SoC (System on Chip) developed by Texas Instruments (TI) for use in mobile phones and tablets. The 45 nm chip includes dual ARM Cortex-A9 CPU cores running at 1.3 GHz up to 1.8 GHz on an ARM v7 instruction set and ARM NEON SIMD (Single instruction, multiple data) engine. 

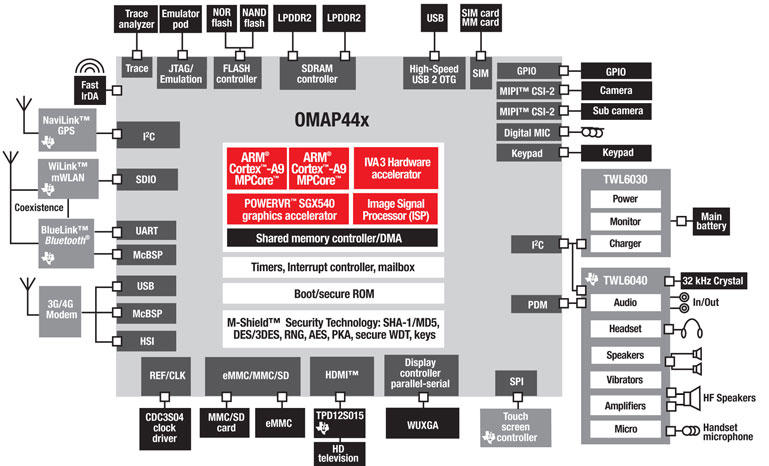
The SoC integrates an SGX540 GPU from PowerVR clocked at 277 - 384 MHz, which can utilize the same 400 MHz dual-channel LPDDR2 memory controller as the two core processors. Compared to the OMAP 4430, the 4470 is clocked higher on both the CPU and GPU.

Apple A5x

► remove from comparison

The Apple A5x is a dual-core processor that contains two Cortex A9 cores. The A5x integrates a relative fast Quad-Core PowerVR SGX 543MP4 graphics card and is used in the third generation iPad with Retina Display.

ModelBroadcom BCM28155Texas Instruments OMAP 4470Apple A5x
SeriesBroadcom Apple
CodenameCortex A9Cortex A9Cortex A9
Series: Cortex A9
Texas Instruments OMAP 44701.5 GHz2 / 2 cores Cortex A9
Texas Instruments OMAP 44601.2 GHz2 / 2 cores Cortex A9
Broadcom BCM28155 « 1.2 GHz2 / 2 cores Cortex A9
Texas Instruments OMAP 44301 GHz2 / 2 cores Cortex A9
Apple A5x1 GHzcores Cortex A9
Apple A51 GHzcores Cortex A9
Texas Instruments OMAP 4470 « 1.5 GHz2 / 2 cores Cortex A9
Texas Instruments OMAP 44601.2 GHz2 / 2 cores Cortex A9
Broadcom BCM281551.2 GHz2 / 2 cores Cortex A9
Texas Instruments OMAP 44301 GHz2 / 2 cores Cortex A9
Apple A5x1 GHzcores Cortex A9
Apple A51 GHzcores Cortex A9
Texas Instruments OMAP 44701.5 GHz2 / 2 cores Cortex A9
Texas Instruments OMAP 44601.2 GHz2 / 2 cores Cortex A9
Broadcom BCM281551.2 GHz2 / 2 cores Cortex A9
Texas Instruments OMAP 44301 GHz2 / 2 cores Cortex A9
Apple A5x « 1 GHzcores Cortex A9
Apple A51 GHzcores Cortex A9
Clock1200 MHz1500 MHz1000 MHz
Cores / Threads2 / 22 / 22
Technology40 nm45 nm32? nm
FeaturesDual Channel LPDDR2 400MHz Memory Controller, VideoCore-IV GPUDual Channel LPDDR 400MHz Memory Controller, IVA 3 Multimedia Accelerator, PowerVR SGX 540 Graphics Core, Image Signal Processor
ArchitectureARMARMARM
Announced
Manufacturerwww.broadcom.com
L1 Cache1 MB

Benchmarks

3DMark - 3DMark Ice Storm Physics
100%
1 A5x +
2858 Points (2%)
3DMark - 3DMark Ice Storm Extreme Physics
100%
1 A5x +
2865 Points (2%)
Geekbench 4.0 - Geekbench 4.0 64 Bit Single-Core
100%
1 A5x +
330 Points (4%)
Geekbench 4.0 - Geekbench 4.0 64 Bit Multi-Core
100%
1 A5x +
566 Points (1%)
Geekbench 3 - Geekbench 3 32 Bit Multi-Core
100%
1 A5x +
496 Points (1%)
Geekbench 3 - Geekbench 3 32 Bit Single-Core
100%
1 A5x +
262 Points (5%)
Geekbench 2 - 32 Bit - Geekbench Stream
min: 149     avg: 240.5     median: 240.5 (2%)     max: 332 Points
min: 436     avg: 438     median: 438 (4%)     max: 440 Points
138%
A5x +
333 Points (3%)
Geekbench 2 - 32 Bit - Geekbench Memory
min: 731     avg: 738     median: 737.5 (7%)     max: 744 Points
min: 1302     avg: 1326     median: 1325.5 (12%)     max: 1349 Points
111%
A5x +
818 Points (7%)
Geekbench 2 - 32 Bit - Geekbench Floating Point
min: 555     avg: 930     median: 930 (2%)     max: 1305 Points
min: 1895     avg: 1929     median: 1929 (4%)     max: 1963 Points
99%
A5x +
920 Points (2%)
Geekbench 2 - 32 Bit - Geekbench Integer
min: 324     avg: 533     median: 533 (1%)     max: 742 Points
min: 1118     avg: 1136     median: 1135.5 (2%)     max: 1153 Points
129%
A5x +
687 Points (1%)
Geekbench 2 - 32 Bit - Geekbench Total Score
min: 468     avg: 679     median: 679 (2%)     max: 890 Points
min: 1367     avg: 1381     median: 1381 (4%)     max: 1395 Points
112%
A5x +
759 Points (2%)
Linpack Android / IOS - Linpack Multi Thread
min: 24.39     avg: 52     median: 52 (2%)     max: 79.7 MFLOPS
min: 80.5     avg: 87.6     median: 87.6 (3%)     max: 94.6 MFLOPS
273%
A5x +
142 MFLOPS (5%)
Linpack Android / IOS - Linpack Single Thread
min: 26.08     avg: 36.2     median: 36.2 (4%)     max: 46.3 MFLOPS
min: 52.5     avg: 55.4     median: 55.4 (5%)     max: 58.3 MFLOPS
243%
A5x +
87.8 MFLOPS (9%)
Mozilla Kraken 1.1 - Kraken 1.1 Total Score *
100%
1 A5x +
31272 ms (37%)
Sunspider - Sunspider 0.9.1 Total Score *
min: 1434     avg: 1701     median: 1701 (16%)     max: 1968 ms
min: 1438     avg: 1497     median: 1497 (14%)     max: 1556 ms
101%
A5x +
min: 1329     avg: 1595     median: 1594.5 (15%)     max: 1860 ms
Sunspider - Sunspider 1.0 Total Score *
100%
1 A5x +
1307 ms (14%)
Quadrant Standard Edition 2.0 - Quadrant Standard 2.0 Total Score
3909 points (9%)
min: 2747     avg: 3447     median: 3447 (8%)     max: 4147 points
AnTuTu v3 - AnTuTu v3 CPU
min: 1169     avg: 1255     median: 1255 (8%)     max: 1341 Points
PassMark PerformanceTest Mobile V1 - PerformanceTest Mobile V1 CPU Tests
100%
1 A5x +
11087 Points (1%)

Average Benchmarks Broadcom BCM28155 → 100% n=8

Average Benchmarks Texas Instruments OMAP 4470 → 176% n=8

Average Benchmarks Apple A5x → 151% n=8

- Range of benchmark values for this graphics card
- Average benchmark values for this graphics card
* Smaller numbers mean a higher performance
1 This benchmark is not used for the average calculation

v1.26
log 25. 09:34:50

#0 checking url part for id 3771 +0s ... 0s

#1 checking url part for id 3647 +0s ... 0s

#2 checking url part for id 3094 +0s ... 0s

#3 not redirecting to Ajax server +0s ... 0s

#4 did not recreate cache, as it is less than 5 days old! Created at Thu, 25 Apr 2024 05:38:32 +0200 +0.001s ... 0.001s

#5 composed specs +0.126s ... 0.128s

#6 did output specs +0s ... 0.128s

#7 getting avg benchmarks for device 3771 +0.003s ... 0.131s

#8 got single benchmarks 3771 +0.009s ... 0.14s

#9 getting avg benchmarks for device 3647 +0.003s ... 0.143s

#10 got single benchmarks 3647 +0.01s ... 0.153s

#11 getting avg benchmarks for device 3094 +0.003s ... 0.156s

#12 got single benchmarks 3094 +0.009s ... 0.165s

#13 got avg benchmarks for devices +0s ... 0.165s

#14 min, max, avg, median took s +0.09s ... 0.255s

#15 return log +0s ... 0.255s

Please share our article, every link counts!
> Expert Reviews and News on Laptops, Smartphones and Tech Innovations > Benchmarks / Tech > Processor Comparison - Head 2 Head
Redaktion, 2017-09- 8 (Update: 2023-07- 1)