 Deutsch
 English
 Español
 Français
 Italiano
 Nederlands
 Polski
 Português
 Русский
 Türkçe
 Svenska
 Chinese
 Magyar
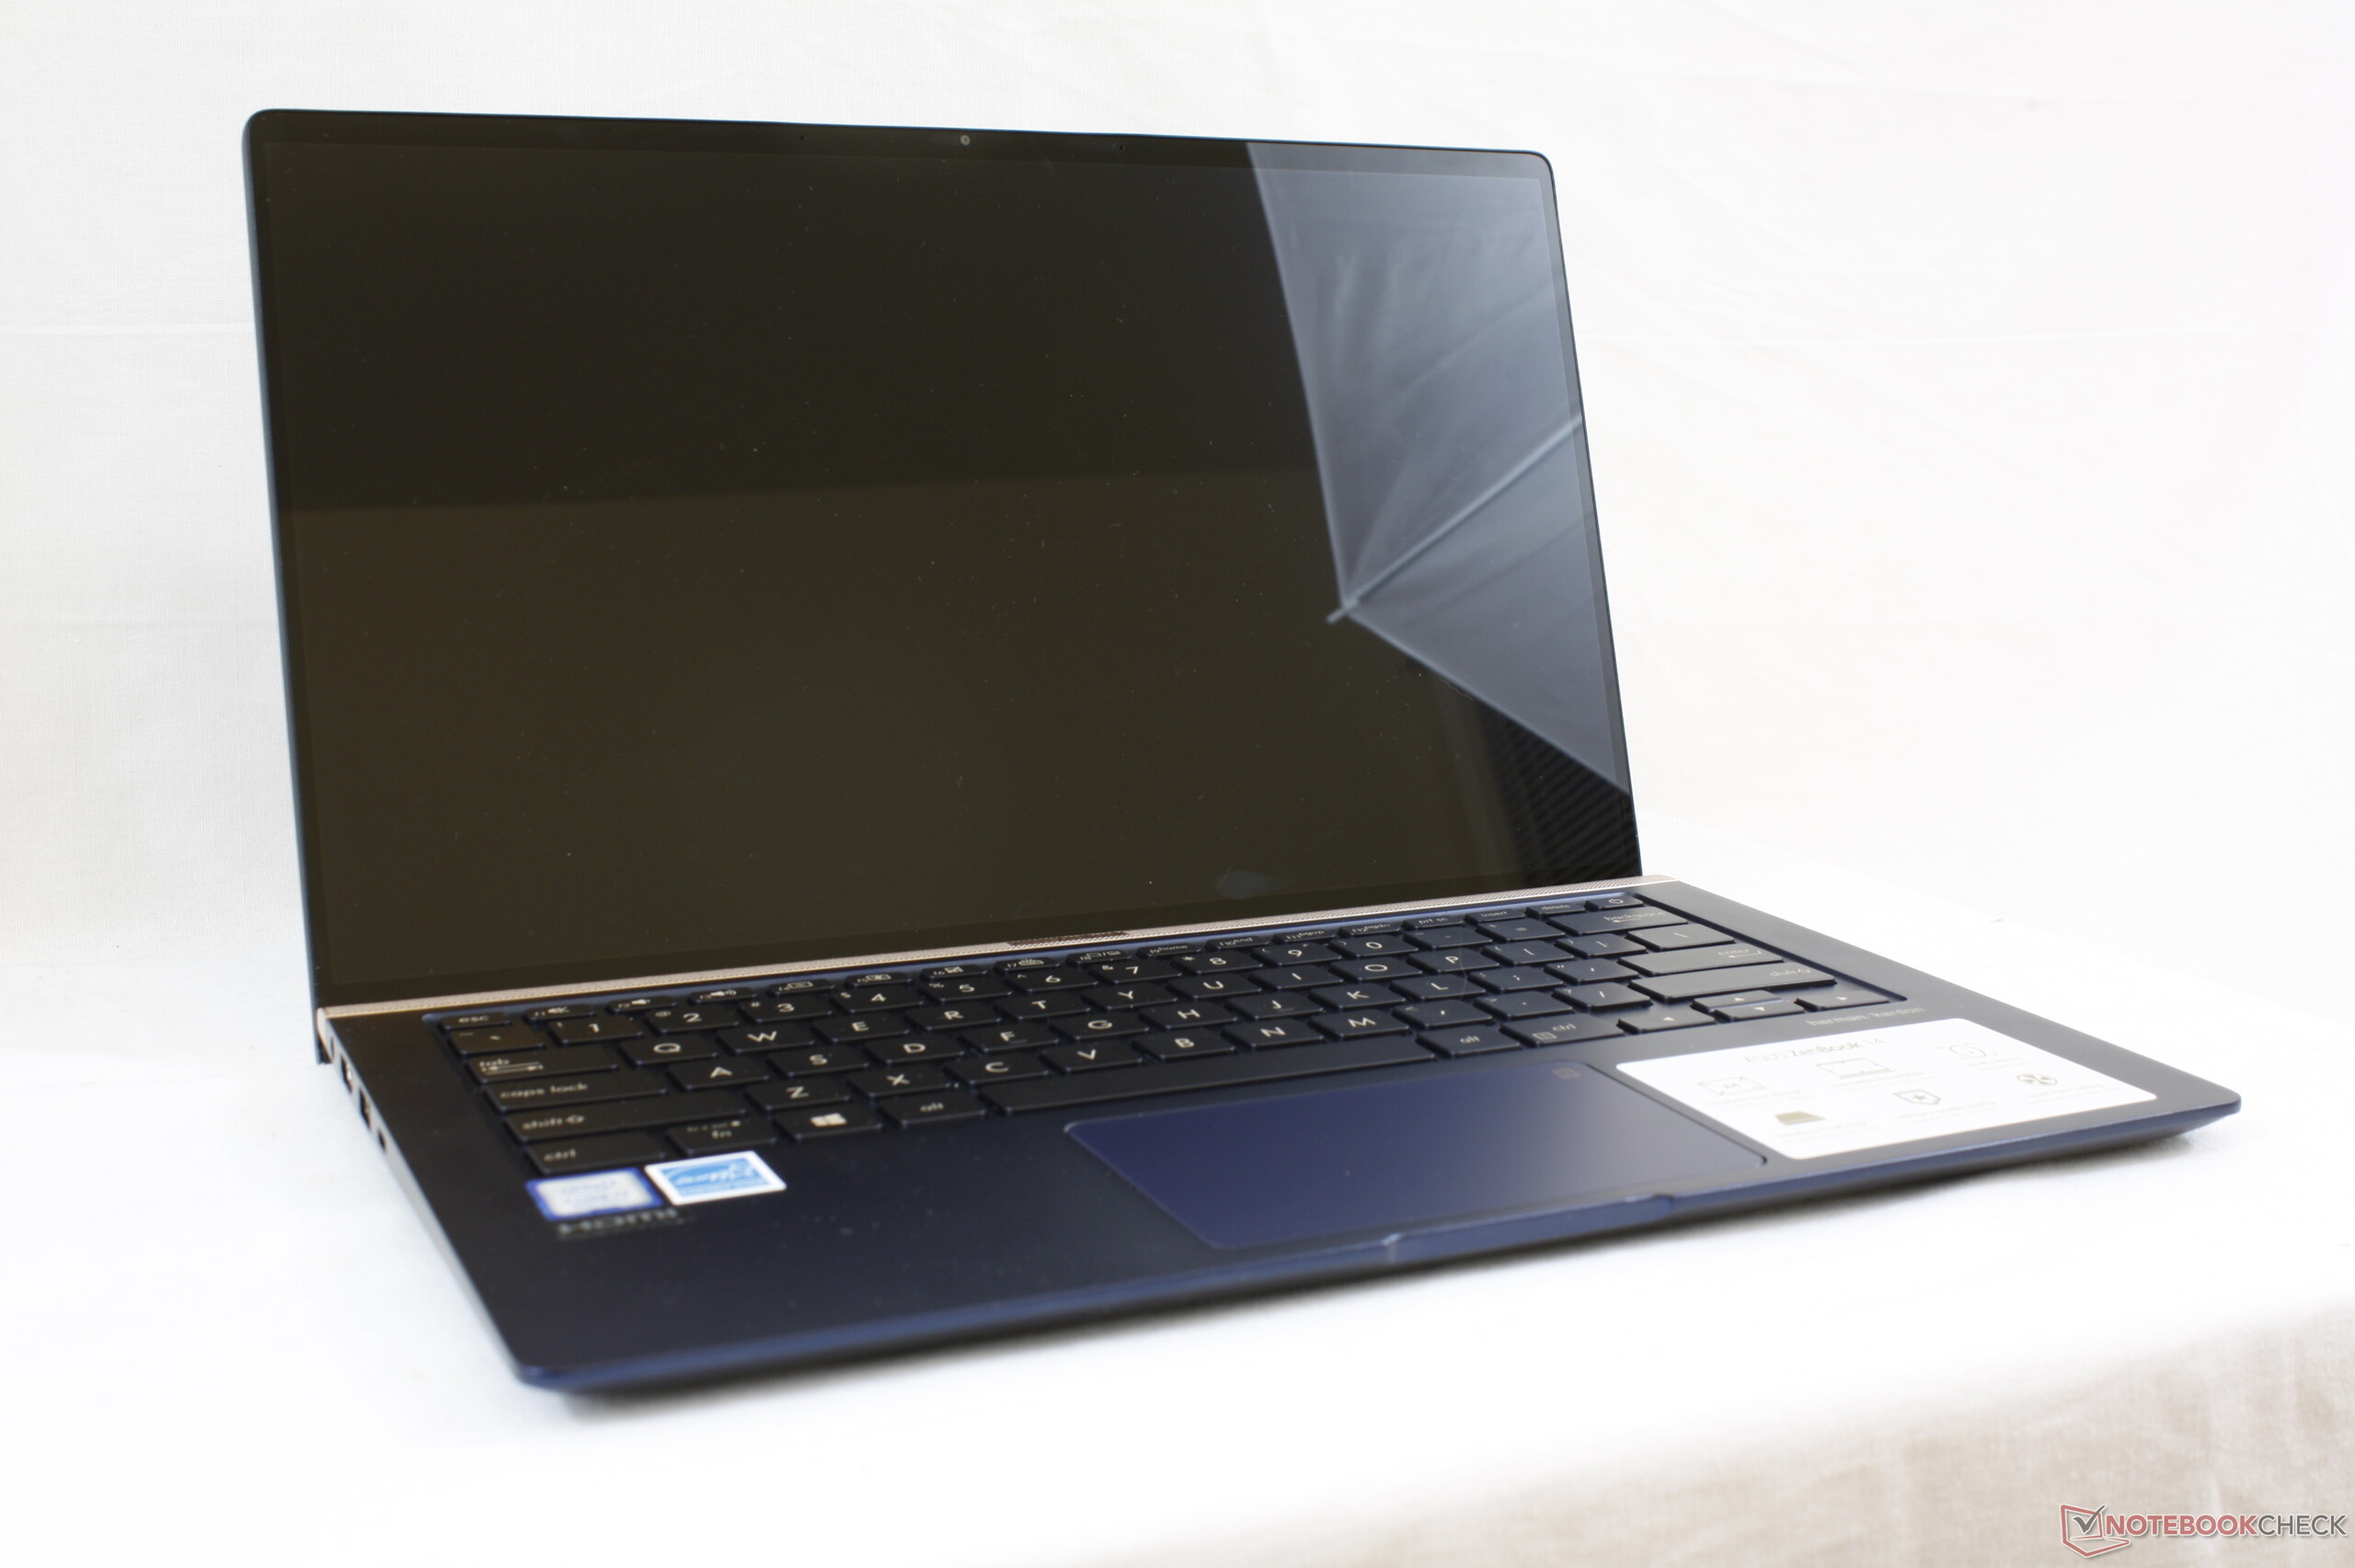
ASUS ZenBook 14 UX433FN (Core i7-8565U, MX150, SSD, FHD) Laptop Review

The UX433FN is the third of ASUS’ current ZenBook 14 generation to have entered our offices. While they all share Whiskey Lake processors, the UX433FN has a dedicated GPU, unlike the other two models that we have tested. ASUS has equipped the device with an NVIDIA GeForce MX150, which is an entry-level GPU that OEMs have been using in their compact laptops for the last couple of years. The GPU has 2 GB of VRAM, which is complemented by 16 GB of DDR4-2400 dual-channel RAM.
We have chosen to compare the UX433FN against other thin and light laptops. Our comparison devices include the Acer Swift 3 SF314-52G, Honor Magicbook, HP Envy 13, Huawei MateBook 13 and the Lenovo IdeaPad 720S-13ARR. All but the Lenovo are equipped with GeForce MX150 GPUs, for reference. By contrast, the Lenovo relies on the integrated AMD Radeon RX Vega 10 for graphics.
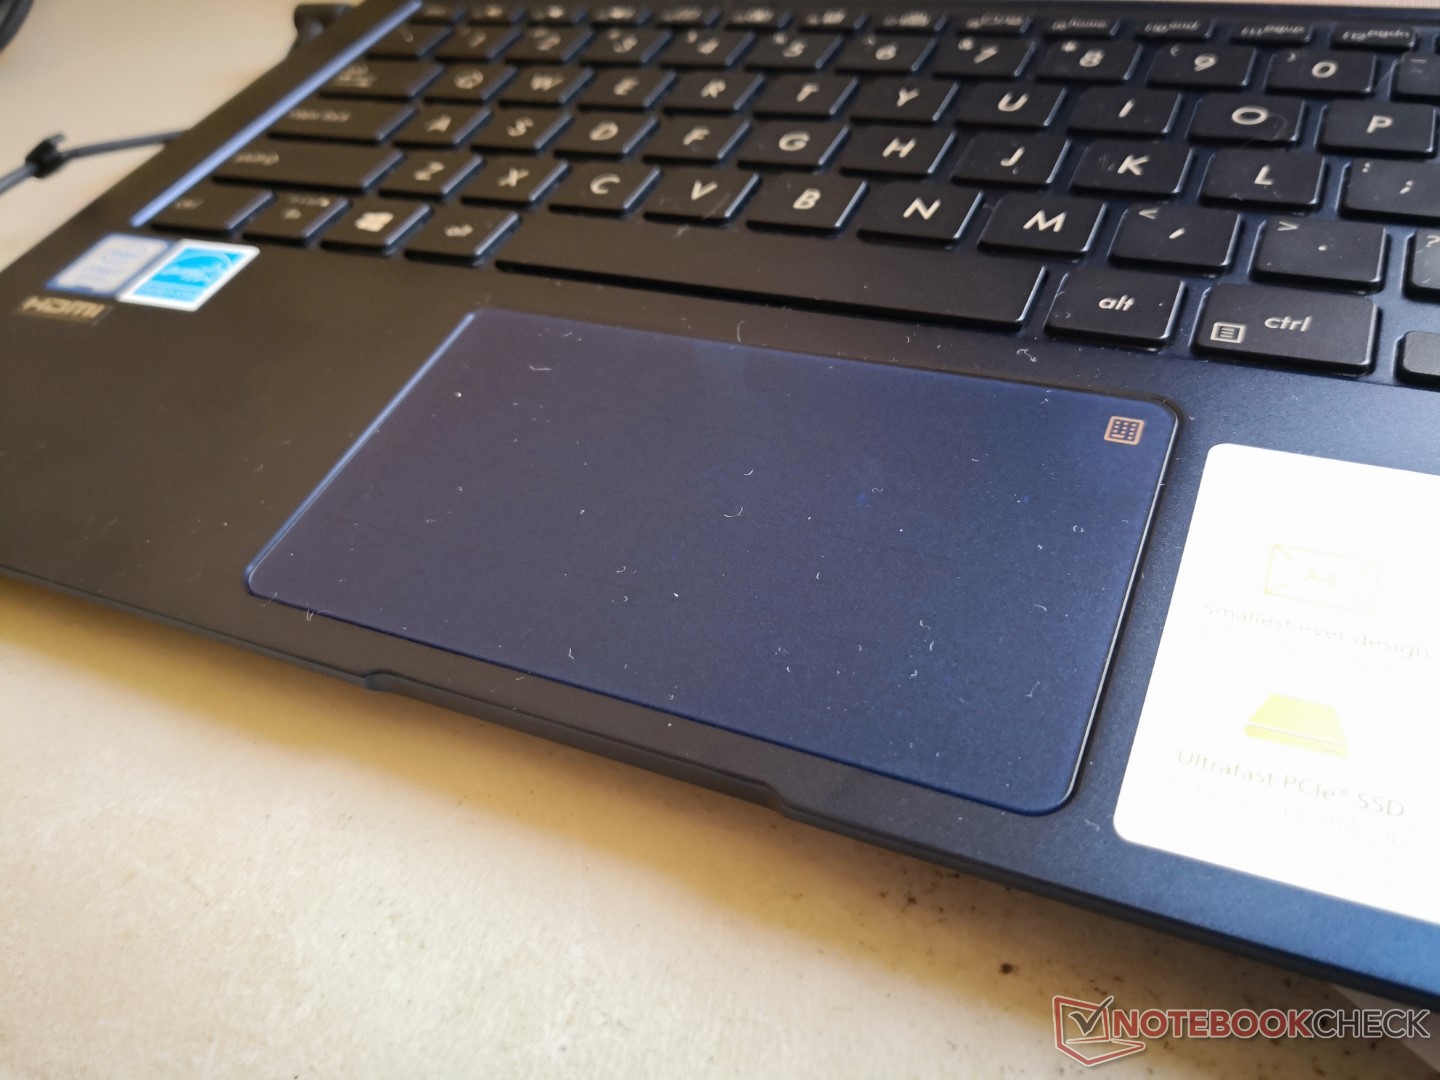
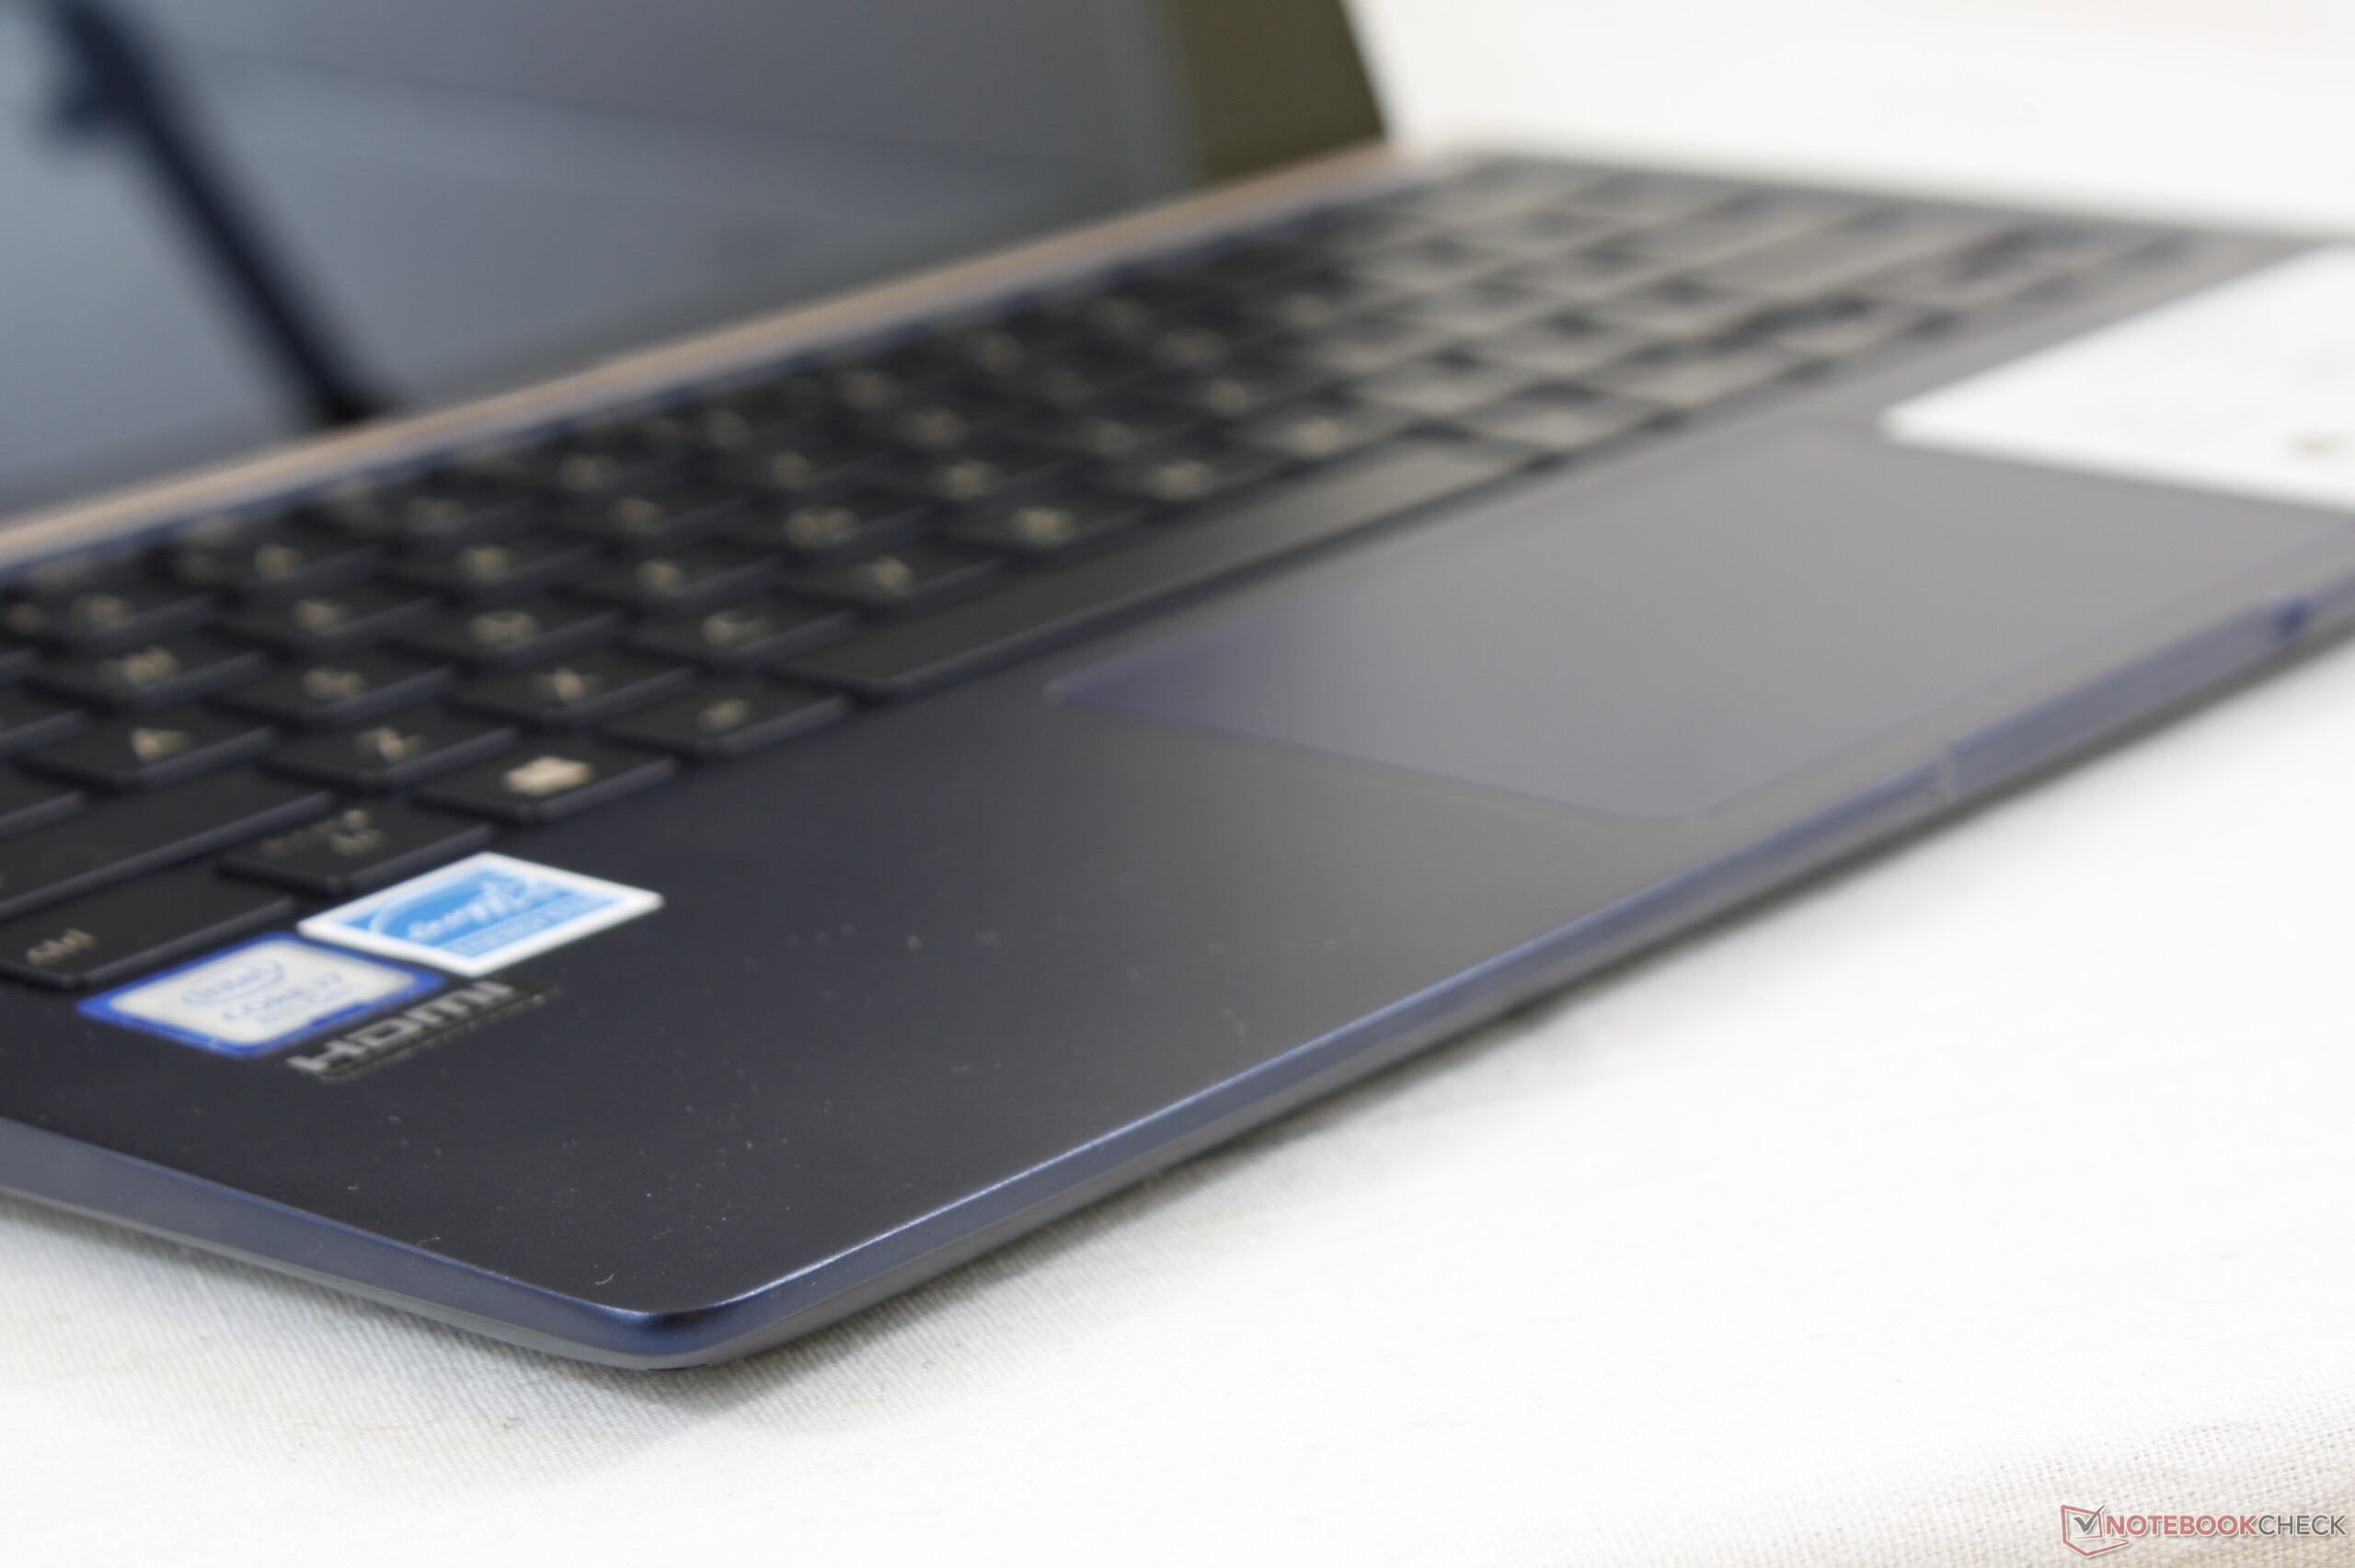
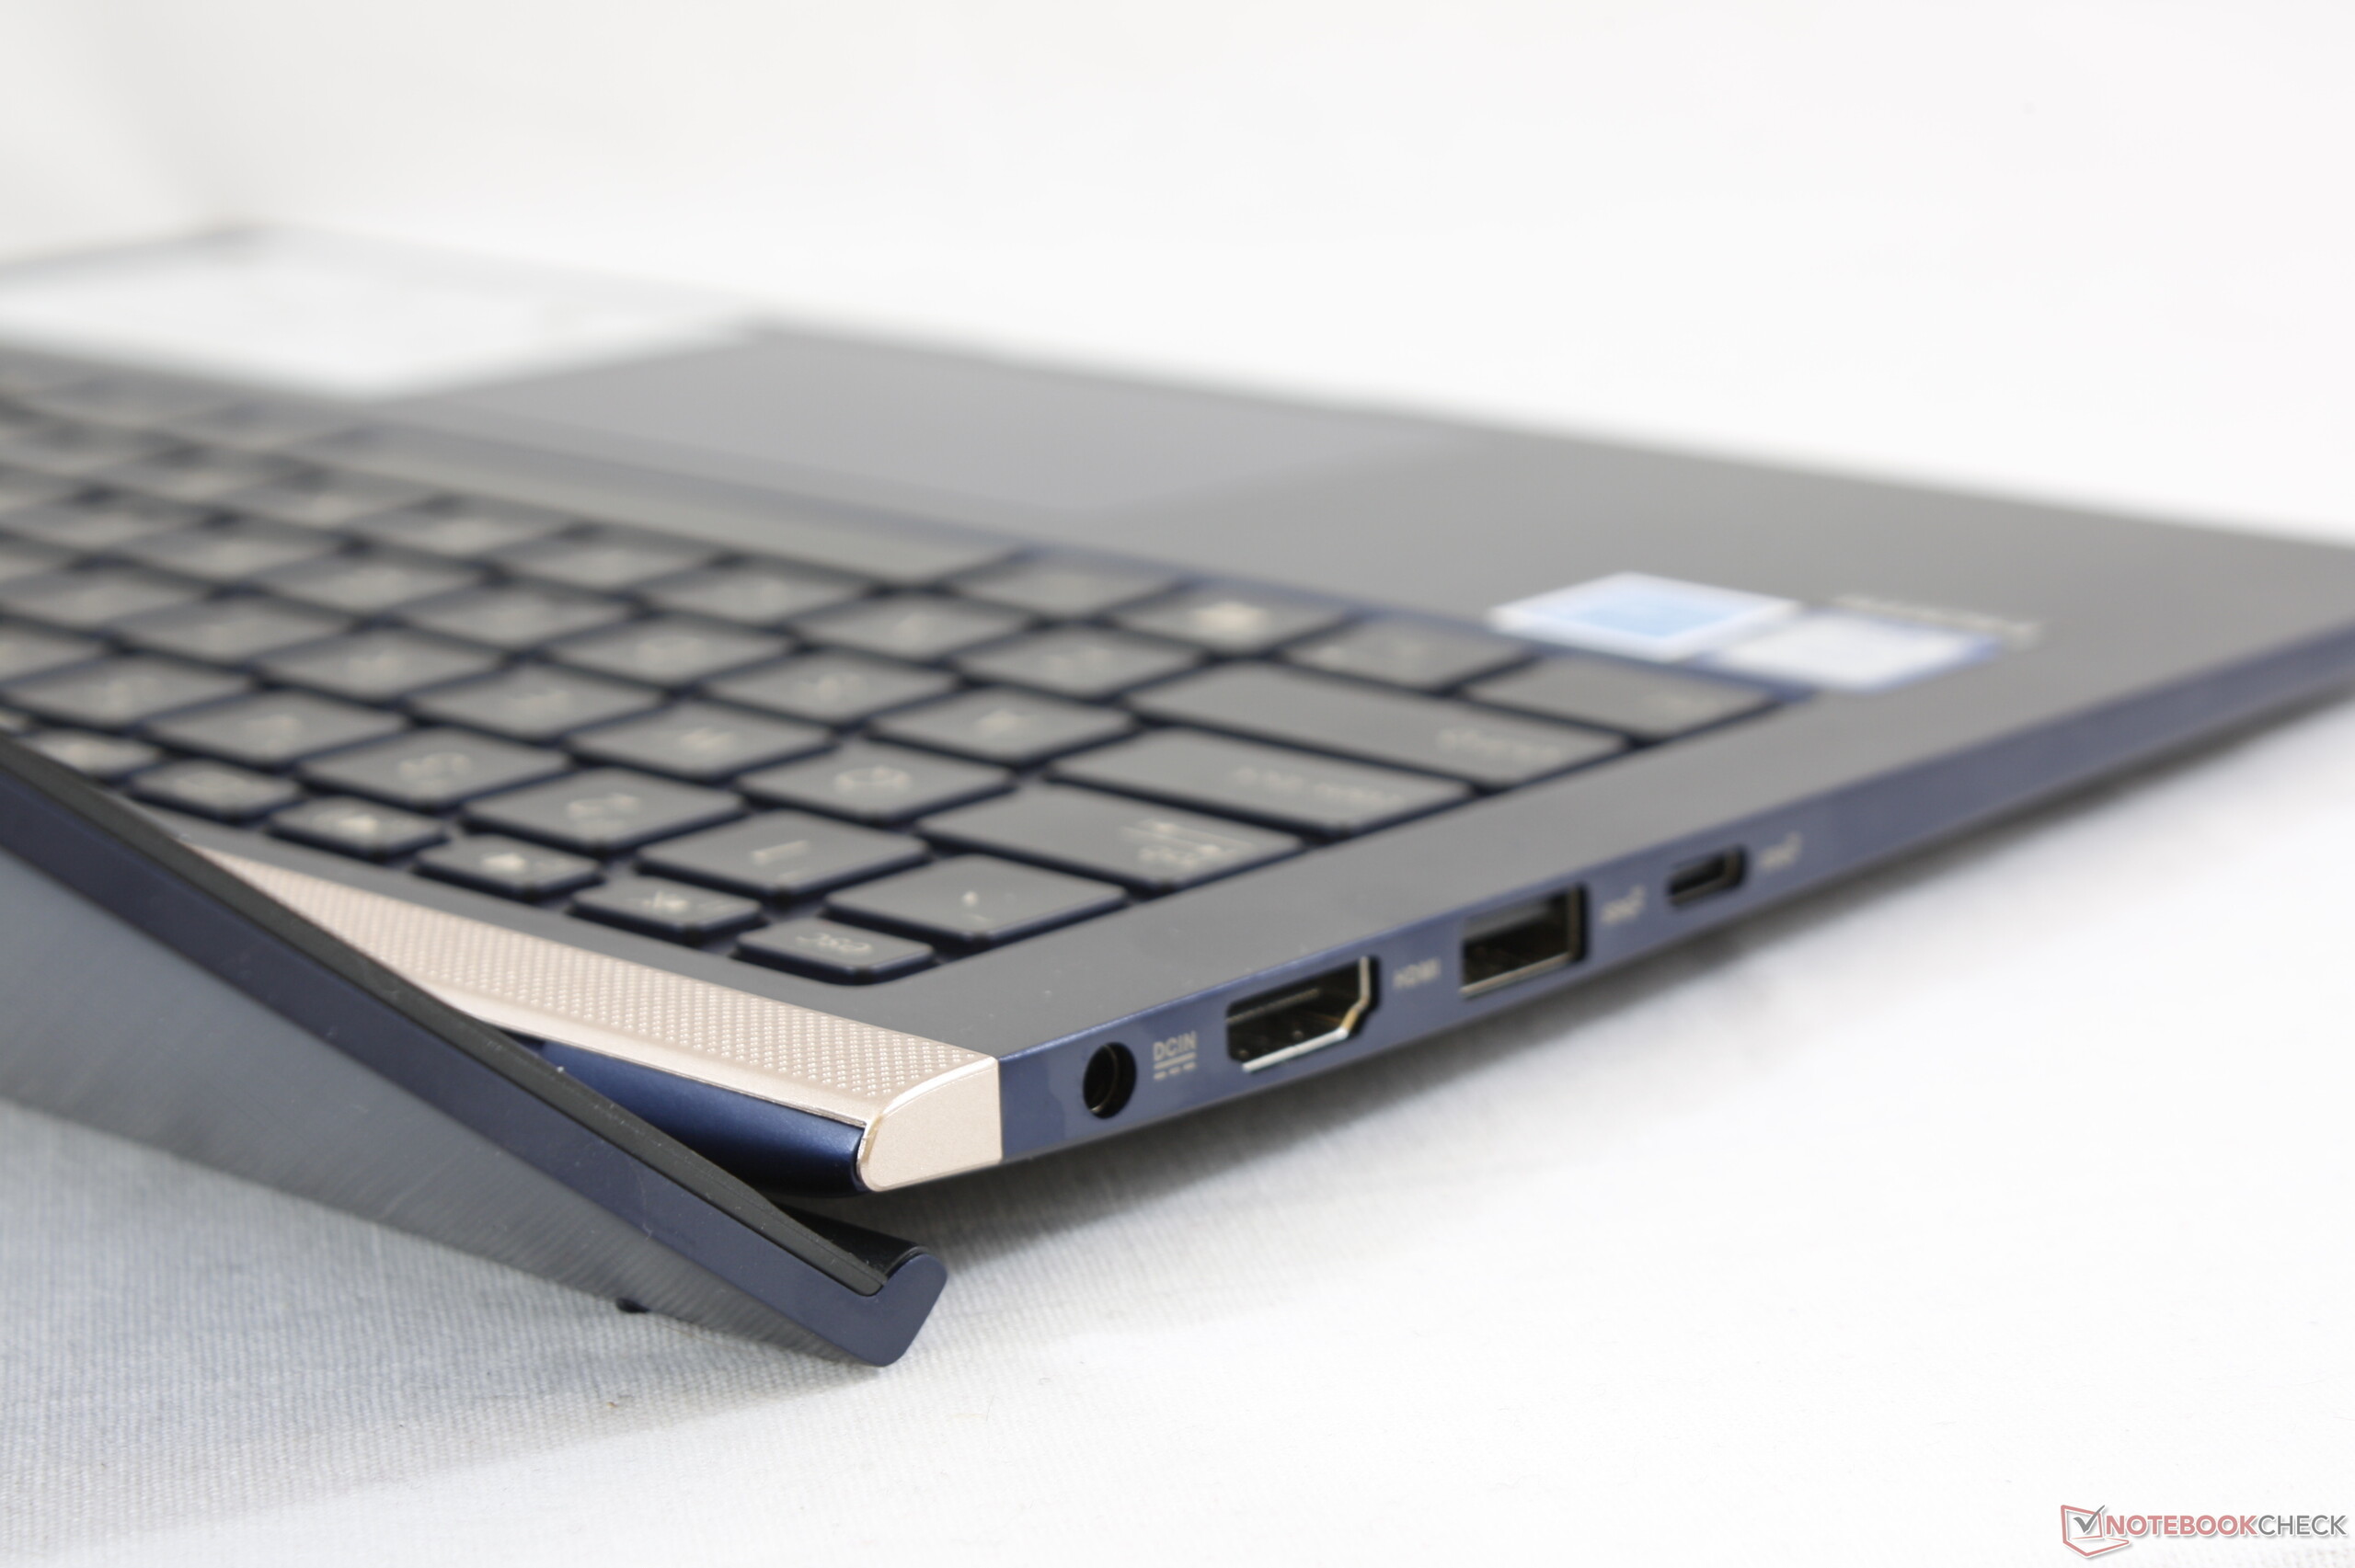
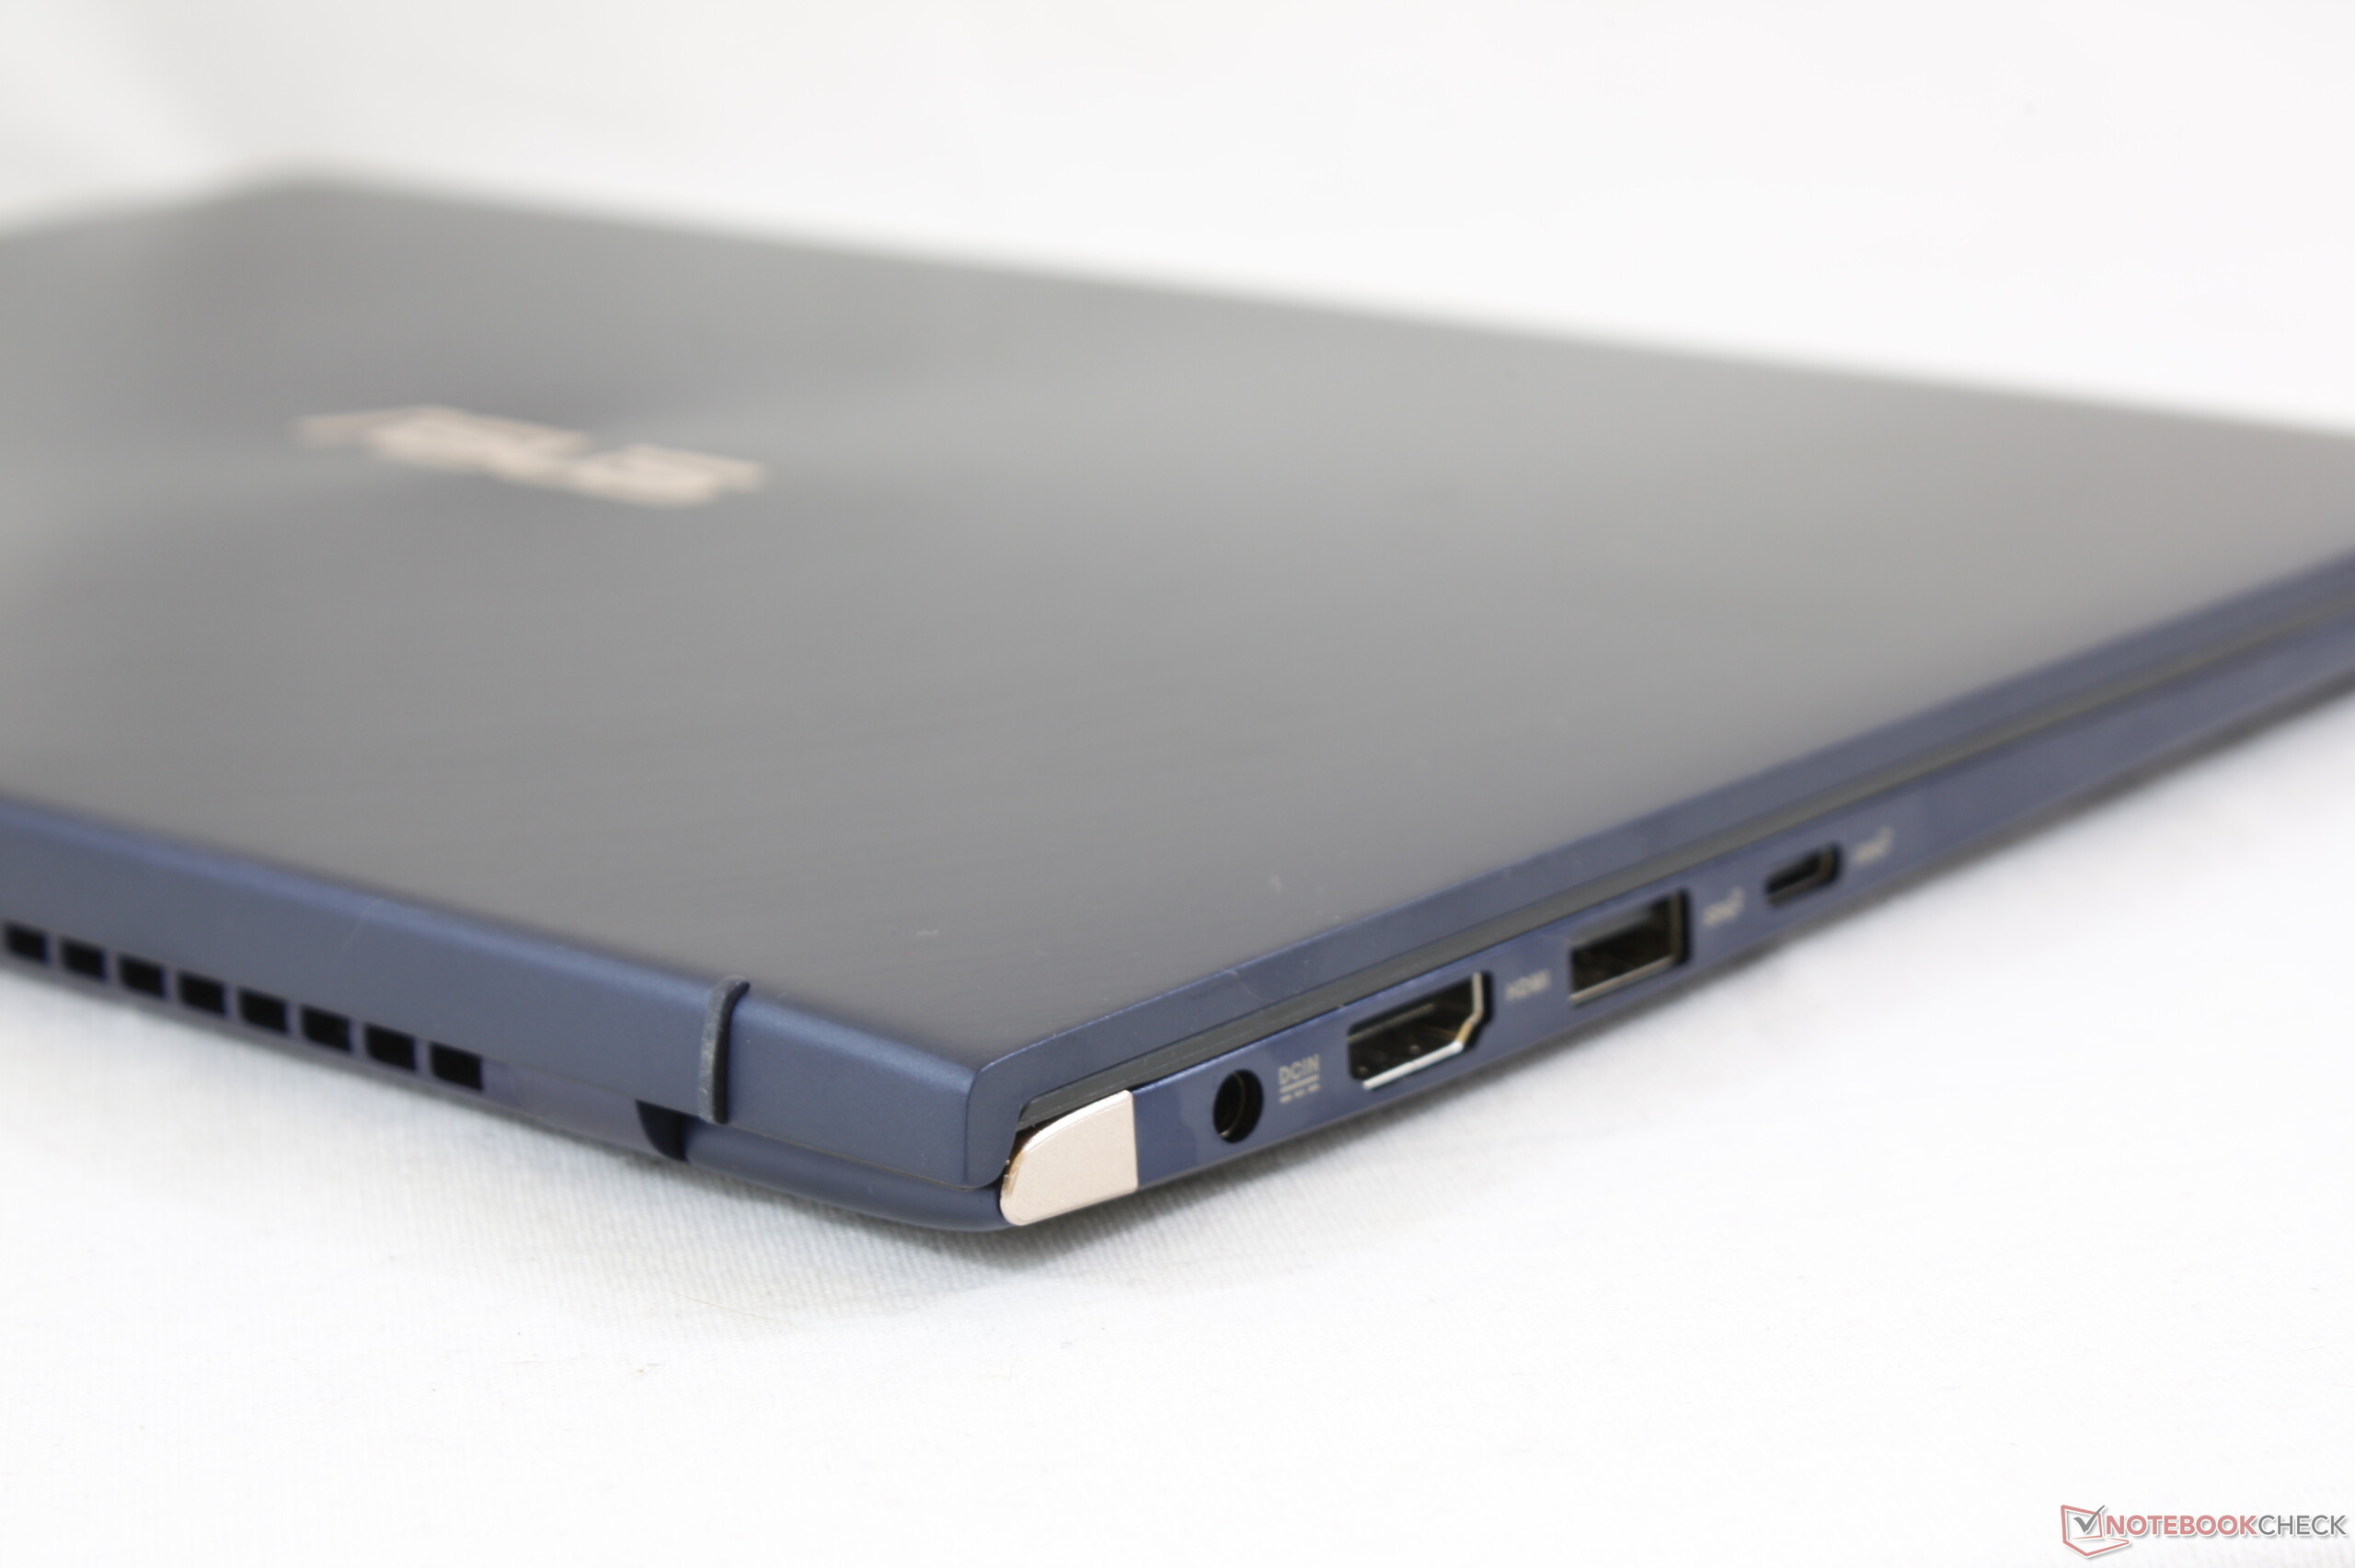
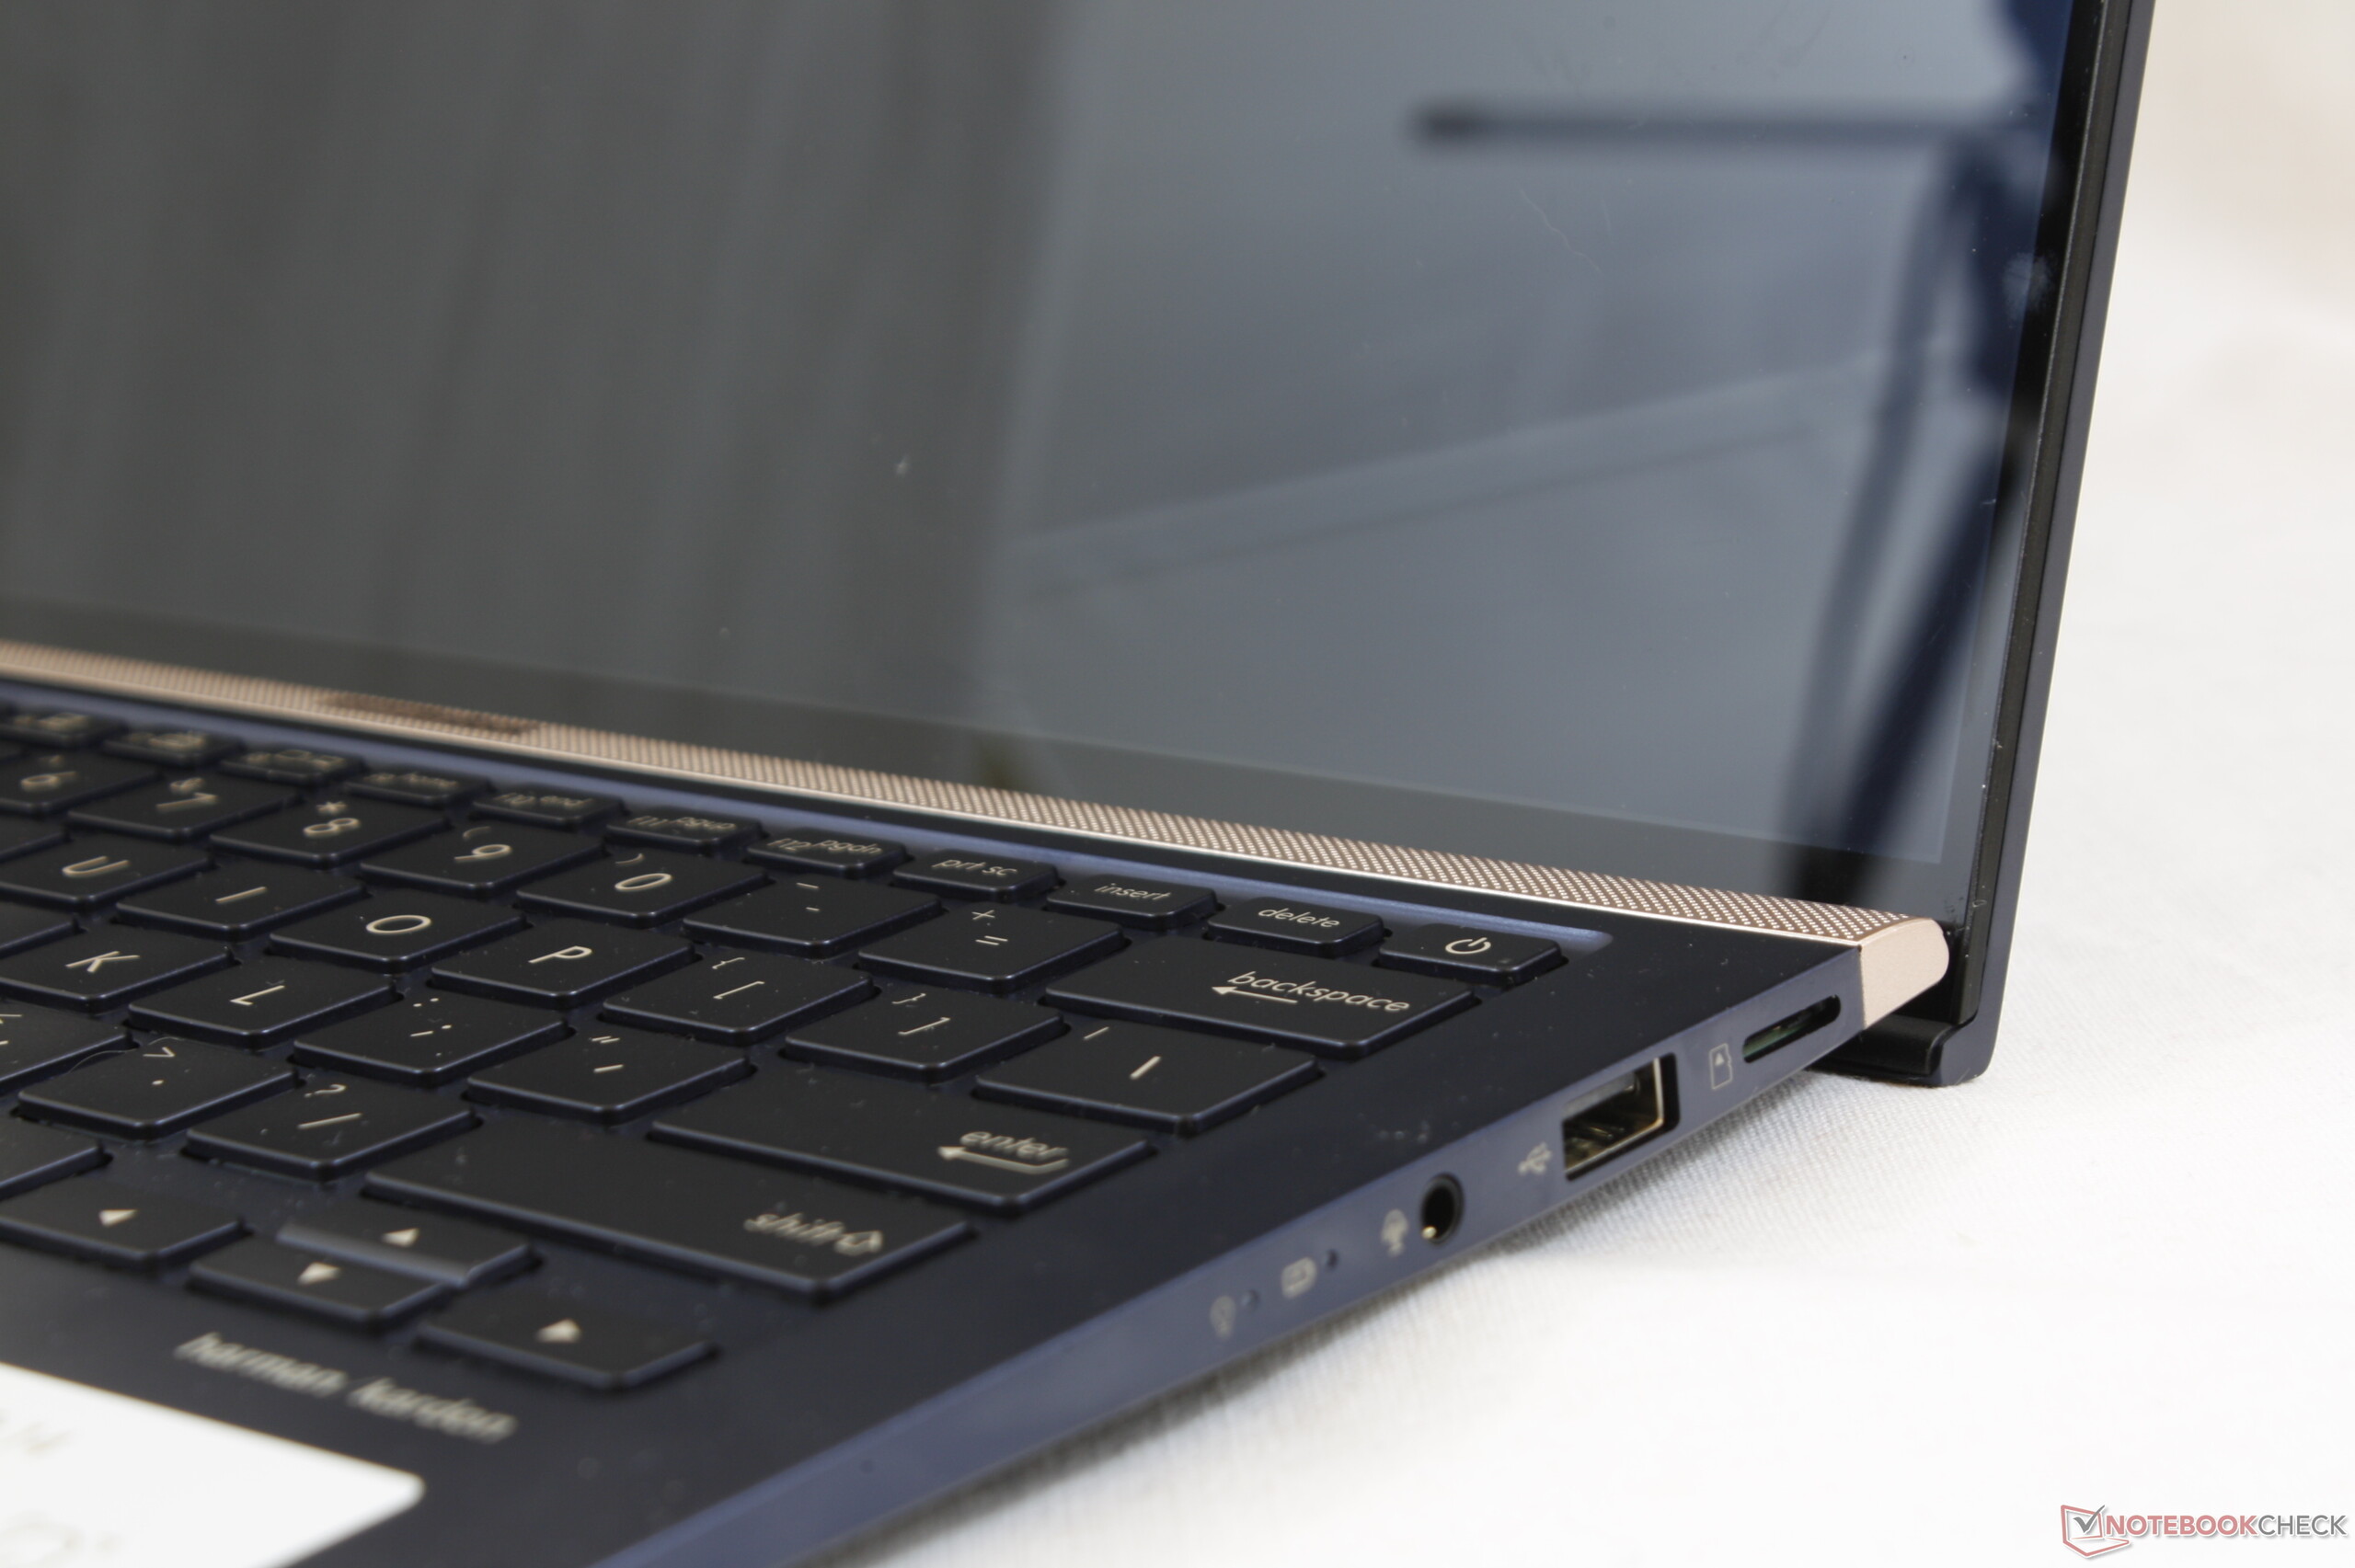
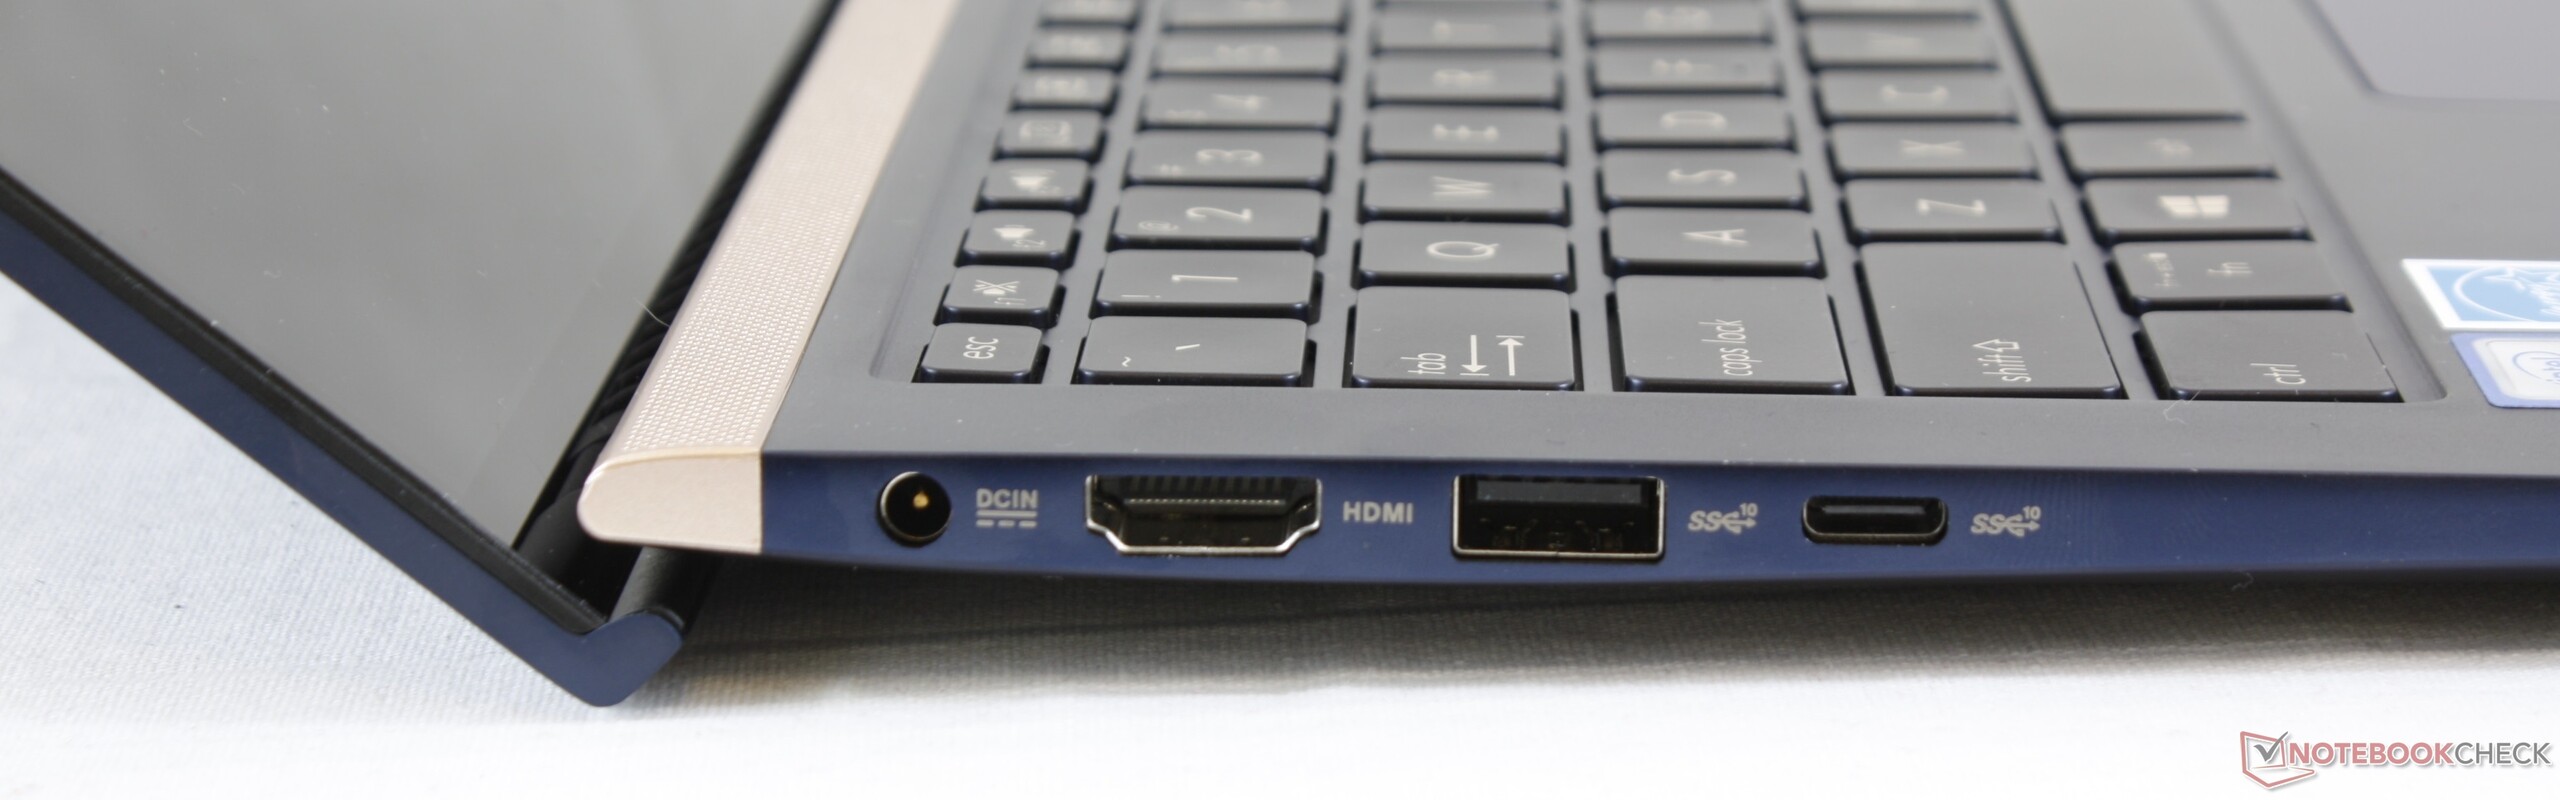
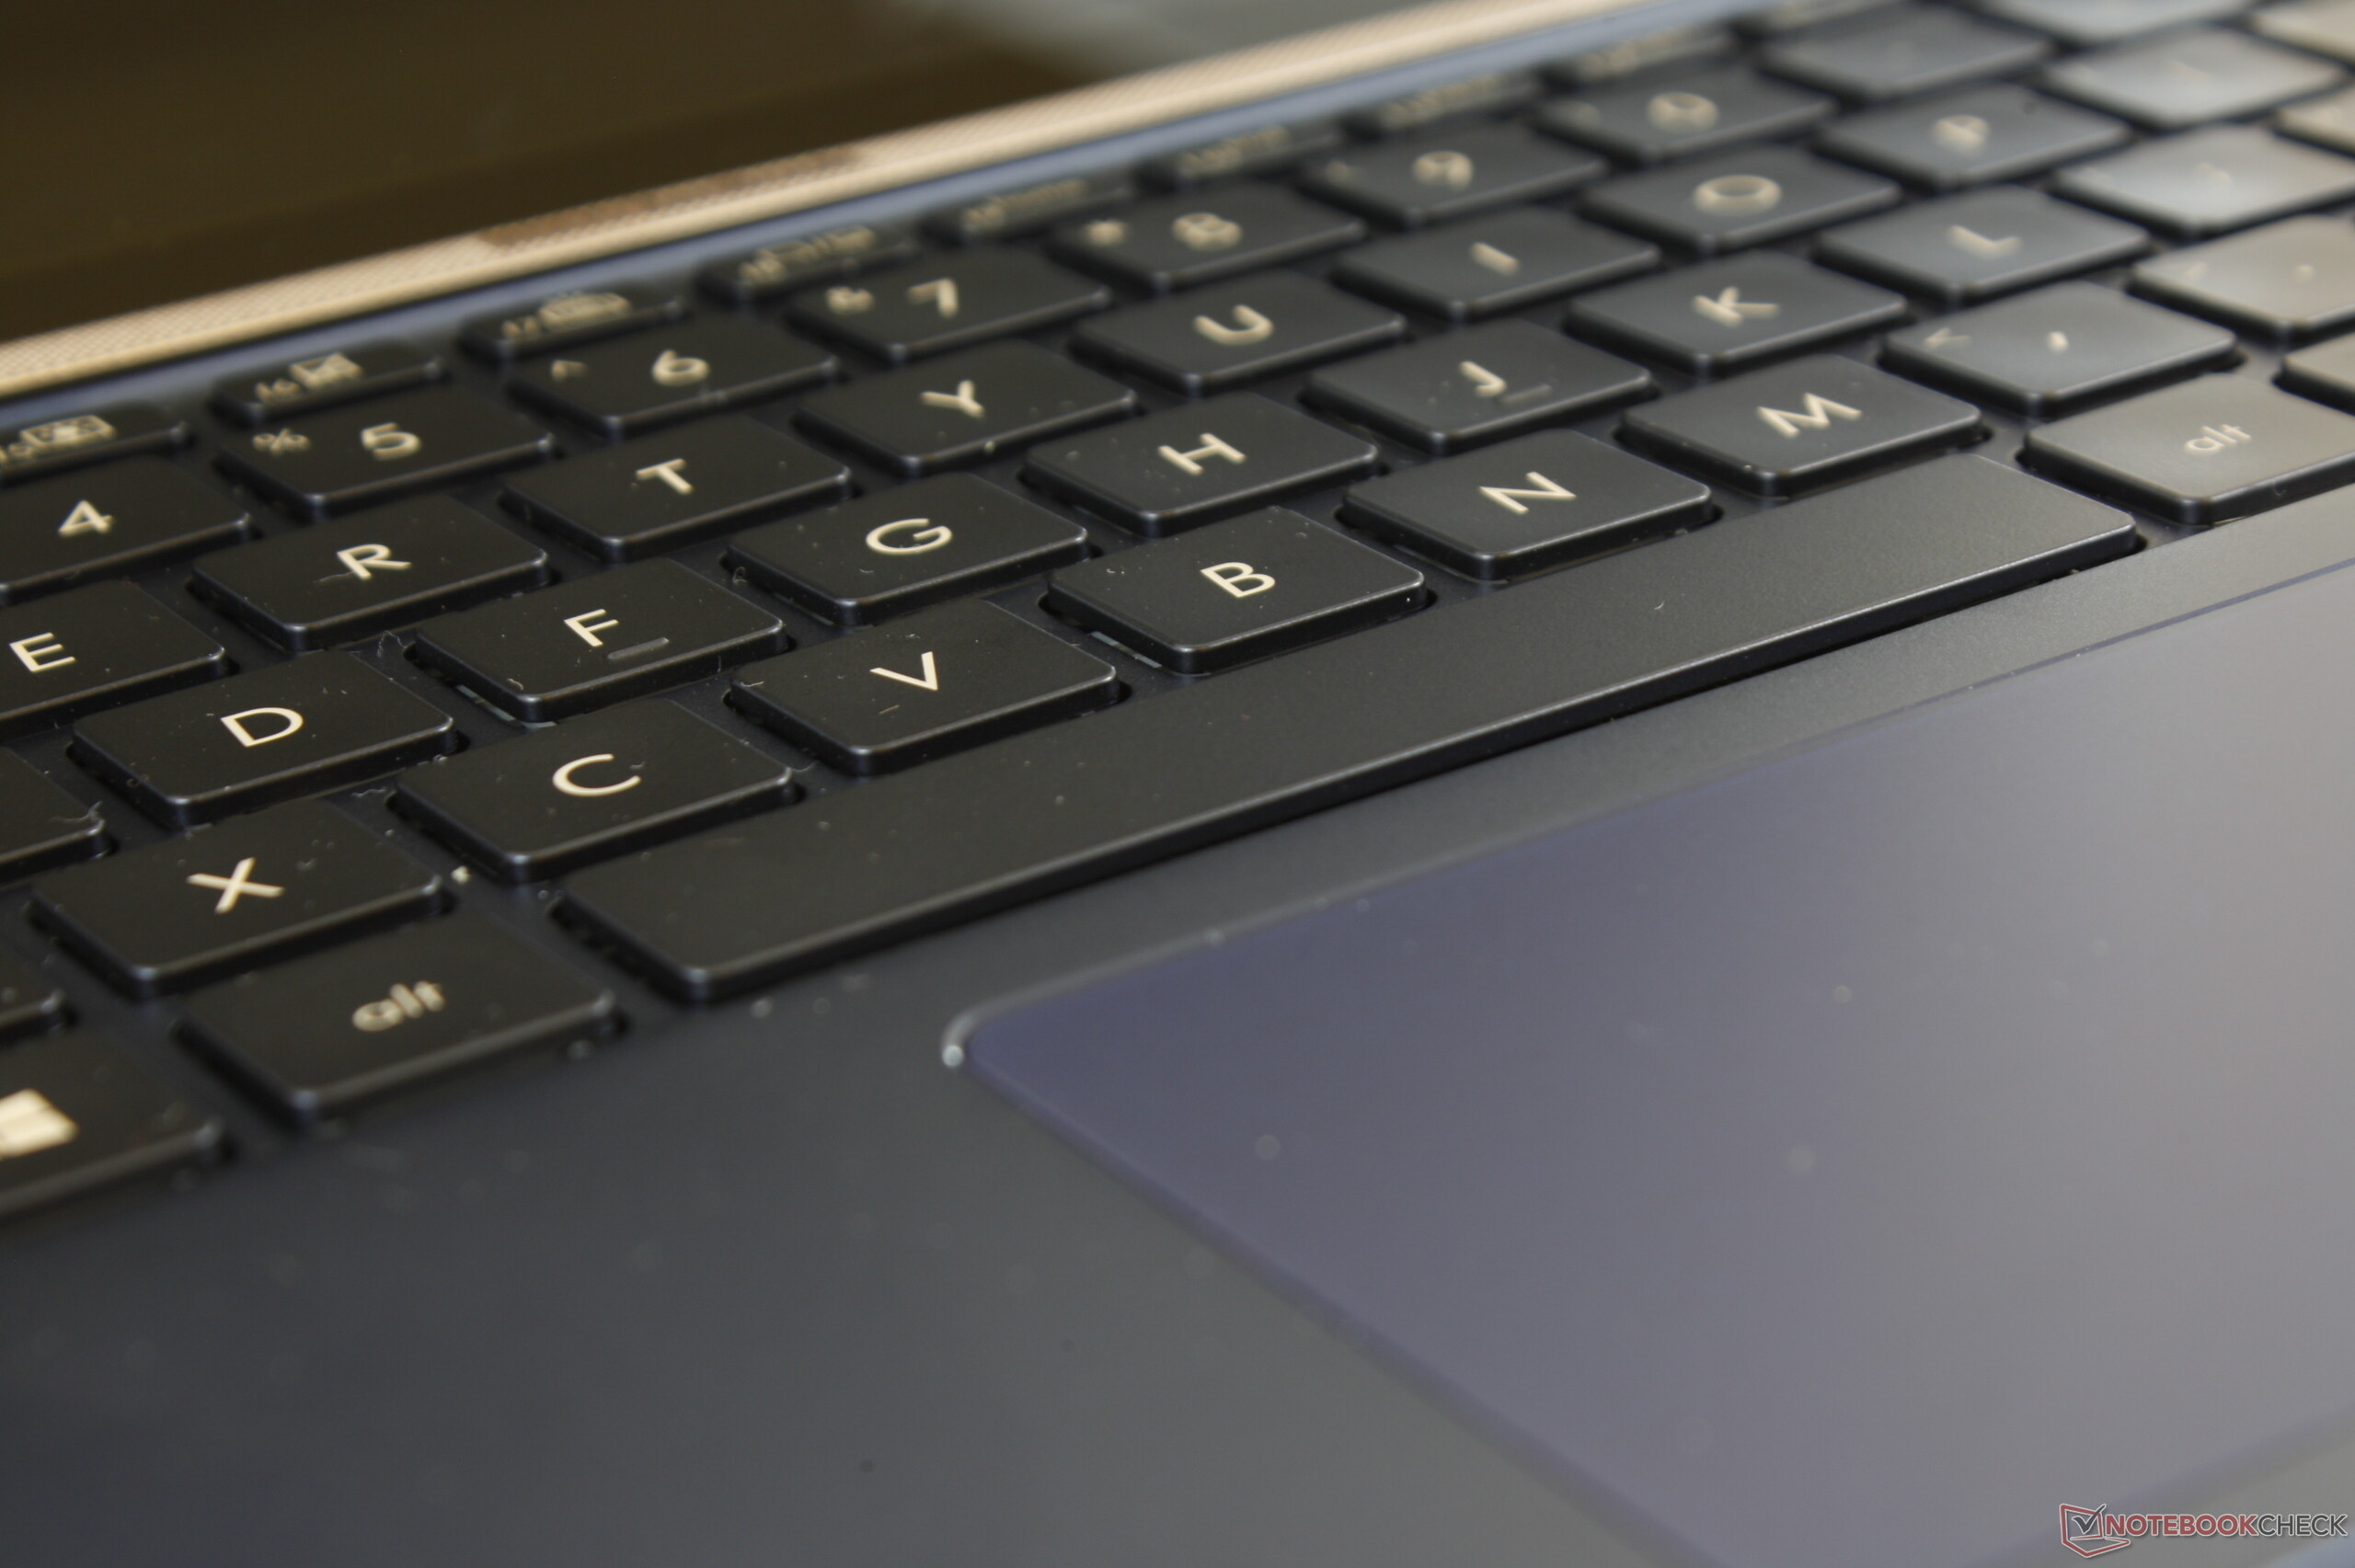
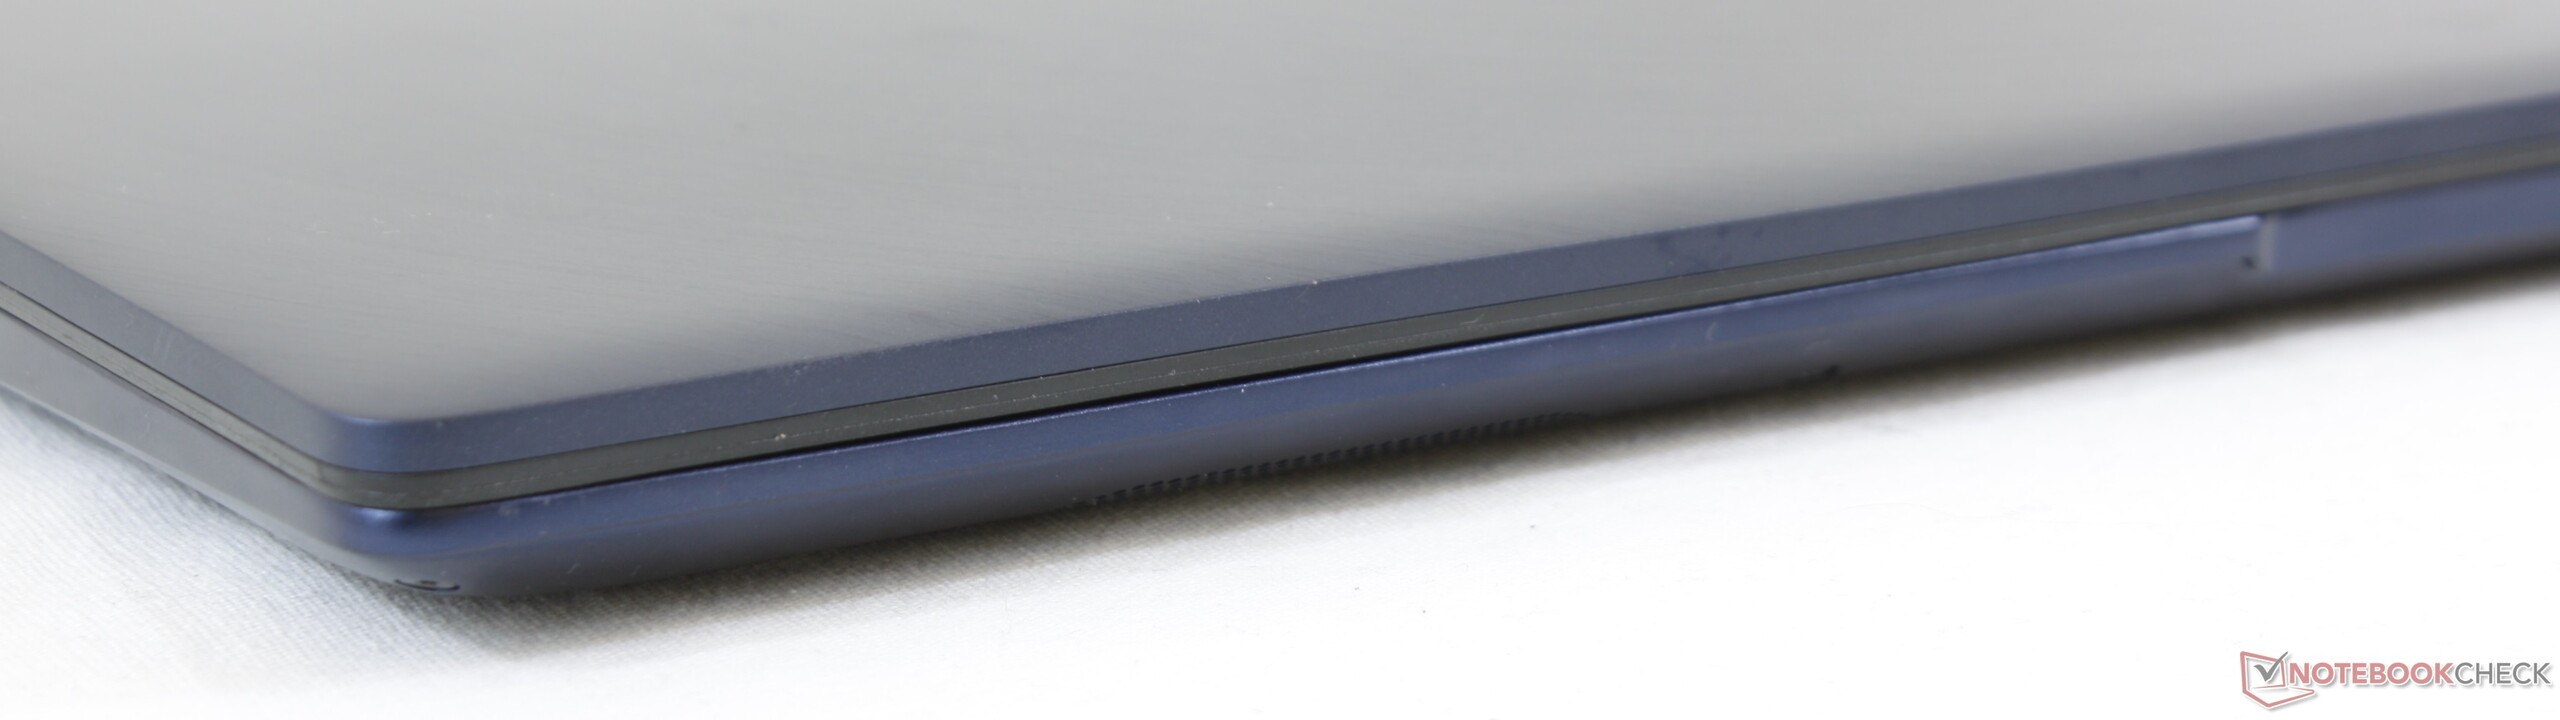
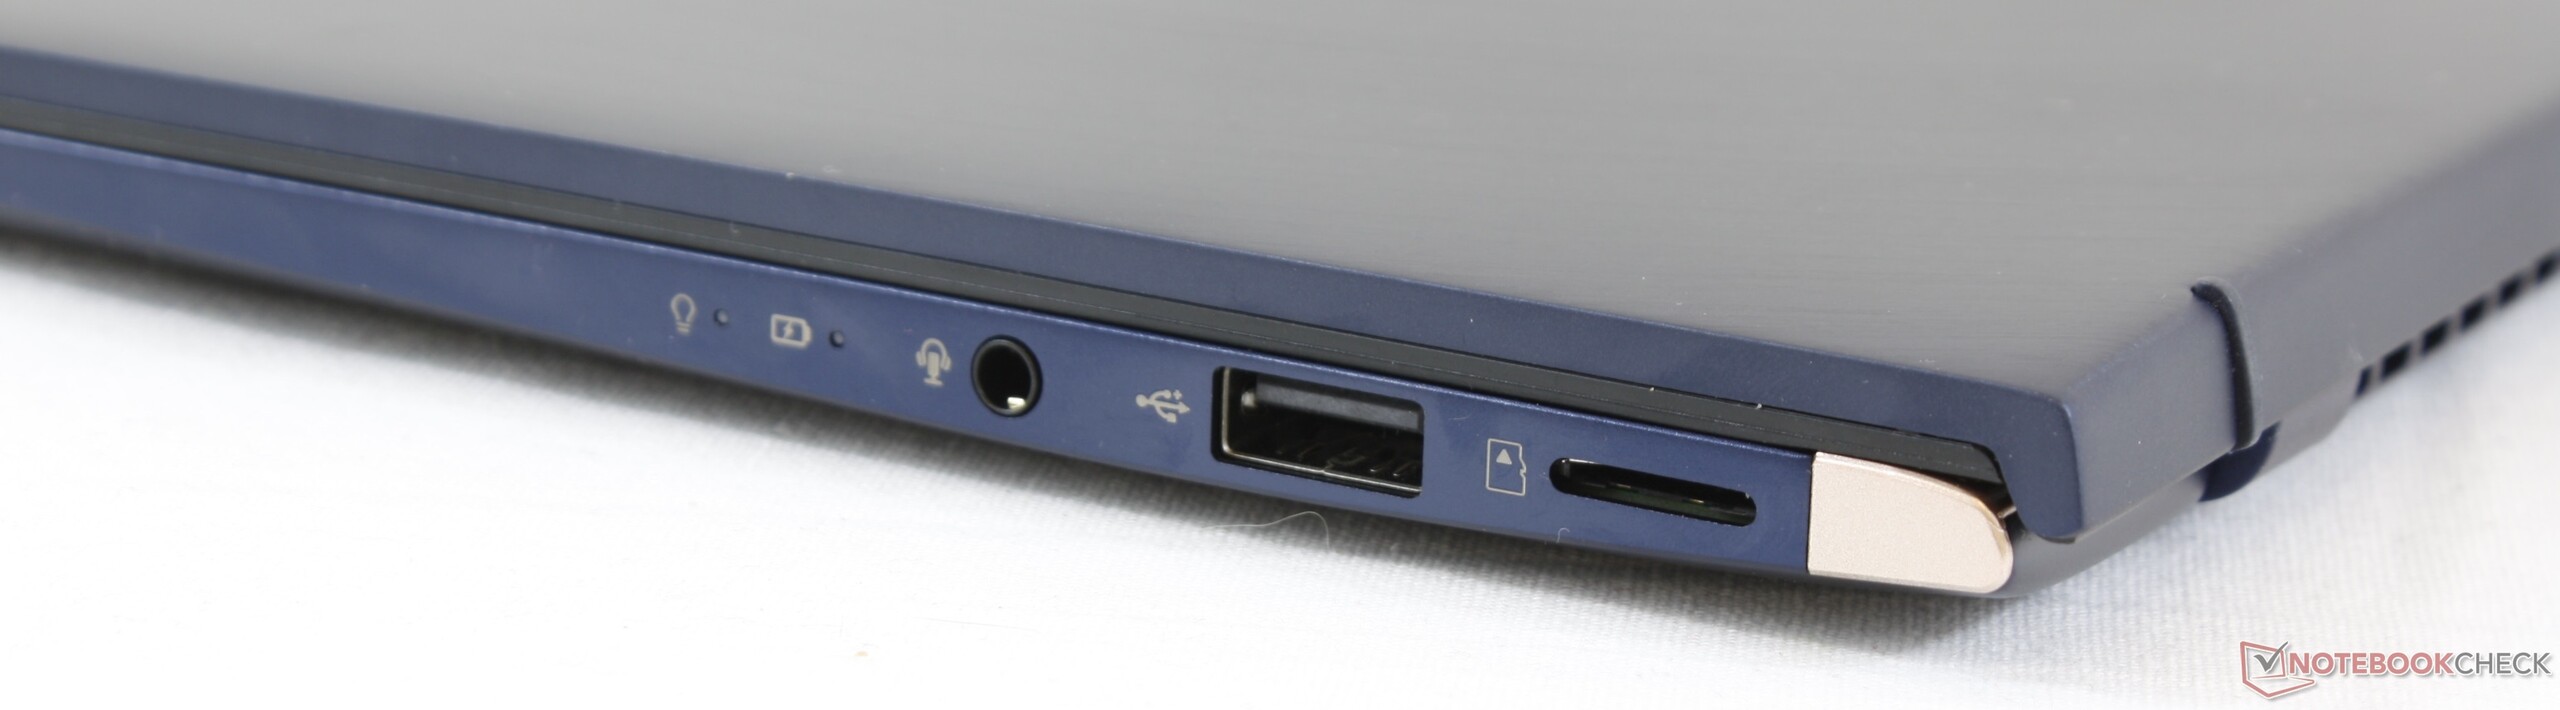
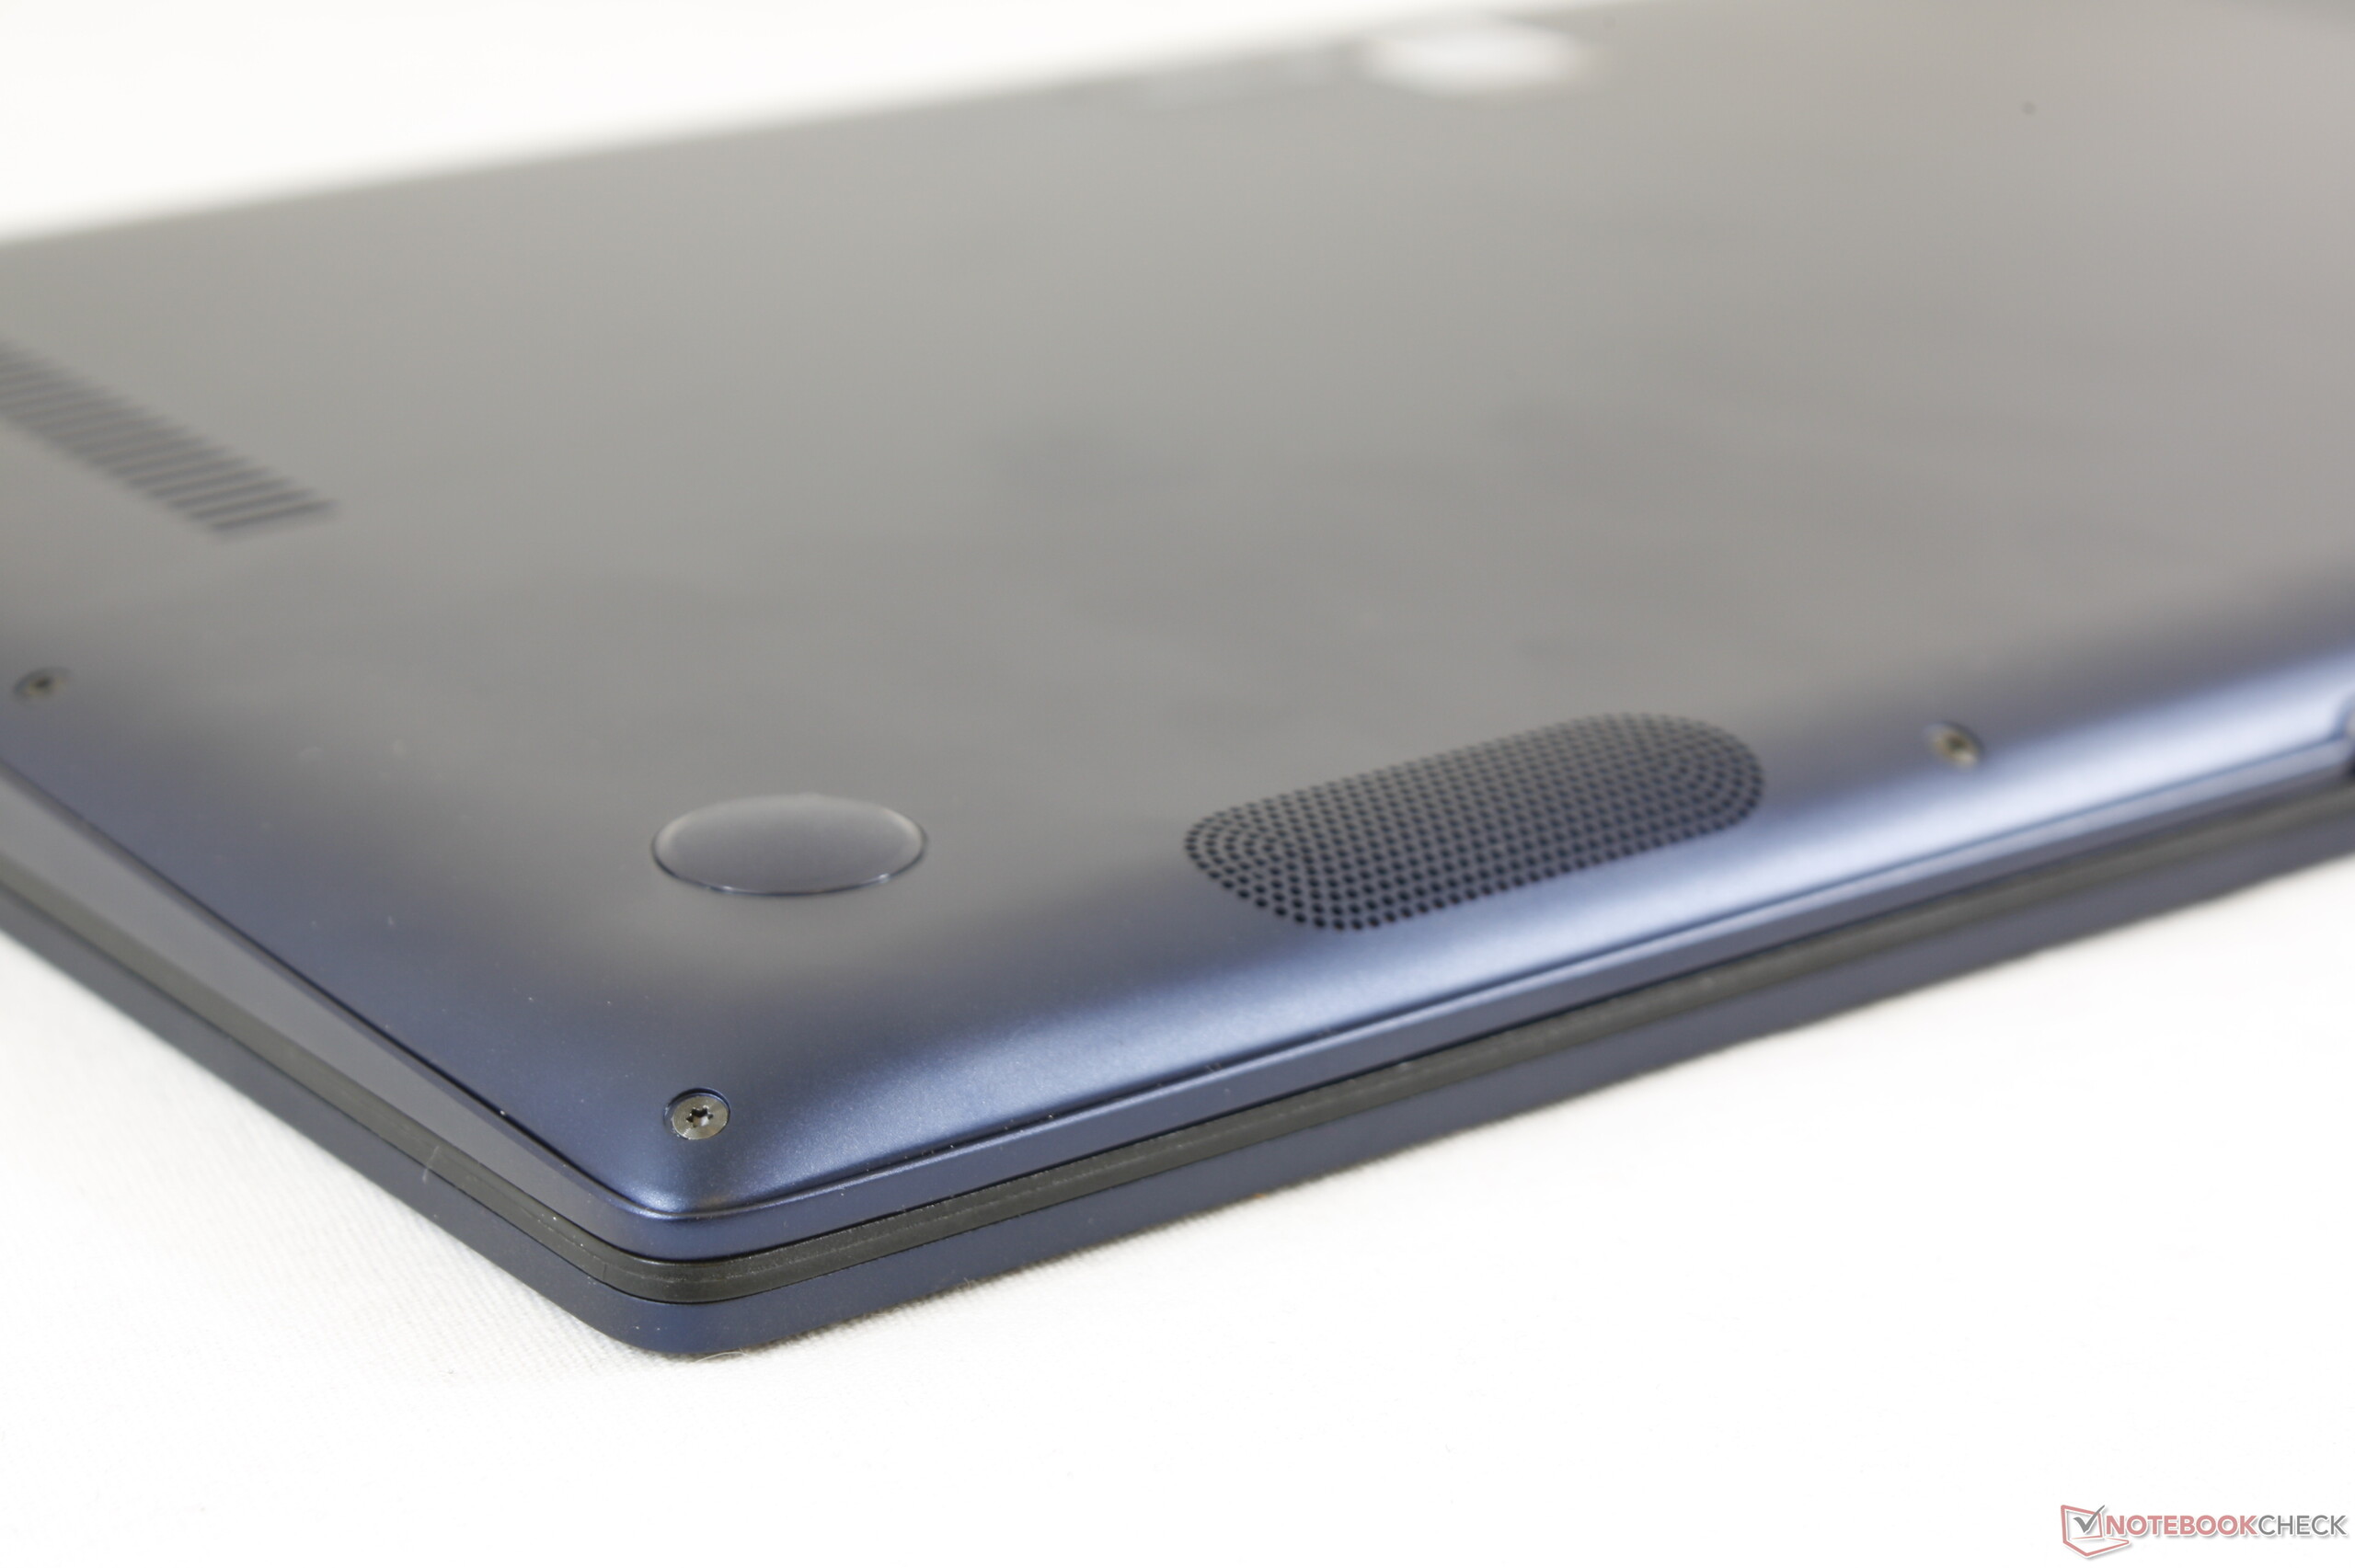
The UX433FN and its siblings are identical except for their CPUs and GPUs. Hence, we shall not cover the case, connectivity or the input devices in this review. We shall not cover the display or the speakers in depth either. Please see our ZenBook 14 UX433F review instead for our thoughts on these areas.


| SD Card Reader | |
| average JPG Copy Test (av. of 3 runs) | |
| HP Envy 13-ah0003ng (Toshiba Exceria Pro M501 microSDXC 64GB) | |
| Average of class Subnotebook (18.9 - 193.9, n=17, last 2 years) | |
| HP Pavilion 14-ce0002ng (Toshiba Exceria Pro SDXC 64 GB UHS-II) | |
| Asus Zenbook 14 UX433FA-A6018T (Toshiba Exceria Pro M501 microSDXC 64GB) | |
| Asus ZenBook 14 UX433FA (Toshiba Exceria Pro M501 microSDXC) | |
| Asus Zenbook 14 UX433FN-A6023T (Toshiba Exceria Pro M501 microSDXC 64GB) | |
| Lenovo IdeaPad 530s-14IKB (Toshiba Exceria Pro SDXC 64 GB UHS-II) | |
| Acer Swift 3 SF314-52G-89SL (Toshiba Exceria Pro SDXC 64 GB UHS-II) | |
| MSI Prestige PS42 8RB-059 (Toshiba Exceria Pro SDXC 64 GB UHS-II) | |
| maximum AS SSD Seq Read Test (1GB) | |
| HP Envy 13-ah0003ng (Toshiba Exceria Pro M501 microSDXC 64GB) | |
| Average of class Subnotebook (23.6 - 239, n=17, last 2 years) | |
| HP Pavilion 14-ce0002ng (Toshiba Exceria Pro SDXC 64 GB UHS-II) | |
| Asus ZenBook 14 UX433FA (Toshiba Exceria Pro M501 microSDXC) | |
| Asus Zenbook 14 UX433FN-A6023T (Toshiba Exceria Pro M501 microSDXC 64GB) | |
| Lenovo IdeaPad 530s-14IKB (Toshiba Exceria Pro SDXC 64 GB UHS-II) | |
| Asus Zenbook 14 UX433FA-A6018T (Toshiba Exceria Pro M501 microSDXC 64GB) | |
| MSI Prestige PS42 8RB-059 (Toshiba Exceria Pro SDXC 64 GB UHS-II) | |
| Acer Swift 3 SF314-52G-89SL (Toshiba Exceria Pro SDXC 64 GB UHS-II) | |
Display
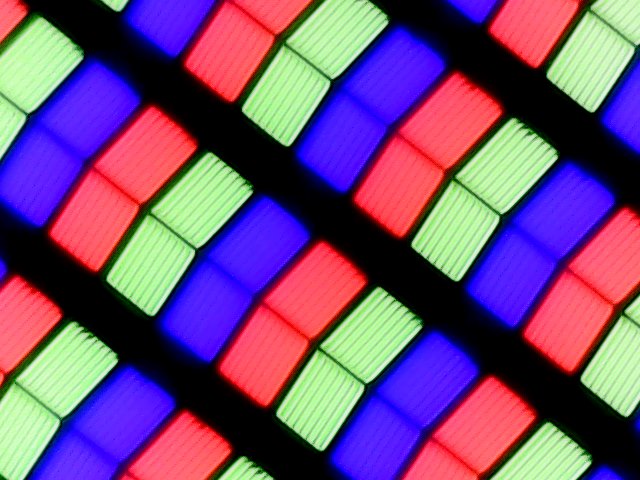
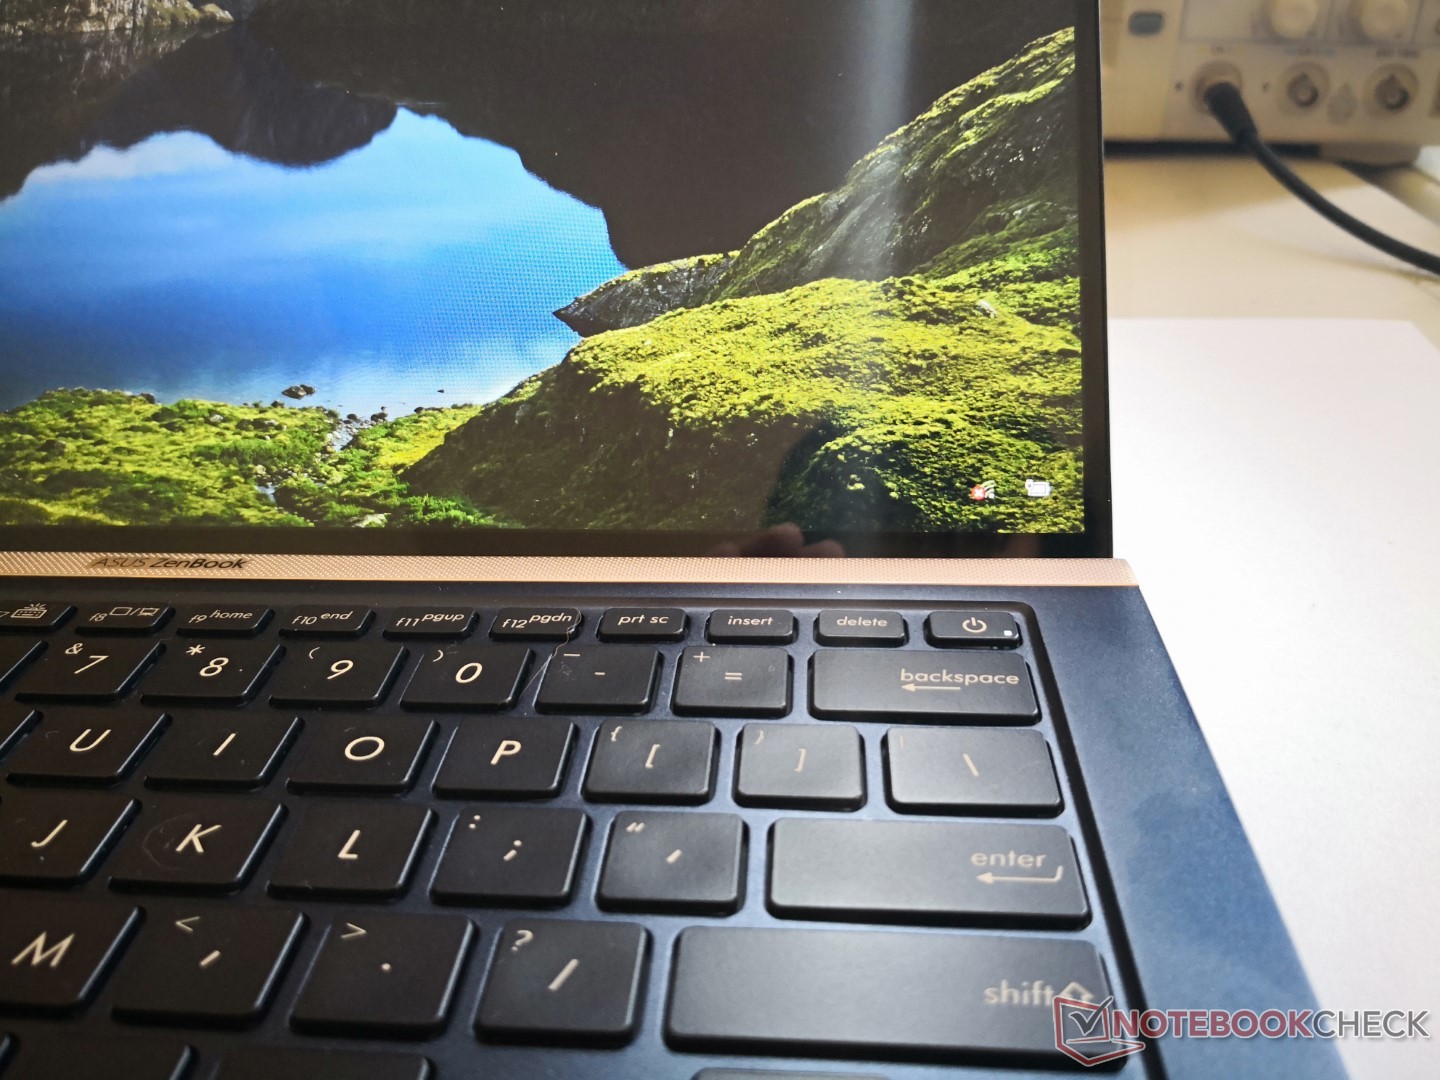
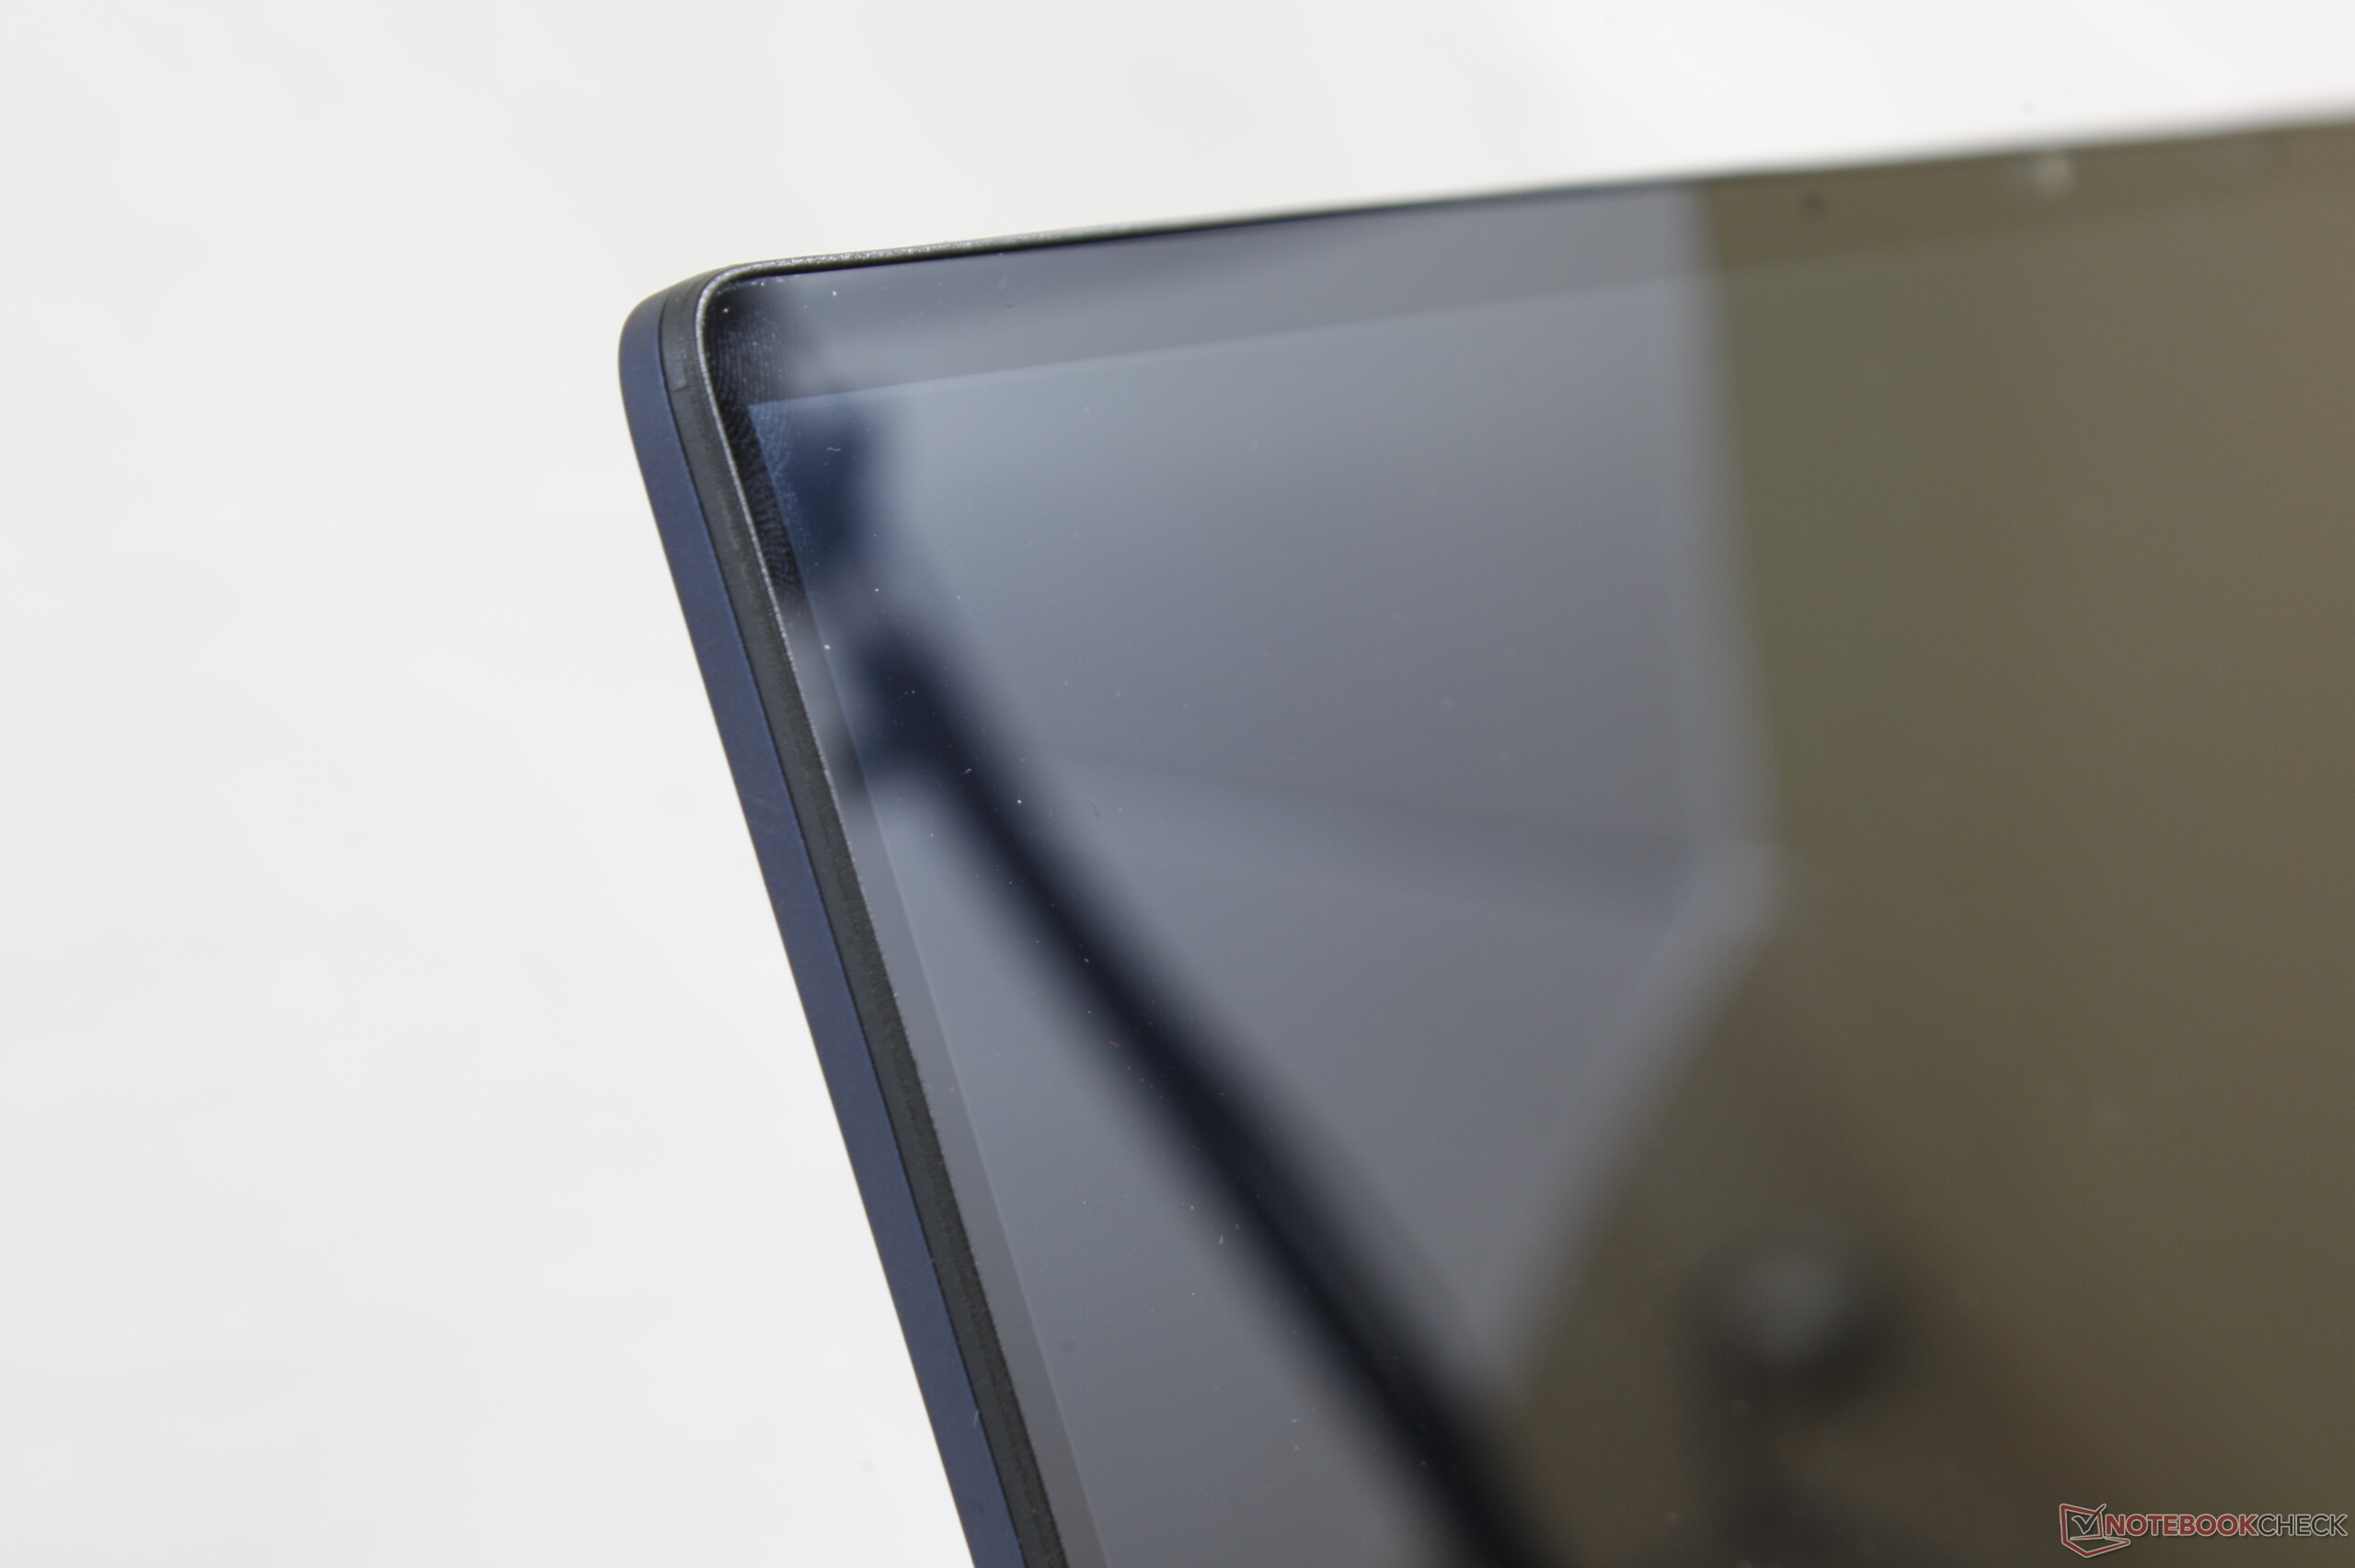
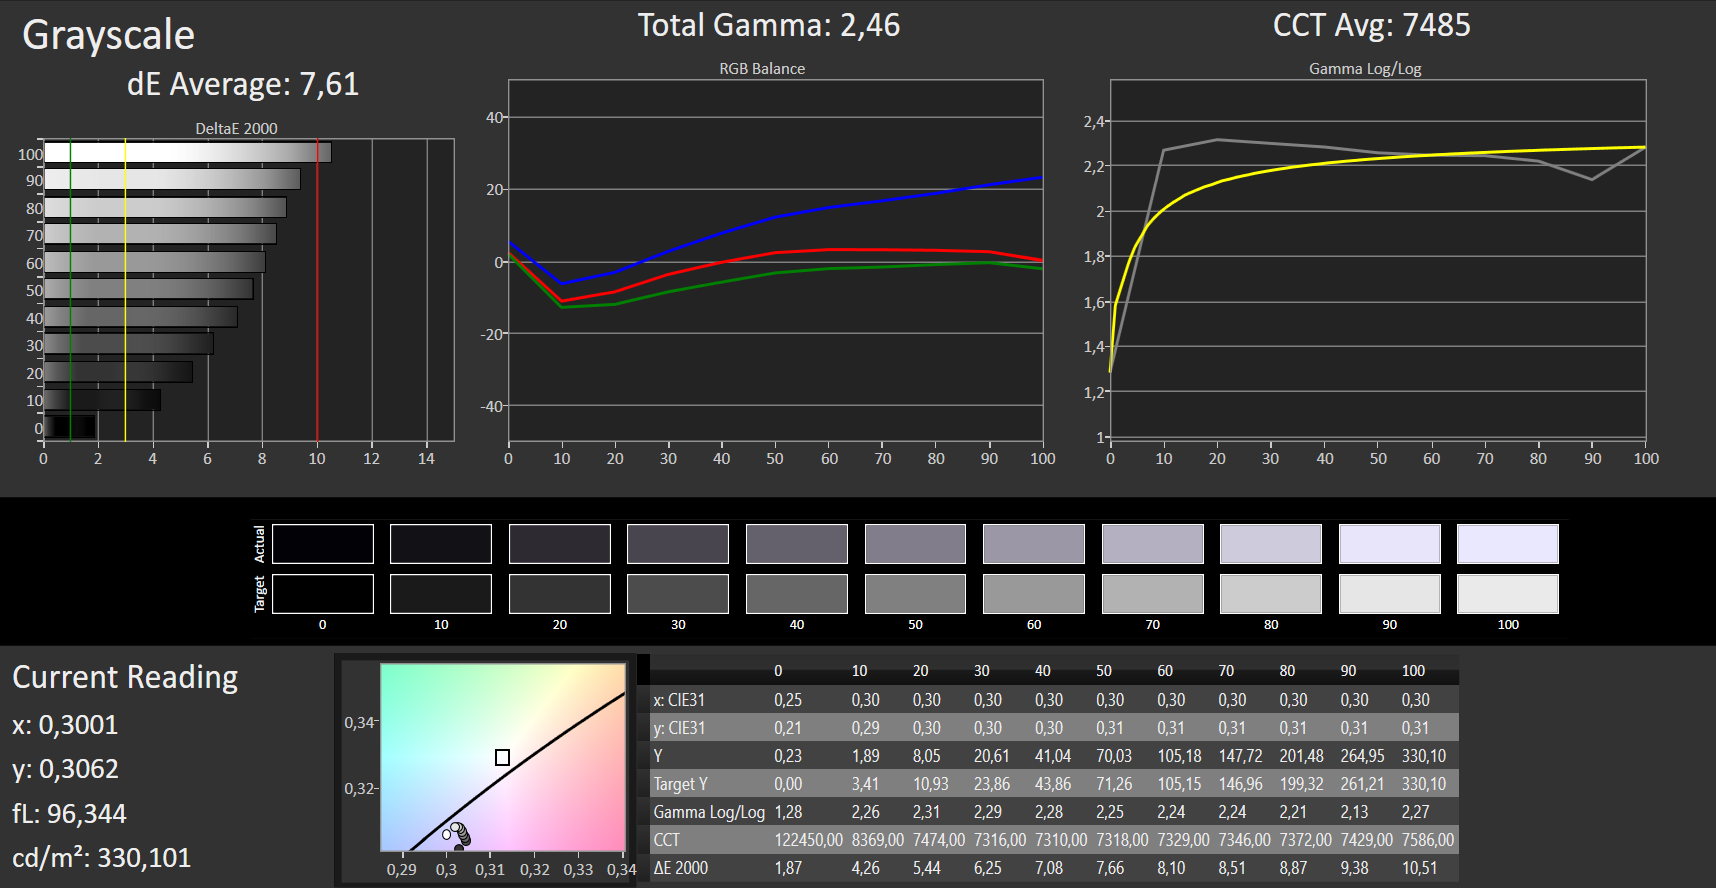
The UX433FN has a glossy 14-inch IPS display that runs natively at 1,920 x 1,080 like its siblings. Our review achieved an average maximum brightness of 285.1 cd/m², which is on par with its siblings. The UX433F has a slightly brighter display than the UX433FN, but that does not necessarily mean that ASUS has equipped the devices with different panels. Every panel is unique, and there are variances even in the same batch, so it is unsurprising that the three UX433 we have tested have slightly different display characteristics.
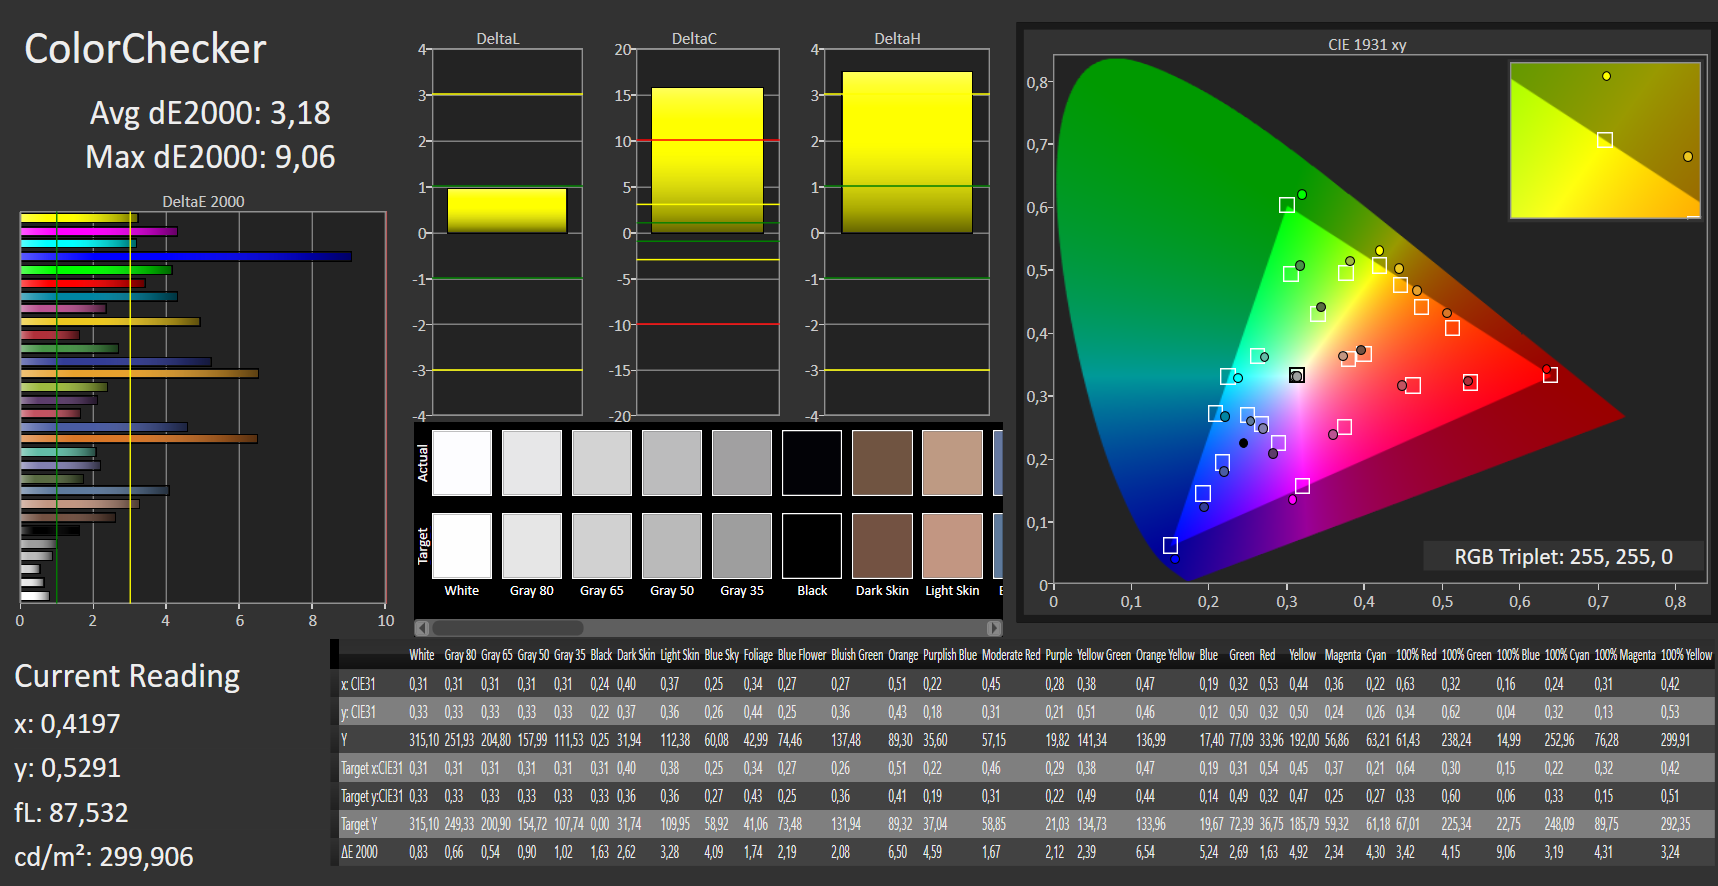
Our review unit also achieved a 1,435:1 contrast ratio and a 0.23 cd/m² black value, which are as good as the values that our comparison devices also produced in the same tests. In short, colors should look vibrant, and blacks will look rich, but we would prefer ASUS to have equipped its UX433 series with a brighter panel that consistently exceeds 300 cd/m² in our tests.
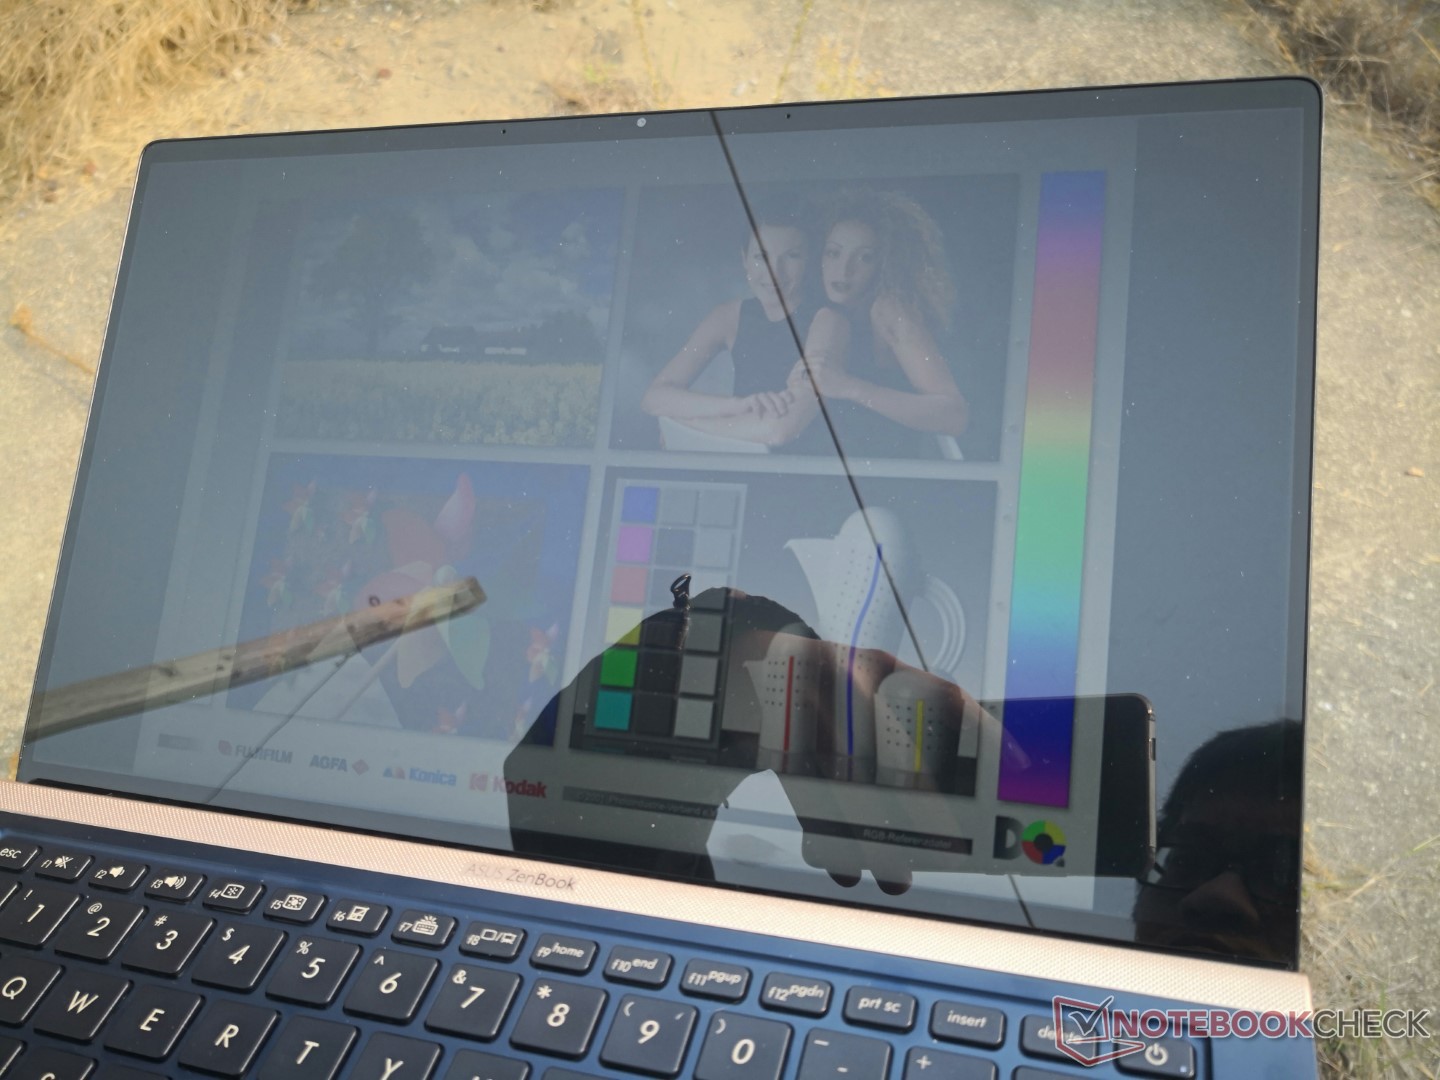
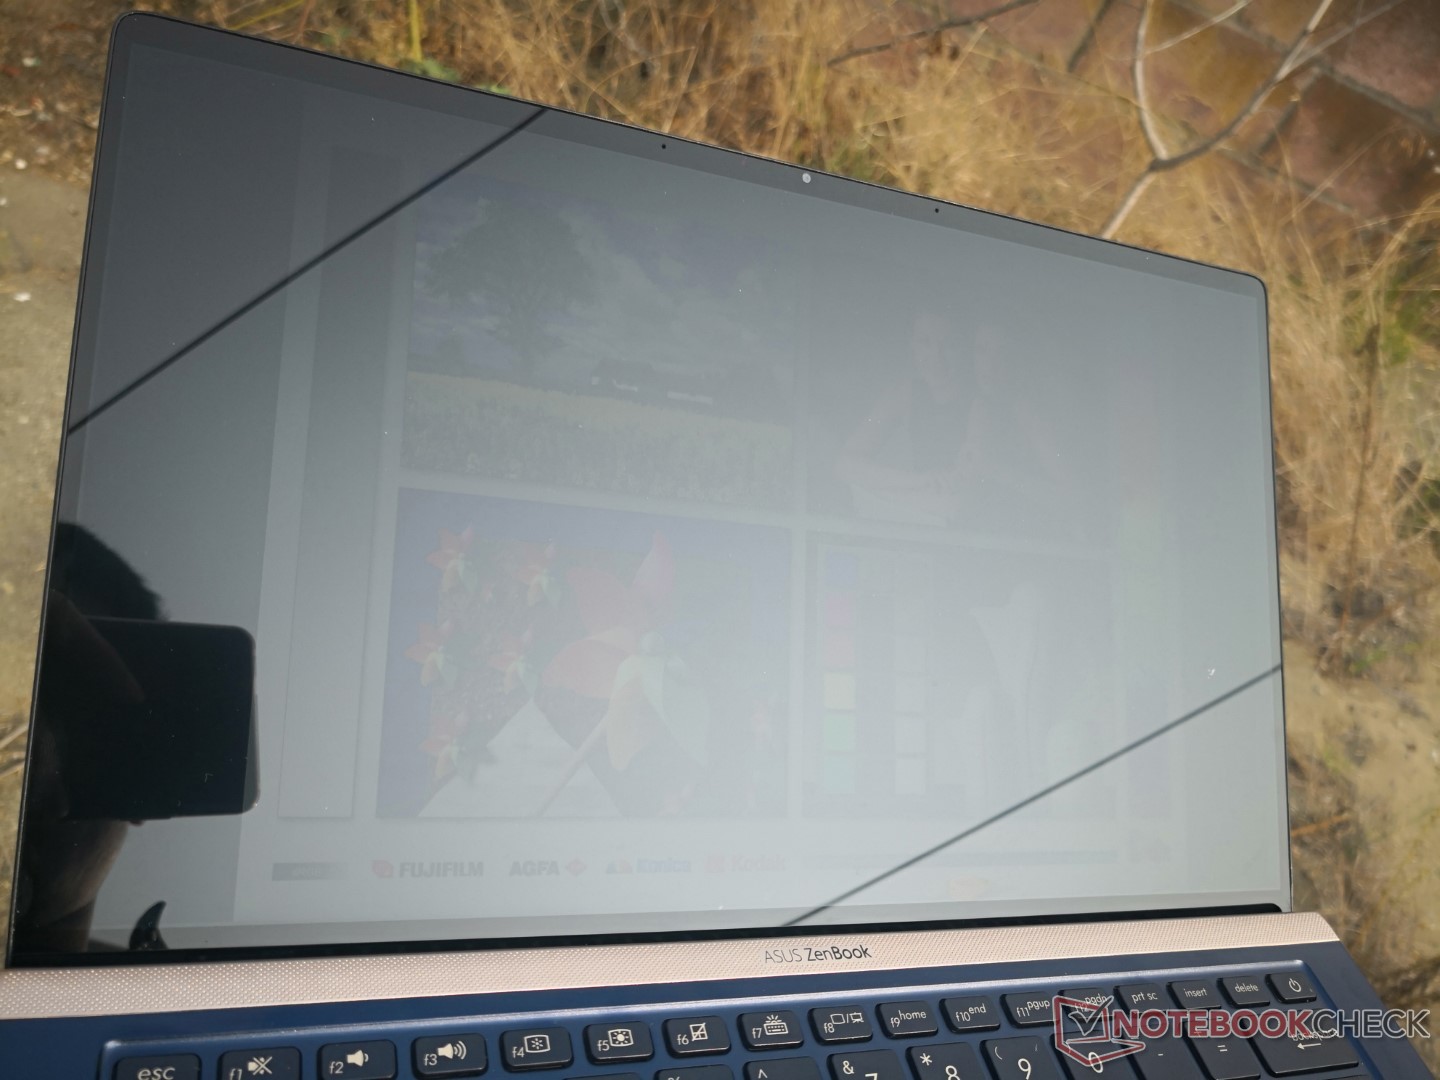
The UX433FN also has stable viewing angles thanks to its IPS panel. We noticed no brightness, color or image distortions even at acute viewing angles. Likewise, you should have no issues with using the device outside too, although it may be overwhelmed by reflections in bright sunshine. Hence, we would recommend finding some shade where possible if you must use the UX433FN or its sibling outside on a sunny day.
| |||||||||||||||||||||||||
Brightness Distribution: 78 %
Center on Battery: 331 cd/m²
Contrast: 1435:1 (Black: 0.23 cd/m²)
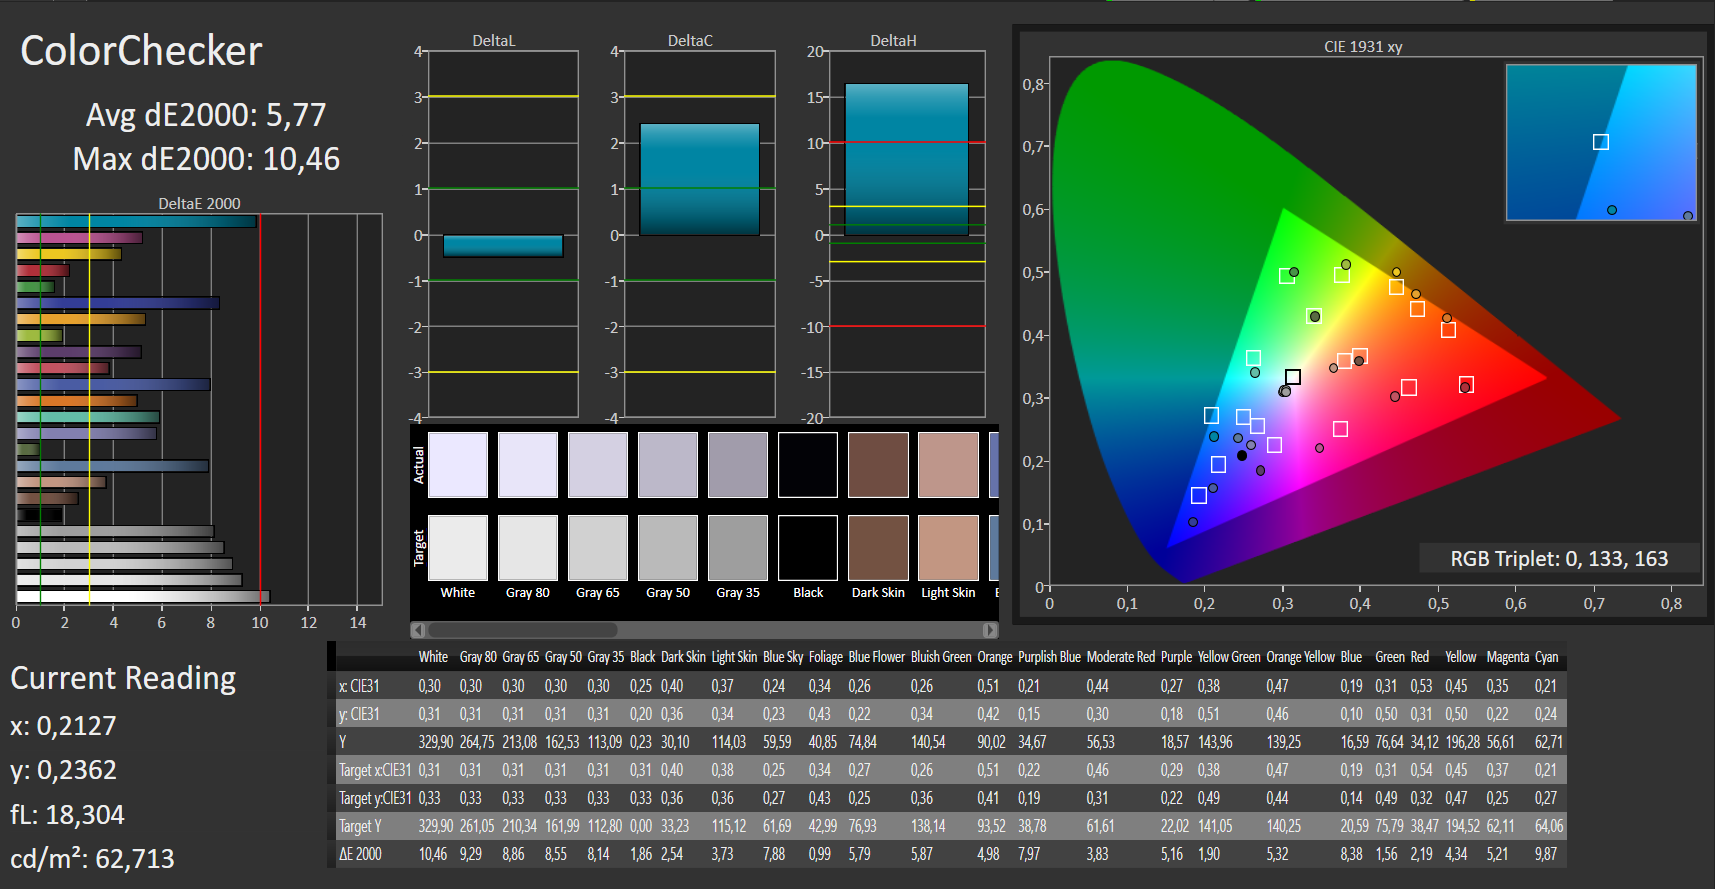
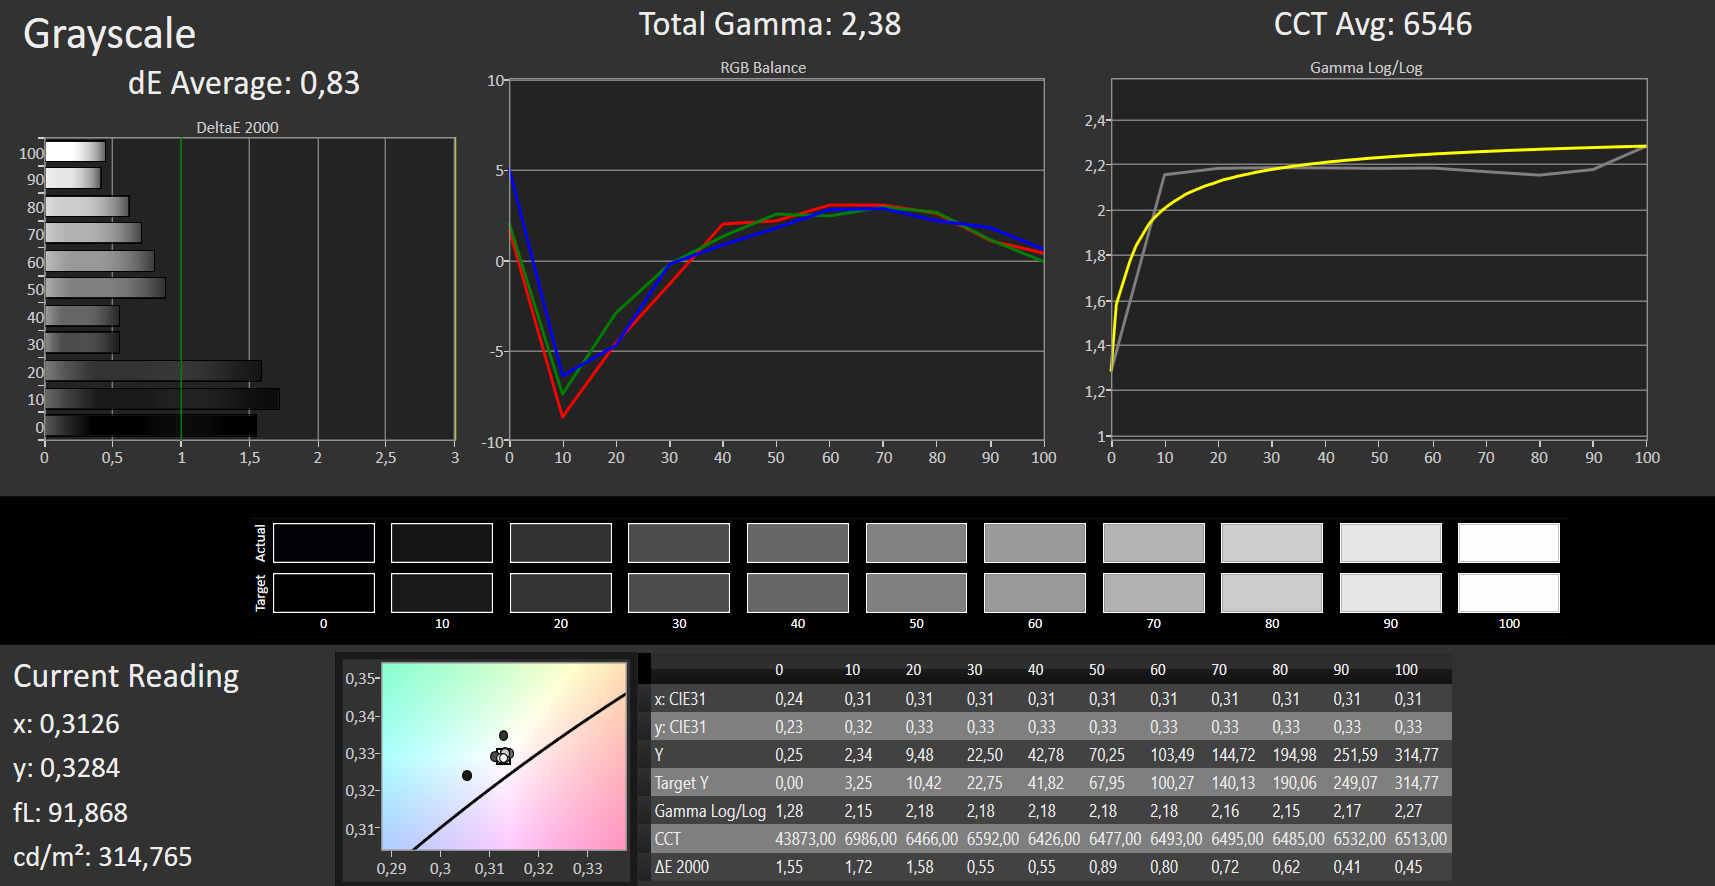
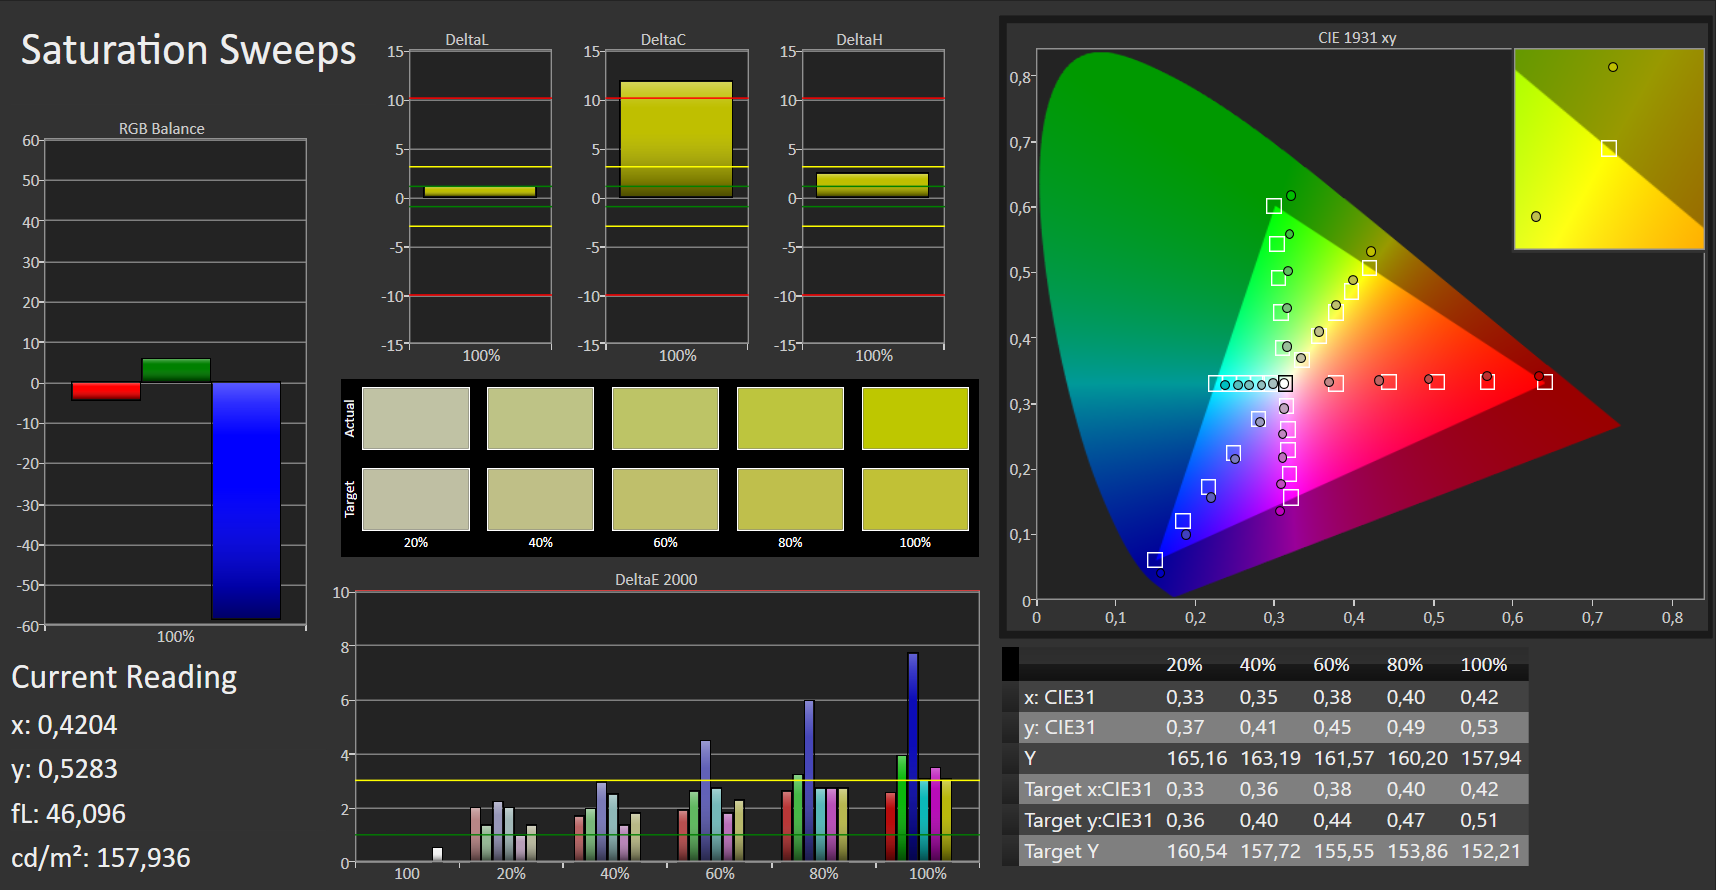
ΔE Color 5.77 | 0.5-29.43 Ø5, calibrated: 3.18
ΔE Greyscale 7.61 | 0.57-98 Ø5.3
88% sRGB (Argyll 1.6.3 3D)
57% AdobeRGB 1998 (Argyll 1.6.3 3D)
64.4% AdobeRGB 1998 (Argyll 2.2.0 3D)
87.9% sRGB (Argyll 2.2.0 3D)
64.5% Display P3 (Argyll 2.2.0 3D)
Gamma: 2.46
| Asus Zenbook 14 UX433FN-A6023T IPS, 1920x1080, 14.00 | Asus Zenbook 14 UX433FA-A6018T IPS, 1920x1080, 14.00 | Asus ZenBook 14 UX433FA IPS, 1920x1080, 14.00 | Honor Magicbook IPS LED, 1920x1080, 14.00 | Lenovo IdeaPad 530s-14IKB IPS, 2560x1440, 14.00 | Acer Swift 3 SF314-52G-89SL IPS, 1920x1080, 14.00 | Huawei MateBook 13 i7 IPS, 2160x1440, 13.00 | HP Envy 13-ah0003ng IPS, 1920x1080, 13.30 | Lenovo Ideapad 720S-13ARR IPS, 1920x1080, 13.30 | MSI Prestige PS42 8RB-059 IPS, 1920x1080, 14.00 | HP Pavilion 14-ce0002ng IPS, 1920x1080, 14.00 | |
|---|---|---|---|---|---|---|---|---|---|---|---|
| Display | 0% | 1% | -31% | 5% | -41% | 8% | -11% | -3% | 8% | -36% | |
| Display P3 Coverage | 64.5 | 63.5 -2% | 64.3 0% | 43.09 -33% | 65.5 2% | 36.09 -44% | 68.1 6% | 54.8 -15% | 65.2 1% | 67.5 5% | 39.64 -39% |
| sRGB Coverage | 87.9 | 90.9 3% | 89.7 2% | 63.1 -28% | 96.2 9% | 54.2 -38% | 97.7 11% | 82.5 -6% | 83.3 -5% | 98.6 12% | 59.3 -33% |
| AdobeRGB 1998 Coverage | 64.4 | 64.6 0% | 65.1 1% | 44.52 -31% | 66.1 3% | 37.28 -42% | 69.2 7% | 56.6 -12% | 60.9 -5% | 69.6 8% | 40.96 -36% |
| Response Times | 8% | 17% | -4% | -17% | 13% | -1% | 27% | 17% | 21% | 5% | |
| Response Time Grey 50% / Grey 80% * | 44 ? | 42 ? 5% | 39.6 ? 10% | 44.4 ? -1% | 58.4 ? -33% | 41 ? 7% | 43.2 ? 2% | 31 ? 30% | 36 ? 18% | 34.4 ? 22% | 40 ? 9% |
| Response Time Black / White * | 31 ? | 28 ? 10% | 24 ? 23% | 32.8 ? -6% | 31.2 ? -1% | 25 ? 19% | 32 ? -3% | 24 ? 23% | 26 ? 16% | 24.8 ? 20% | 31 ? -0% |
| PWM Frequency | 200 ? | 1000 ? | 128000 ? | 25000 ? | 200 ? | ||||||
| Screen | 3% | -5% | -11% | 6% | -15% | 15% | 24% | 5% | 22% | -12% | |
| Brightness middle | 330 | 321 -3% | 332.8 1% | 287 -13% | 311 -6% | 233 -29% | 366.6 11% | 289 -12% | 299 -9% | 285.4 -14% | 239 -28% |
| Brightness | 285 | 282 -1% | 310 9% | 273 -4% | 293 3% | 217 -24% | 360 26% | 310 9% | 306 7% | 269 -6% | 223 -22% |
| Brightness Distribution | 78 | 77 -1% | 87 12% | 86 10% | 85 9% | 88 13% | 93 19% | 85 9% | 90 15% | 86 10% | 88 13% |
| Black Level * | 0.23 | 0.2 13% | 0.29 -26% | 0.21 9% | 0.2 13% | 0.27 -17% | 0.39 -70% | 0.23 -0% | 0.27 -17% | 0.31 -35% | 0.27 -17% |
| Contrast | 1435 | 1605 12% | 1148 -20% | 1367 -5% | 1555 8% | 863 -40% | 940 -34% | 1257 -12% | 1107 -23% | 921 -36% | 885 -38% |
| Colorchecker dE 2000 * | 5.77 | 6.35 -10% | 5.14 11% | 5 13% | 6 -4% | 5.85 -1% | 2.76 52% | 1.64 72% | 4.46 23% | 1 83% | 5.3 8% |
| Colorchecker dE 2000 max. * | 10.46 | 12.2 -17% | 11.88 -14% | 20.1 -92% | 11.6 -11% | 11.51 -10% | 6.19 41% | 3.31 68% | 10.51 -0% | 3.65 65% | 10.03 4% |
| Colorchecker dE 2000 calibrated * | 3.18 | 1.88 41% | 3.61 -14% | 4.5 -42% | 1.6 50% | 1.53 52% | 0.99 69% | 0.98 69% | 3.64 -14% | ||
| Greyscale dE 2000 * | 7.61 | 8.35 -10% | 8.8 -16% | 2.7 65% | 8.7 -14% | 4.87 36% | 4.2 45% | 1.71 78% | 2.41 68% | 1.4 82% | 5.85 23% |
| Gamma | 2.46 89% | 2.51 88% | 2.33 94% | 2.18 101% | 2.19 100% | 2.47 89% | 2.22 99% | 2.32 95% | 2.29 96% | 2.25 98% | 2.45 90% |
| CCT | 7485 87% | 8227 79% | 8227 79% | 6653 98% | 8426 77% | 6908 94% | 6271 104% | 6291 103% | 6757 96% | 6699 97% | 7169 91% |
| Color Space (Percent of AdobeRGB 1998) | 57 | 59 4% | 58.1 2% | 40.59 -29% | 60.9 7% | 34 -40% | 63.2 11% | 52 -9% | 55 -4% | 63.82 12% | 38 -33% |
| Color Space (Percent of sRGB) | 88 | 91 3% | 89.2 1% | 62.66 -29% | 96 9% | 54 -39% | 97.6 11% | 82 -7% | 83 -6% | 98.91 12% | 59 -33% |
| Total Average (Program / Settings) | 4% /
3% | 4% /
-1% | -15% /
-14% | -2% /
3% | -14% /
-17% | 7% /
12% | 13% /
18% | 6% /
5% | 17% /
19% | -14% /
-15% |
* ... smaller is better
Display Response Times
| ↔ Response Time Black to White | ||
|---|---|---|
| 31 ms ... rise ↗ and fall ↘ combined | ↗ 18 ms rise | 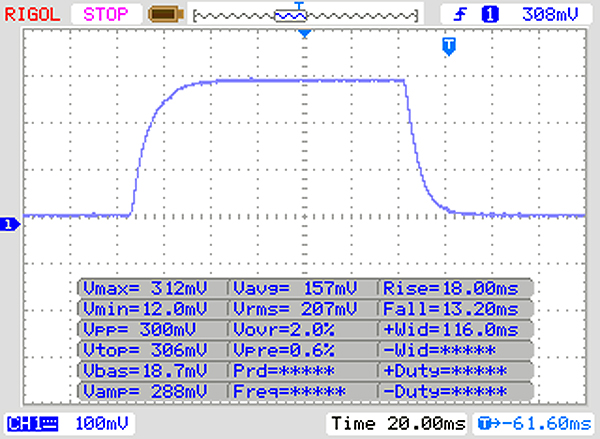 |
| ↘ 13 ms fall | ||
| The screen shows slow response rates in our tests and will be unsatisfactory for gamers. In comparison, all tested devices range from 0.1 (minimum) to 240 (maximum) ms. » 82 % of all devices are better. This means that the measured response time is worse than the average of all tested devices (21.5 ms). | ||
| ↔ Response Time 50% Grey to 80% Grey | ||
| 44 ms ... rise ↗ and fall ↘ combined | ↗ 24 ms rise | 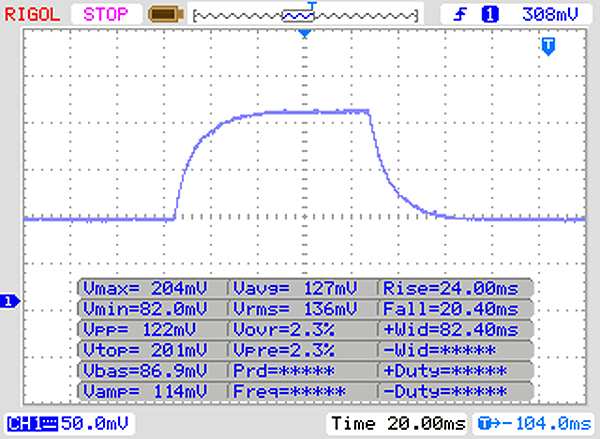 |
| ↘ 20 ms fall | ||
| The screen shows slow response rates in our tests and will be unsatisfactory for gamers. In comparison, all tested devices range from 0.2 (minimum) to 636 (maximum) ms. » 69 % of all devices are better. This means that the measured response time is worse than the average of all tested devices (33.7 ms). | ||
Screen Flickering / PWM (Pulse-Width Modulation)
| Screen flickering / PWM not detected | 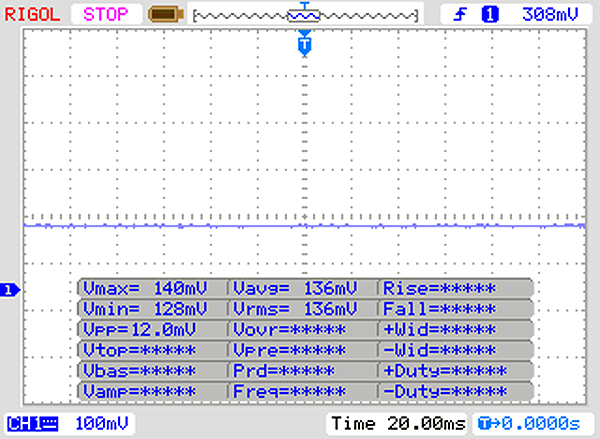 | ||
In comparison: 53 % of all tested devices do not use PWM to dim the display. If PWM was detected, an average of 17915 (minimum: 5 - maximum: 3846000) Hz was measured. | |||

Performance
The UX433FN can handle all office and Internet-based applications. Its dedicated GPU is also powerful enough for some light gaming, which we will cover in more detail in our Graphics Card and Gaming Performance sections. Our review unit currently retails for about €1,400 (~ US$1,570), but prices start at closer to €1,100 (~ US$1,234) for the base model. The UX433FA and its variations thereof, like the UX433FA-A6018T, do not have dedicated GPUs like the UX433FN does.
Processor
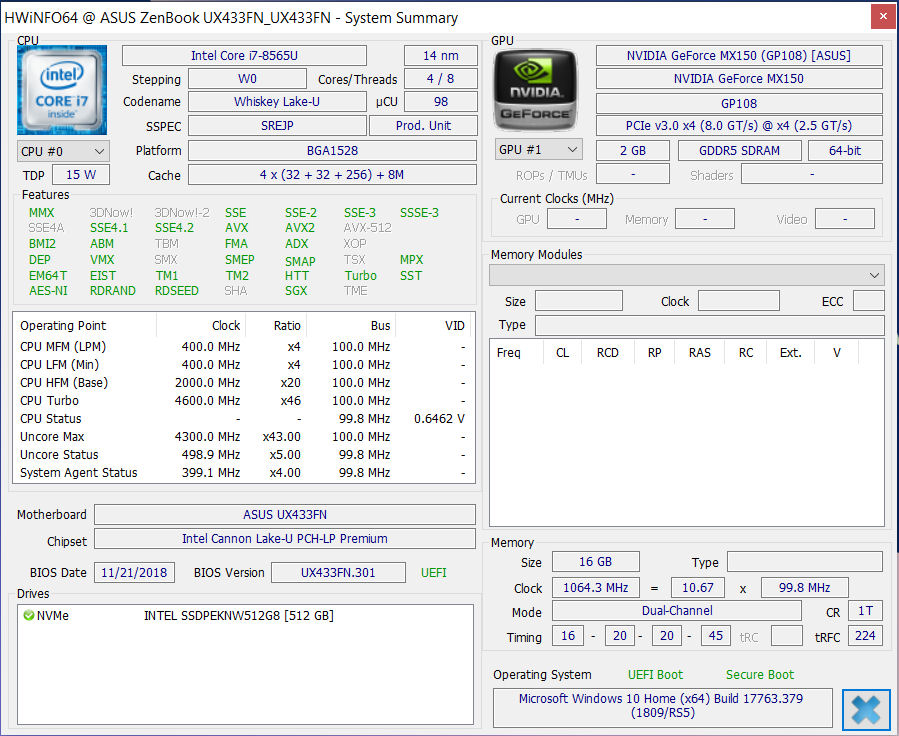
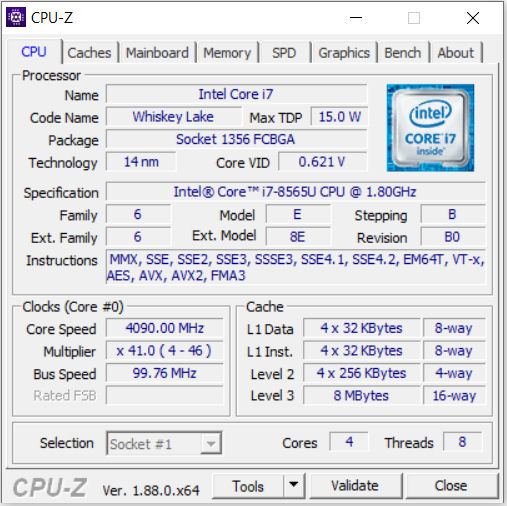
ASUS equips the UX433FN with a Core i7-8565U processor, which is from Intel’s Whiskey Lake generation. The quad-core CPU has a 1.8 GHz base clock speed, but it can use Intel Turbo Boost technology to reach 4.1 GHz on all cores when required. The processor can turbo up to 4.5 GHz on two cores and 4.6 GHz on a single core too.
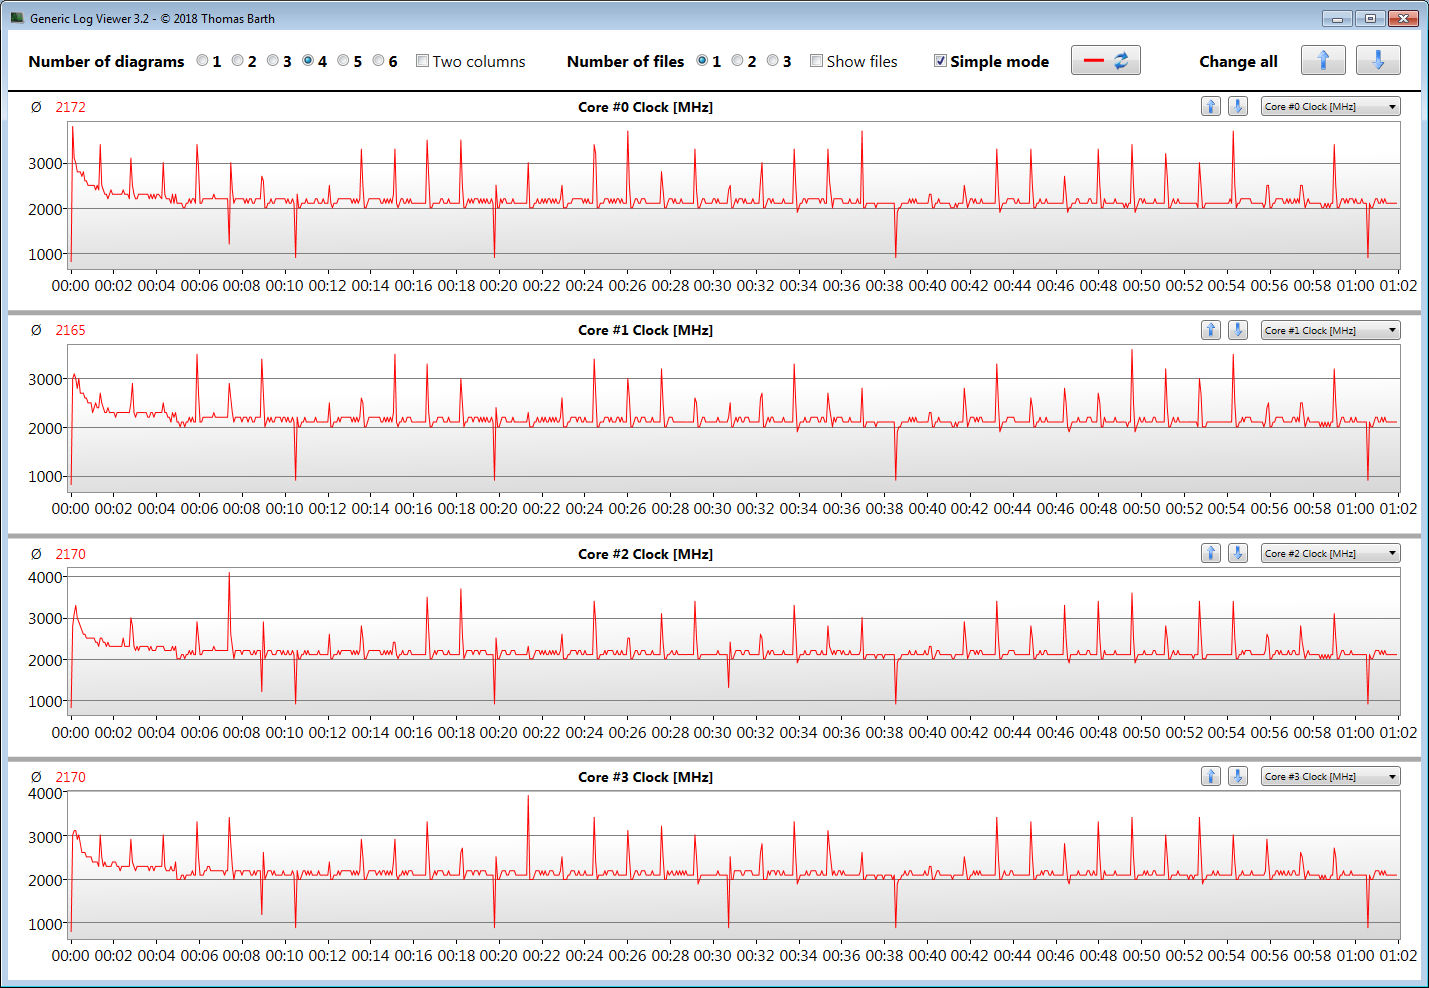
We subjected our review unit to a Cinebench R15 Multi 64-Bit benchmark to assess how it managed its CPU under sustained load. The Core i7-8565U initially operated at between 2.8 and 3.1 GHz before downclocking to between 2.5 and 2.7 GHz. By contrast, the CPU fluctuated between 2.5 and 4.6 GHz in the corresponding single core benchmark. Moreover, the system downclocked the chip when running on battery power to between 1.9 and 2.3 GHz in CB R15 Multi, while it maintained between 1.5 and 1.9 GHz in CB R15 Single.
In short, this clock speed behaviour resulted in disappointing benchmark scores as we have detailed in the graphs and tables below. The UX433FN somehow performed worse in Cinebench benchmarks than its siblings even though they are powered by Core i5-8265U and Core i7-8565U processors.
Consulting the Intel Extreme Tuning Utility revealed the reason for this unusual behavior. ASUS has set the thermal design power (TDP) of our review unit to 8 W and allows it to temporarily boost to 15 W. The Core i7-8565U has a 15 W TDP by design, as does the Core i5-8265U, which is the case with both the other UX433 laptops that we have tested. Moreover, these two models can temporarily boost their CPU to 25 W, which yields significantly better performance than our review unit can manage.
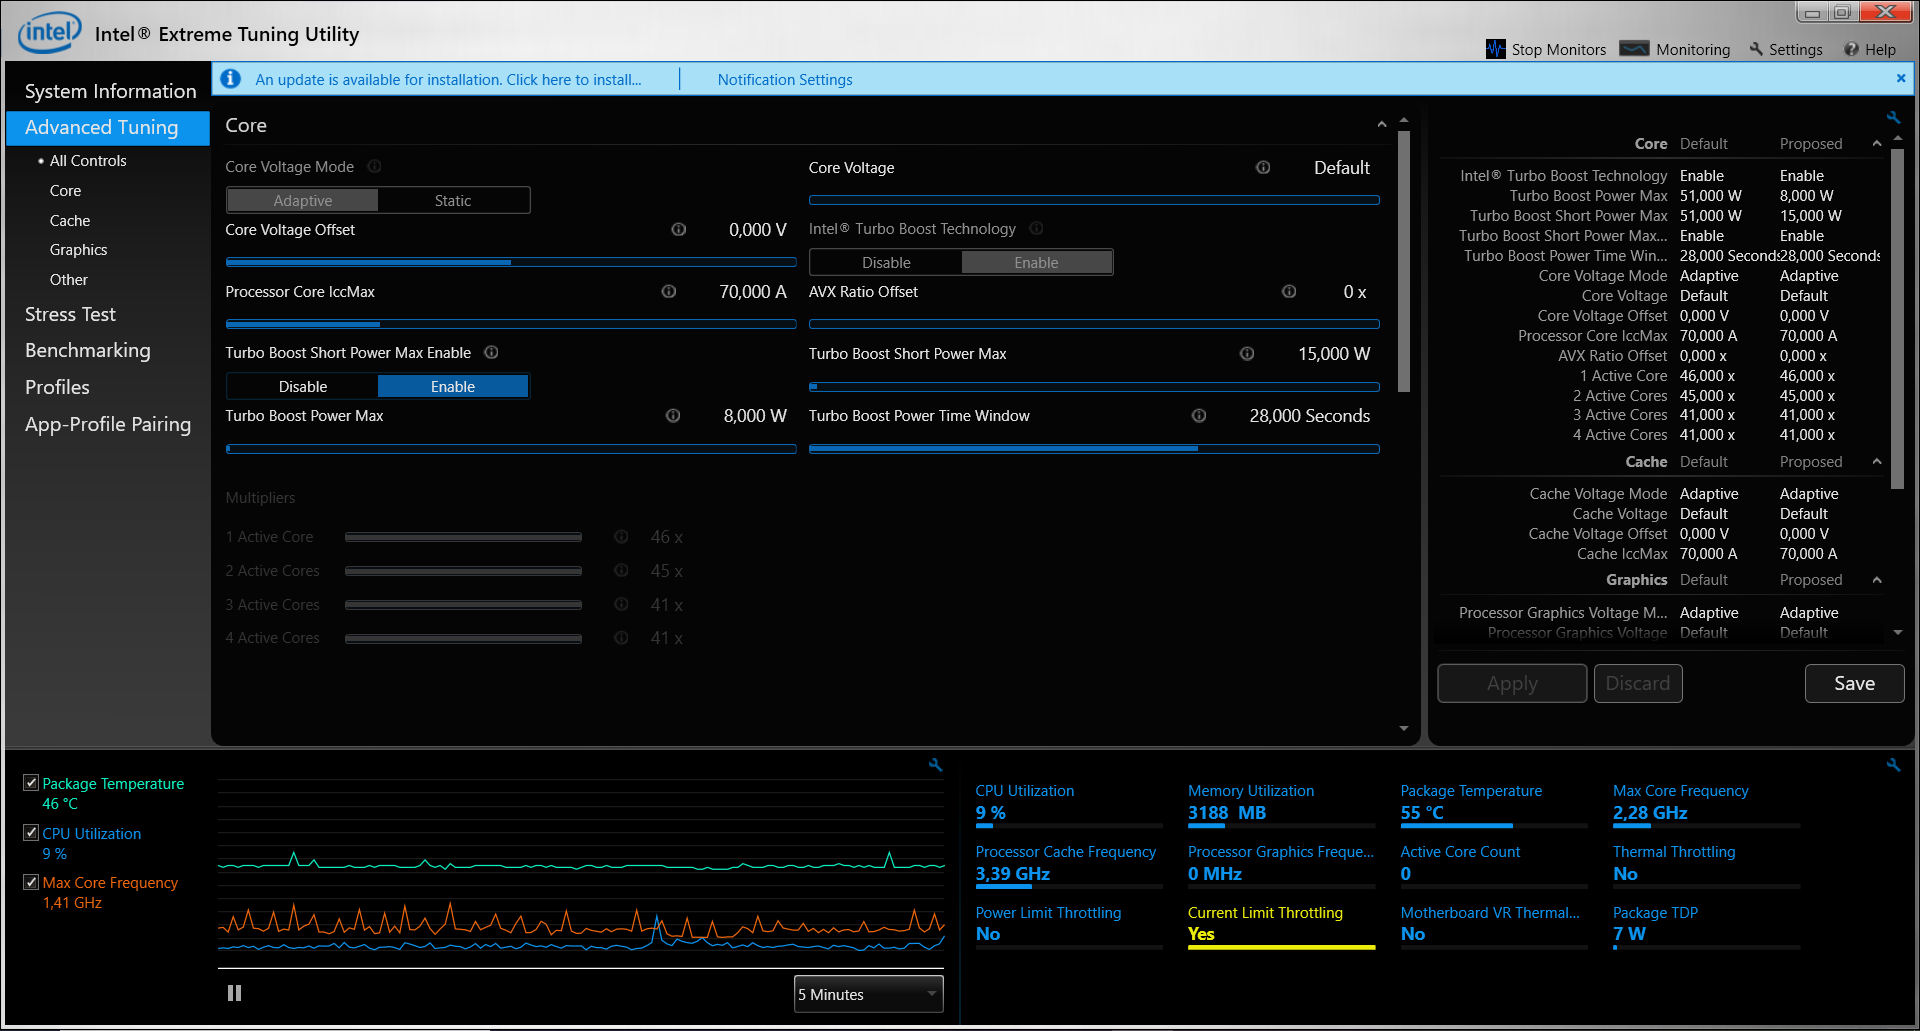
We also subjected the UX433FN to a looped CB R15 Multi benchmark to chart how its scores changed under sustained load. As expected, our review unit performs comparatively poorly and significantly worse than its siblings. Worse still, CB R15 scores plummet from an initial high of 580 points to 448 points by the fourth benchmark pass through, which puts the UX433FN on par with the HP Envy 13 and lower than all but the two IdeaPad 720S-13ARR models of our comparison devices. Scores settle at around 450 points by the end of the benchmark loop, so we suspect that the CPU exhausted its Turbo TDP by the end of the third benchmark pass through.
In short, the UX433FN has a baffling TDP limitation, which is compounded by its short boost TDP. We do not understand why ASUS has done this.
| Mozilla Kraken 1.1 - Total | |
| MSI Prestige PS42 8RB-059 (Edge 41.16299.371.0) | |
| Huawei MateBook 13 i7 (Edge 42.17134.1.0) | |
| Asus Zenbook 14 UX433FA-A6018T (Edge 44) | |
| Asus Zenbook 14 UX433FN-A6023T (Edge 44) | |
| HP Pavilion 14-ce0002ng | |
| Lenovo Ideapad 720S-13ARR | |
| Lenovo IdeaPad 530s-14IKB (Edge 42.17134.1.0) | |
| HP Envy 13-ah0003ng (Edge 42) | |
| Average Intel Core i7-8565U (730 - 2622, n=43) | |
| Honor Magicbook (Chrome 82) | |
| Asus ZenBook 14 UX433FA (Edge 42.17134.1.0) | |
| Average of class Subnotebook (363 - 1913, n=67, last 2 years) | |
| Octane V2 - Total Score | |
| Average of class Subnotebook (49893 - 98093, n=33, last 2 years) | |
| Asus ZenBook 14 UX433FA (Edge 42.17134.1.0) | |
| Average Intel Core i7-8565U (13935 - 49795, n=42) | |
| HP Envy 13-ah0003ng (Edge 42) | |
| Asus Zenbook 14 UX433FN-A6023T (Edge 44) | |
| Lenovo IdeaPad 530s-14IKB (Edge 42.17134.1.0) | |
| Asus Zenbook 14 UX433FA-A6018T (Edge 44) | |
| Huawei MateBook 13 i7 (Edge 42.17134.1.0) | |
| Lenovo Ideapad 720S-13ARR | |
| MSI Prestige PS42 8RB-059 (Edge 41.16299.371.0) | |
| Speedometer 2.0 - Result | |
| Average of class Subnotebook (176 - 674, n=27, last 2 years) | |
| Average Intel Core i7-8565U (55.5 - 62.5, n=5) | |
| Asus Zenbook 14 UX433FN-A6023T (Edge 44) | |
| Asus Zenbook 14 UX433FA-A6018T (Edge 44) | |
* ... smaller is better
System Performance
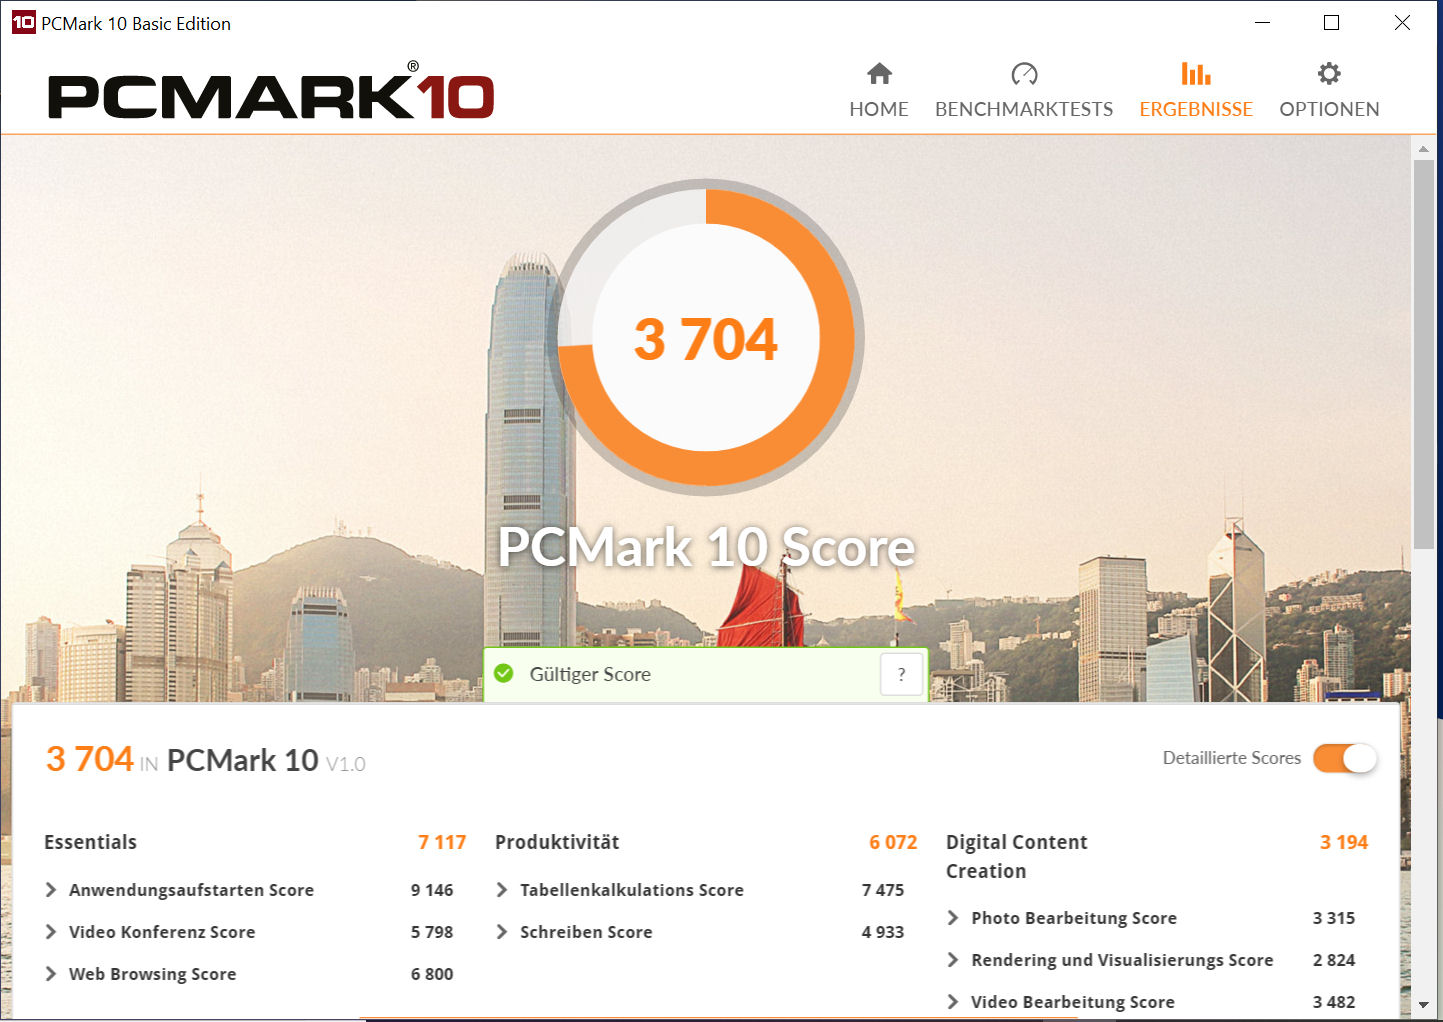
The combination of an NVMe SSD, a crippled Core i7 processor and dual-channel RAM still provides solid system performance though. We did not encounter any problems during our tests, and our review unit has more than enough processing power for all office and Internet-based applications that we threw at it. Its dedicated GPU also helps it to achieve comparably good PCMark benchmark results despite its hamstrung CPU performance.
| PCMark 7 Score | 5840 points | |
| PCMark 8 Home Score Accelerated v2 | 3691 points | |
| PCMark 8 Creative Score Accelerated v2 | 4805 points | |
| PCMark 8 Work Score Accelerated v2 | 4952 points | |
| PCMark 10 Score | 3704 points | |
Help | ||
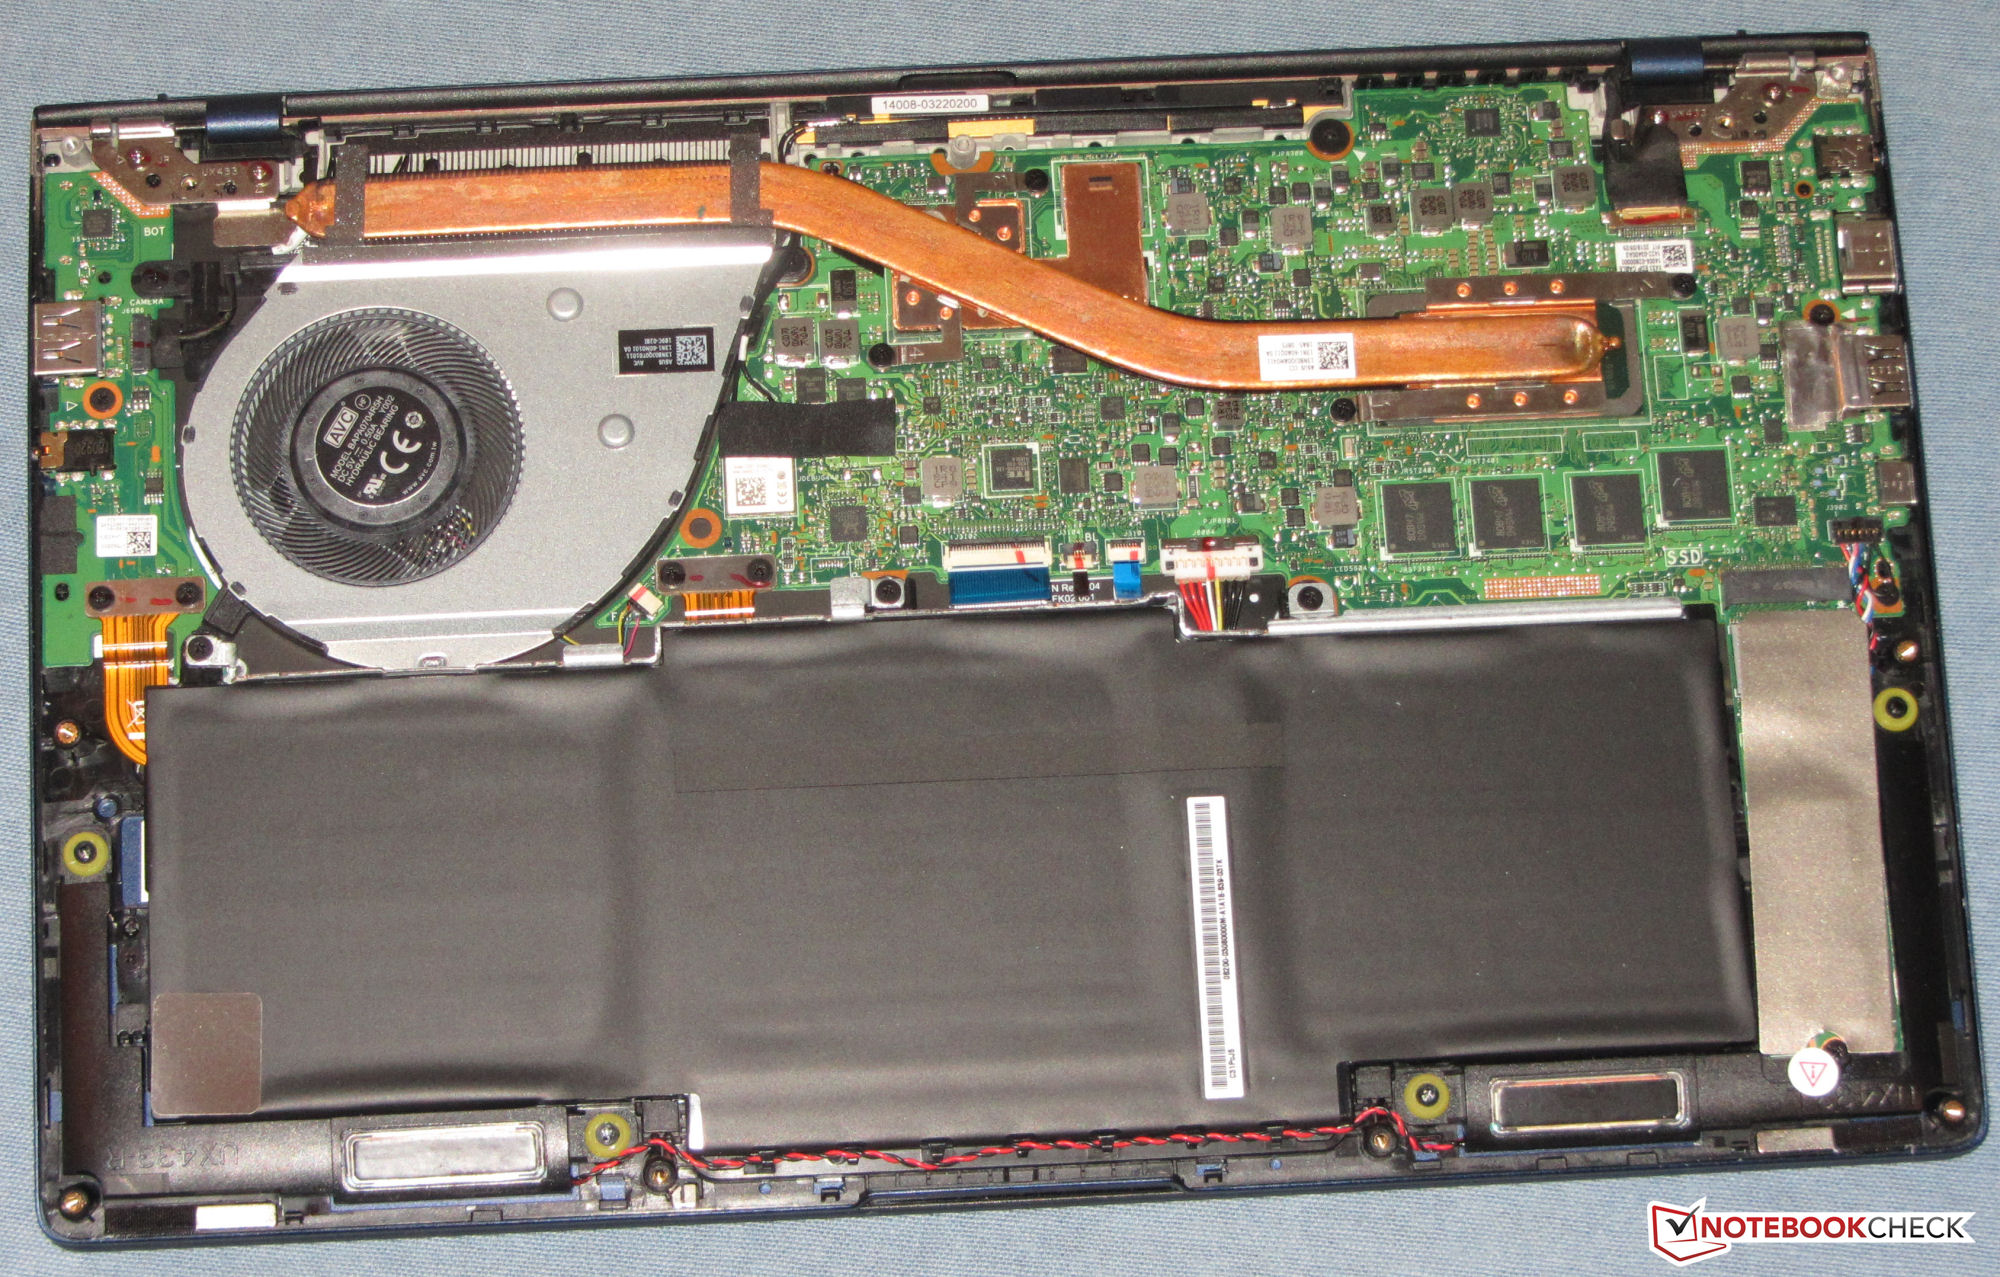
Storage Devices
ASUS has equipped our review unit with an Intel 660p NVMe SSD. The drive has a capacity of 512 GB, of which about 437 GB is available upon delivery. The remaining space is distributed between the Windows installation and the recovery partition. The SSD performed well in CrystalDiskMark and achieved much faster transfer speeds than its SATA III counterparts, which can only reach up to 600 MB/s. In real terms, the OS and programs should boot quickly, and you should not notice any lags or micro stutters.

| Asus Zenbook 14 UX433FN-A6023T Intel SSD 660p SSDPEKNW512G8 | Honor Magicbook Samsung SSD PM871b MZNLN256HAJQ | Lenovo IdeaPad 530s-14IKB SK Hynix PC401 512GB M.2 (HFS512GD9TNG) | Huawei MateBook 13 i7 Samsung SSD PM981 MZVLB512HAJQ | HP Envy 13-ah0003ng SK Hynix BC501 HFM512GDJTNG | Lenovo Ideapad 720S-13ARR Samsung PM961 MZVLW256HEHP | Lenovo Ideapad 720S-13ARR Samsung PM961 NVMe MZVLW128HEGR | MSI Prestige PS42 8RB-059 Toshiba KSG60ZMV512G | HP Pavilion 14-ce0002ng SanDisk X600 SD9SN8W-128G | Average Intel SSD 660p SSDPEKNW512G8 | Average of class Subnotebook | |
|---|---|---|---|---|---|---|---|---|---|---|---|
| CrystalDiskMark 5.2 / 6 | -38% | 35% | 74% | -4% | 9% | 10% | -36% | -48% | 19% | 127% | |
| Write 4K | 93.1 | 82.1 -12% | 136.1 46% | 159.4 71% | 112.9 21% | 87.5 -6% | 127 36% | 96.3 3% | 69.5 -25% | 136 ? 46% | 154.9 ? 66% |
| Read 4K | 44.32 | 21.11 -52% | 44.52 0% | 47.31 7% | 38.69 -13% | 31.39 -29% | 42.21 -5% | 25.29 -43% | 34.71 -22% | 55.2 ? 25% | 65.7 ? 48% |
| Write Seq | 875 | 451.7 -48% | 1279 46% | 1899 117% | 654 -25% | 1281 46% | 781 -11% | 475.8 -46% | 382.1 -56% | 926 ? 6% | 2466 ? 182% |
| Read Seq | 1427 | 477.7 -67% | 1665 17% | 2173 52% | 642 -55% | 1453 2% | 1552 9% | 464.5 -67% | 435.3 -69% | 1523 ? 7% | 2627 ? 84% |
| Write 4K Q32T1 | 344.5 | 242.2 -30% | 327.5 -5% | 368.1 7% | 305.9 -11% | 169.4 -51% | 189.6 -45% | 182 -47% | 158.1 -54% | 381 ? 11% | 401 ? 16% |
| Read 4K Q32T1 | 211.8 | 257.4 22% | 391.8 85% | 526 148% | 351.6 66% | 241.8 14% | 312.5 48% | 264.6 25% | 200.6 -5% | 334 ? 58% | 483 ? 128% |
| Write Seq Q32T1 | 949 | 526 -45% | 1387 46% | 1914 102% | 869 -8% | 1337 41% | 783 -17% | 512 -46% | 205.4 -78% | 987 ? 4% | 3908 ? 312% |
| Read Seq Q32T1 | 1846 | 550 -70% | 2693 46% | 3487 89% | 1683 -9% | 2786 51% | 3079 67% | 545 -70% | 541 -71% | 1744 ? -6% | 5174 ? 180% |
Graphics Card
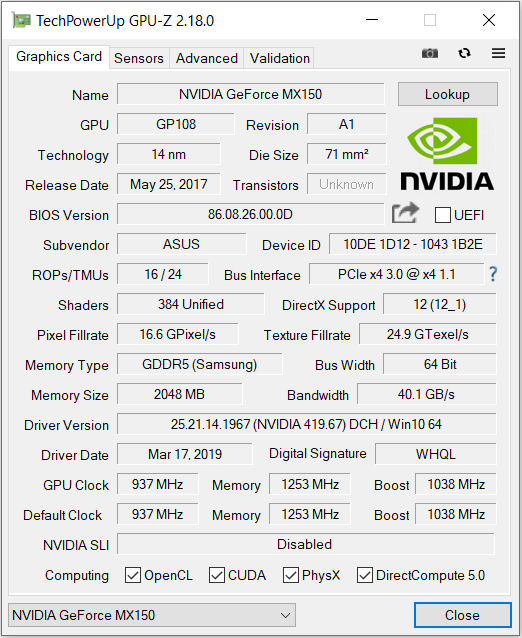
The GeForce MX150 is based on NVIDIA’s Pascal architecture and supports DirectX 12. The GPU has a 937 MHz base clock speed but can boost up to 1,038 MHz when needed. The GPU also integrates 2,048 MB of GDDR5 VRAM and performed at expected levels for a GeForce MX150 in 3DMark benchmarks.
Please keep in mind that ASUS equips UX433FN with the 1D12 variant of the GeForce MX150, which is capped at a 10 W TDP compared to the 25 W that the 1D10 model can reach. The difference in TDP typically results in approximately a 30% performance difference in benchmarks and games. Frustratingly, OEMs and NVIDIA continue to not acknowledge this and continually market the two GPUs as the same model. Please see our corresponding technical article where we go into greater depth about the differences between the 1D10 and 1D12.
| 3DMark 06 Standard Score | 19038 points | |
| 3DMark 11 Performance | 3886 points | |
| 3DMark Cloud Gate Standard Score | 12432 points | |
| 3DMark Fire Strike Score | 2615 points | |
| 3DMark Time Spy Score | 961 points | |
Help | ||
Gaming Performance
Our review unit can play most modern games smoothly in 720p at medium to high graphics. The UX433FN can even handle older games like BioShock Infinite in 1080p at playable framerates too. Likewise, modern triple-A games like Far Cry New Dawn and The Division 2 are only playable at minimum graphics in 720p, while power-hungry titles like Anthem and Metro Exodus are unplayable even at their lowest settings.
| low | med. | high | ultra | |
| BioShock Infinite (2013) | 152.8 | 104 | 81.1 | 30 |
| Apex Legends (2019) | 52.5 | 22.8 | 17.6 | 16.8 |
| Far Cry New Dawn (2019) | 39 | 18 | 17 | 15 |
| Metro Exodus (2019) | 10.4 | 7.6 | 6.1 | 5.3 |
| Anthem (2019) | 24.6 | 16.1 | 12 | 11.6 |
| Dirt Rally 2.0 (2019) | 80.6 | 26.9 | 19.8 | 10 |
| The Division 2 (2019) | 37 | 18 | 12 | 8 |
Emissions
Fan Noise
The UX433FN does get rather loud under sustained load, but it typically runs silently in general tasks like web browsing or word processing. The fan occasionally reached a maximum of 30.7 dB(A) when idle and 39.3 dB(A) during our stress test, which is on par with many other modern compact laptops. Nevertheless, you will be able to hear the fans if you are sitting in front of the machine while pushing the system hard, which may irritate some people.
Noise Level
| Idle |
| 30.7 / 30.7 / 30.7 dB(A) |
| Load |
| 38.8 / 39.3 dB(A) |
 | ||
30 dB silent 40 dB(A) audible 50 dB(A) loud |
||
min: | ||
Temperature
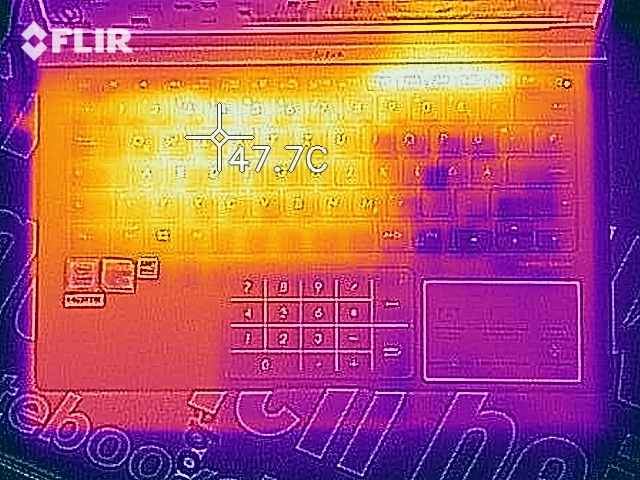
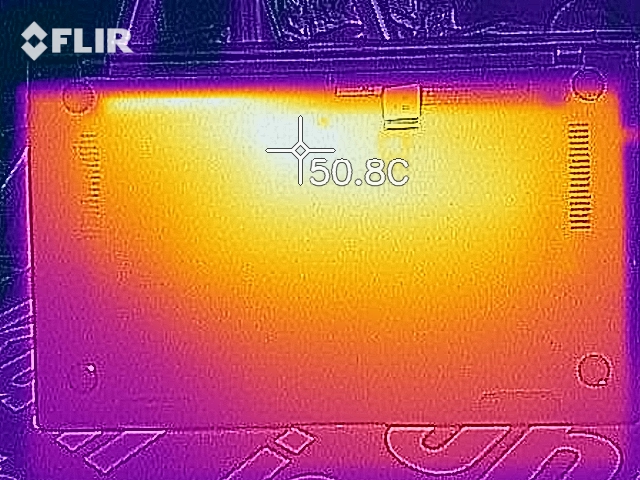
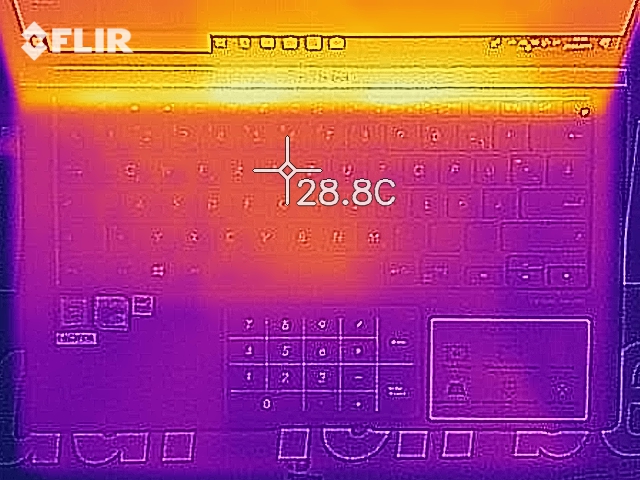
While our review unit largely keeps its fan noise in check, it will feel hot to the touch if you are gaming or running a resource-intensive task like a video render. Our review unit reached a maximum of 45.6 °C (~114 °F) on its bottom case under sustained load, which will feel uncomfortable if you have the device resting on your lap. Moreover, most surface temperatures on the bottom case exceeded 40 °C (104 °F) during our stress test, as did a few areas on the top case too.
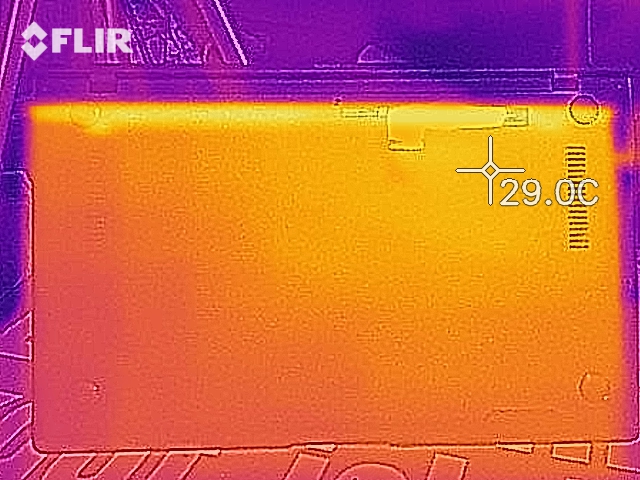
The UX433FN will feel cool in daily use though with surface temperatures averaging just shy of 24 °C (75.2 °F) at idle. In short, you should not experience high case temperatures unless you push the UX433FN to its limits. Even then, your device should not get as hot as ours did during our stress test, as we design this to push our review units to their absolute limits.
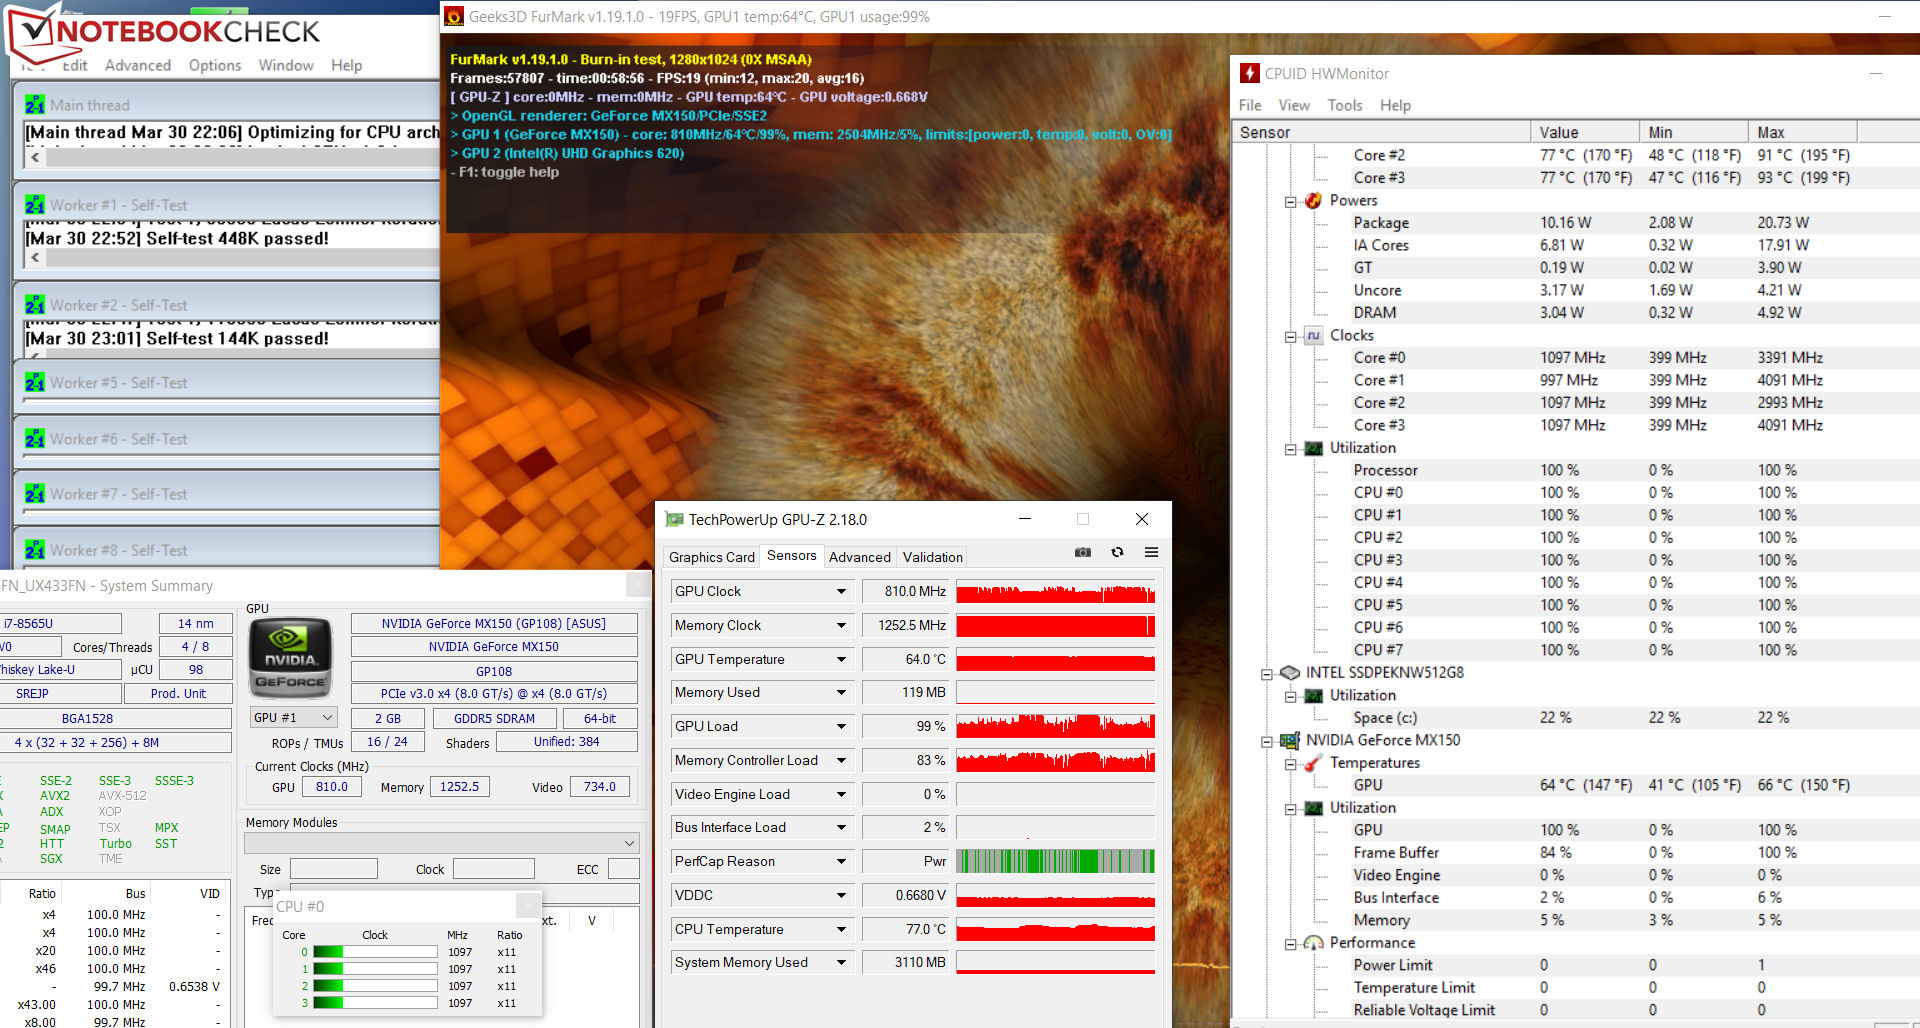
For reference, our stress test consists of us running FurMark and Prime95 on a loop for at least an hour, during which we measure clock speed and temperature changes. Our review unit performed just as well on battery power in this test as it did running from mains power, during which its CPU initially operated at between 1.1 and 1.2 GHz, or at least 600 MHz below its base clock. Clock speeds eventually dropped to 400 MHz as the cooling system struggled to keep the processor from thermal throttling. Interestingly, the GPU generally operated at 810 MHz but rose to between 1.1 and 1.2 GHz when the CPU throttled to 400 MHz. We should point out that this is unexpected behavior as the two components do not share their TDP, so the clock speed of one should not govern the other.
(±) The maximum temperature on the upper side is 44 °C / 111 F, compared to the average of 35.9 °C / 97 F, ranging from 21.4 to 59 °C for the class Subnotebook.
(-) The bottom heats up to a maximum of 45.6 °C / 114 F, compared to the average of 39.4 °C / 103 F
(+) In idle usage, the average temperature for the upper side is 23.9 °C / 75 F, compared to the device average of 30.7 °C / 87 F.
(+) The palmrests and touchpad are reaching skin temperature as a maximum (32.8 °C / 91 F) and are therefore not hot.
(-) The average temperature of the palmrest area of similar devices was 28.3 °C / 82.9 F (-4.5 °C / -8.1 F).
Speakers
Asus Zenbook 14 UX433FN-A6023T audio analysis
(±) | speaker loudness is average but good (74.8 dB)
Bass 100 - 315 Hz
(-) | nearly no bass - on average 21.7% lower than median
(±) | linearity of bass is average (9.1% delta to prev. frequency)
Mids 400 - 2000 Hz
(+) | balanced mids - only 4.1% away from median
(+) | mids are linear (4.8% delta to prev. frequency)
Highs 2 - 16 kHz
(±) | higher highs - on average 5.7% higher than median
(+) | highs are linear (2.7% delta to prev. frequency)
Overall 100 - 16.000 Hz
(±) | linearity of overall sound is average (19.2% difference to median)
Compared to same class
» 54% of all tested devices in this class were better, 6% similar, 40% worse
» The best had a delta of 5%, average was 19%, worst was 53%
Compared to all devices tested
» 41% of all tested devices were better, 7% similar, 52% worse
» The best had a delta of 4%, average was 25%, worst was 134%
HP Envy 13-ah0003ng audio analysis
(-) | not very loud speakers (71.9 dB)
Bass 100 - 315 Hz
(-) | nearly no bass - on average 23.3% lower than median
(±) | linearity of bass is average (12.4% delta to prev. frequency)
Mids 400 - 2000 Hz
(+) | balanced mids - only 2.2% away from median
(+) | mids are linear (4.8% delta to prev. frequency)
Highs 2 - 16 kHz
(+) | balanced highs - only 1.3% away from median
(+) | highs are linear (4.4% delta to prev. frequency)
Overall 100 - 16.000 Hz
(±) | linearity of overall sound is average (16.8% difference to median)
Compared to same class
» 37% of all tested devices in this class were better, 8% similar, 55% worse
» The best had a delta of 5%, average was 19%, worst was 53%
Compared to all devices tested
» 24% of all tested devices were better, 7% similar, 68% worse
» The best had a delta of 4%, average was 25%, worst was 134%
Acer Swift 3 SF314-52G-89SL audio analysis
(-) | not very loud speakers (68.6 dB)
Bass 100 - 315 Hz
(-) | nearly no bass - on average 20.5% lower than median
(±) | linearity of bass is average (12% delta to prev. frequency)
Mids 400 - 2000 Hz
(+) | balanced mids - only 2.4% away from median
(±) | linearity of mids is average (7.7% delta to prev. frequency)
Highs 2 - 16 kHz
(+) | balanced highs - only 0.8% away from median
(+) | highs are linear (3.2% delta to prev. frequency)
Overall 100 - 16.000 Hz
(±) | linearity of overall sound is average (18.4% difference to median)
Compared to same class
» 51% of all tested devices in this class were better, 8% similar, 41% worse
» The best had a delta of 5%, average was 18%, worst was 45%
Compared to all devices tested
» 35% of all tested devices were better, 8% similar, 57% worse
» The best had a delta of 4%, average was 25%, worst was 134%
Power Management
Power Consumption
The UX433FN produced no surprises in our power consumption tests. Our review unit consumed a minimum of 2.6 W when idle, which occasionally rose to a maximum of 7.3 W, with it typically consuming around 5.6 W during menial tasks. Power consumption briefly rose to a maximum of 61.8 W during our combined stress test, before settling at around 47 W under sustained load.
ASUS includes a 65 W power supply in the box, which should have no issues with charging the UX433FN even when it briefly consumes more than 60 W.
| Off / Standby | |
| Idle | |
| Load |
|
Battery Life
ASUS equips the UX433FN with a 50 Wh battery that lasted 8:19 hours in our practical Wi-Fi test. During this test, we run a script that simulates the load required to render websites while leaving the display at around 150 cd/m². We also set the Windows 10 power mode to Balanced and disable any power saving features.
Our review unit achieved a respectable runtime, although its Core i7-8565U powered sibling lasted 26% longer than the UX433FN. Surprisingly, the weaker Core i5-8265U powered model only lasted 13% longer than our review unit and 11% shorter than its UX433F sibling. In short, the UX433FN has middling battery life for a compact laptop and is only slightly better than average.
Pros
Cons
Verdict
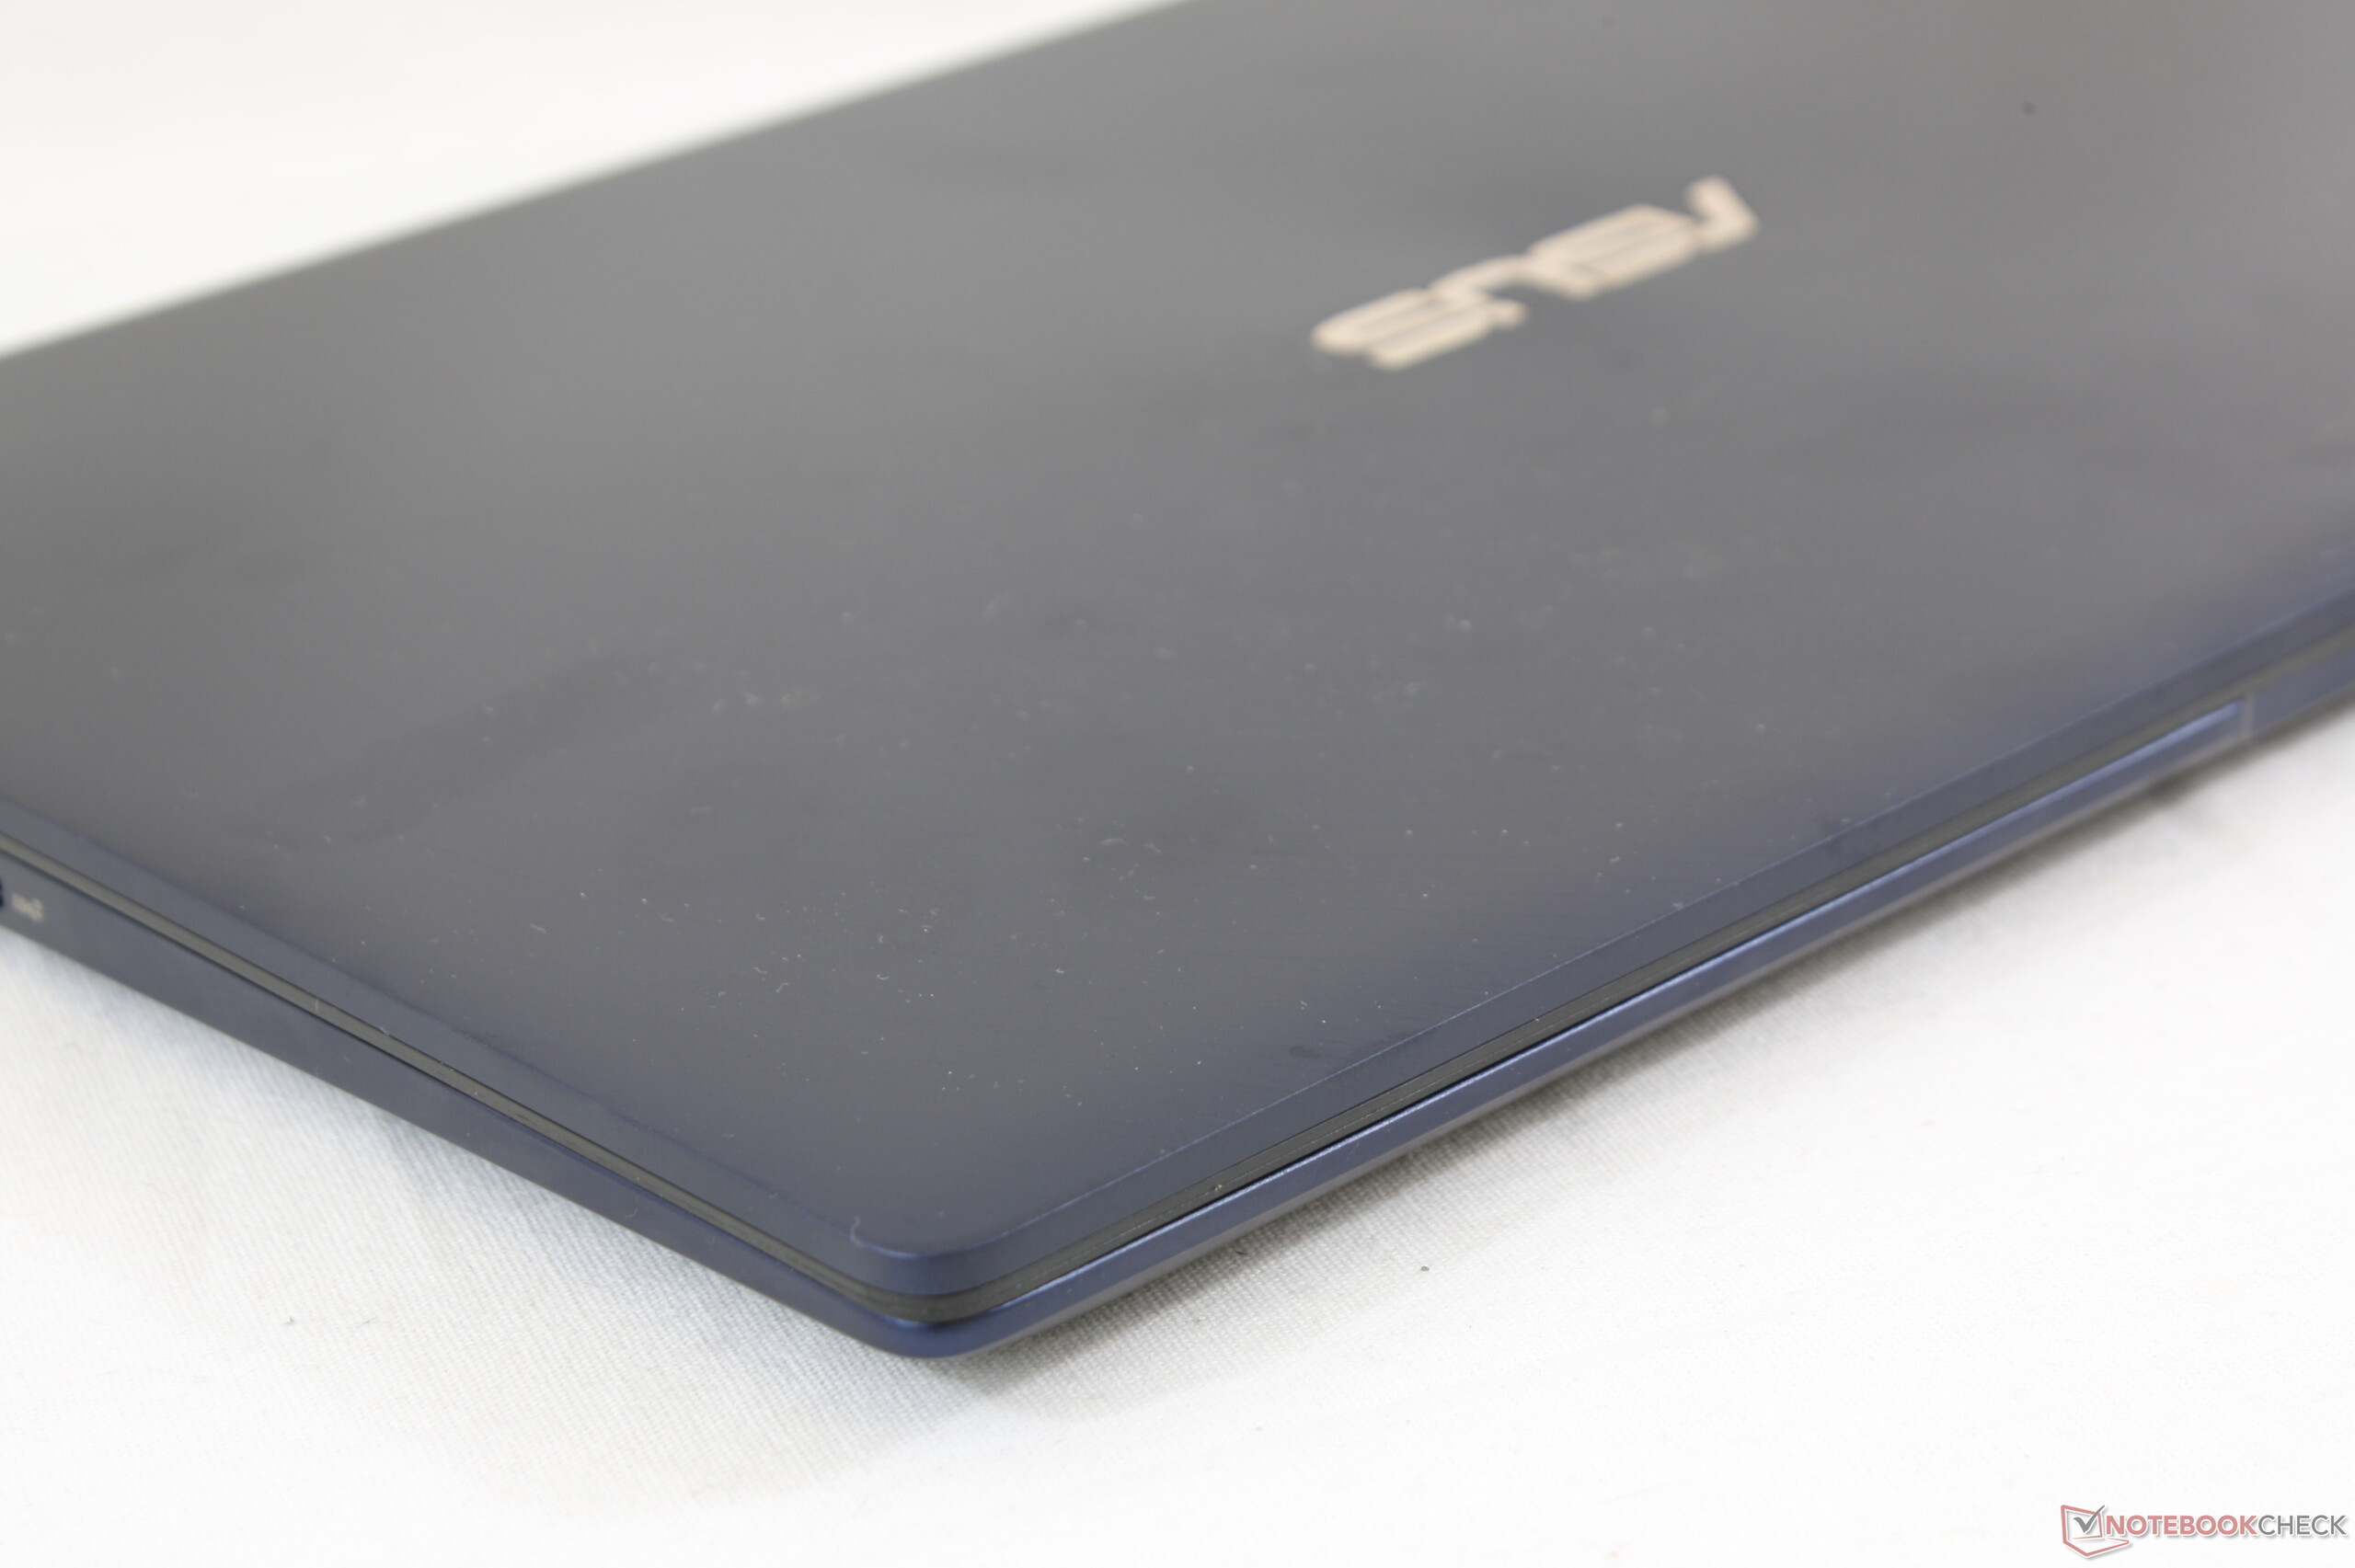
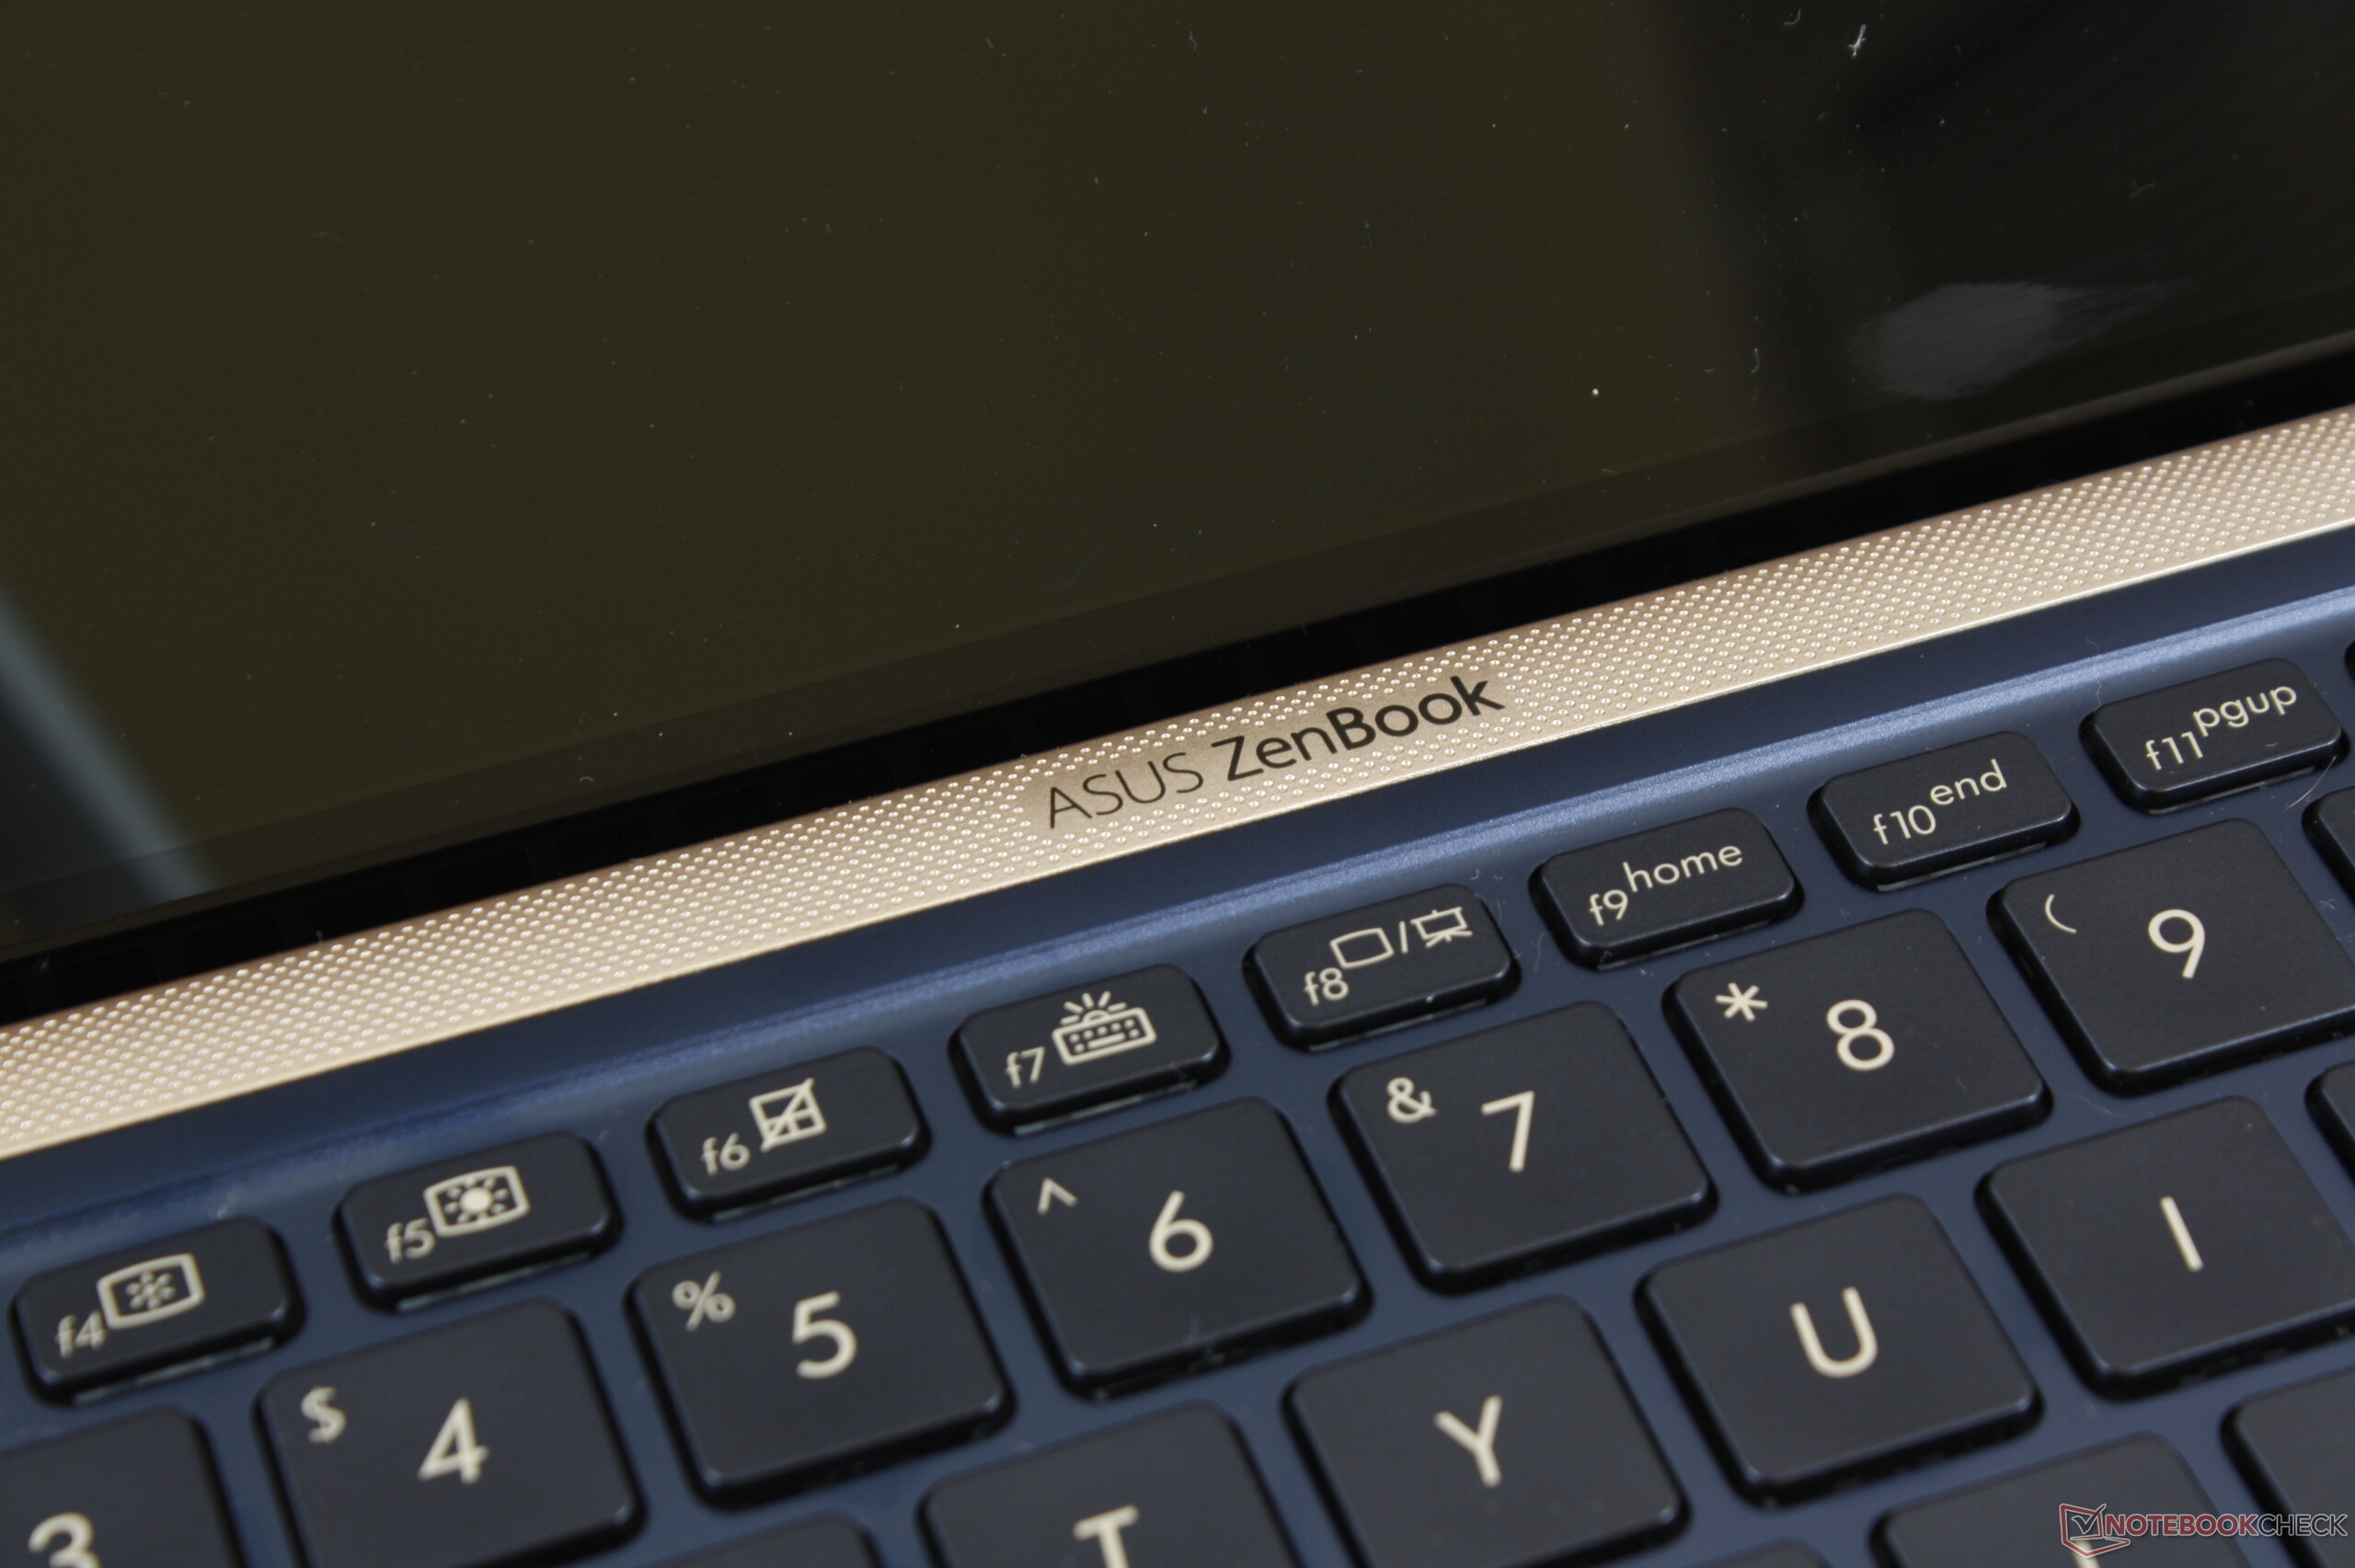
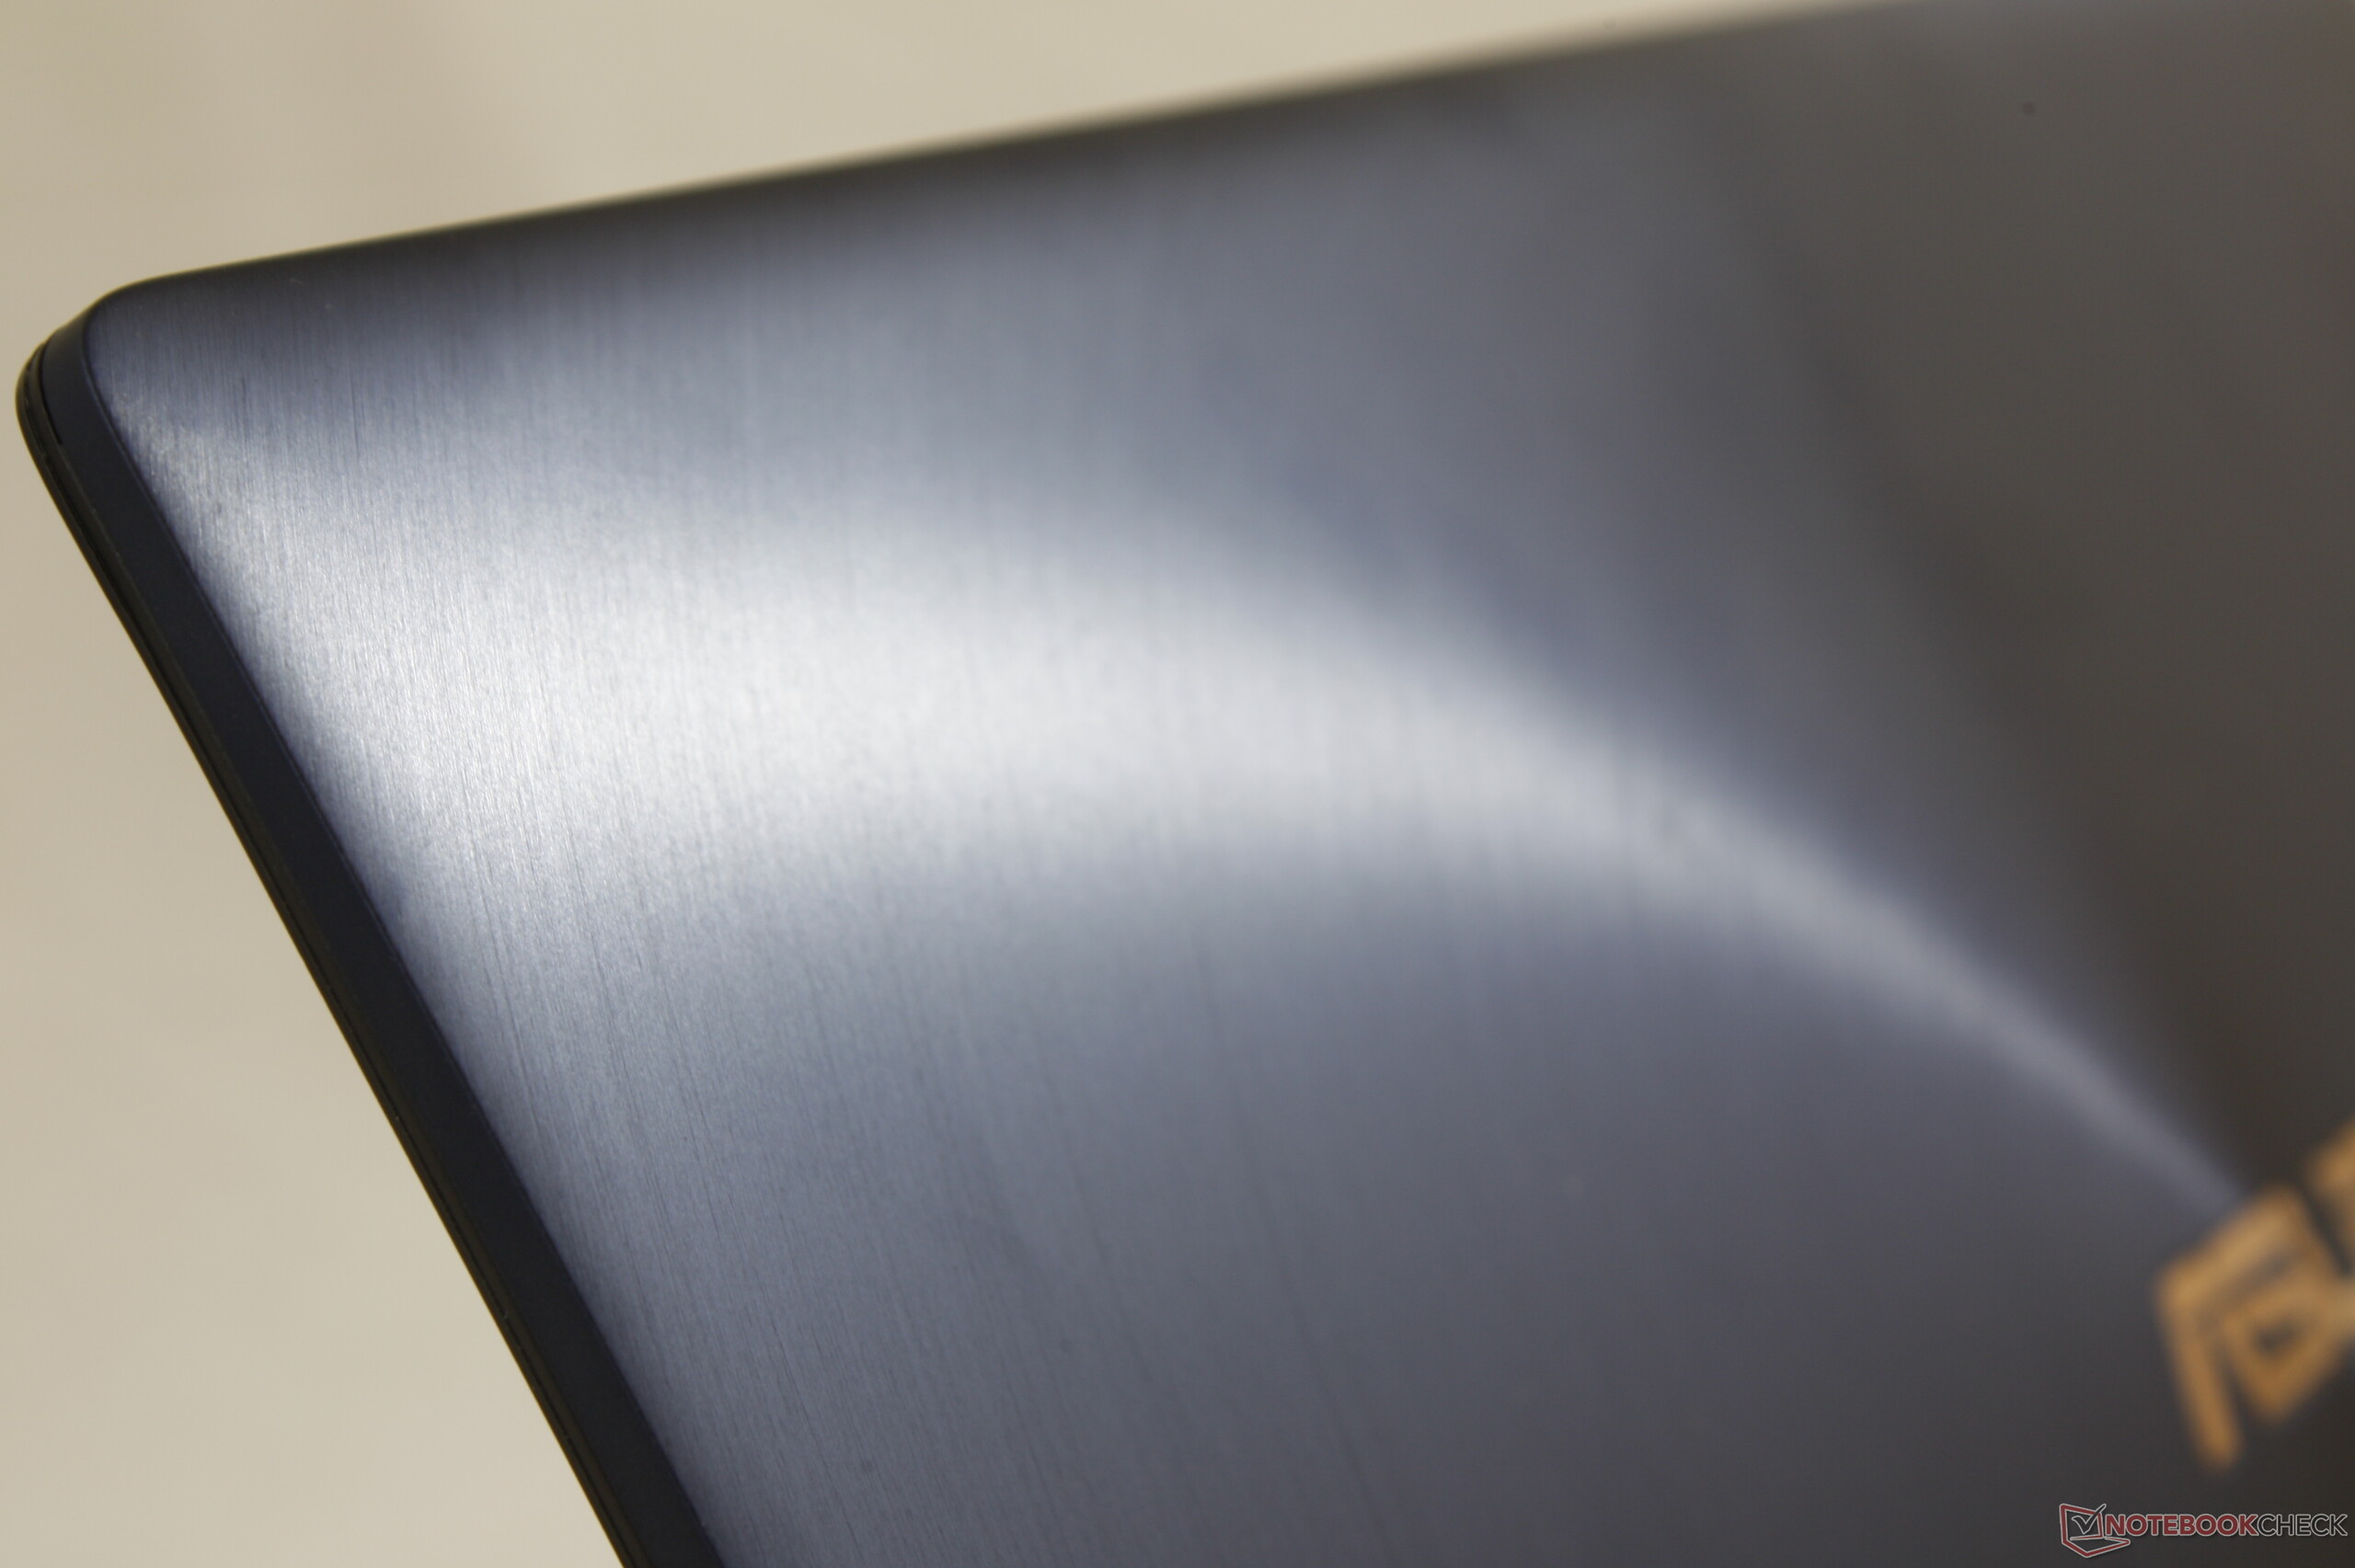
The ASUS ZenBook 14 UX433FN is a stylish and compact laptop that has a lot going for it. We like its metal case and ergo-lift hinge, while its virtual number pad is novel and could prove useful to some people.
Moreover, its Core i7 Whiskey Lake CPU and dedicated NVIDIA GPU look promising on paper. Unfortunately, ASUS has hamstrung the CPU with a pitiful 8 W TDP and has equipped the device with a weaker version of the MX150 than it could have done. Many OEMs have followed the same path with their choice of GPU, but it is disappointing to see ASUS artificially limit the UX433FN’s CPU.
In practical terms, this means that the Core i5-8265U powered variant has better CPU performance despite being equipped with a nominally weaker processor. Likewise, our review unit also needs recharging far sooner than its siblings despite operating at lower CPU clock speeds, which is doubly disappointing.
Our review unit’s NVMe SSD is fast though and offers plenty of storage, while its backlit keyboard is decent too. We also like its 1080p IPS panel, but we just wish that it got a bit brighter. We would like to see the choice of an optional matte panel too, which would help ASUS differentiate the device from its competitors.
The ZenBook 14 UX433FN is a good laptop in principal, but it is plagued by ASUS’ compromises and odd decisions.
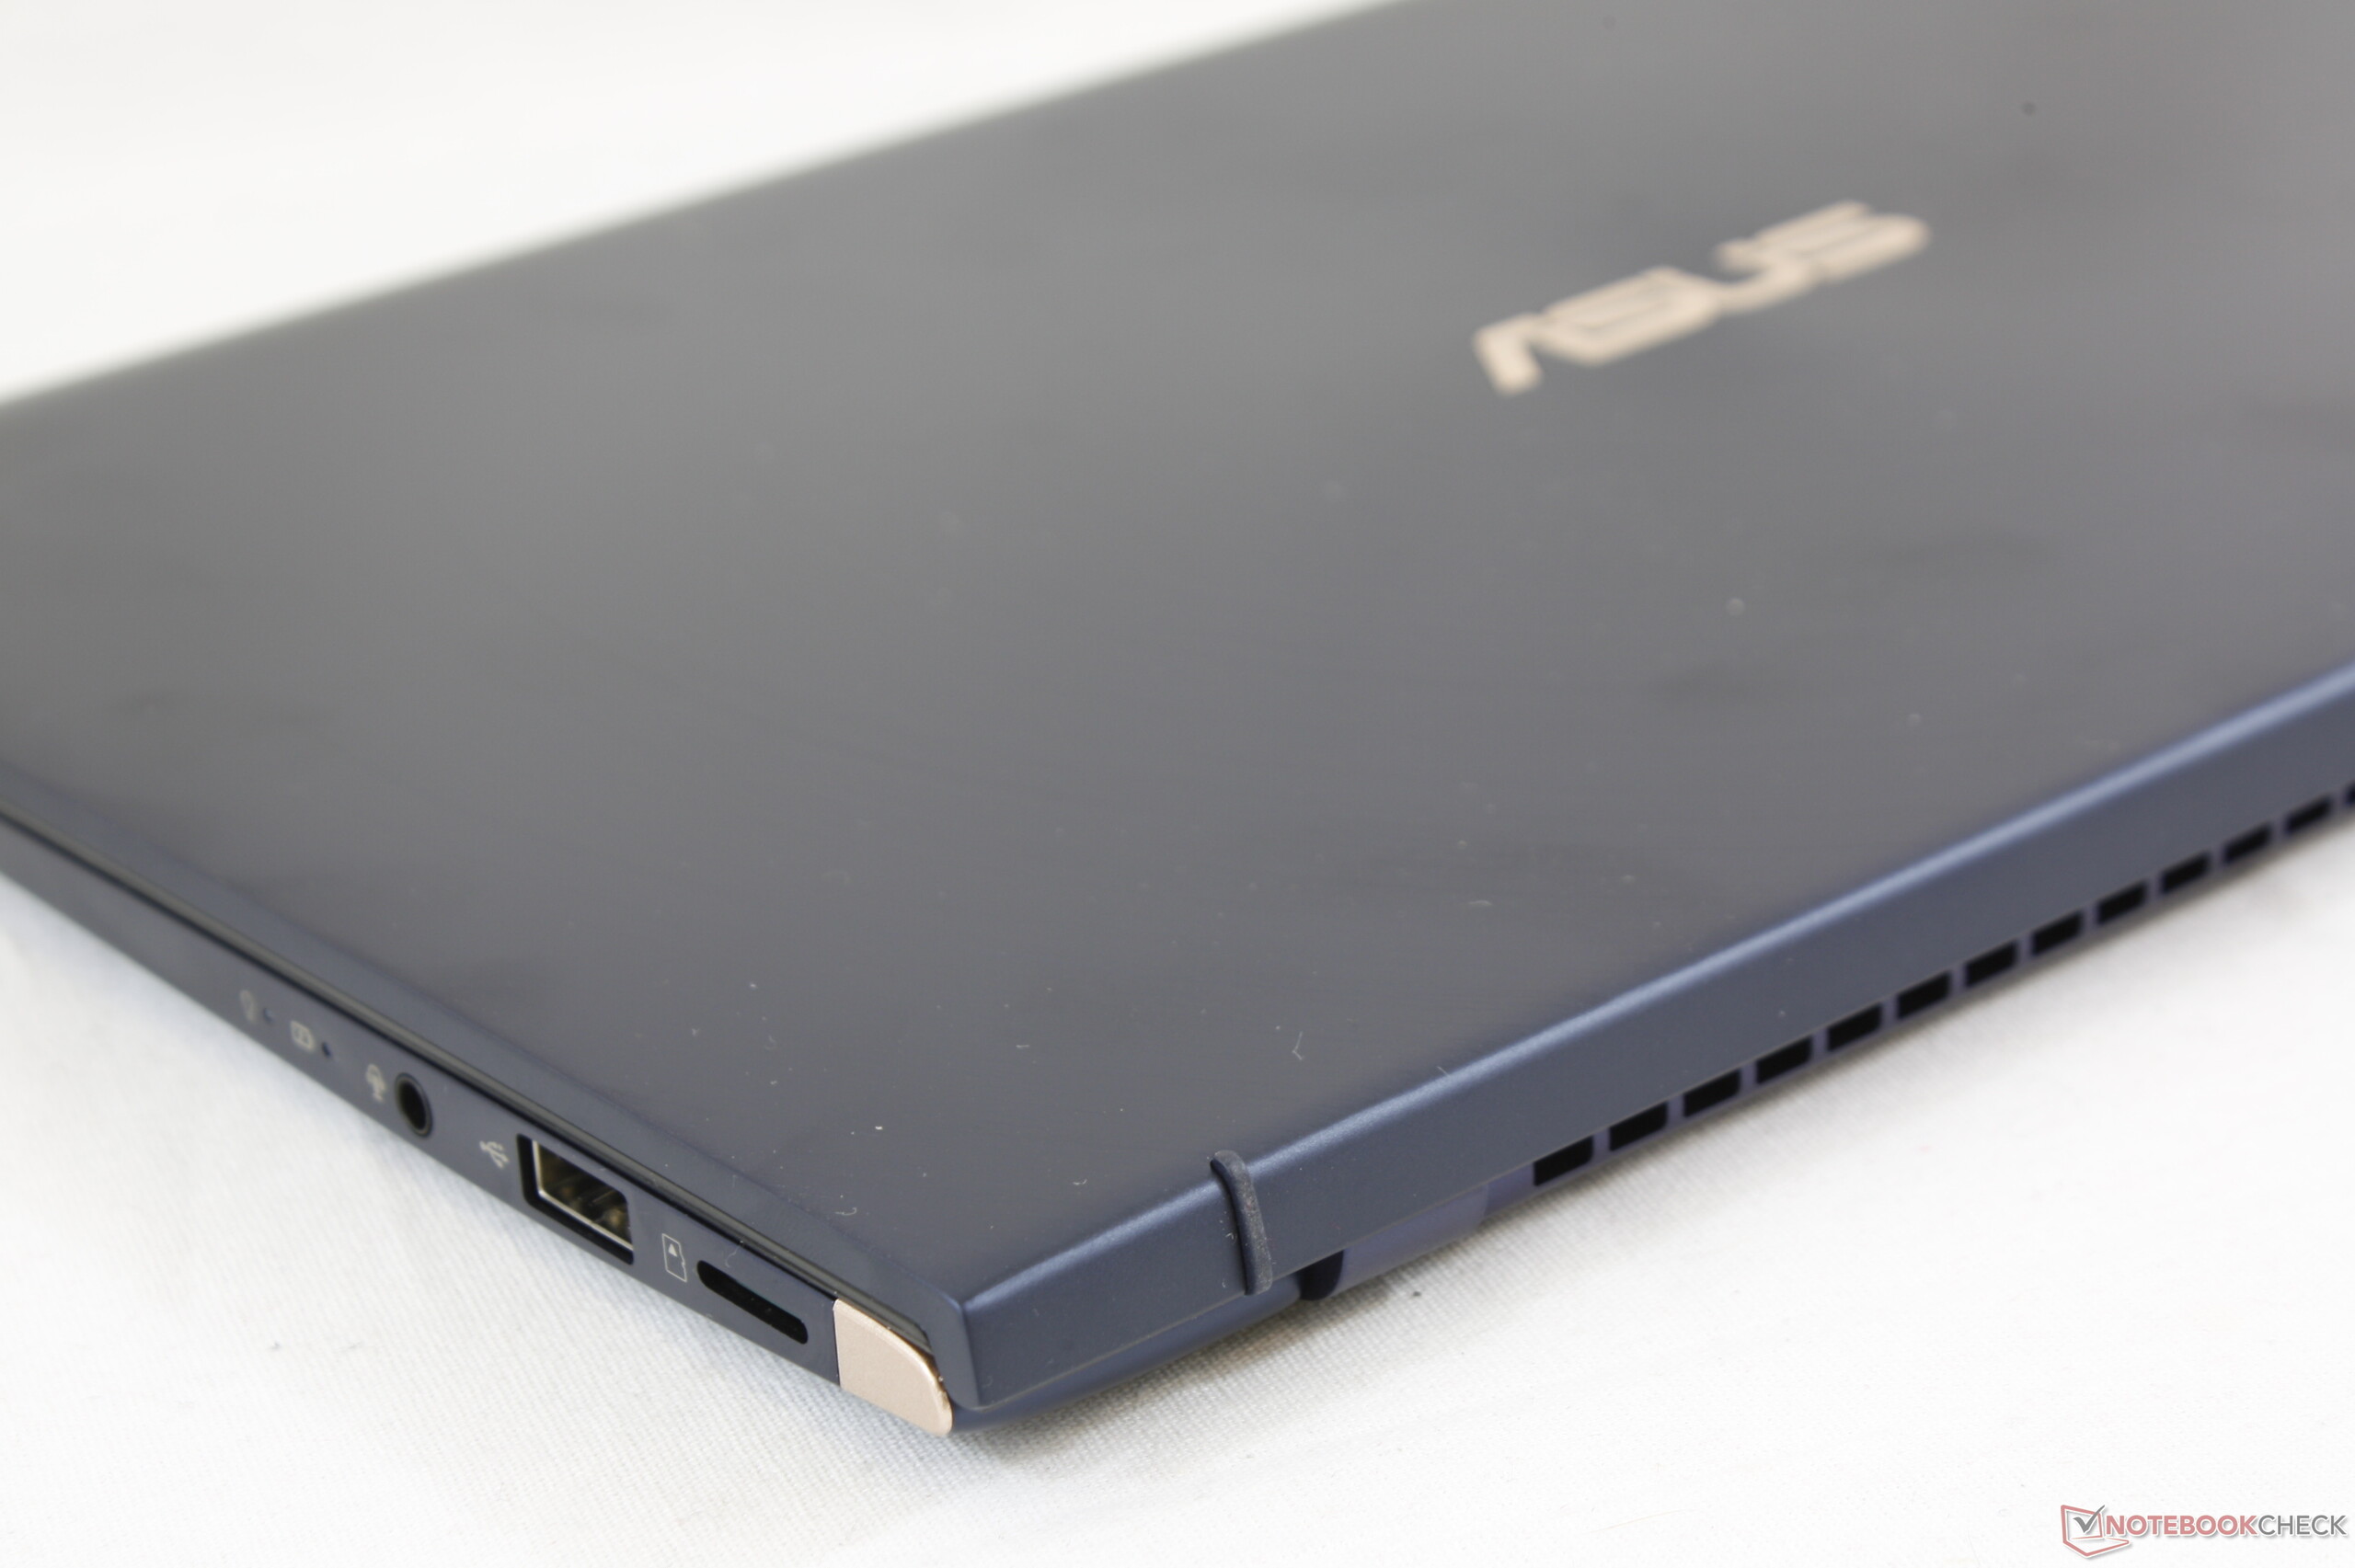
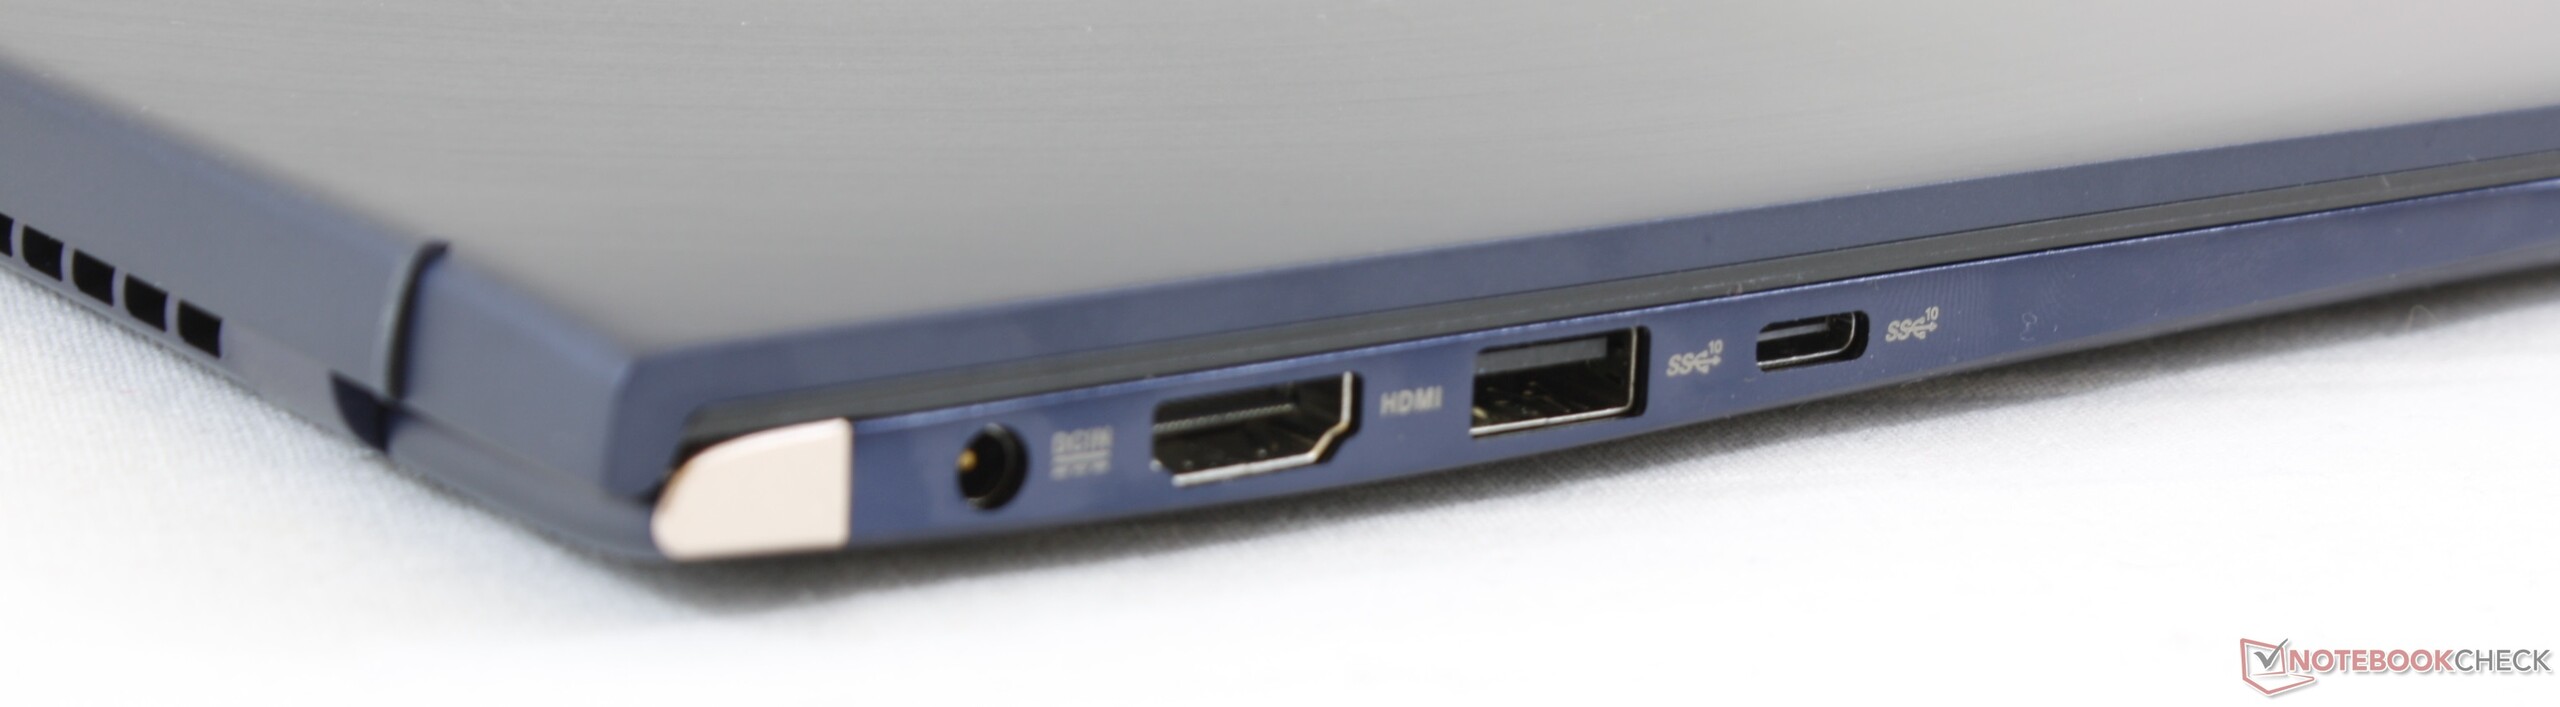
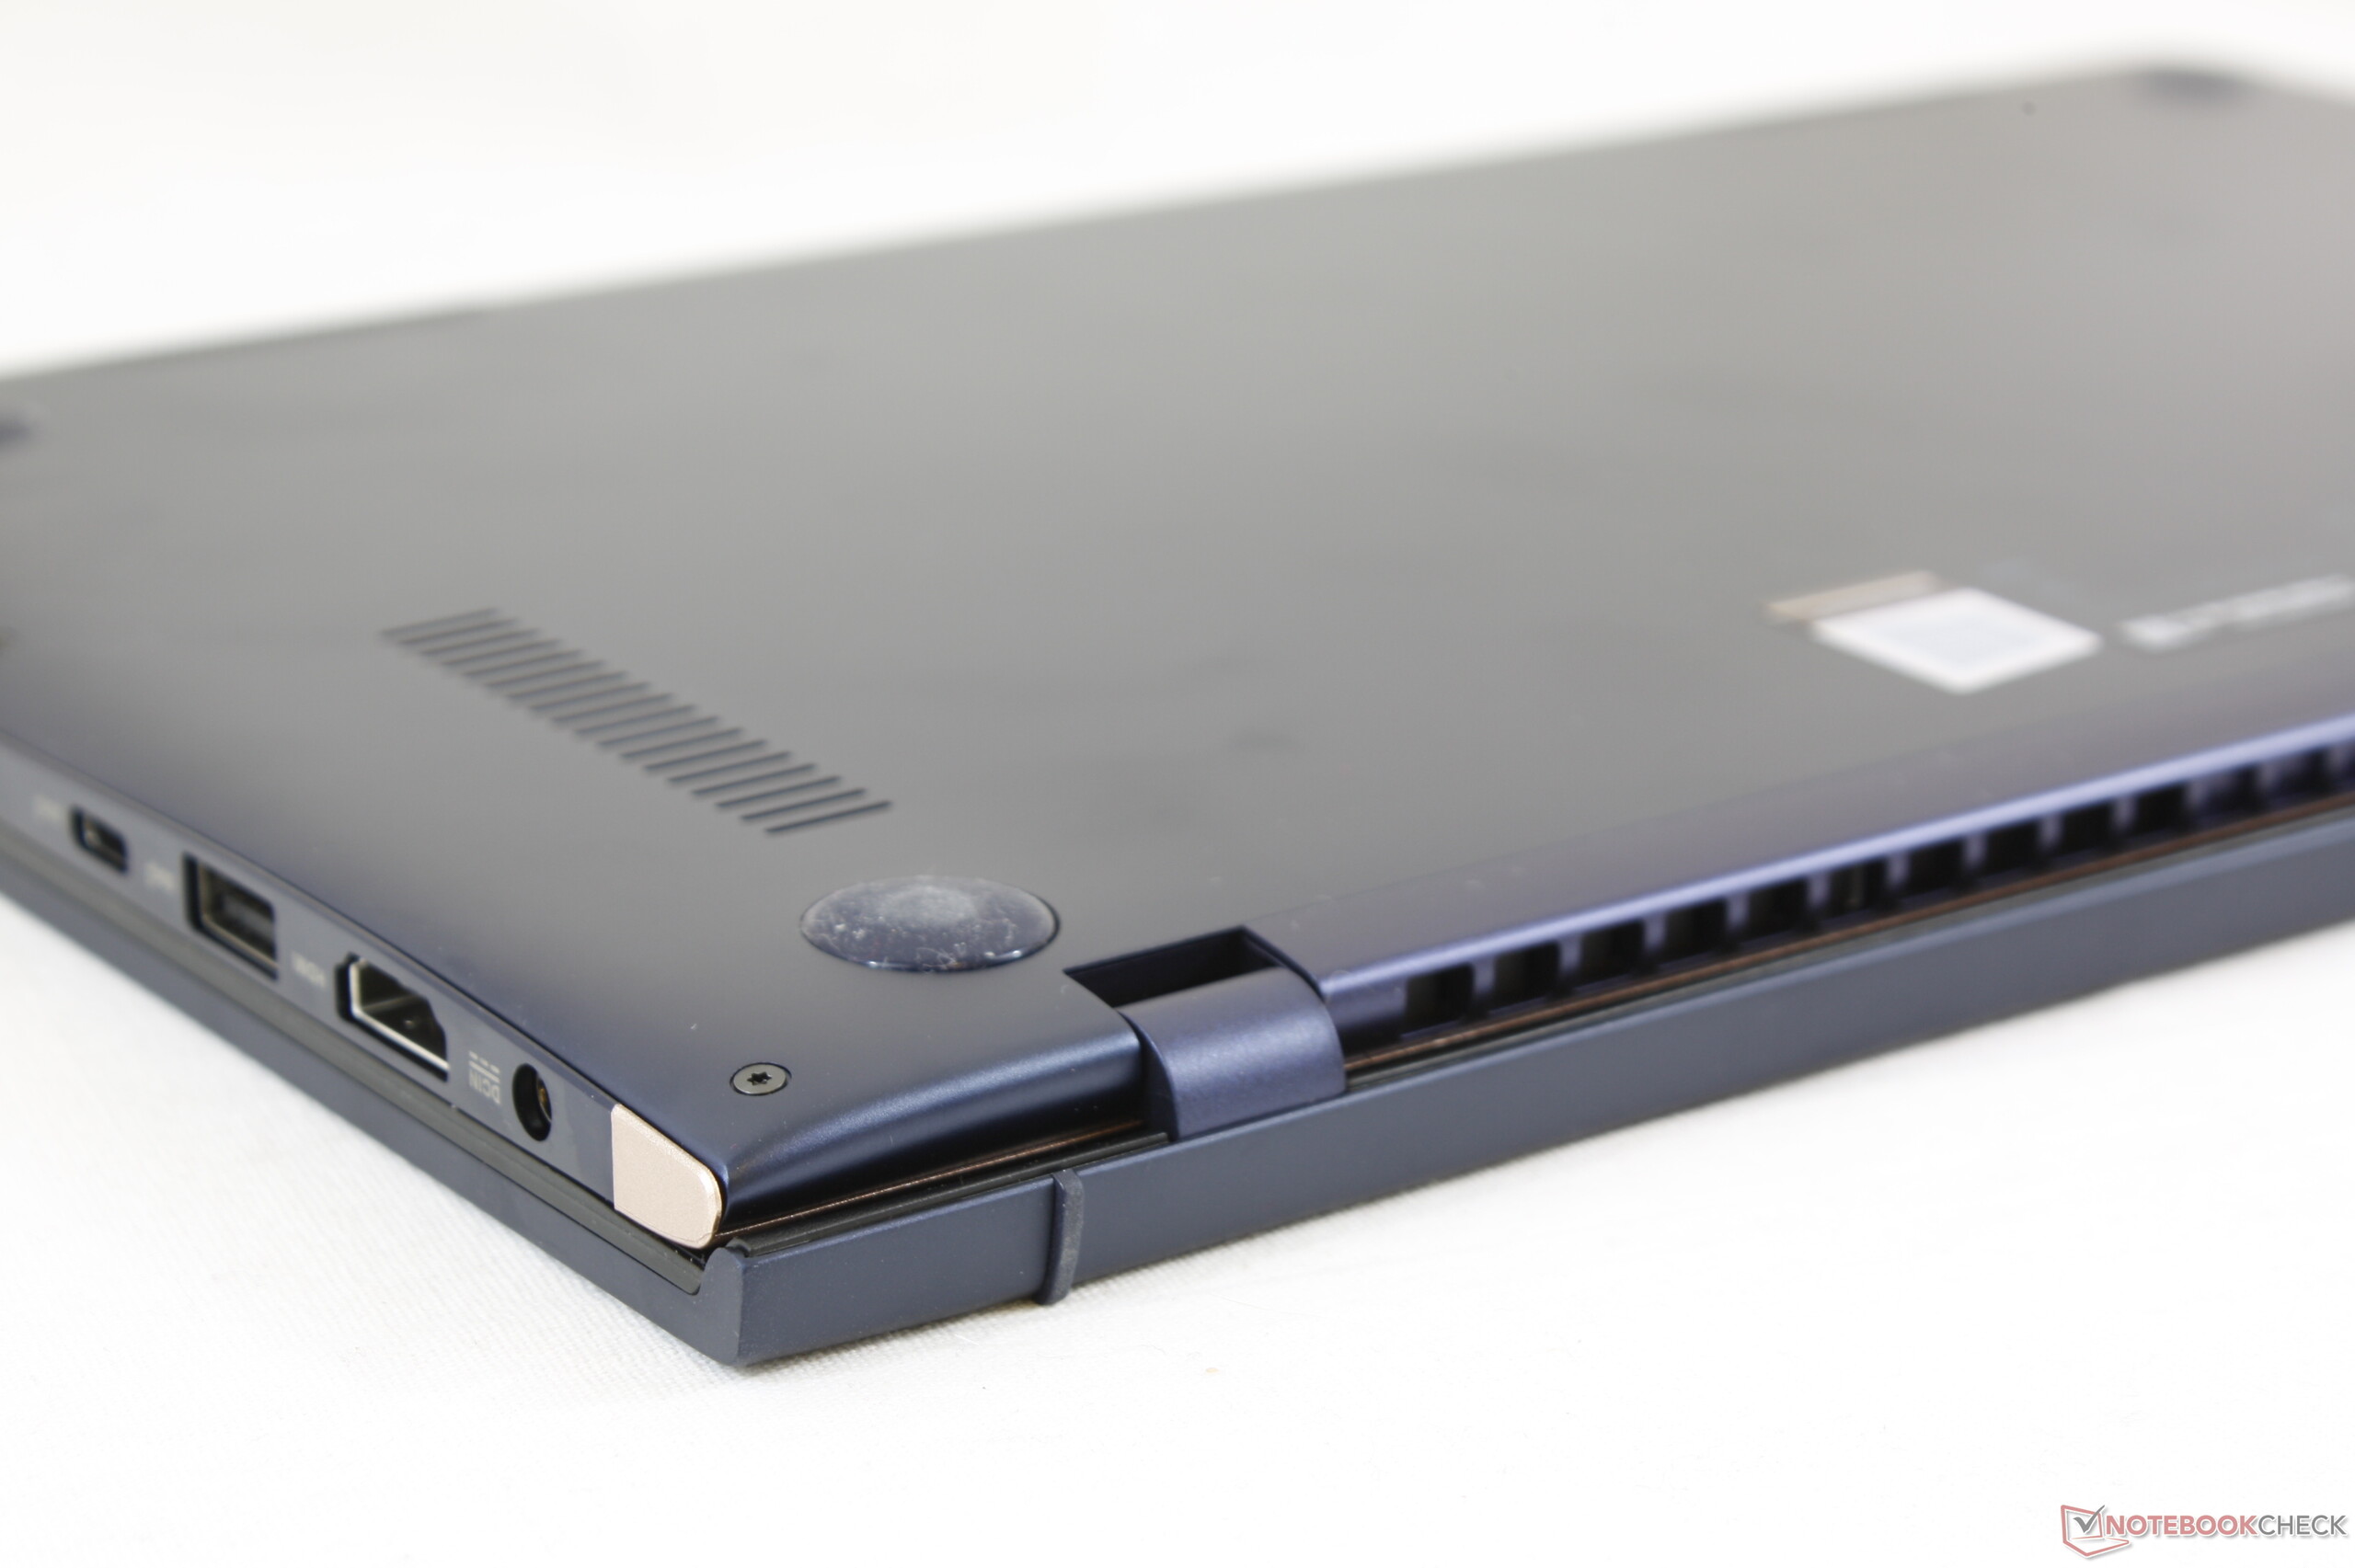
We should also point out that the USB 3.1 Gen 2 Type-C port does not support DisplayPort out or Power Delivery, which is a shame. A Thunderbolt 3 port would have been a waste though because of ASUS’ decision to cripple the UX433FN’s CPU. Overall, the UX433FN would be a decent option for those who want a compact laptop with a dedicated GPU if ASUS fixed the artificial CPU throttling. Currently, we would recommend considering the cheaper UX433FA instead if you do not need a dedicated GPU or at a different option altogether, because the UX433FN has too many compromises to be worth what ASUS is charging.
Asus Zenbook 14 UX433FN-A6023T
-
04/02/2019 v6(old)
Sascha Mölck
More articles related to this device
Asus Zenbook 14 UX433FN-A6023T (ZenBook 14 Series)Related Articles

Pricecompare

