 Deutsch
 English
 Español
 Français
 Italiano
 Nederlands
 Polski
 Português
 Русский
 Türkçe
 Svenska
 Chinese
 Magyar
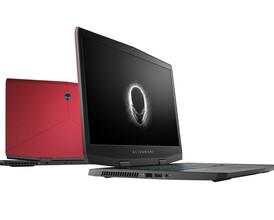
Alienware m15 (i7-8750H, GTX 1070 Max-Q) Laptop Review

Unveiled in October, the Alienware m15 is Dell's answer to the increasing demand for thin-and-light enthusiast gaming laptops made popular by the advent of Nvidia's Max-Q series. The traditional mainline Alienware 13, 15, and 17 series that we've been familiar with all these years just can't compete against the sleeker, sharper, and lighter MSI GS65, Asus Zephyrus GX501/GX531, Gigabyte Aero 15X, or Razer Blade 15 that have since appeared. Thus, pressure was on Dell to shrink the Alienware 15 form factor into something more bite-sized and the result is what we have here today in our labs.
As of this writing, SKUs are limited to the Core i7-8750H CPU with either GTX 1060 standard or GTX 1070 Max-Q graphics and a potential for GTX 1080 by early next year. Display options range from 1080p60 to 1080p144 or 2160p60 (or 4K UHD). Our test unit on hand is the upper mid-range SKU retailing for about $1900 USD.
Dell has made it clear that the Alienware m15 is its own series and that it will not replace the existing Alienware 15 lineup anytime soon. Even so, we'll be comparing it directly to the Alienware 15 R4 to catch the pros and cons of the smaller chassis as well the aforementioned ultra-thin alternatives that the new Alienware is competing with.
More Alienware reviews:
Case
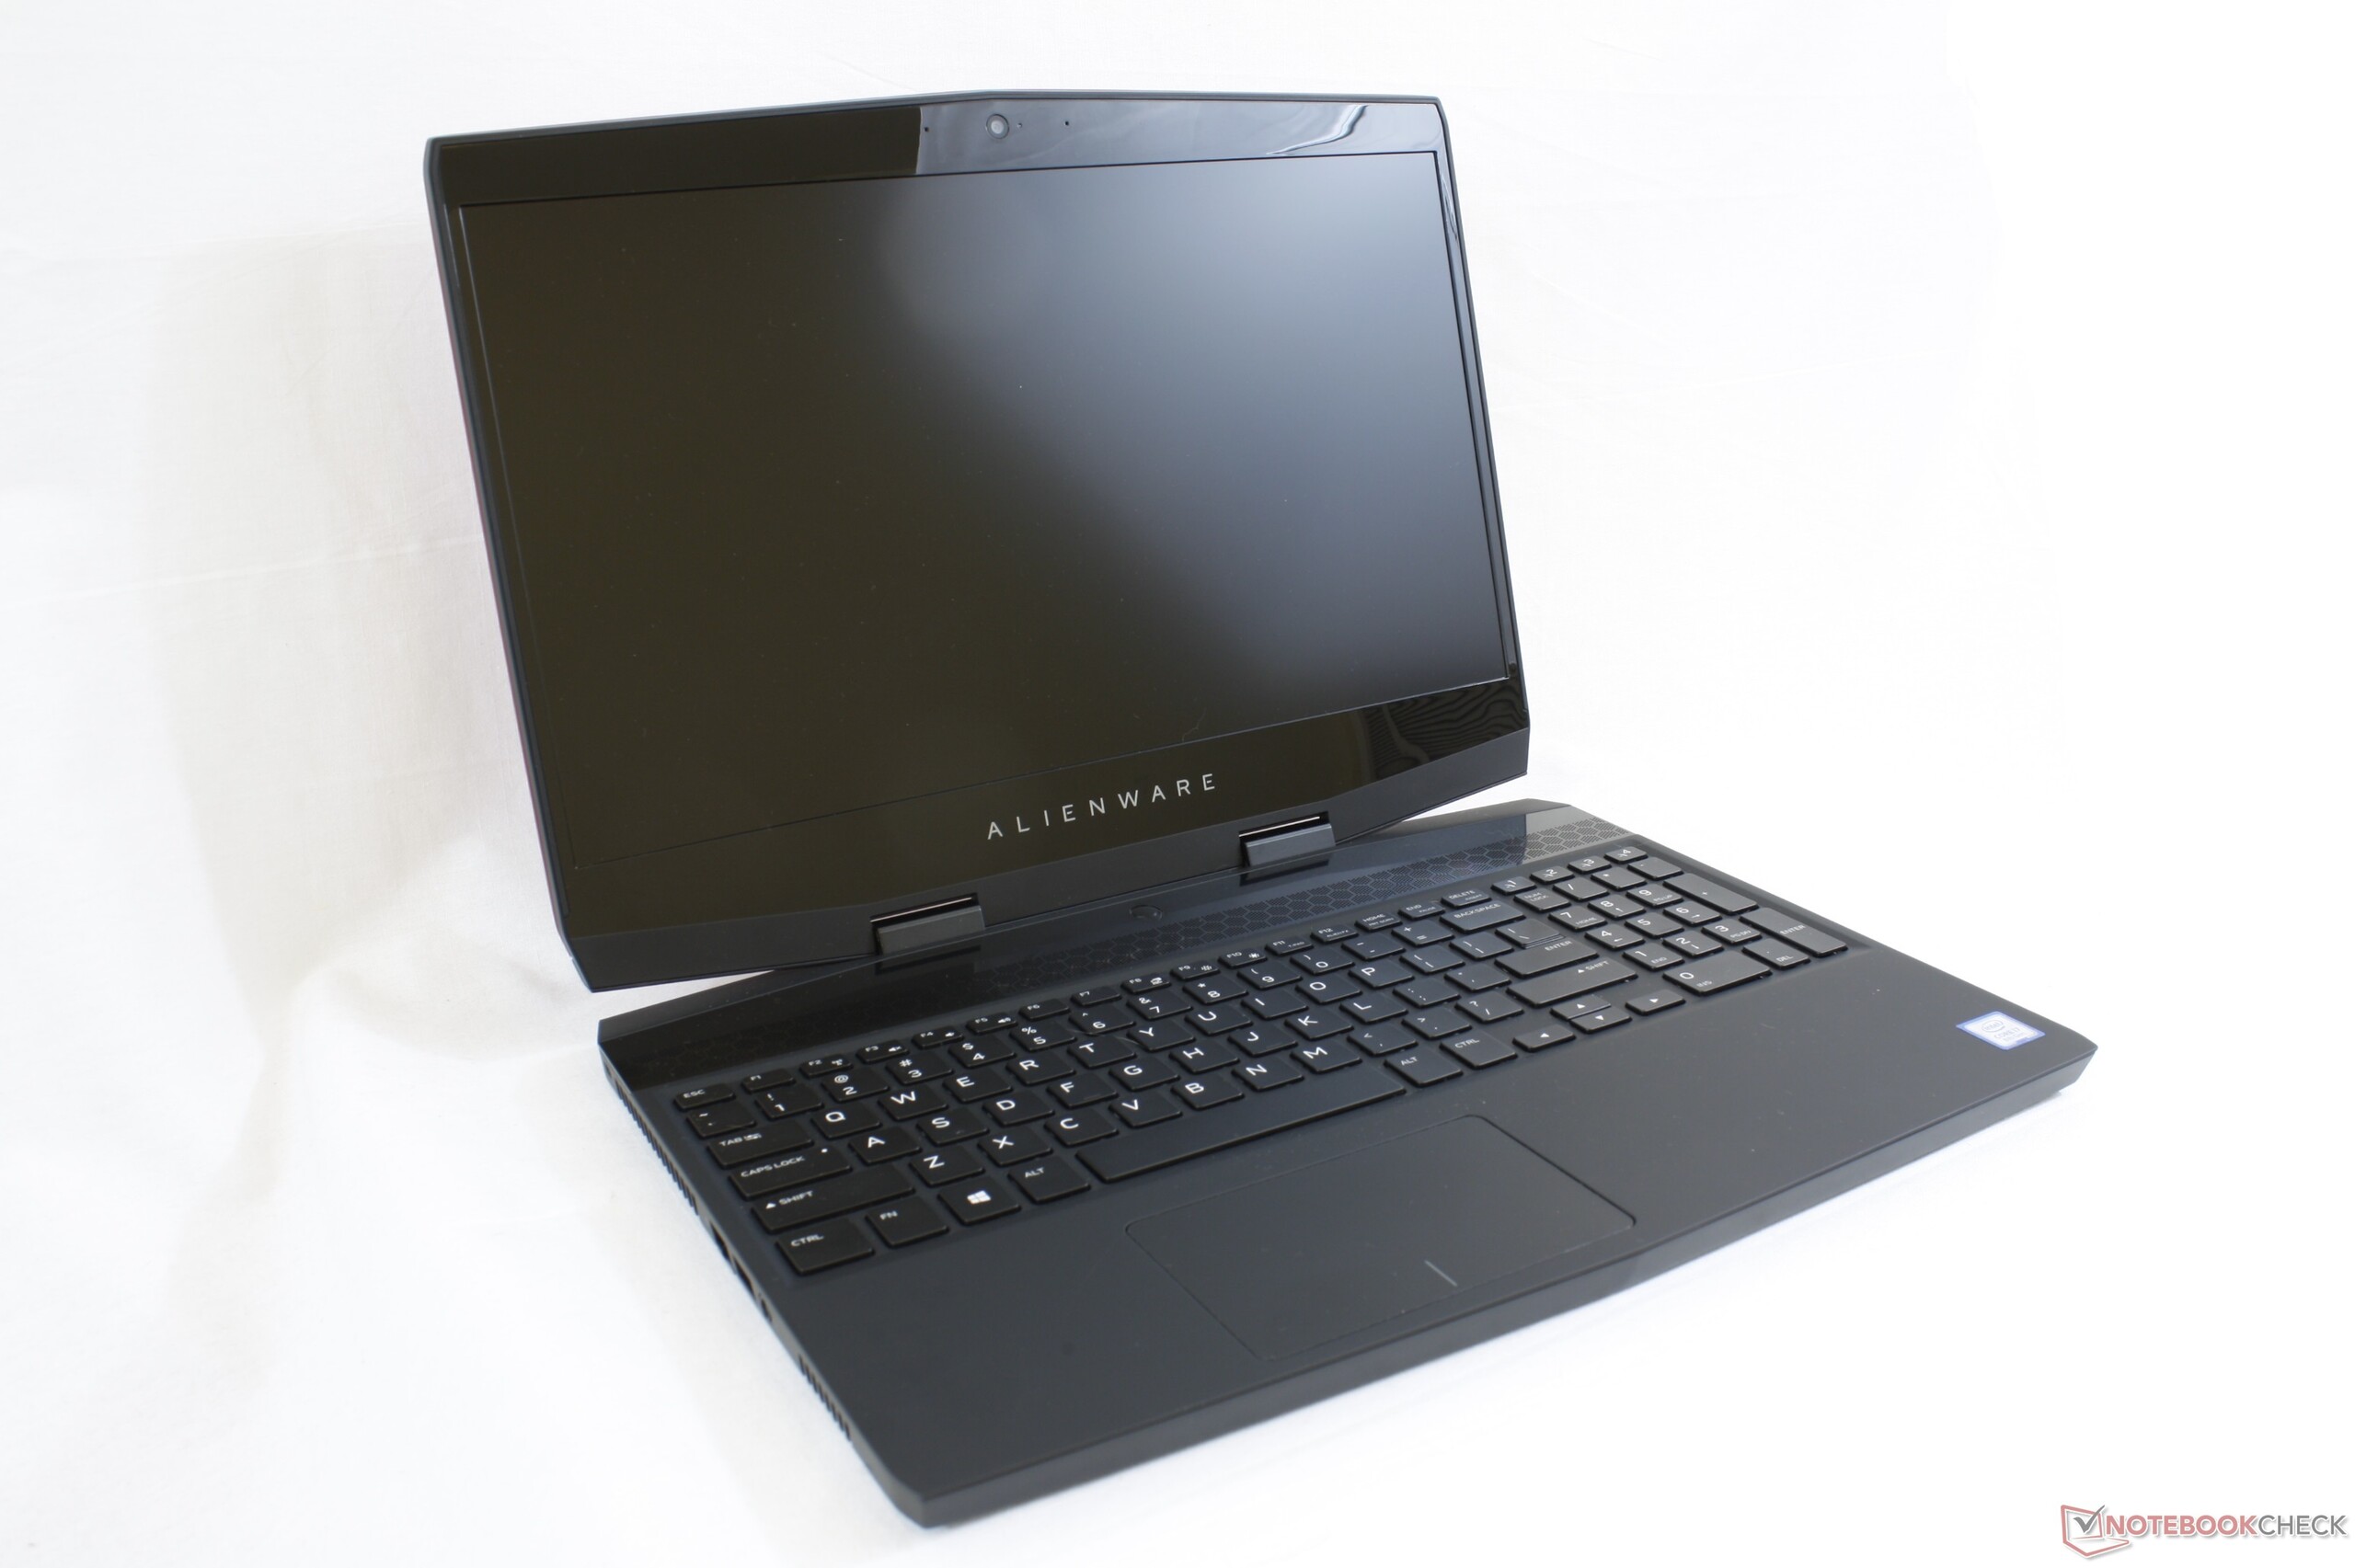
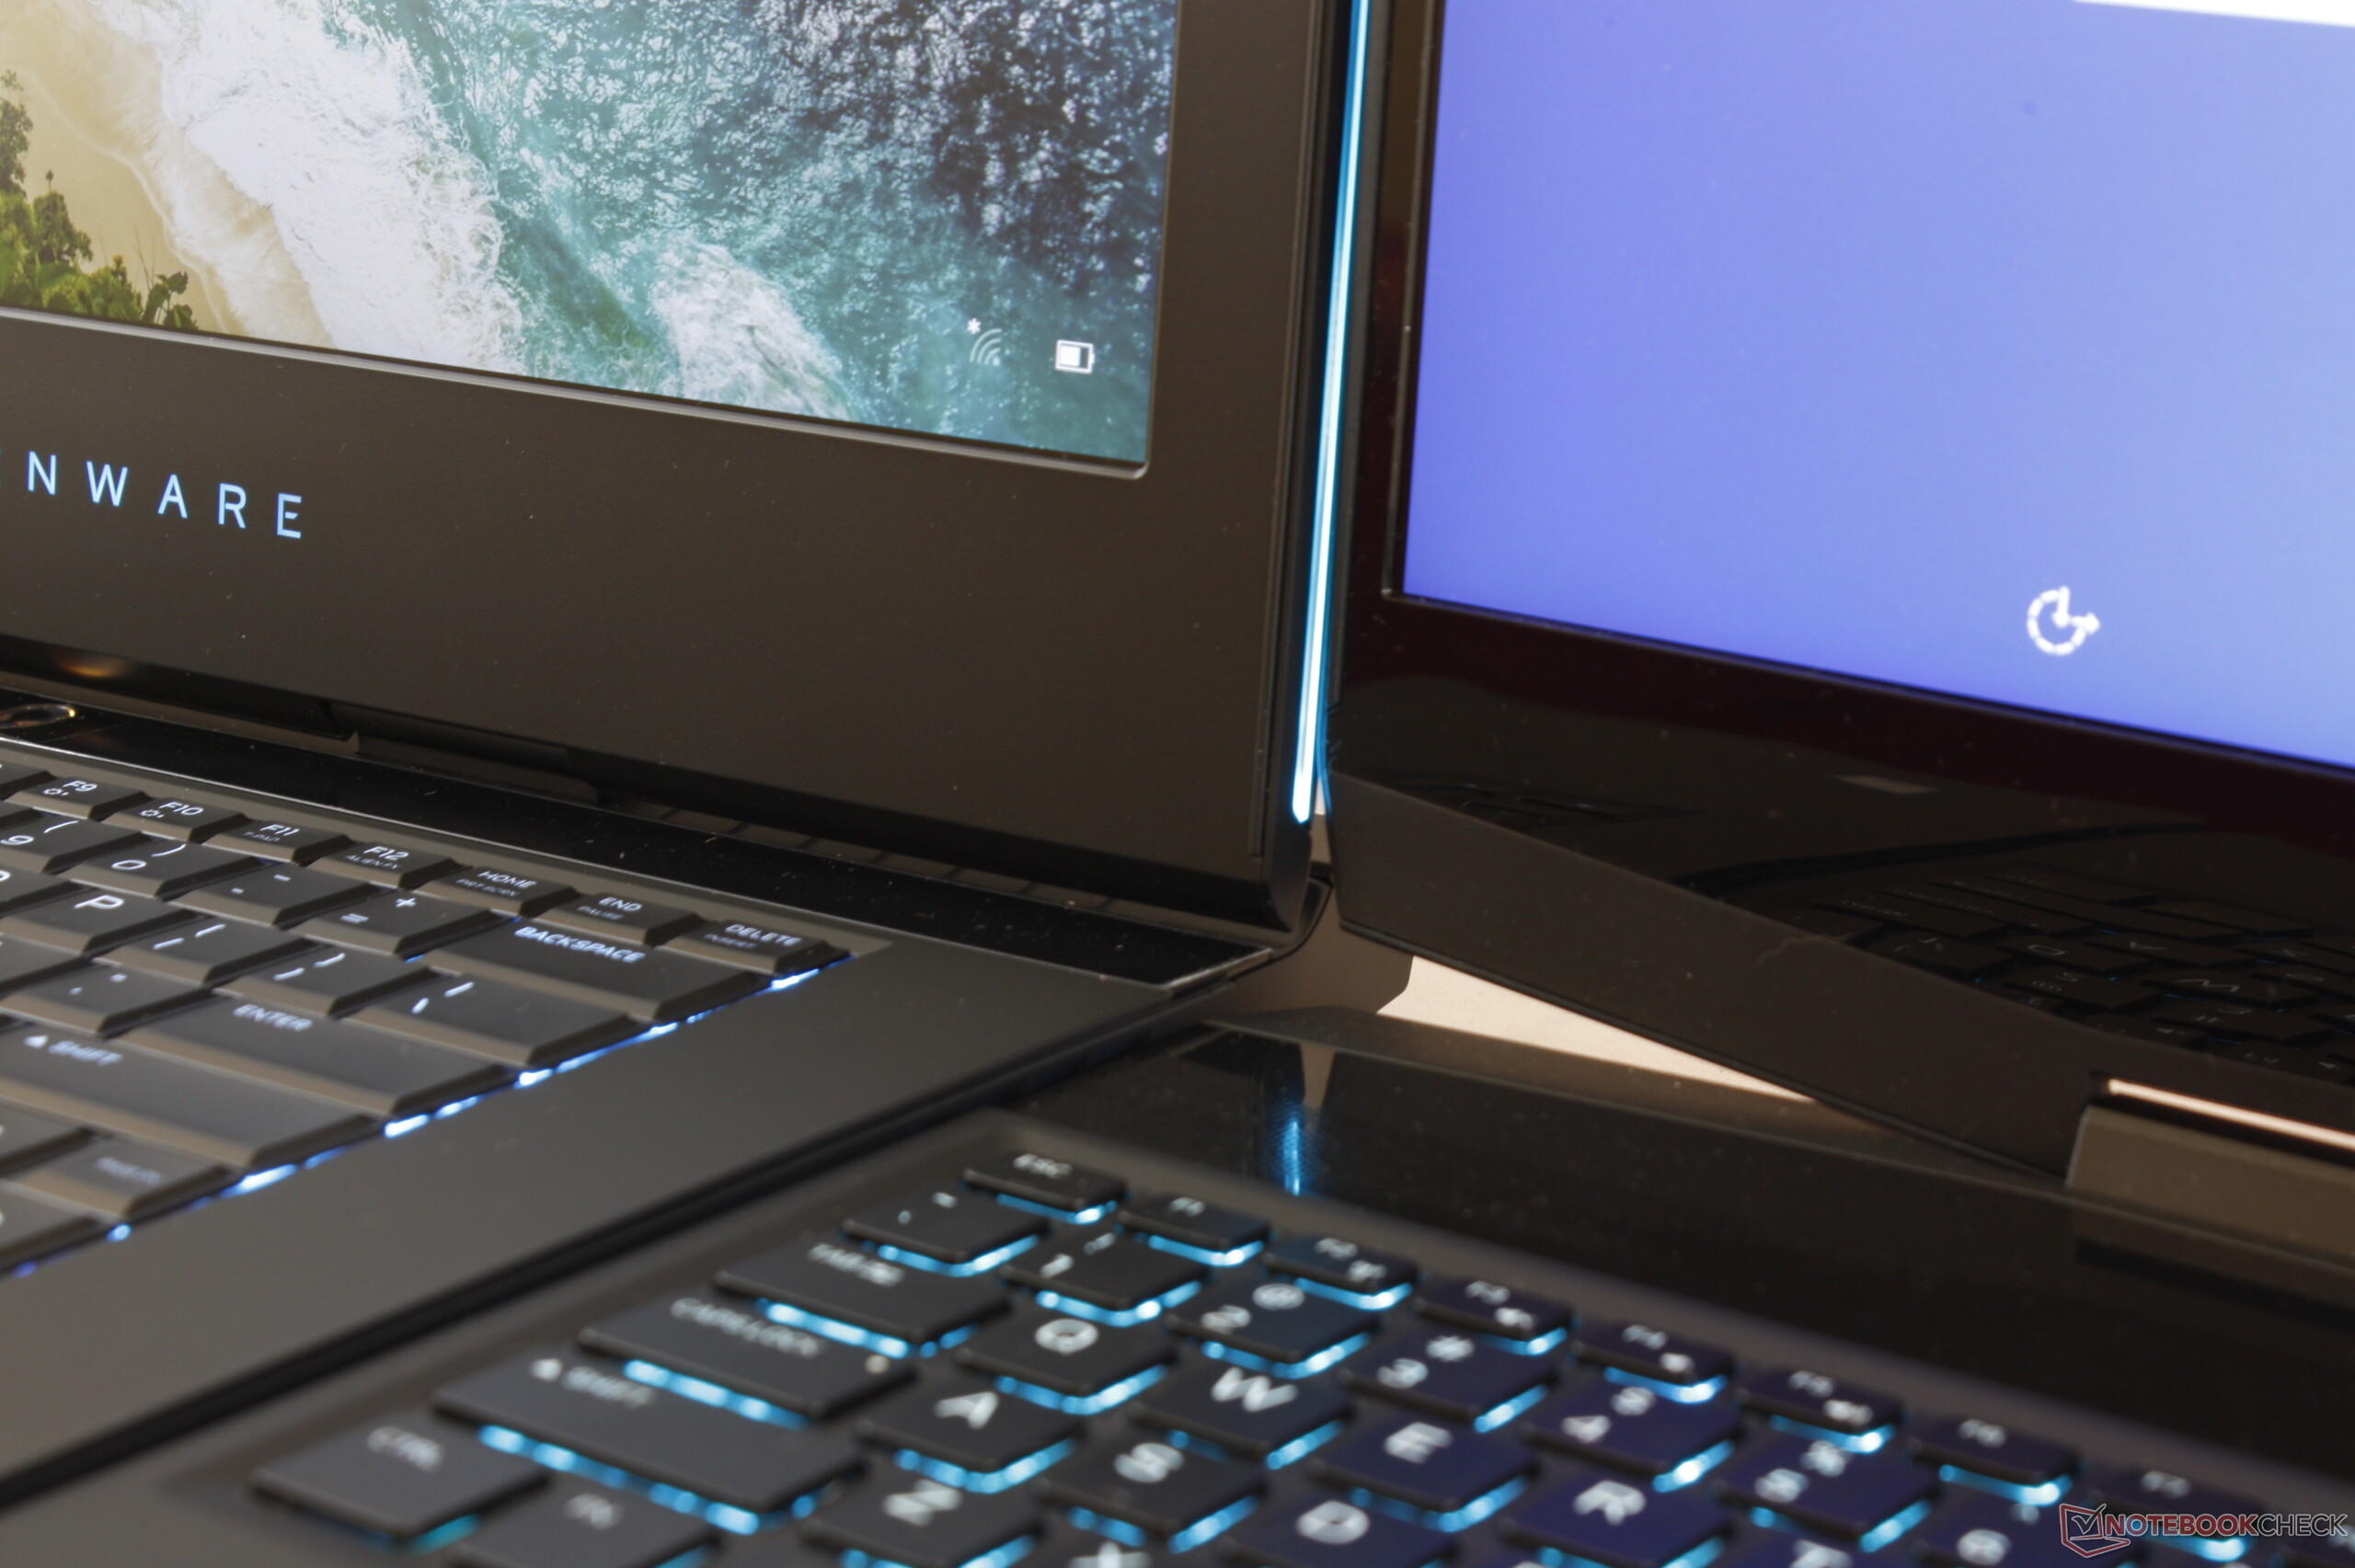
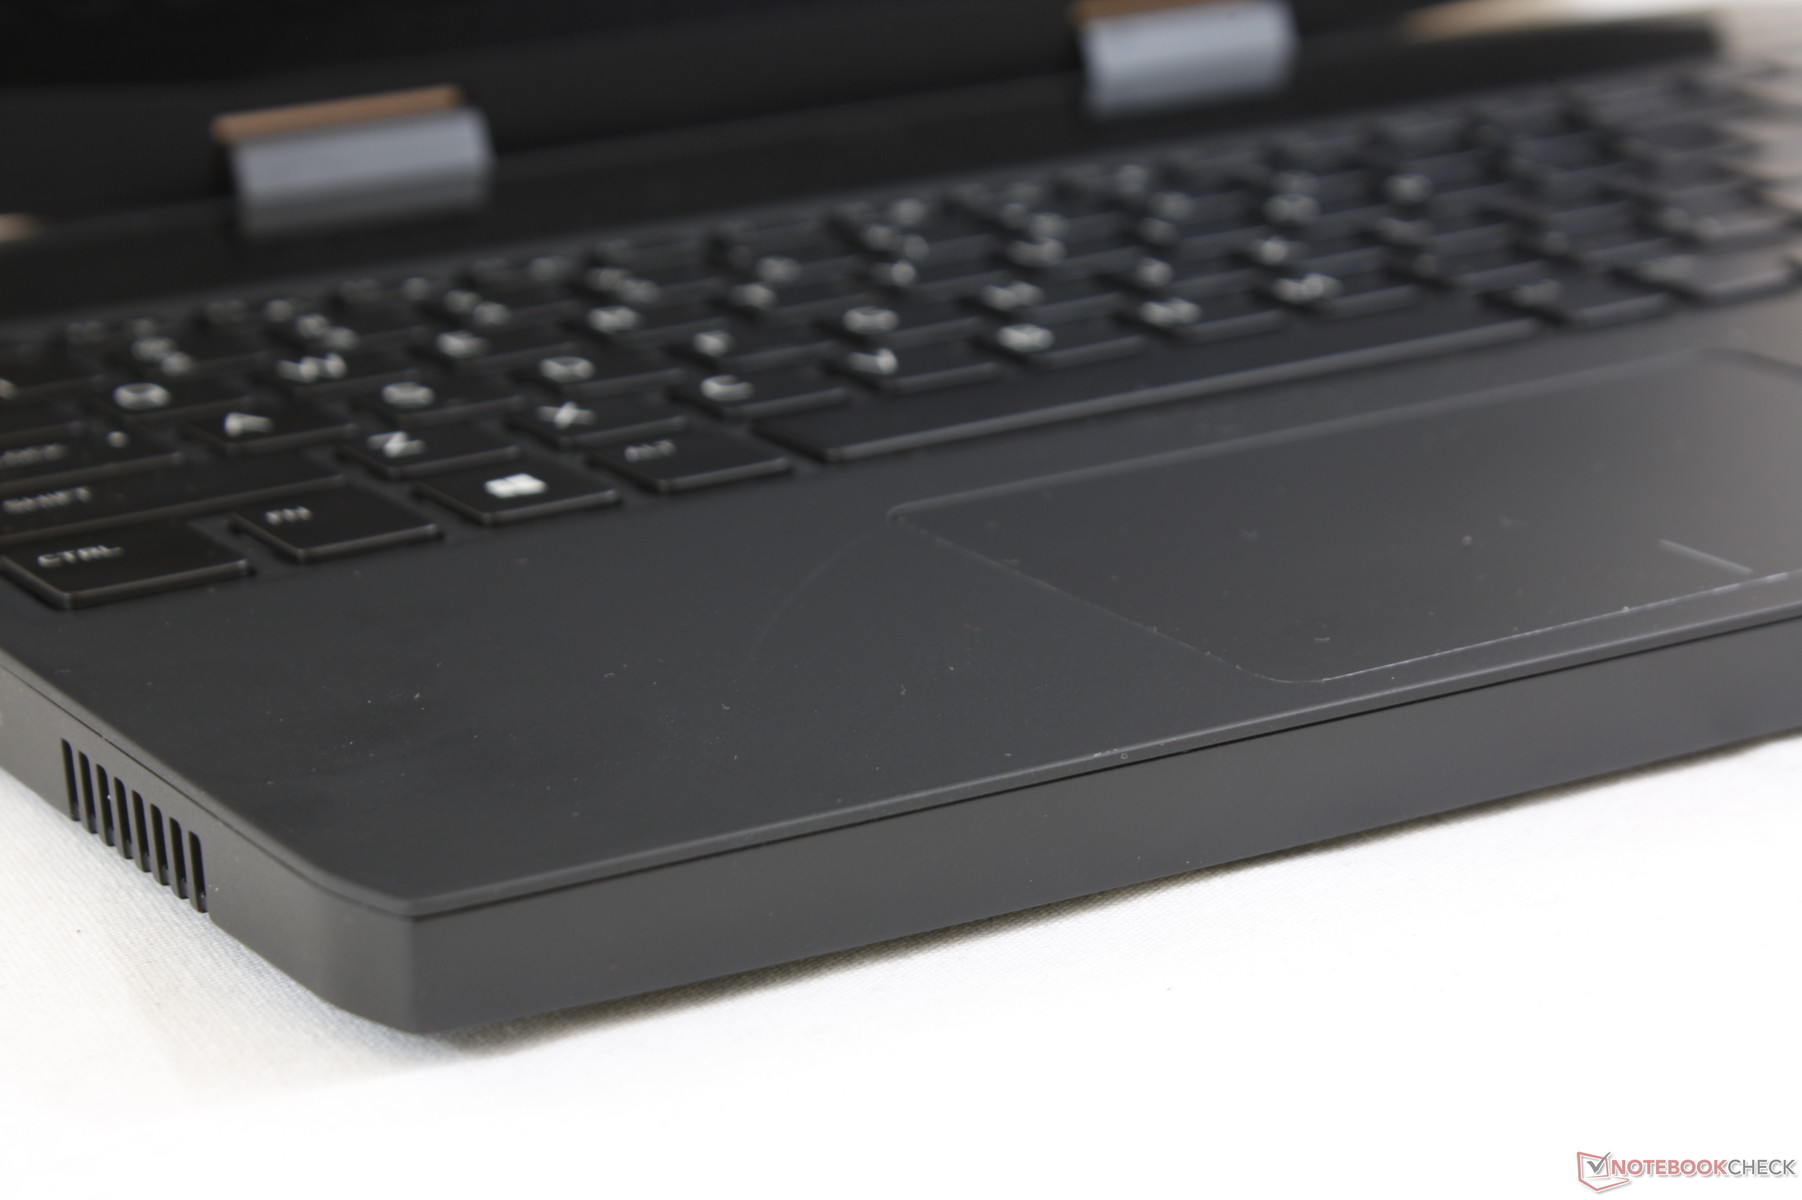
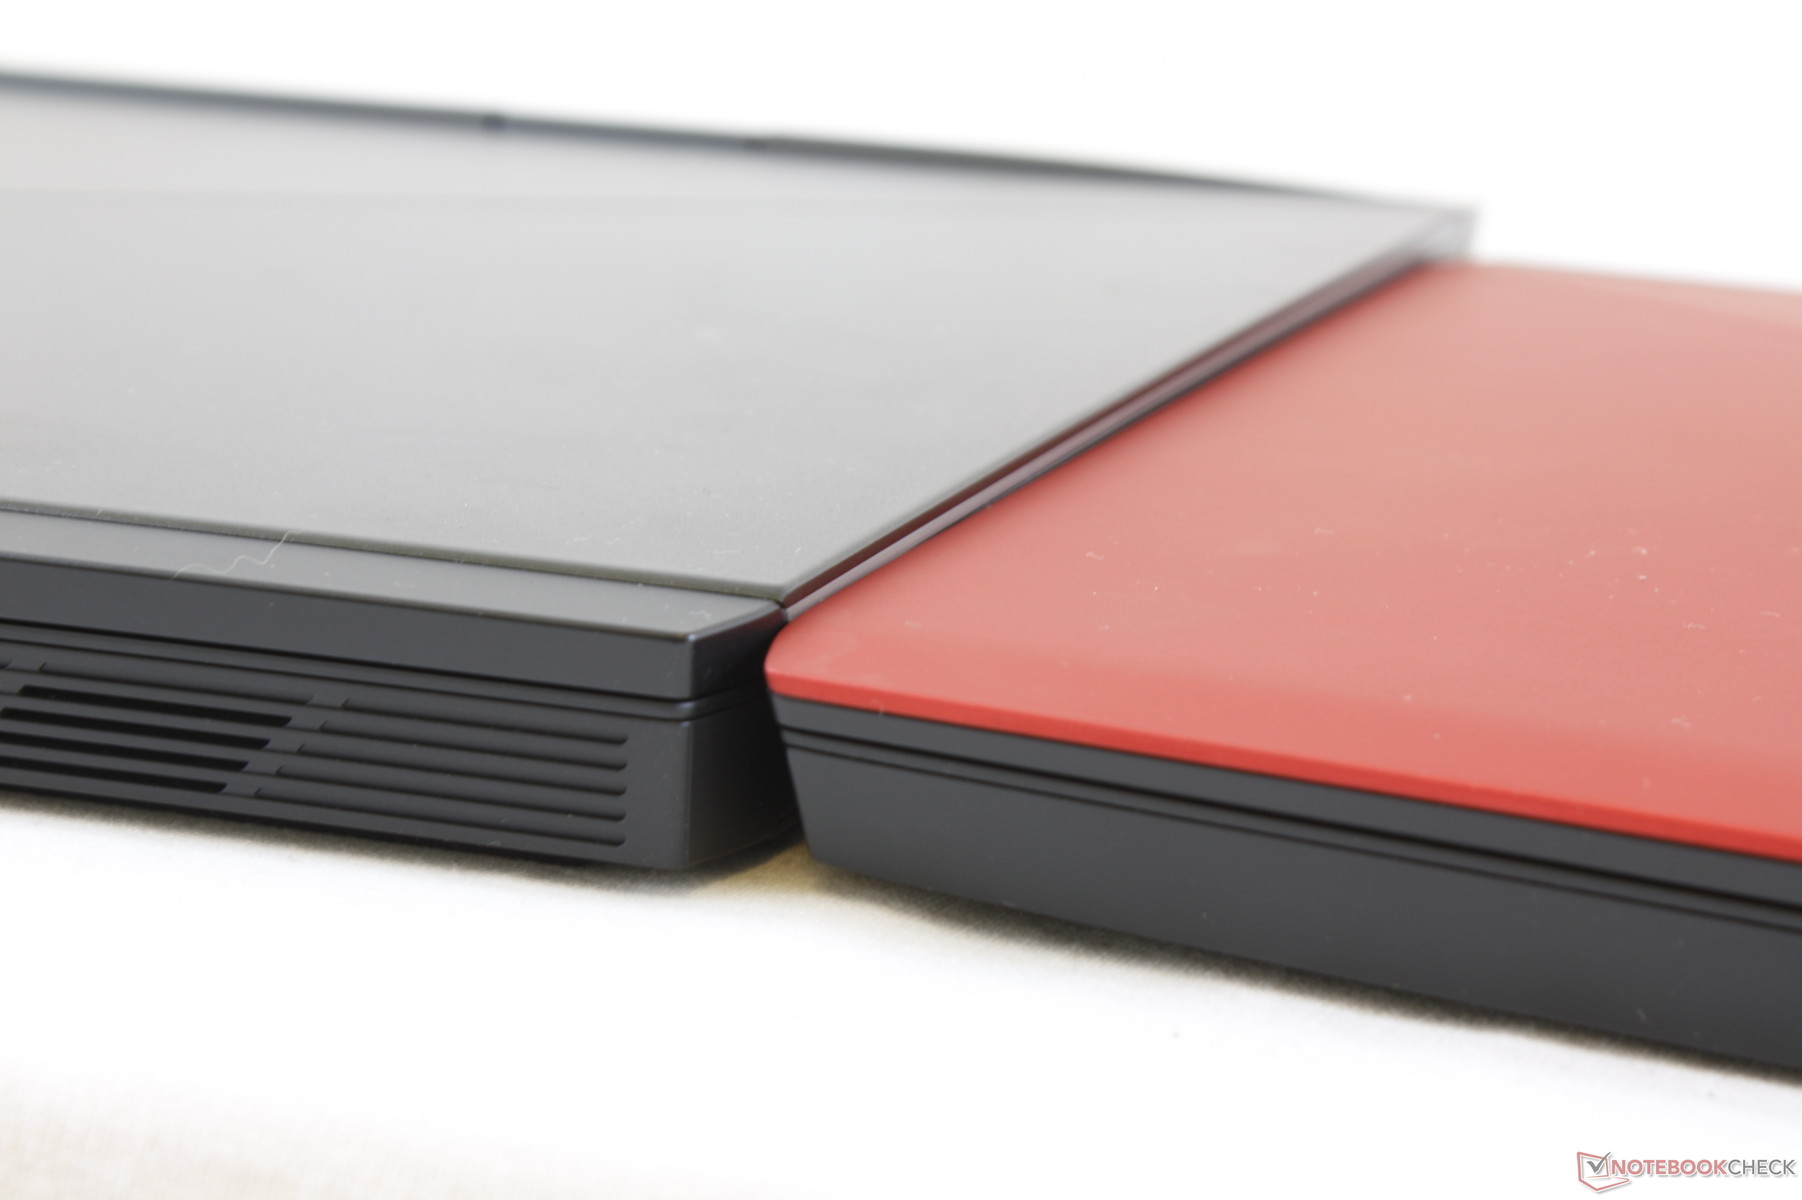
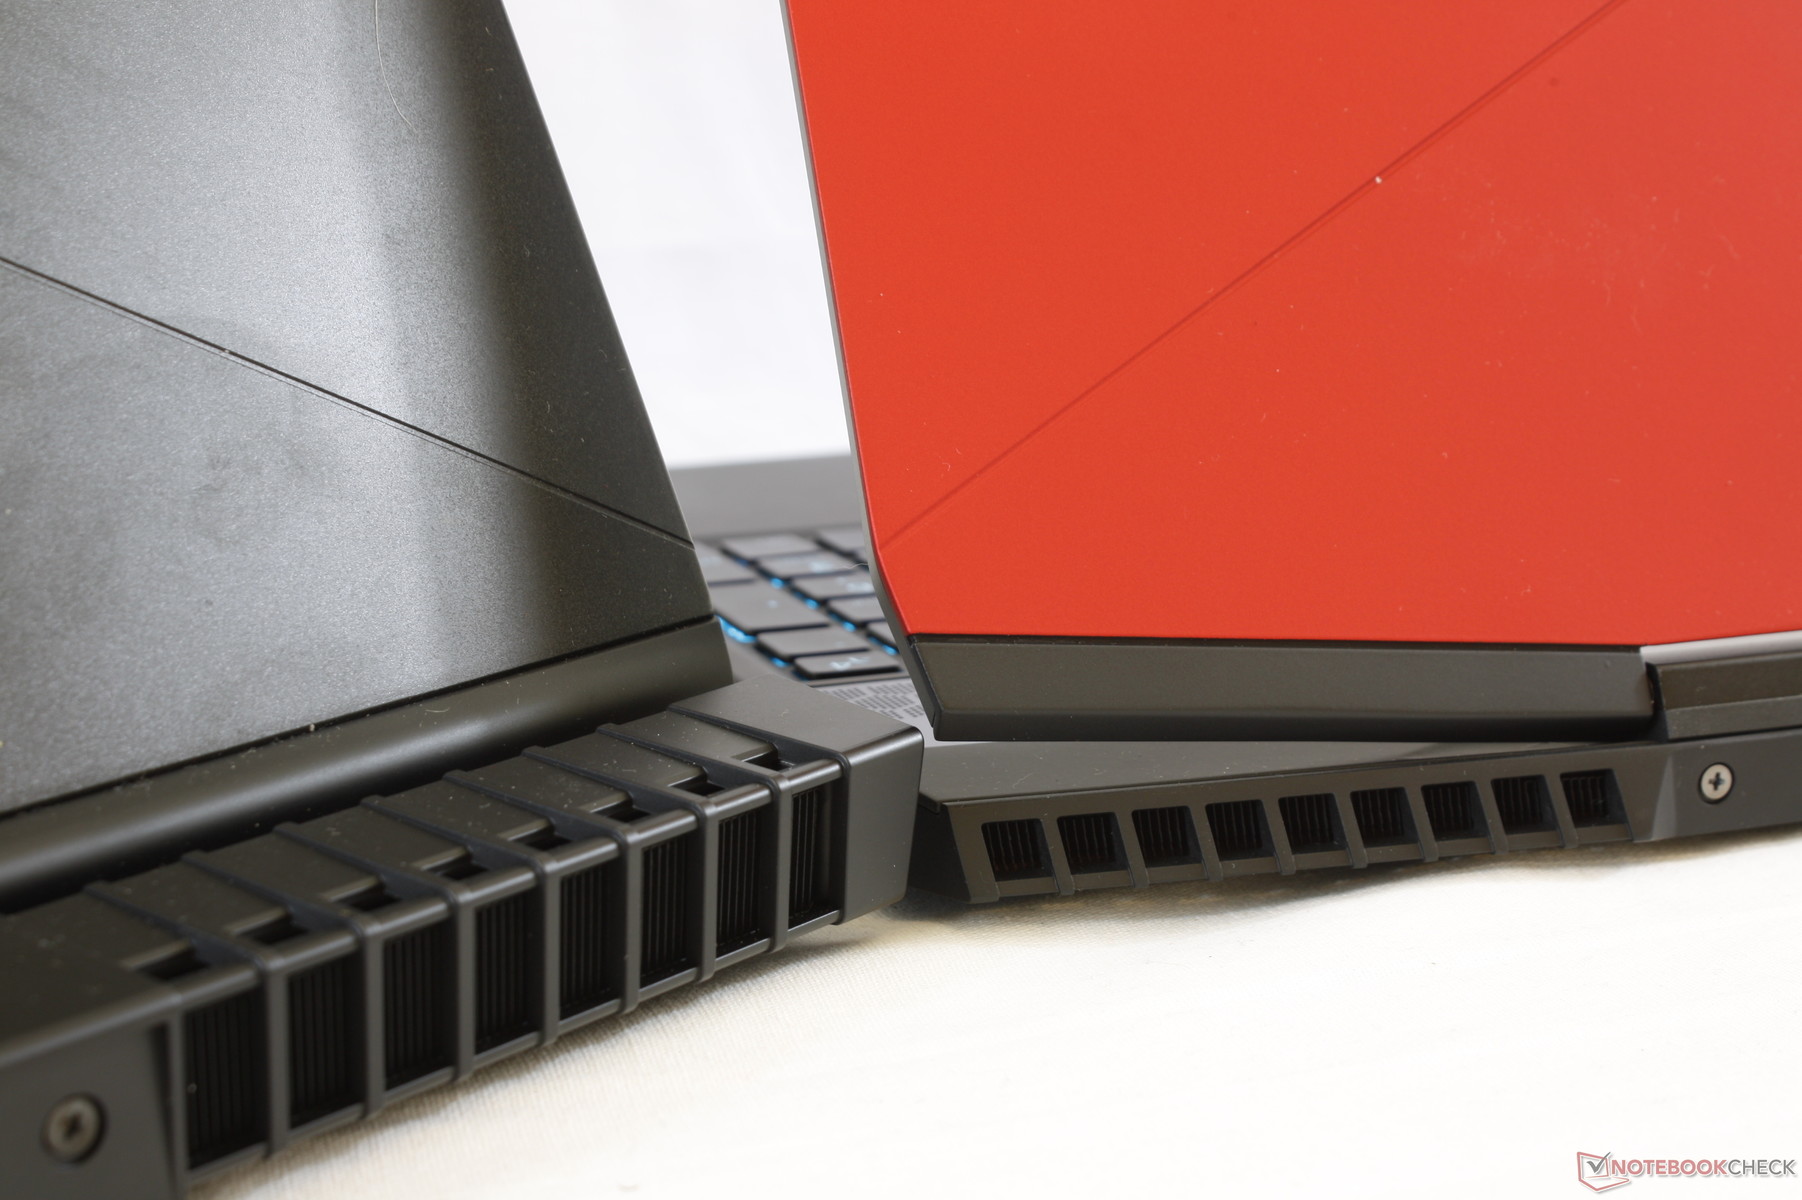
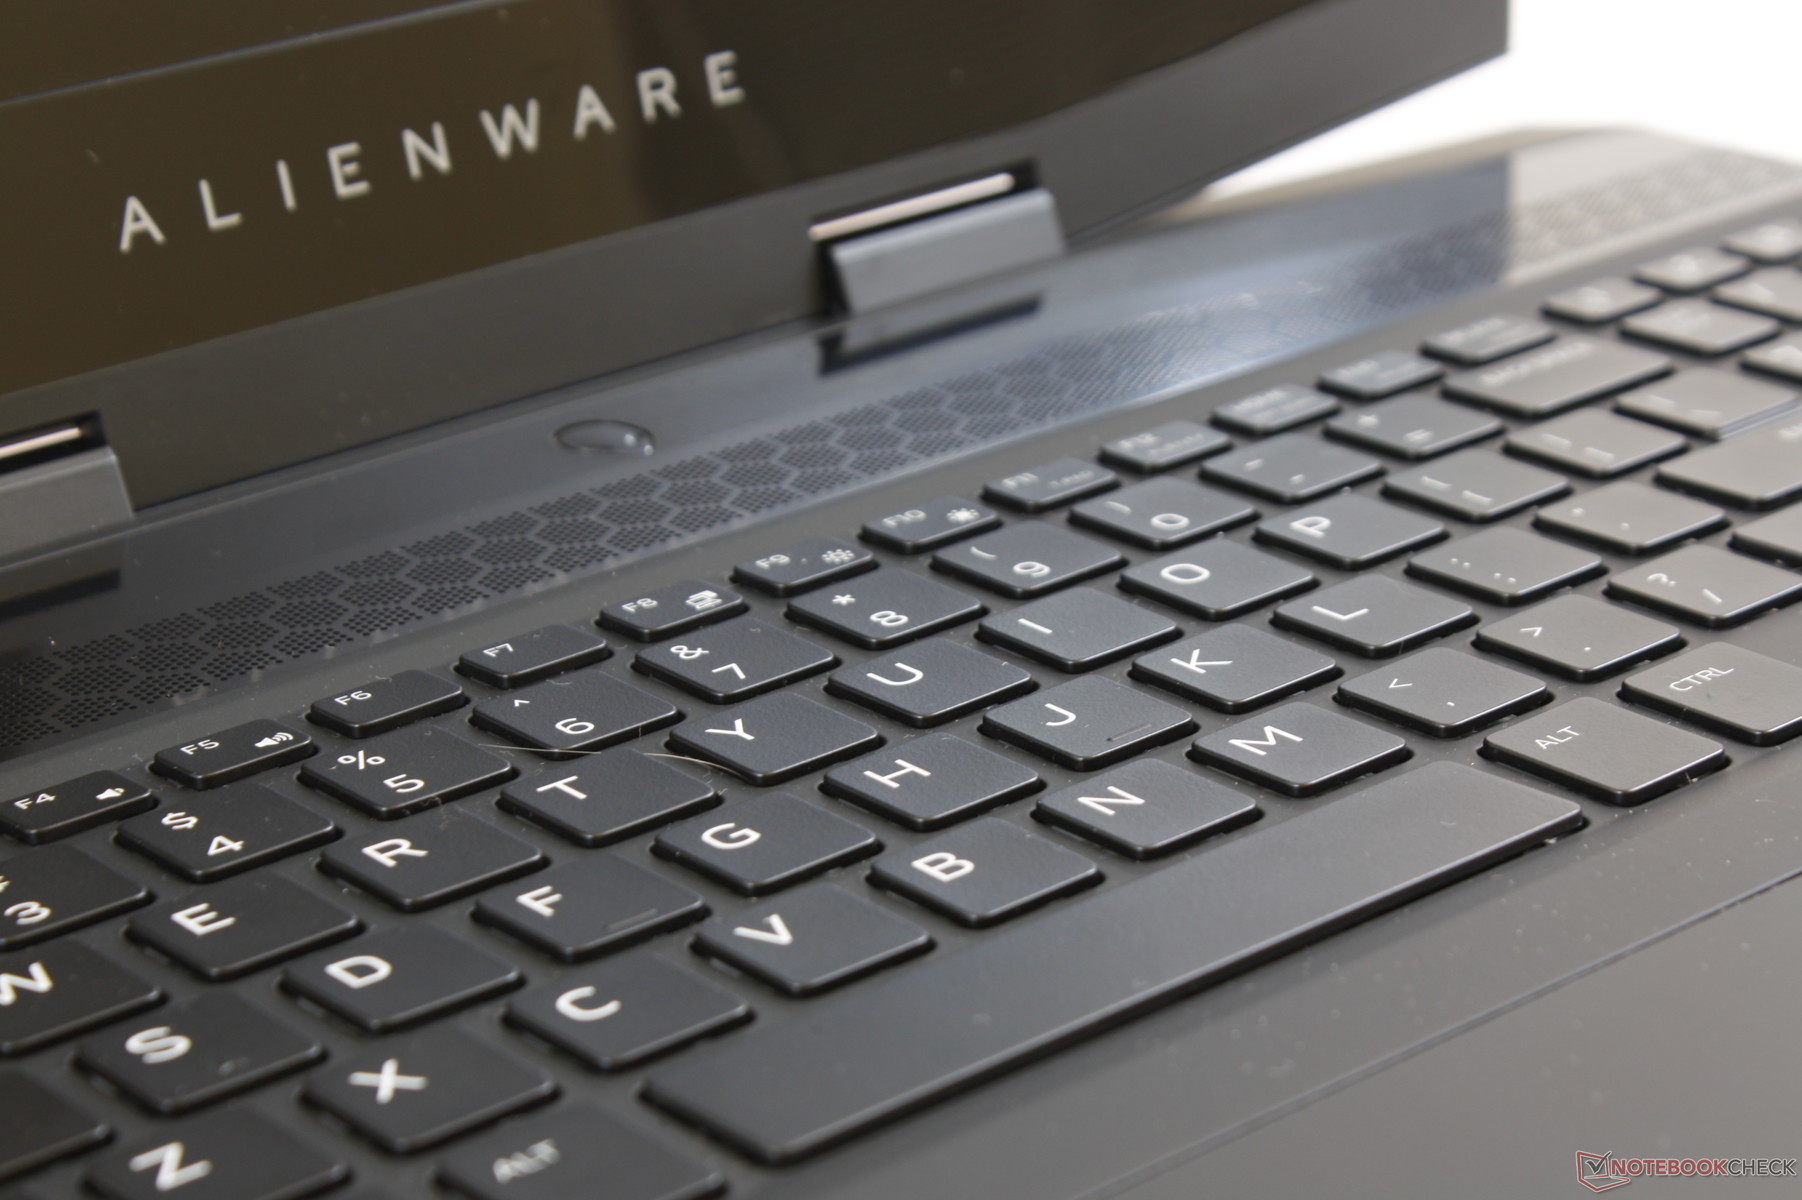
With both the Alienware 15 R4 and Alienware m15 on hand, we can directly compare Dell's new ultrathin design to the original. In short, the m15 comes close in terms of rigidity with its excellent torsional resistance around the thinner base and smaller lid. It's slightly more flexible overall, but creaking is minimal at worst for a firm and high quality impression much like on the original series. Where it's noticeably weaker is the center of its chiclet keyboard as it is slightly more susceptible to flexing than the beveled keyboard of the Alienware 15 R4. Beyond that, we're thoroughly impressed at how Alienware has managed to create a thin-and-light notebook while maintaining a strong first impression.
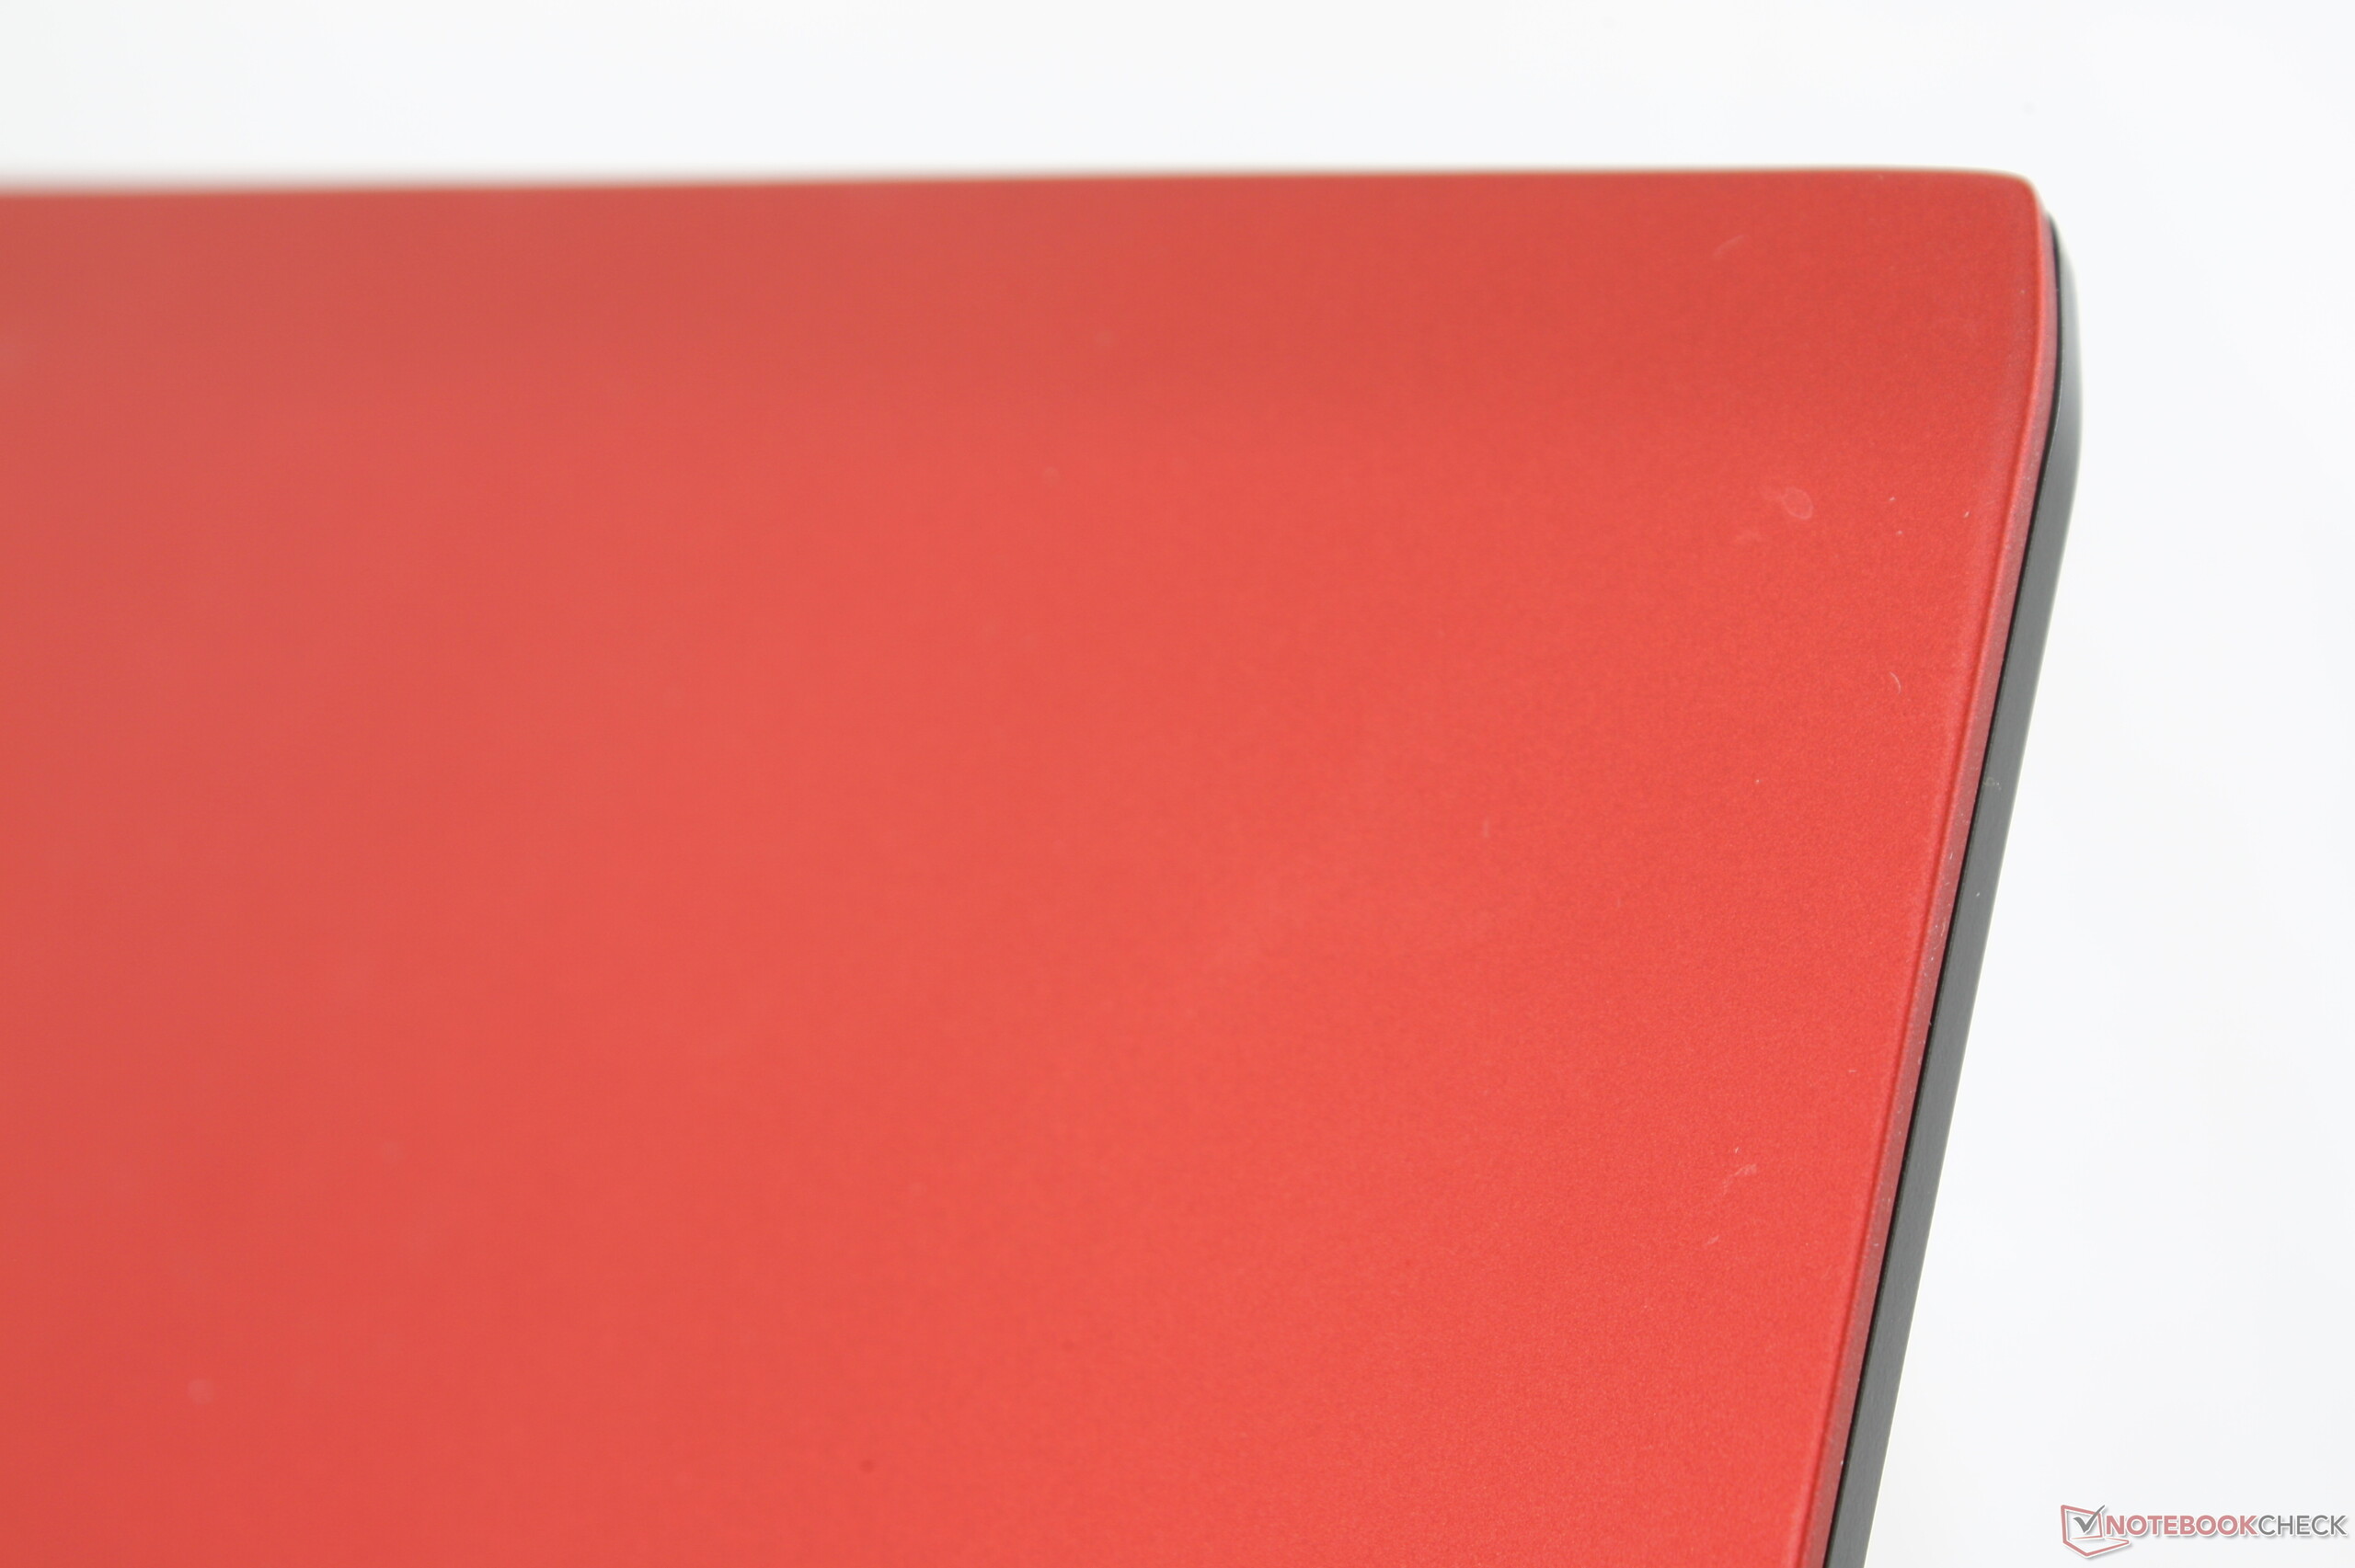
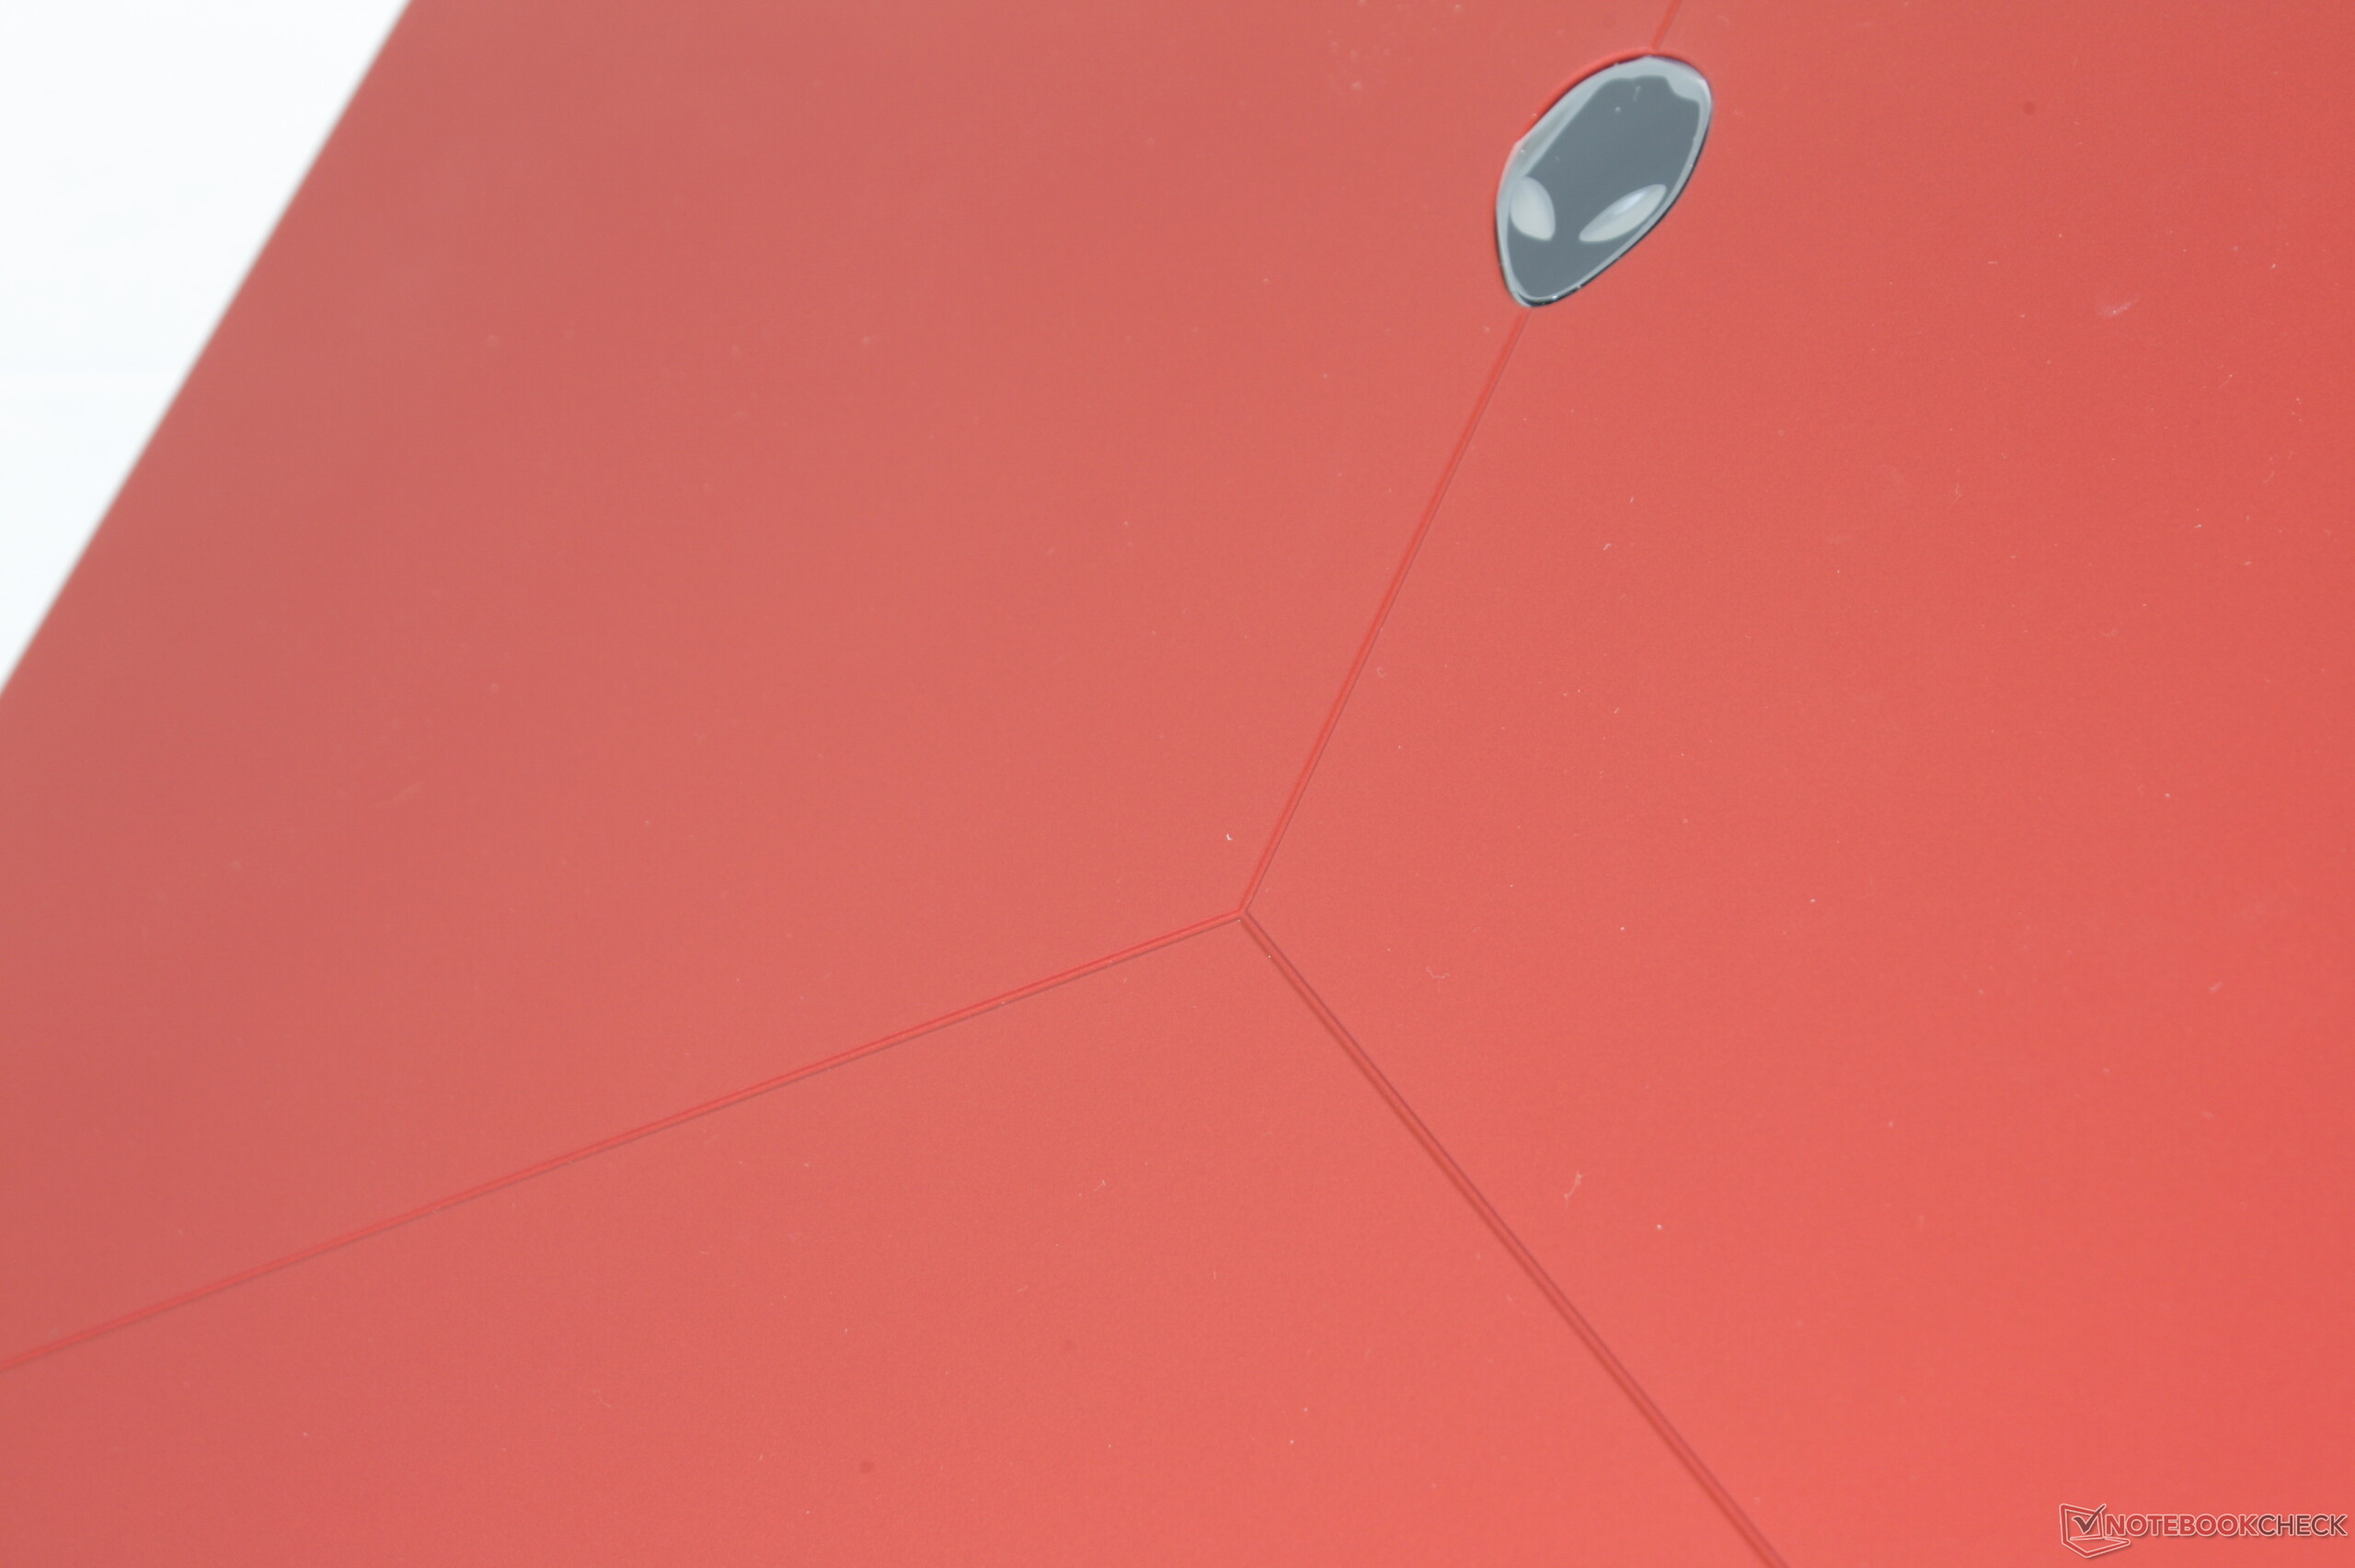
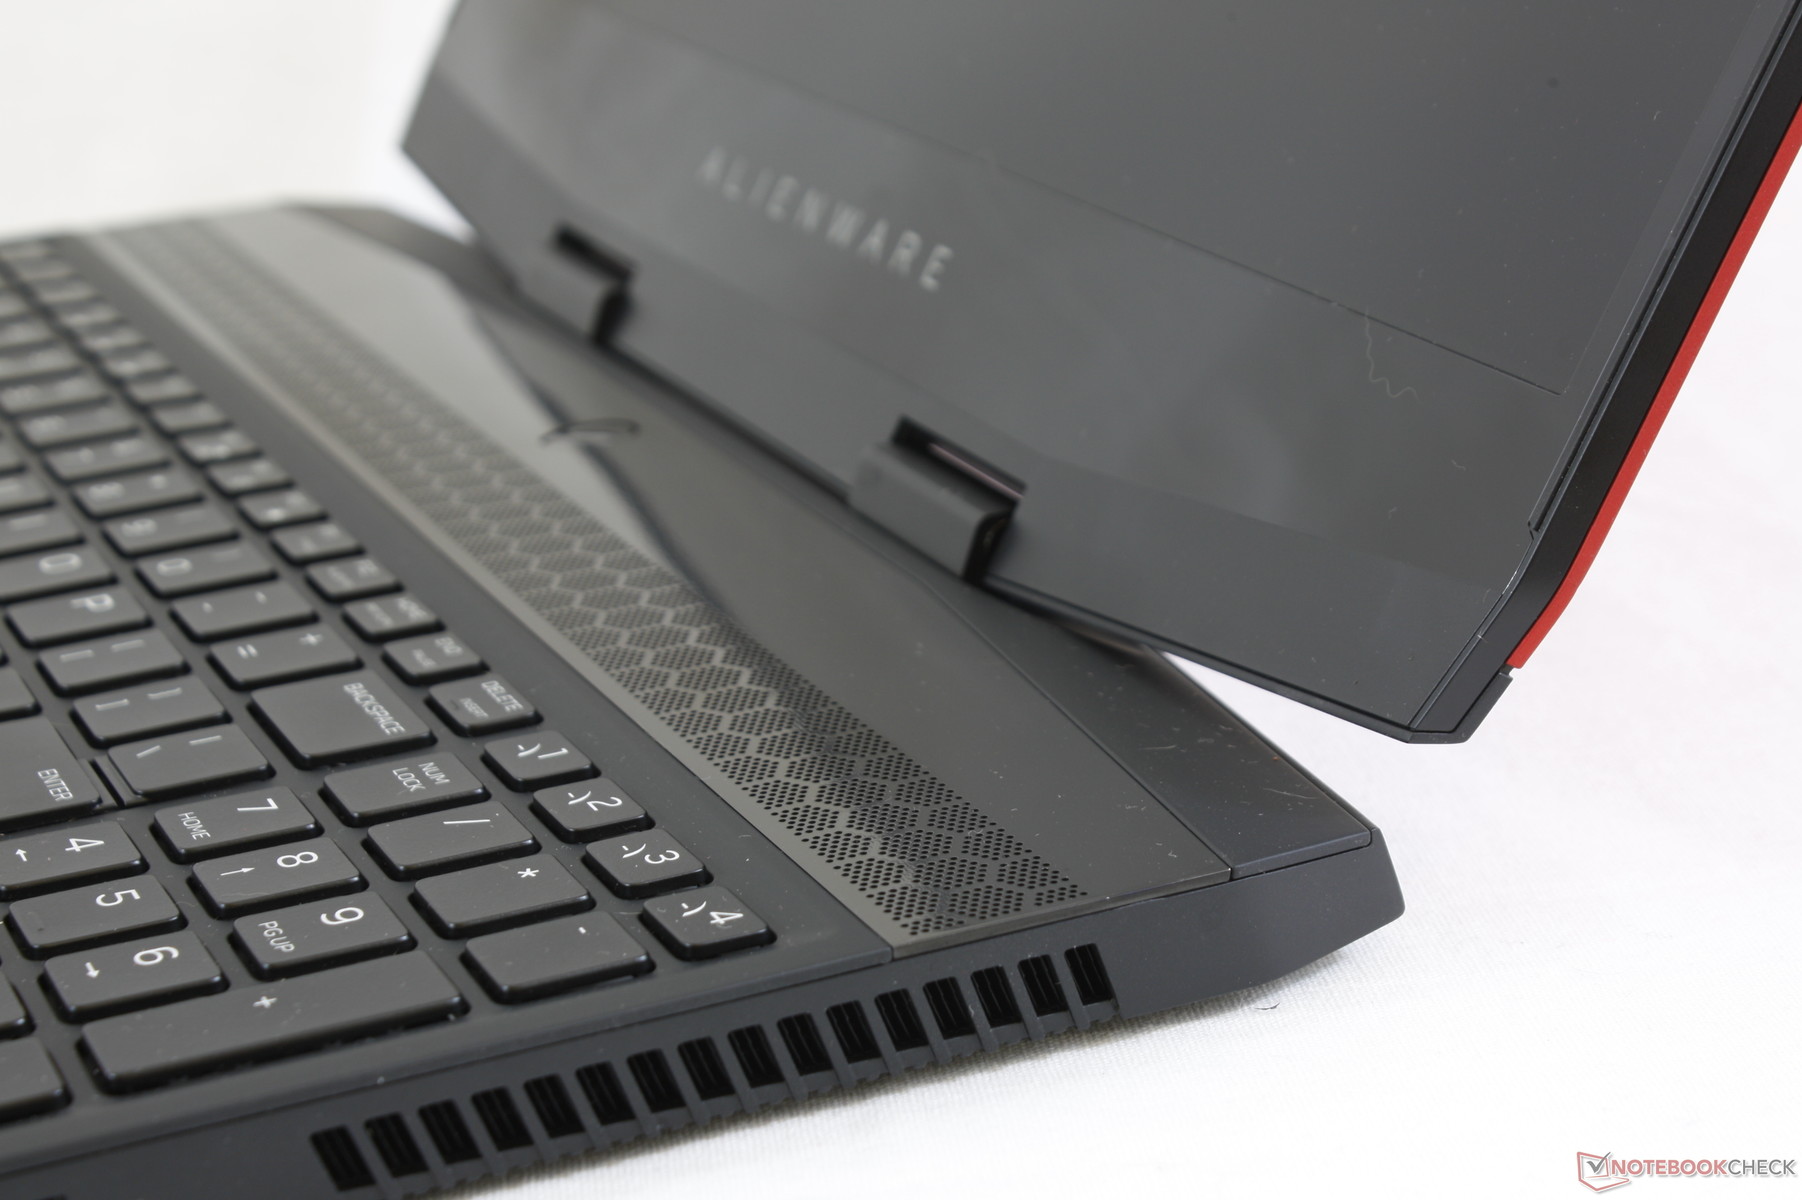
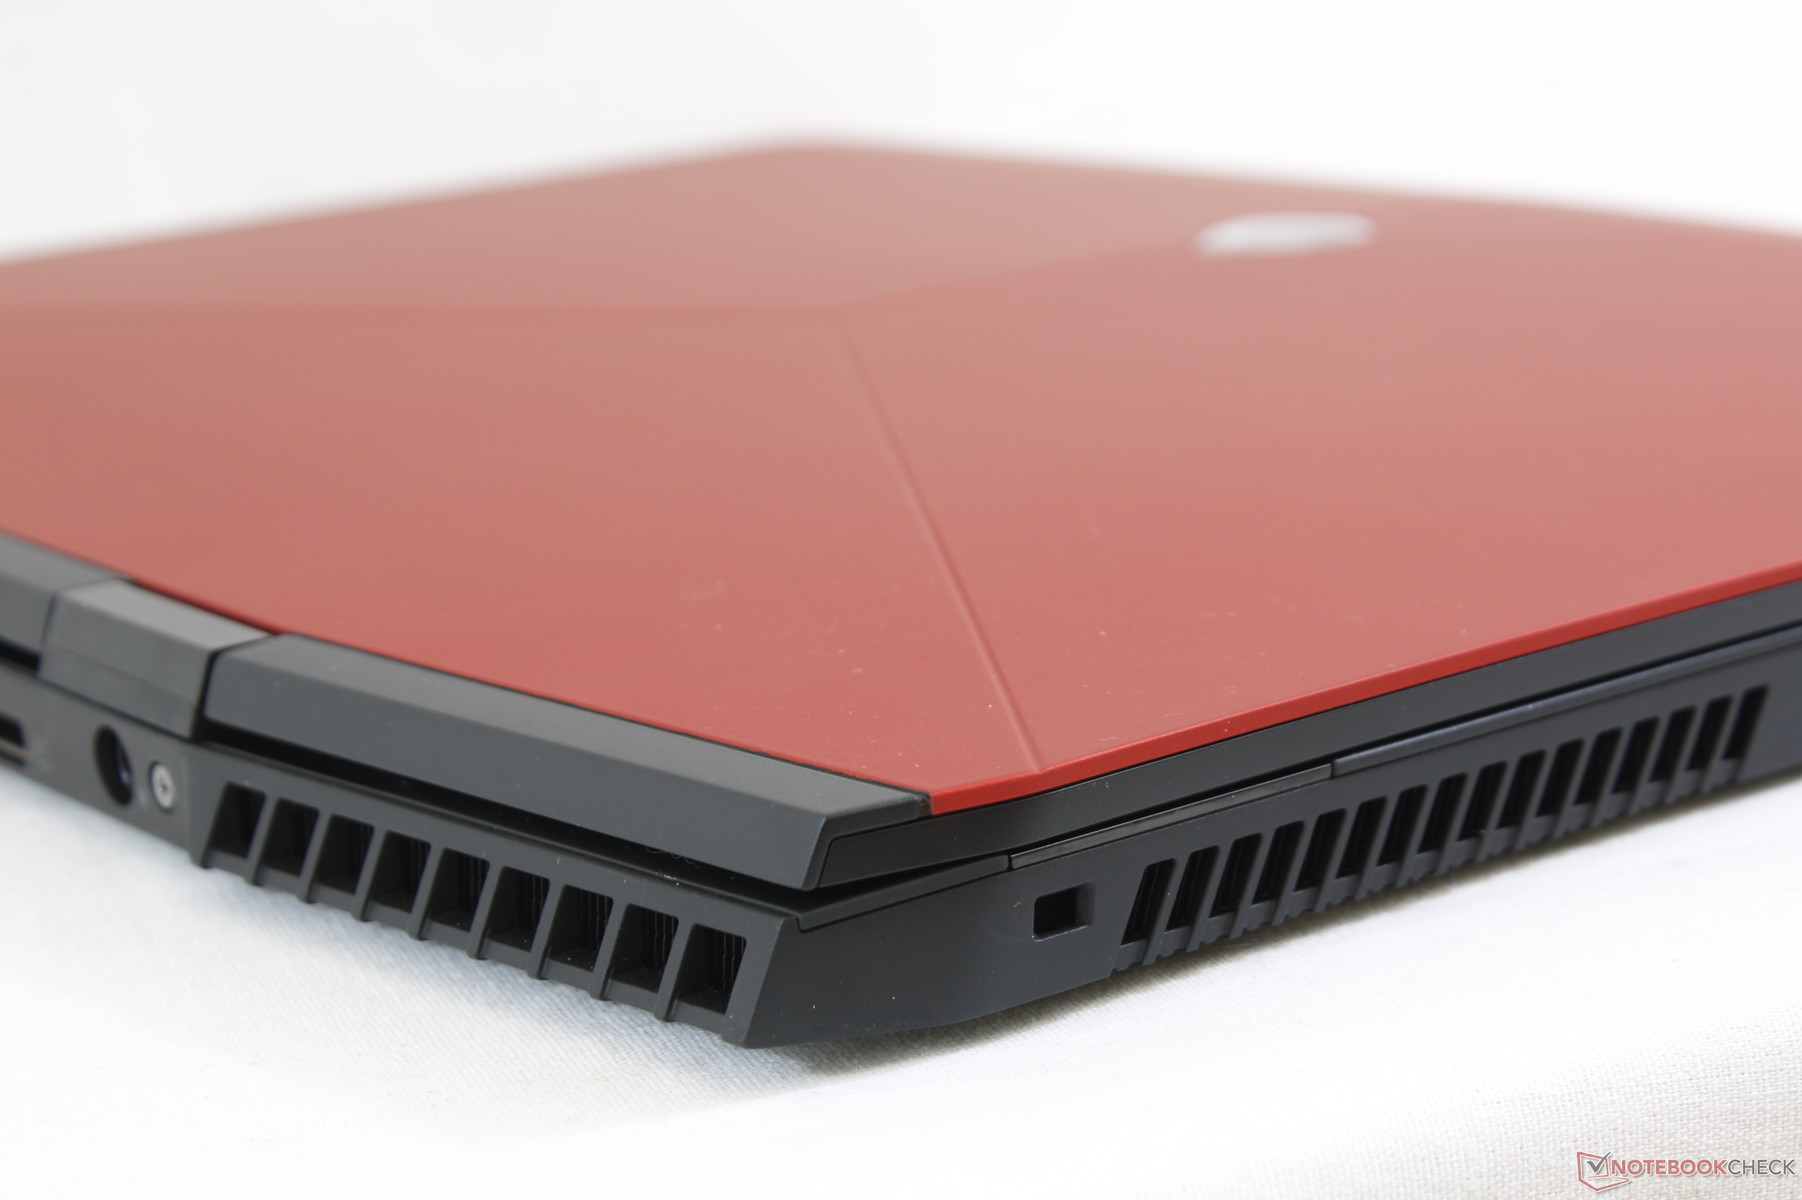
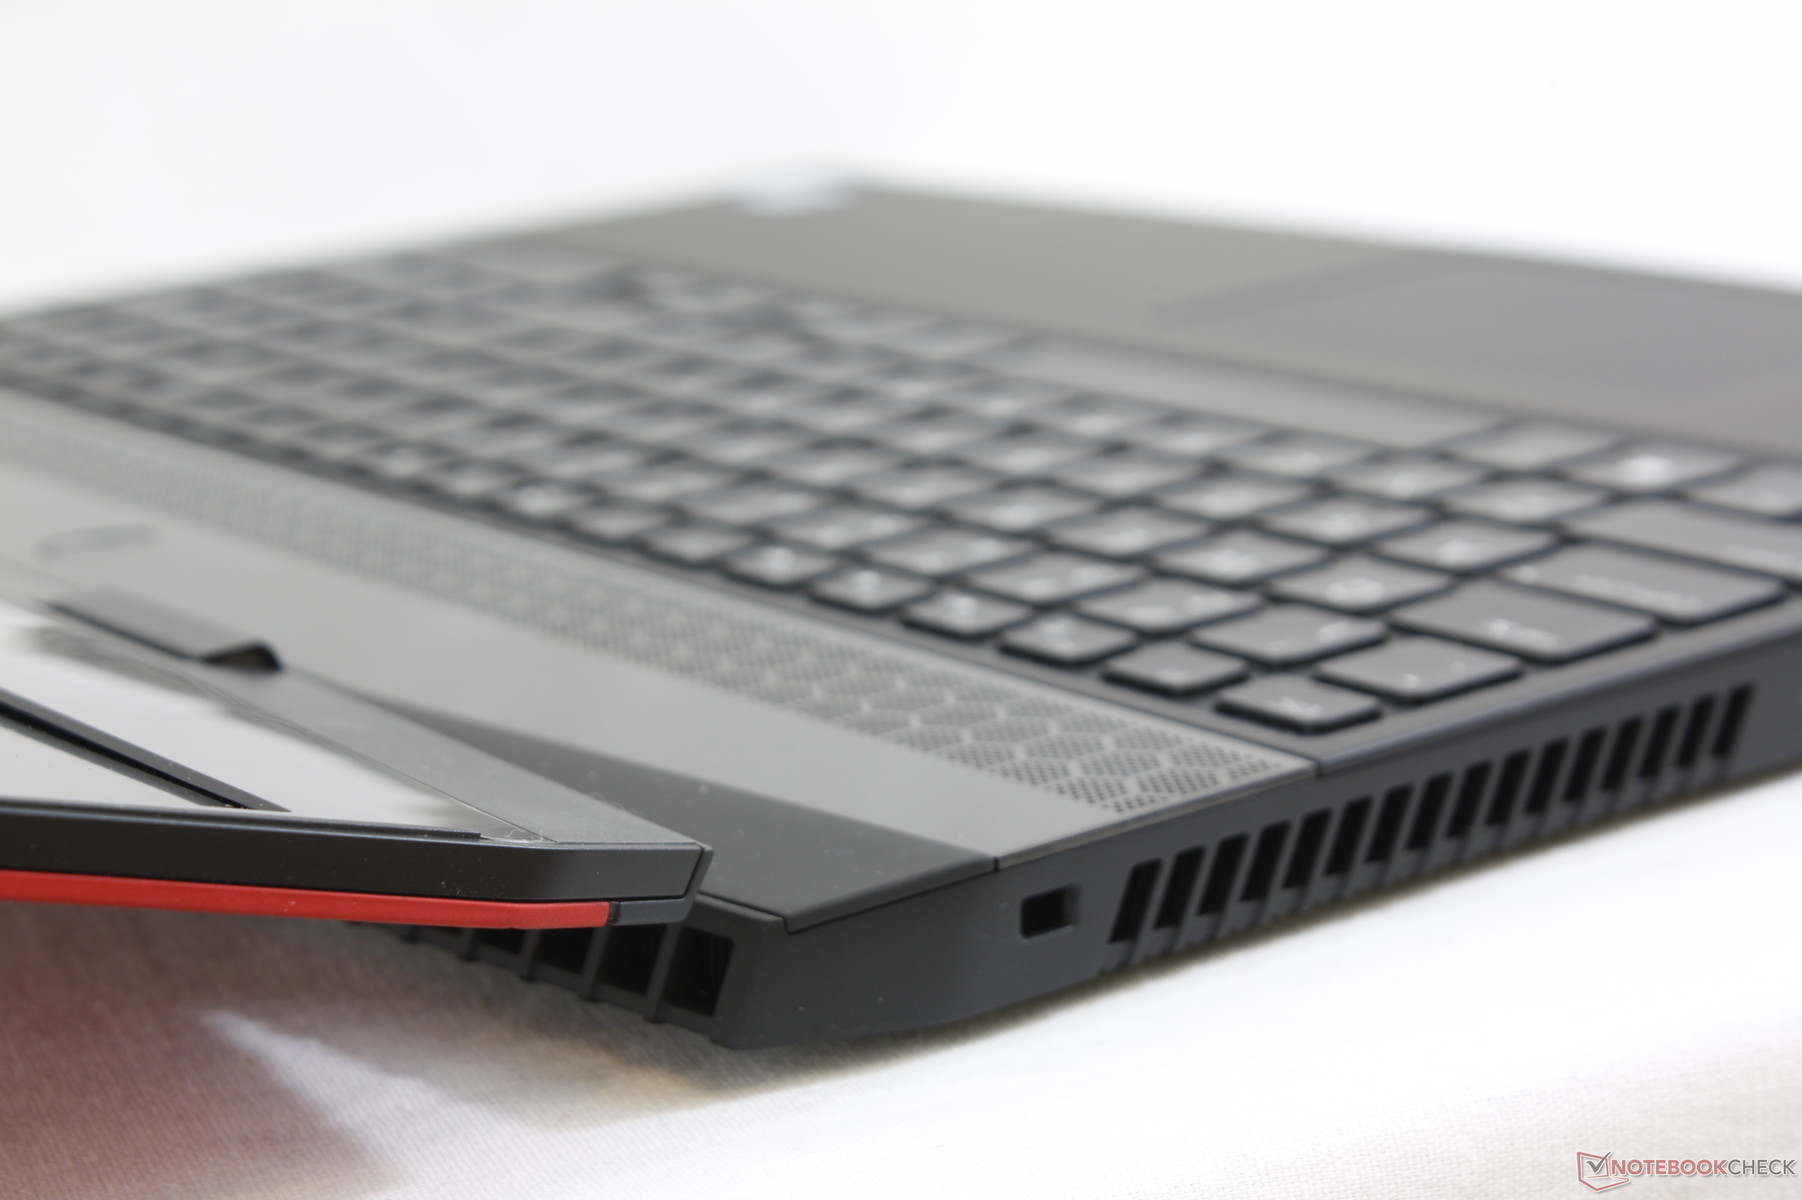
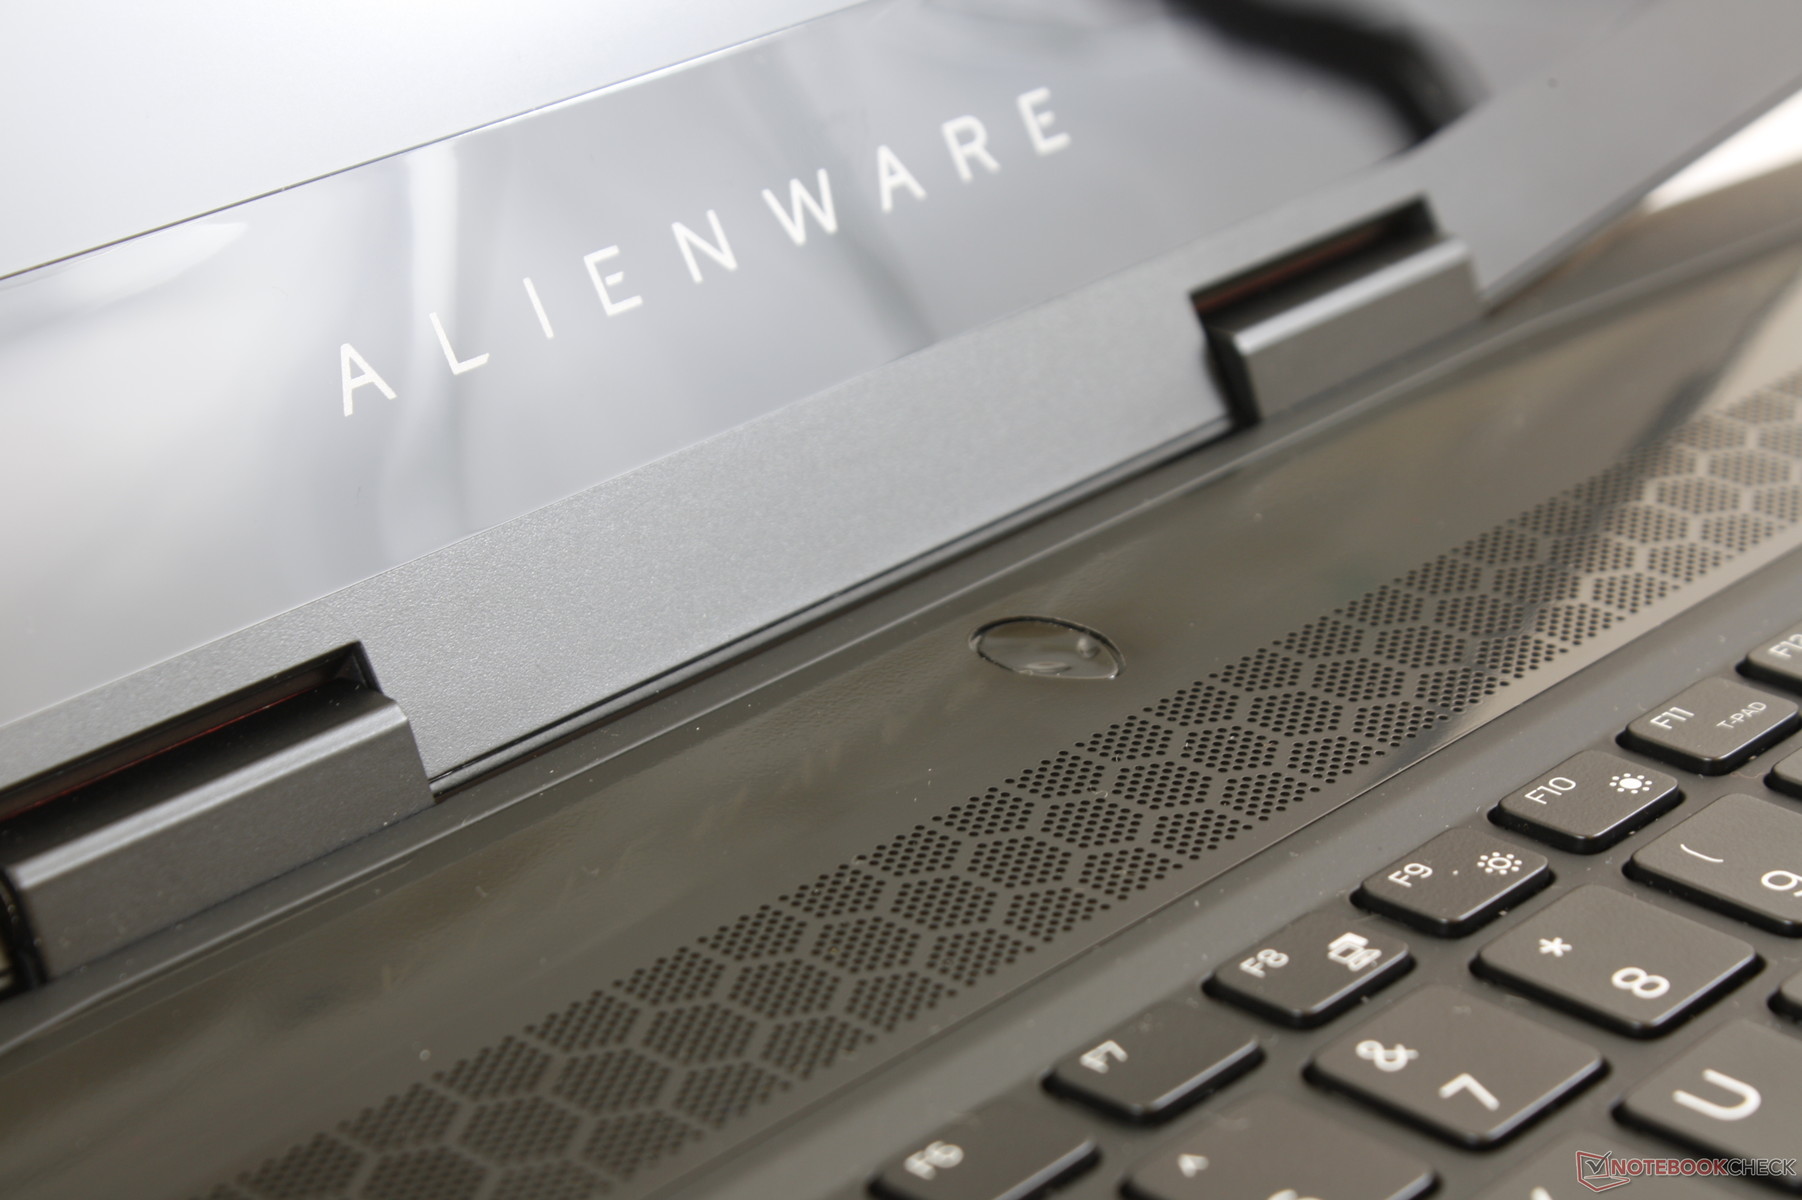
Visually, the m15 utilizes magnesium alloy for the base and outer lid, the same rubberized palm rests as the 15 R4, and new glossy plastic for the speaker grilles and bezel rims. The glossy surfaces are a mixed bag when compared to the uniform matte bezels of the larger model or unibody design of the competing Blade 15 as they look a bit cheap for a notebook in this price range. Additionally, fingerprint and grease will buildup on the palm rests, trackpad, and keyboard relatively quickly. The two hinges are smaller than the hinges on the Alienware 15 R4 and slightly weaker for a bit more teetering as a result.
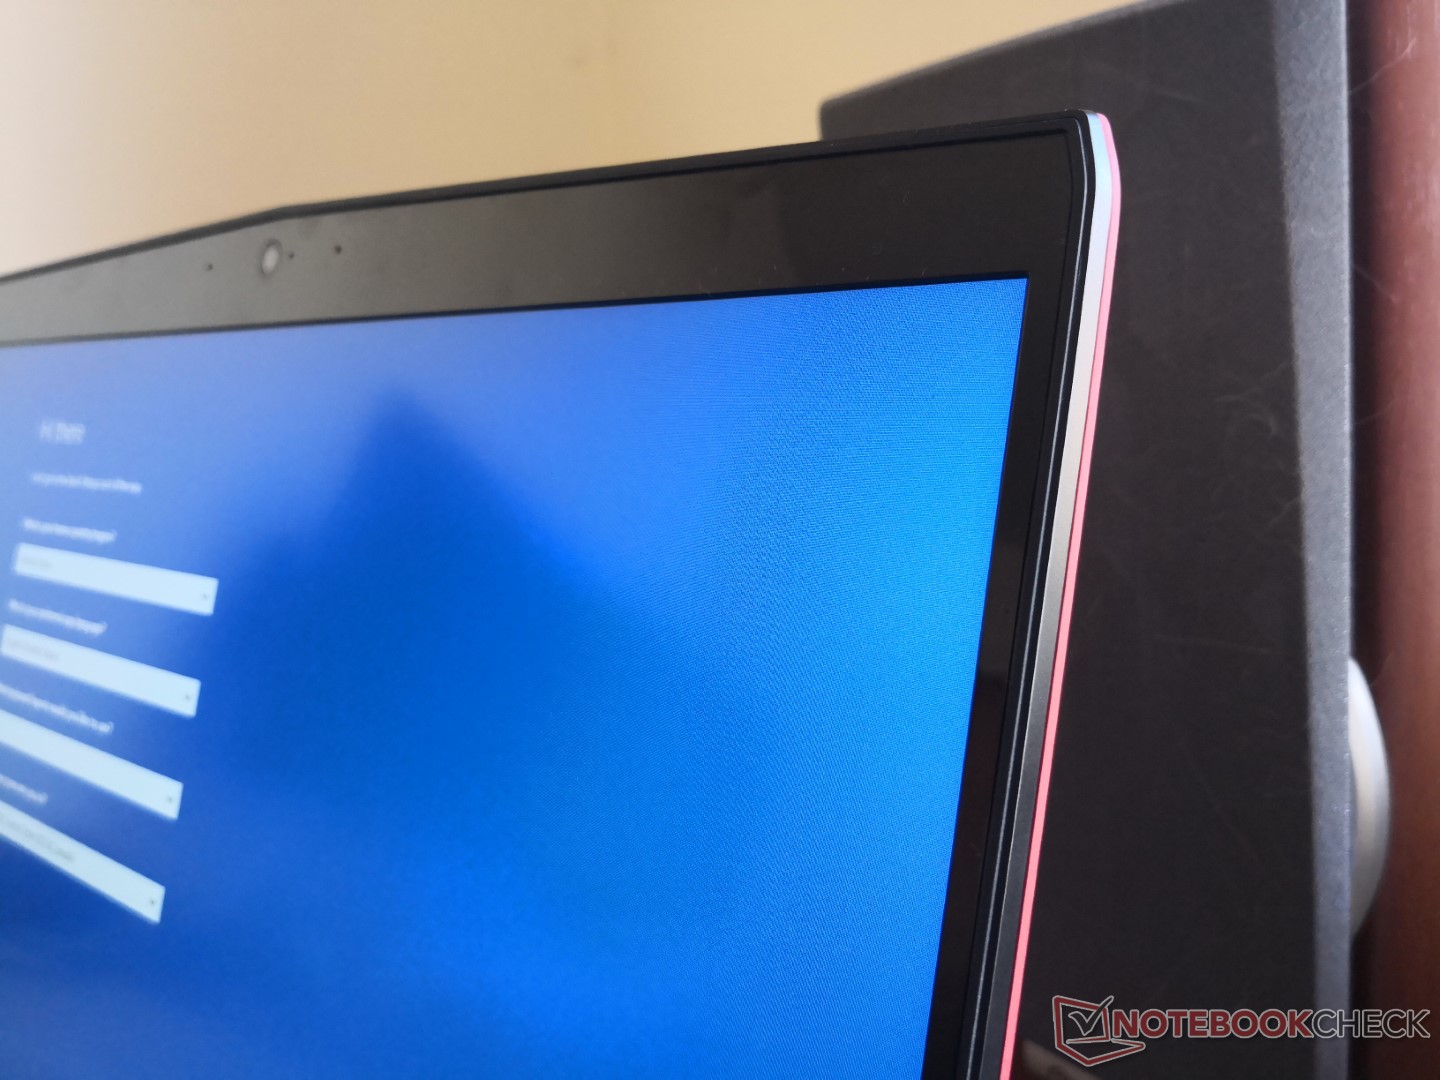
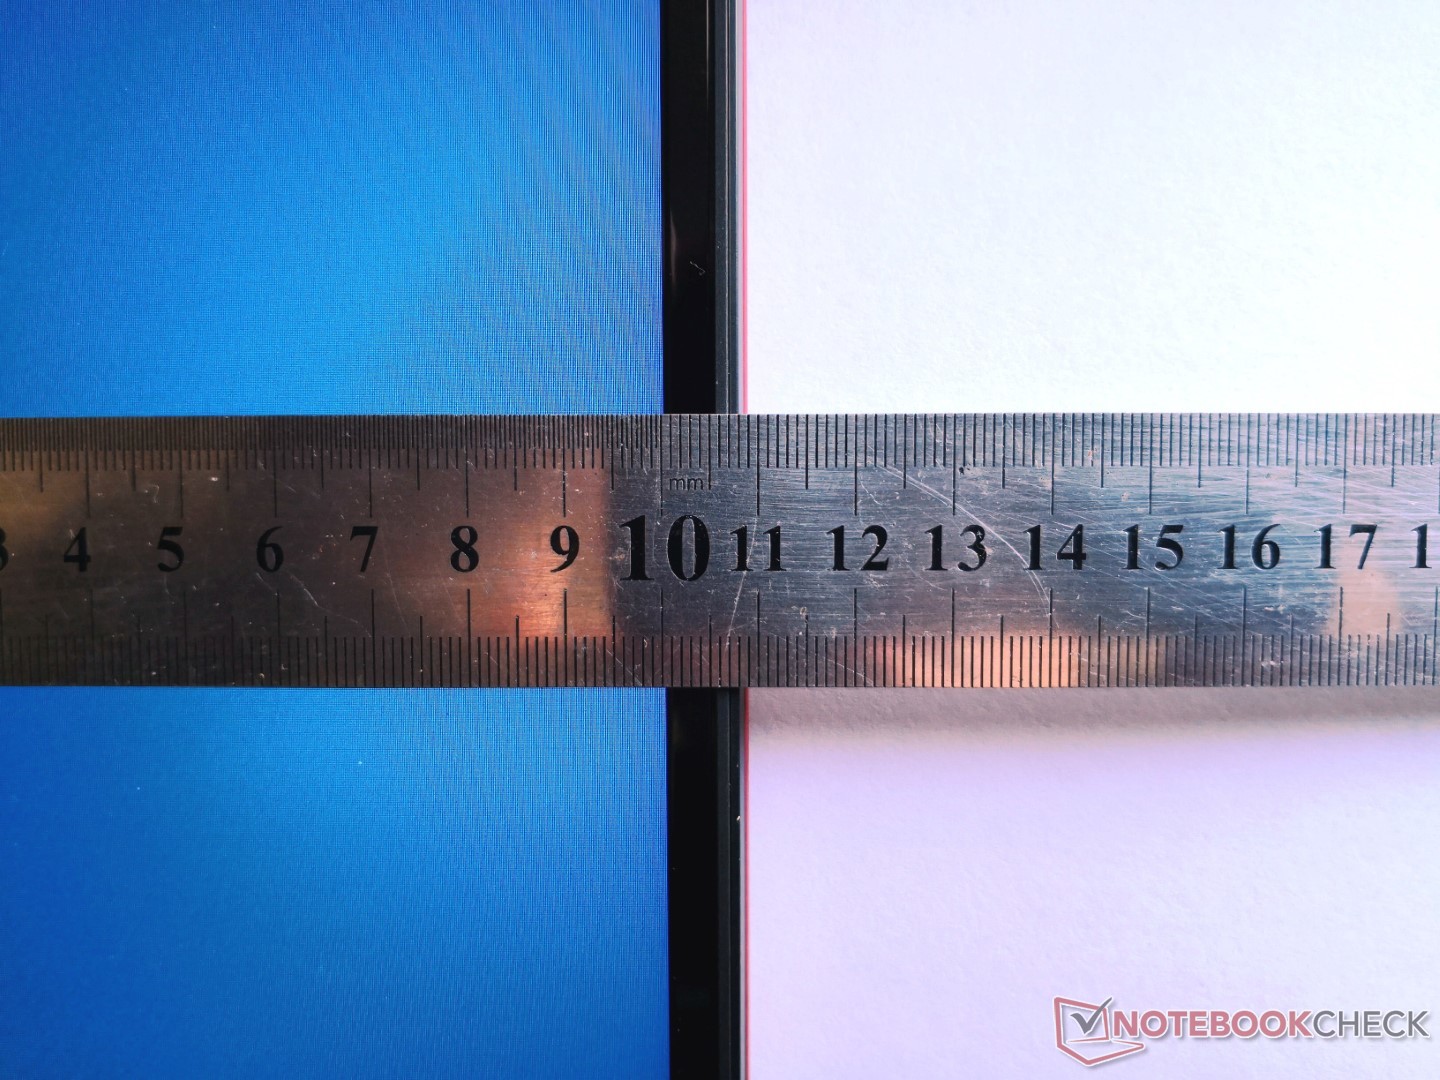
Construction quality is excellent with no major gaps or crevices between materials on our test unit. It's not entirely perfect, however, as the bottom bezel does not sit flat against the edge of the screen and so a small gap is visible. This gap does not appear on the Alienware 15 R4.
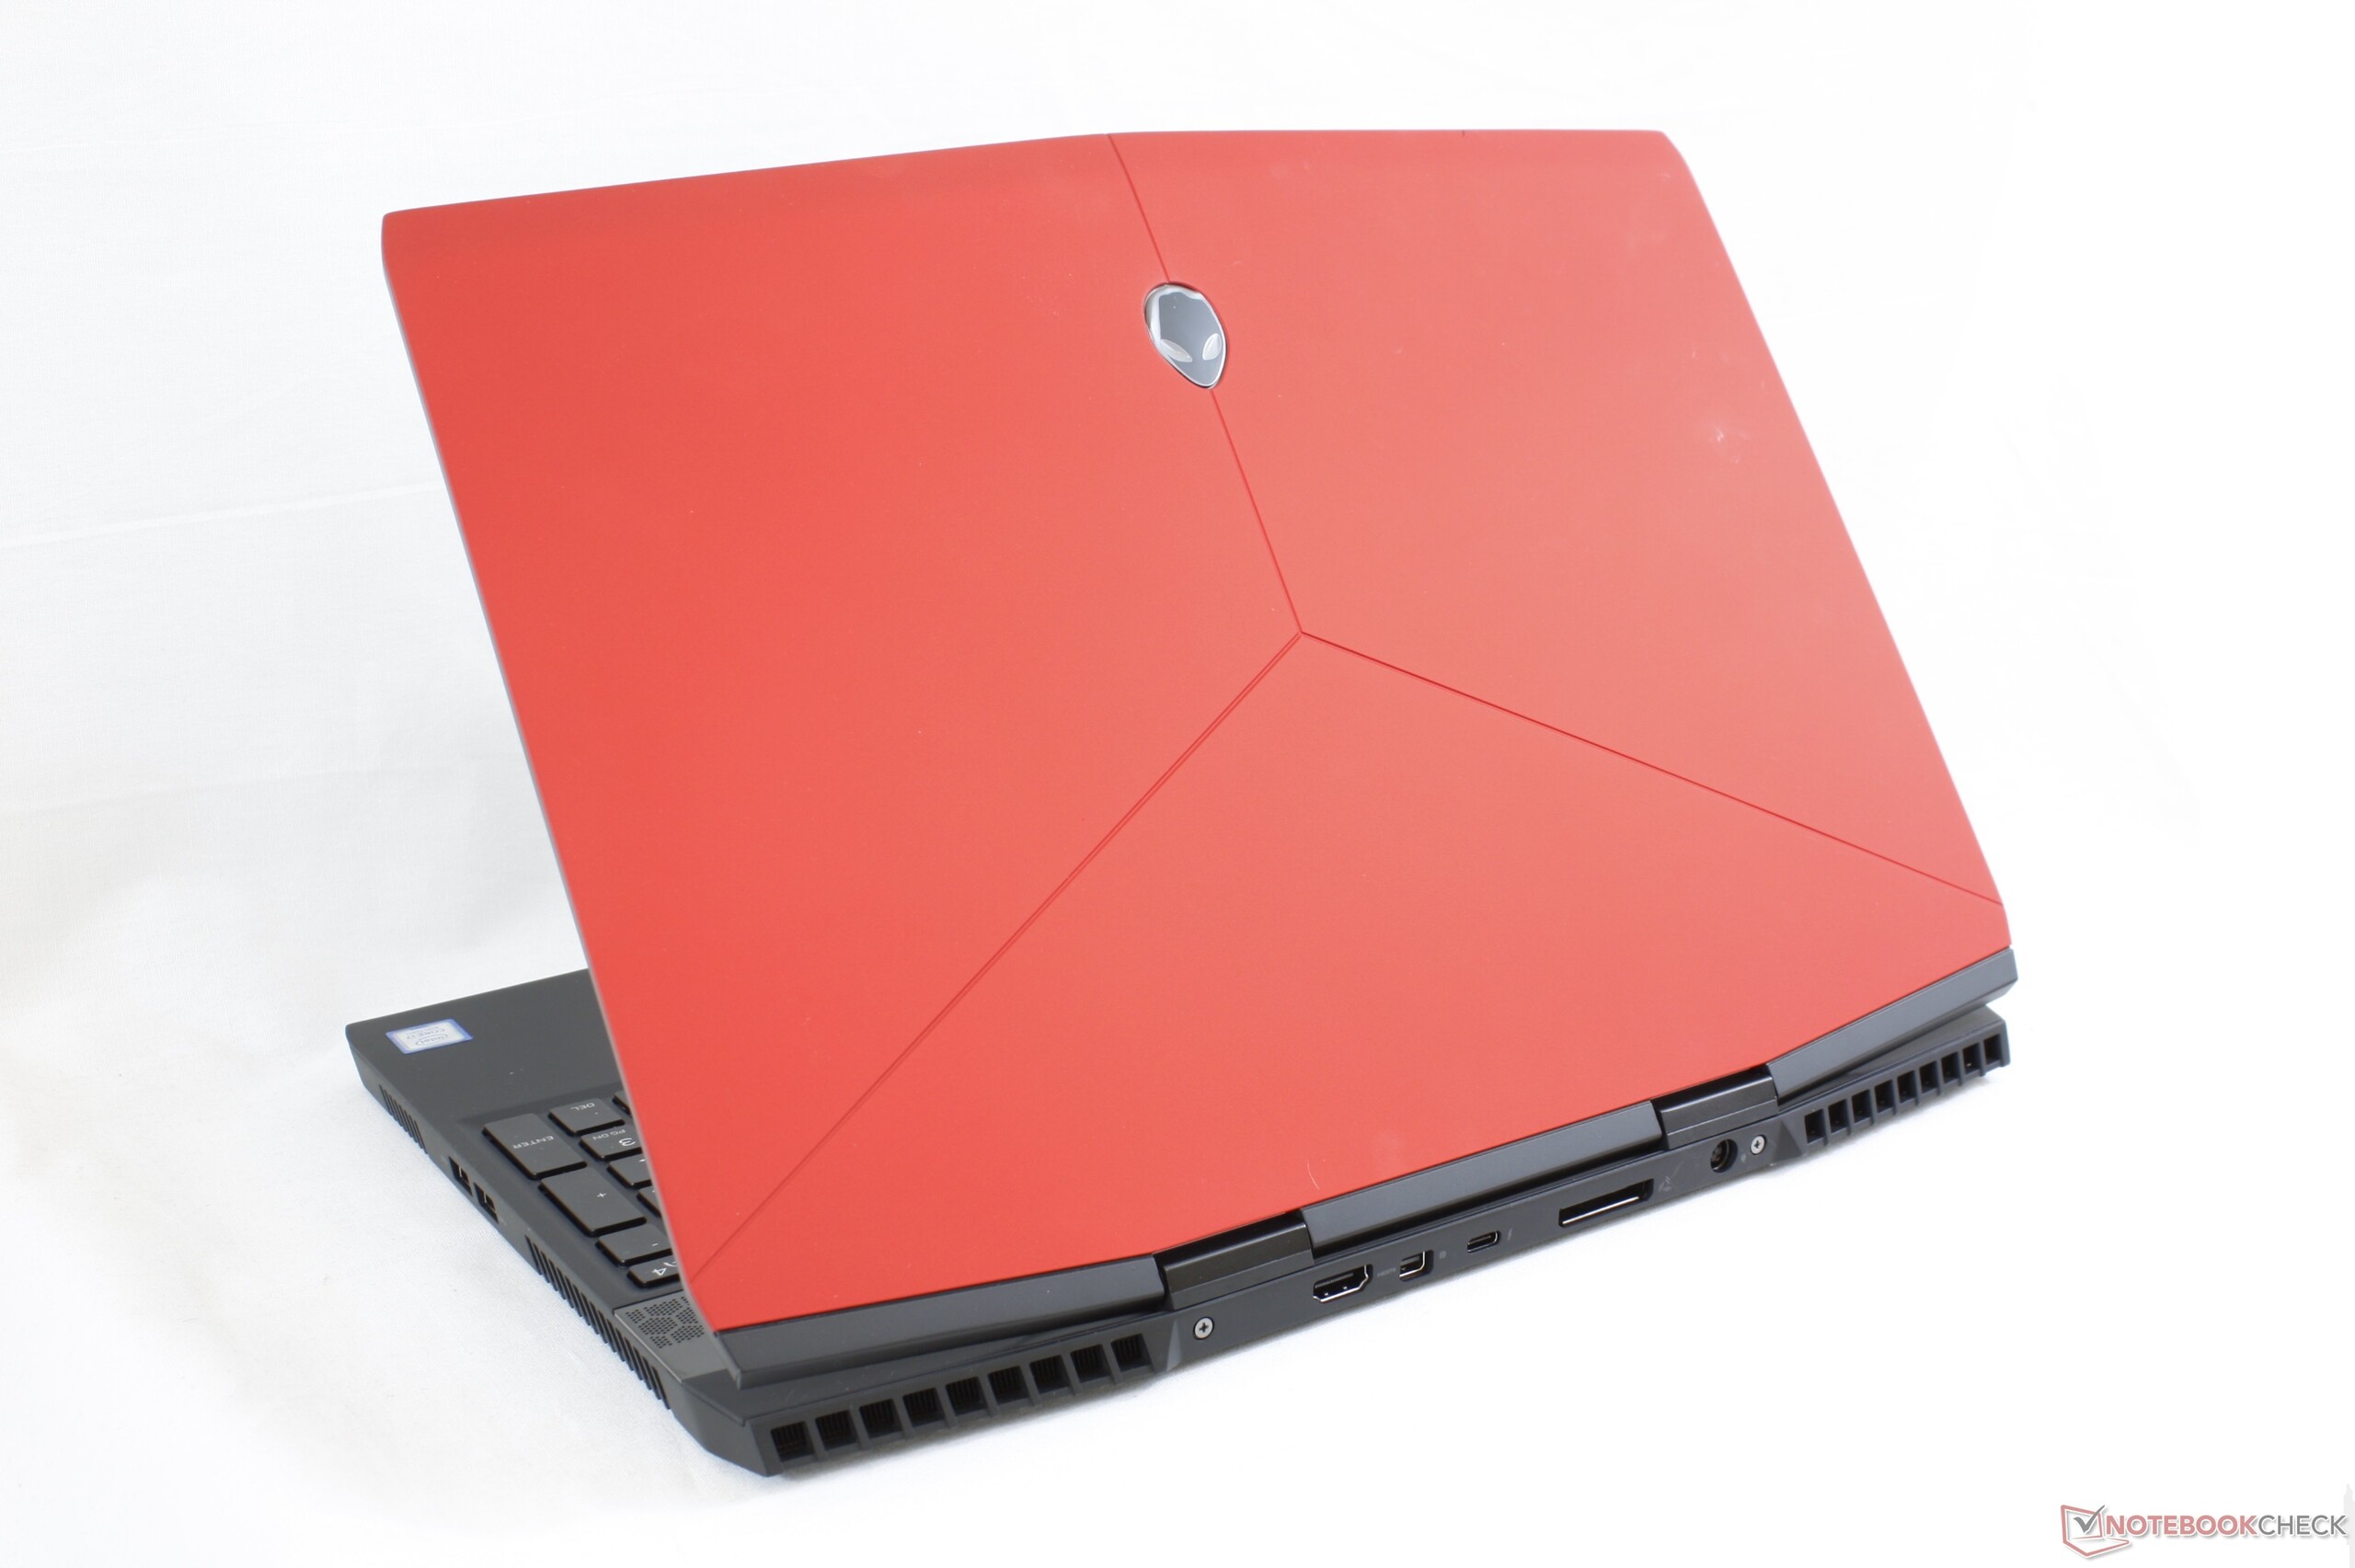
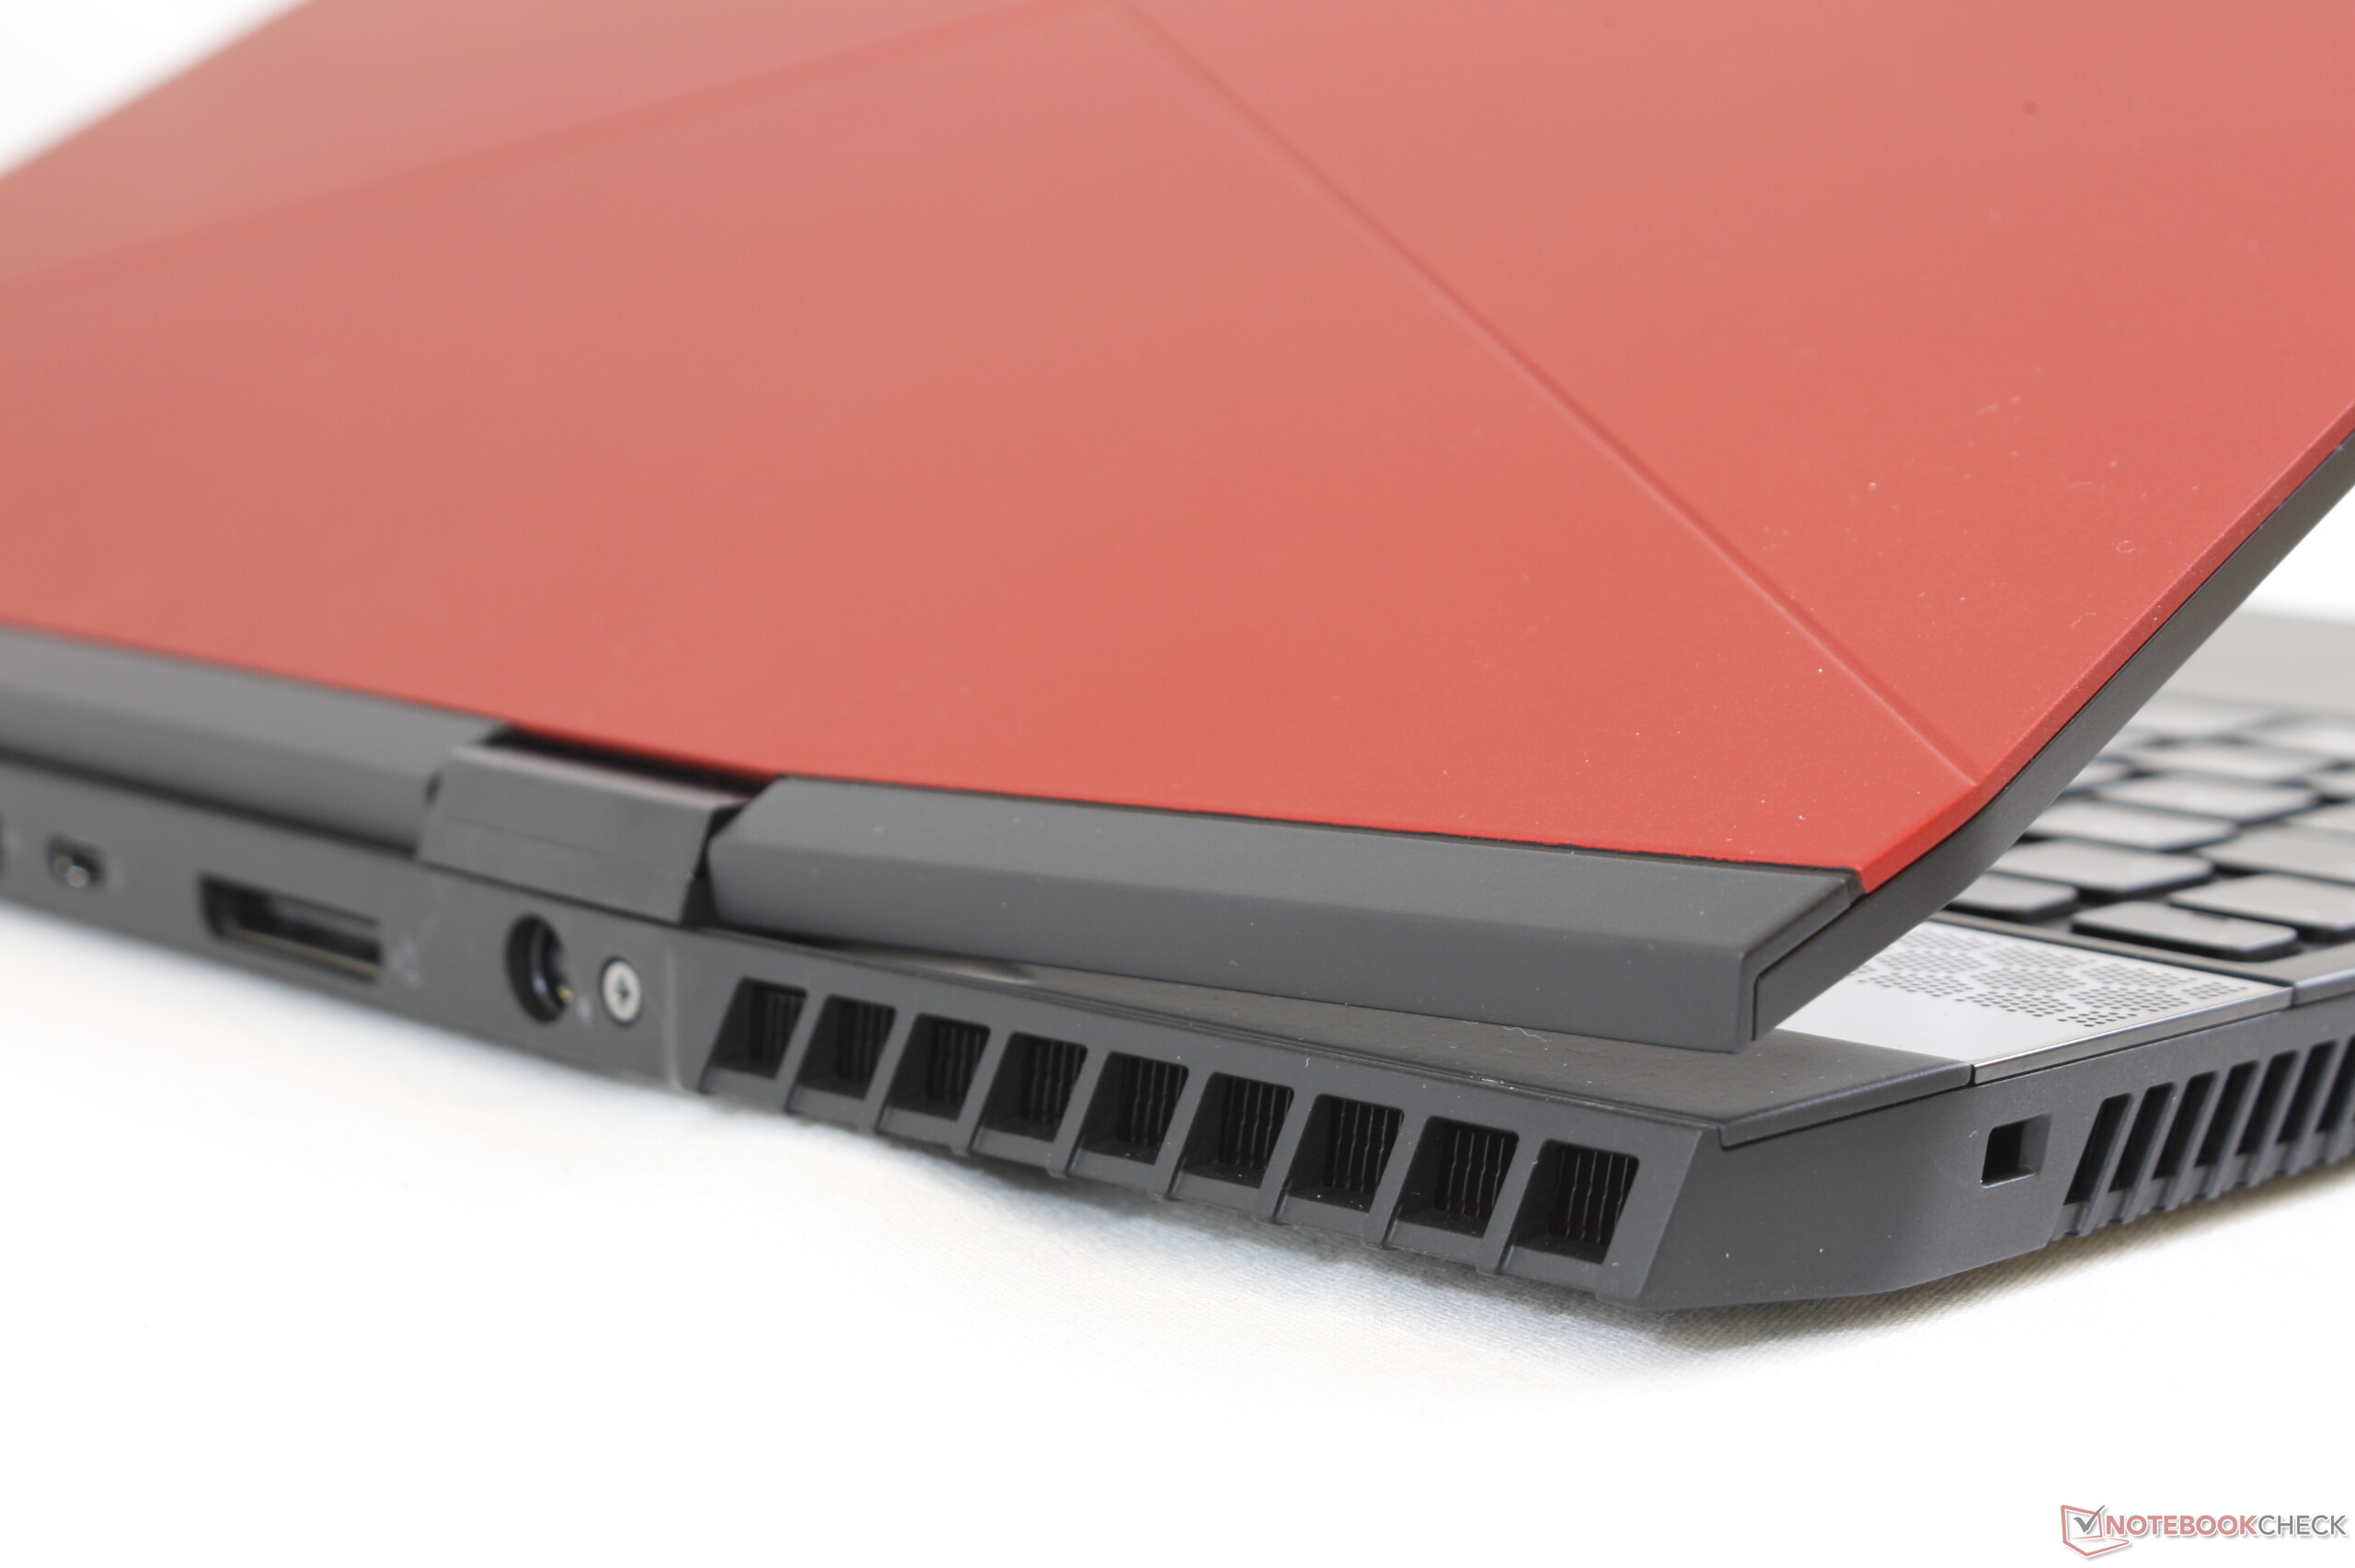


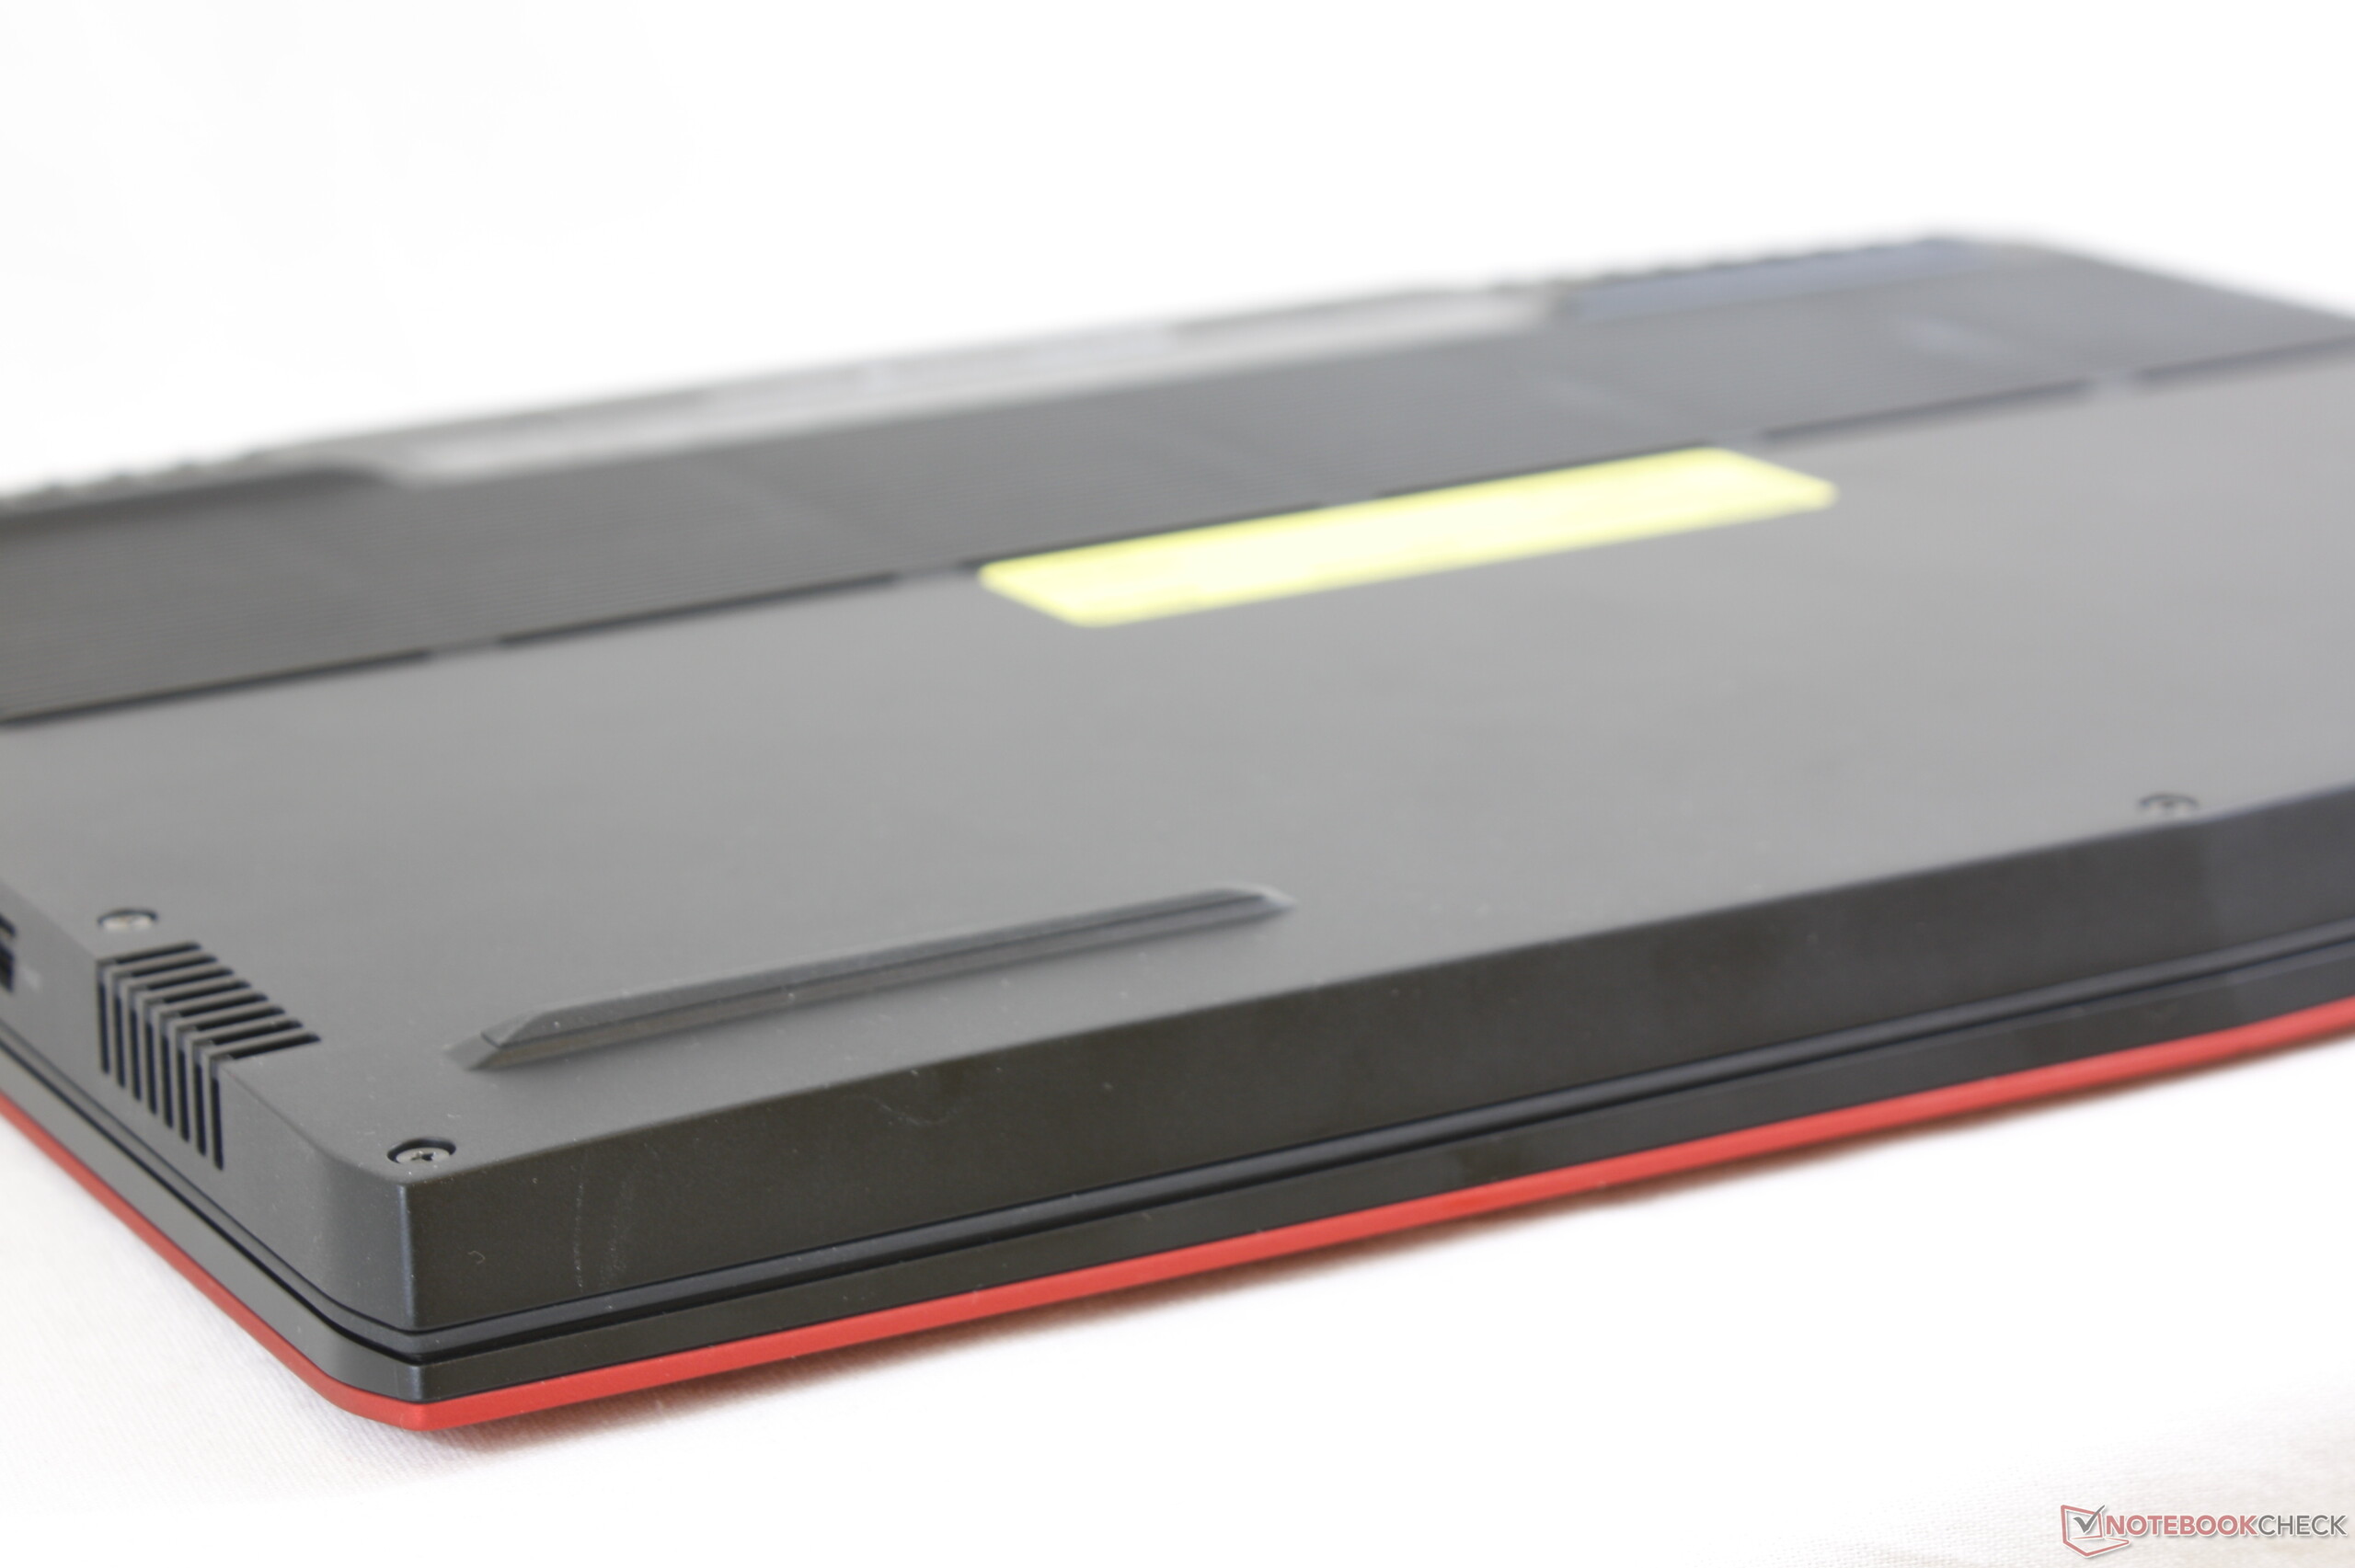
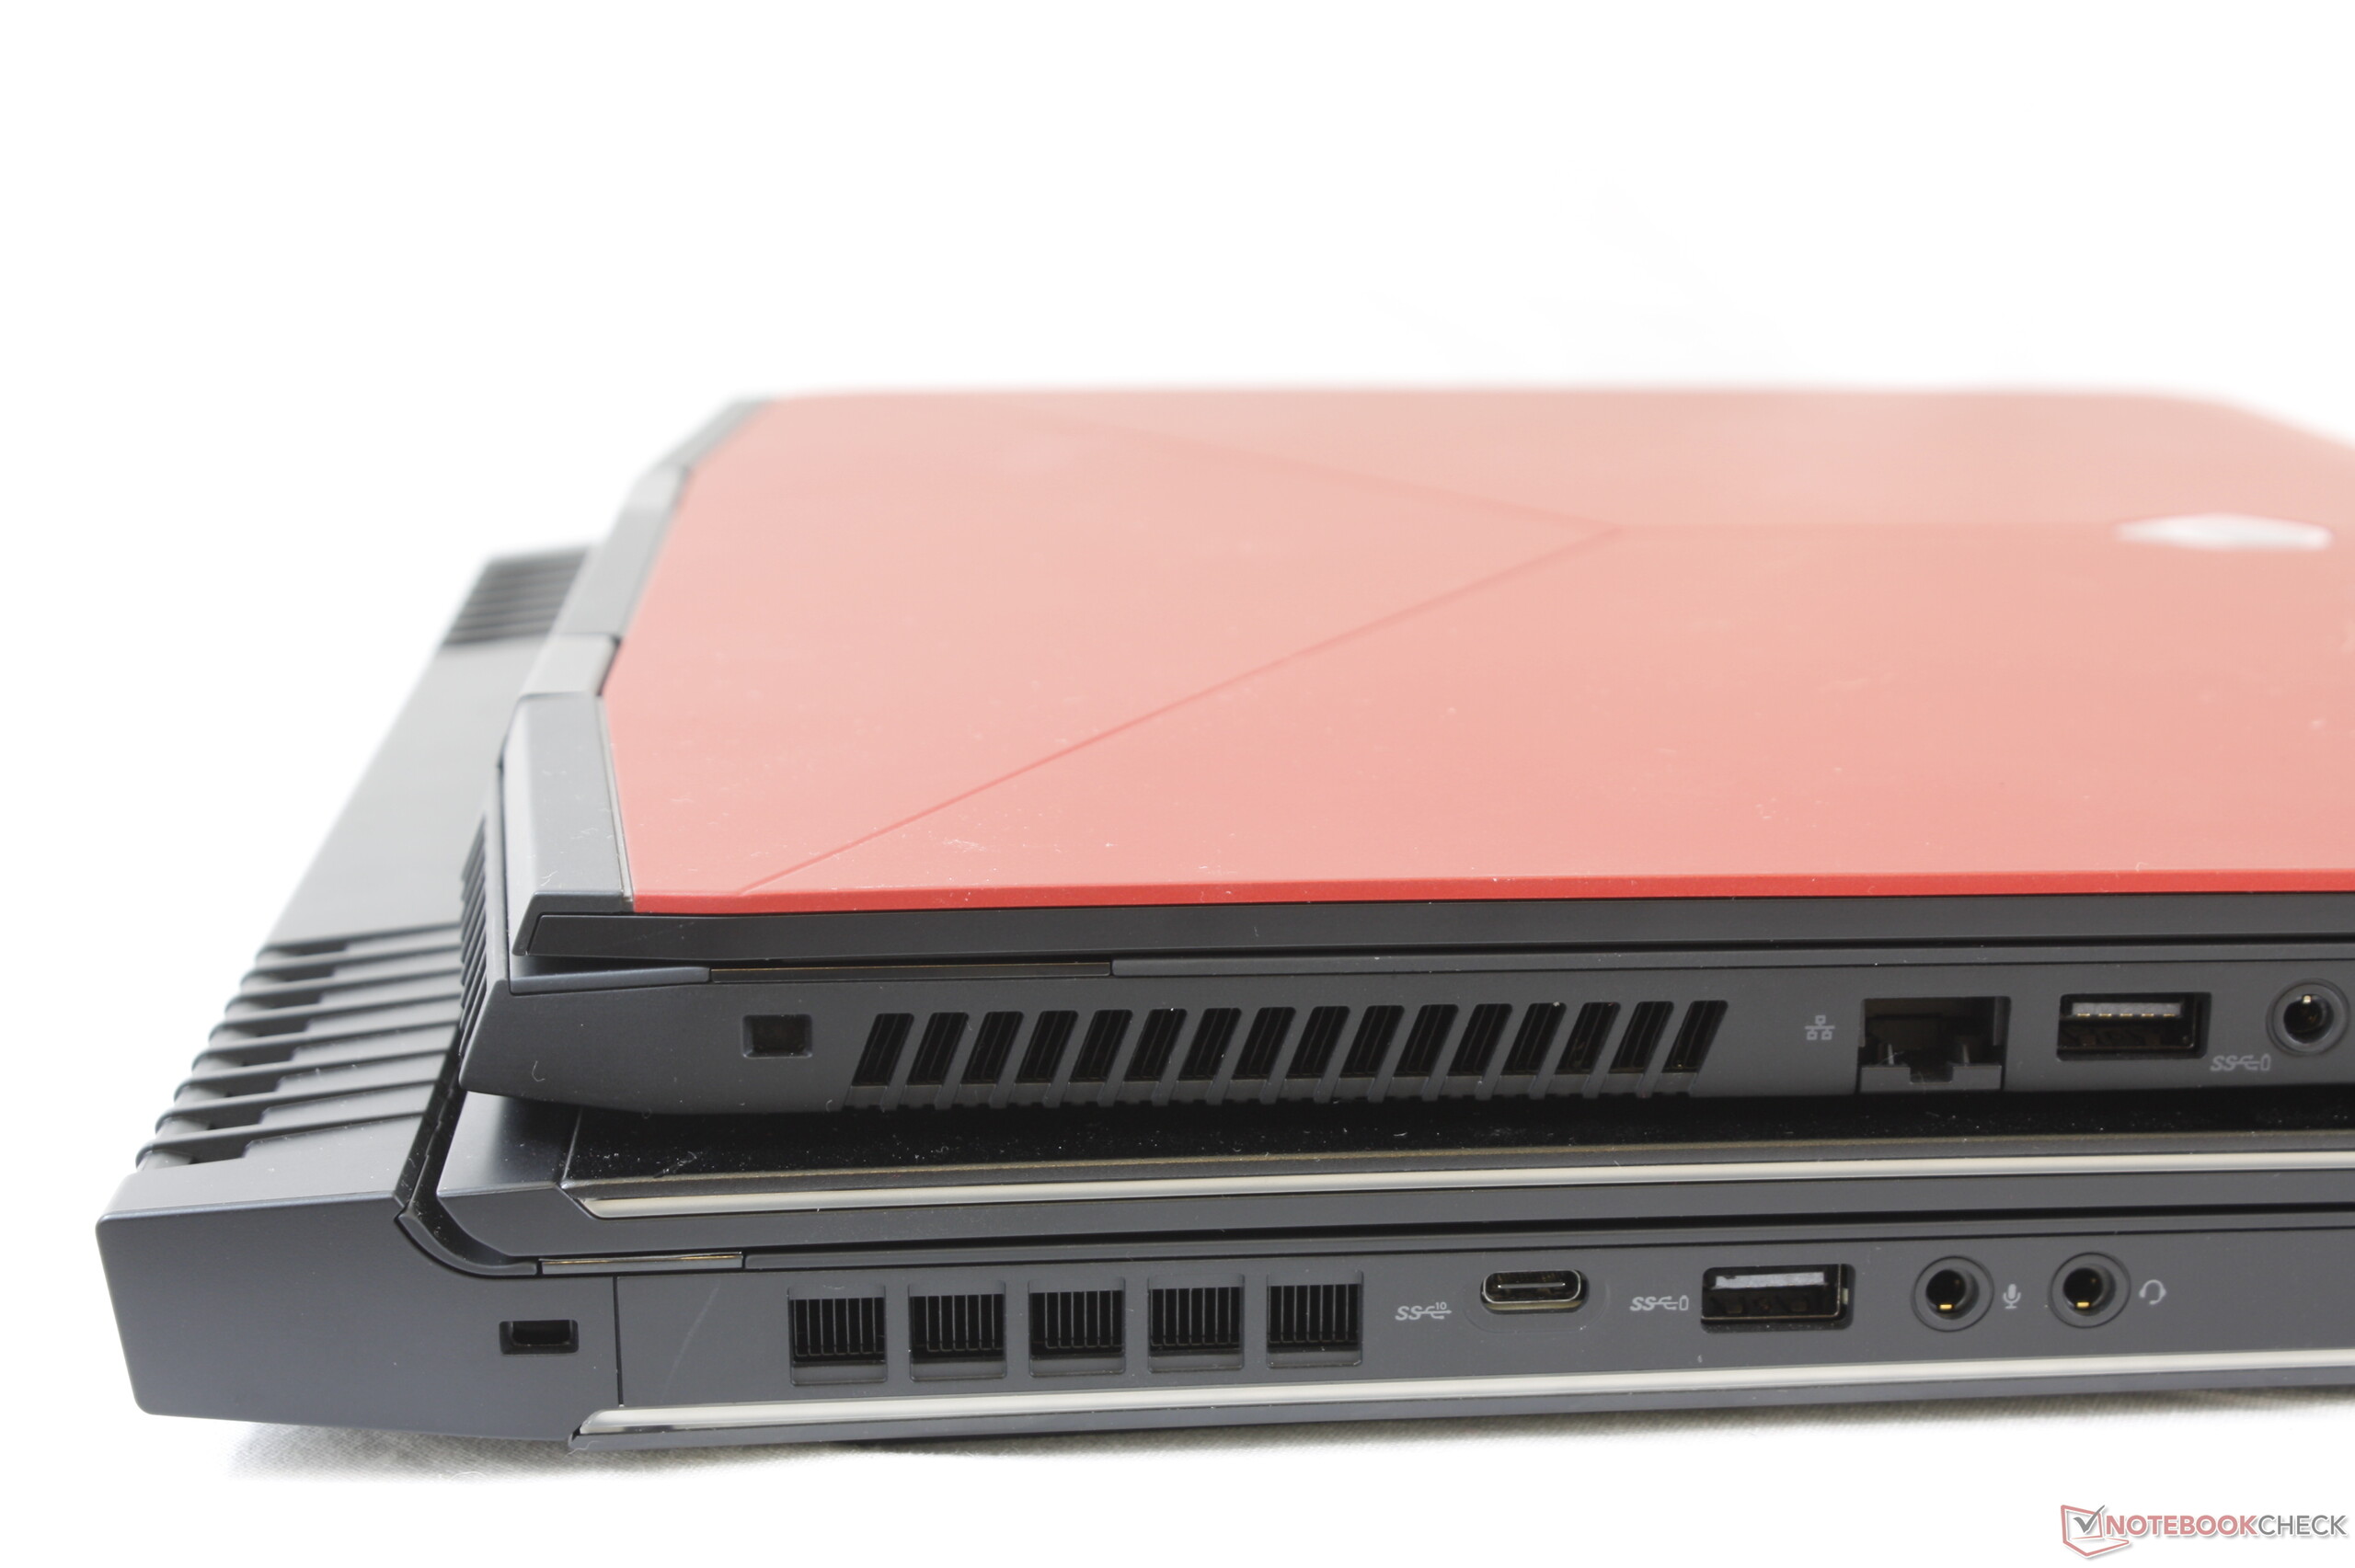
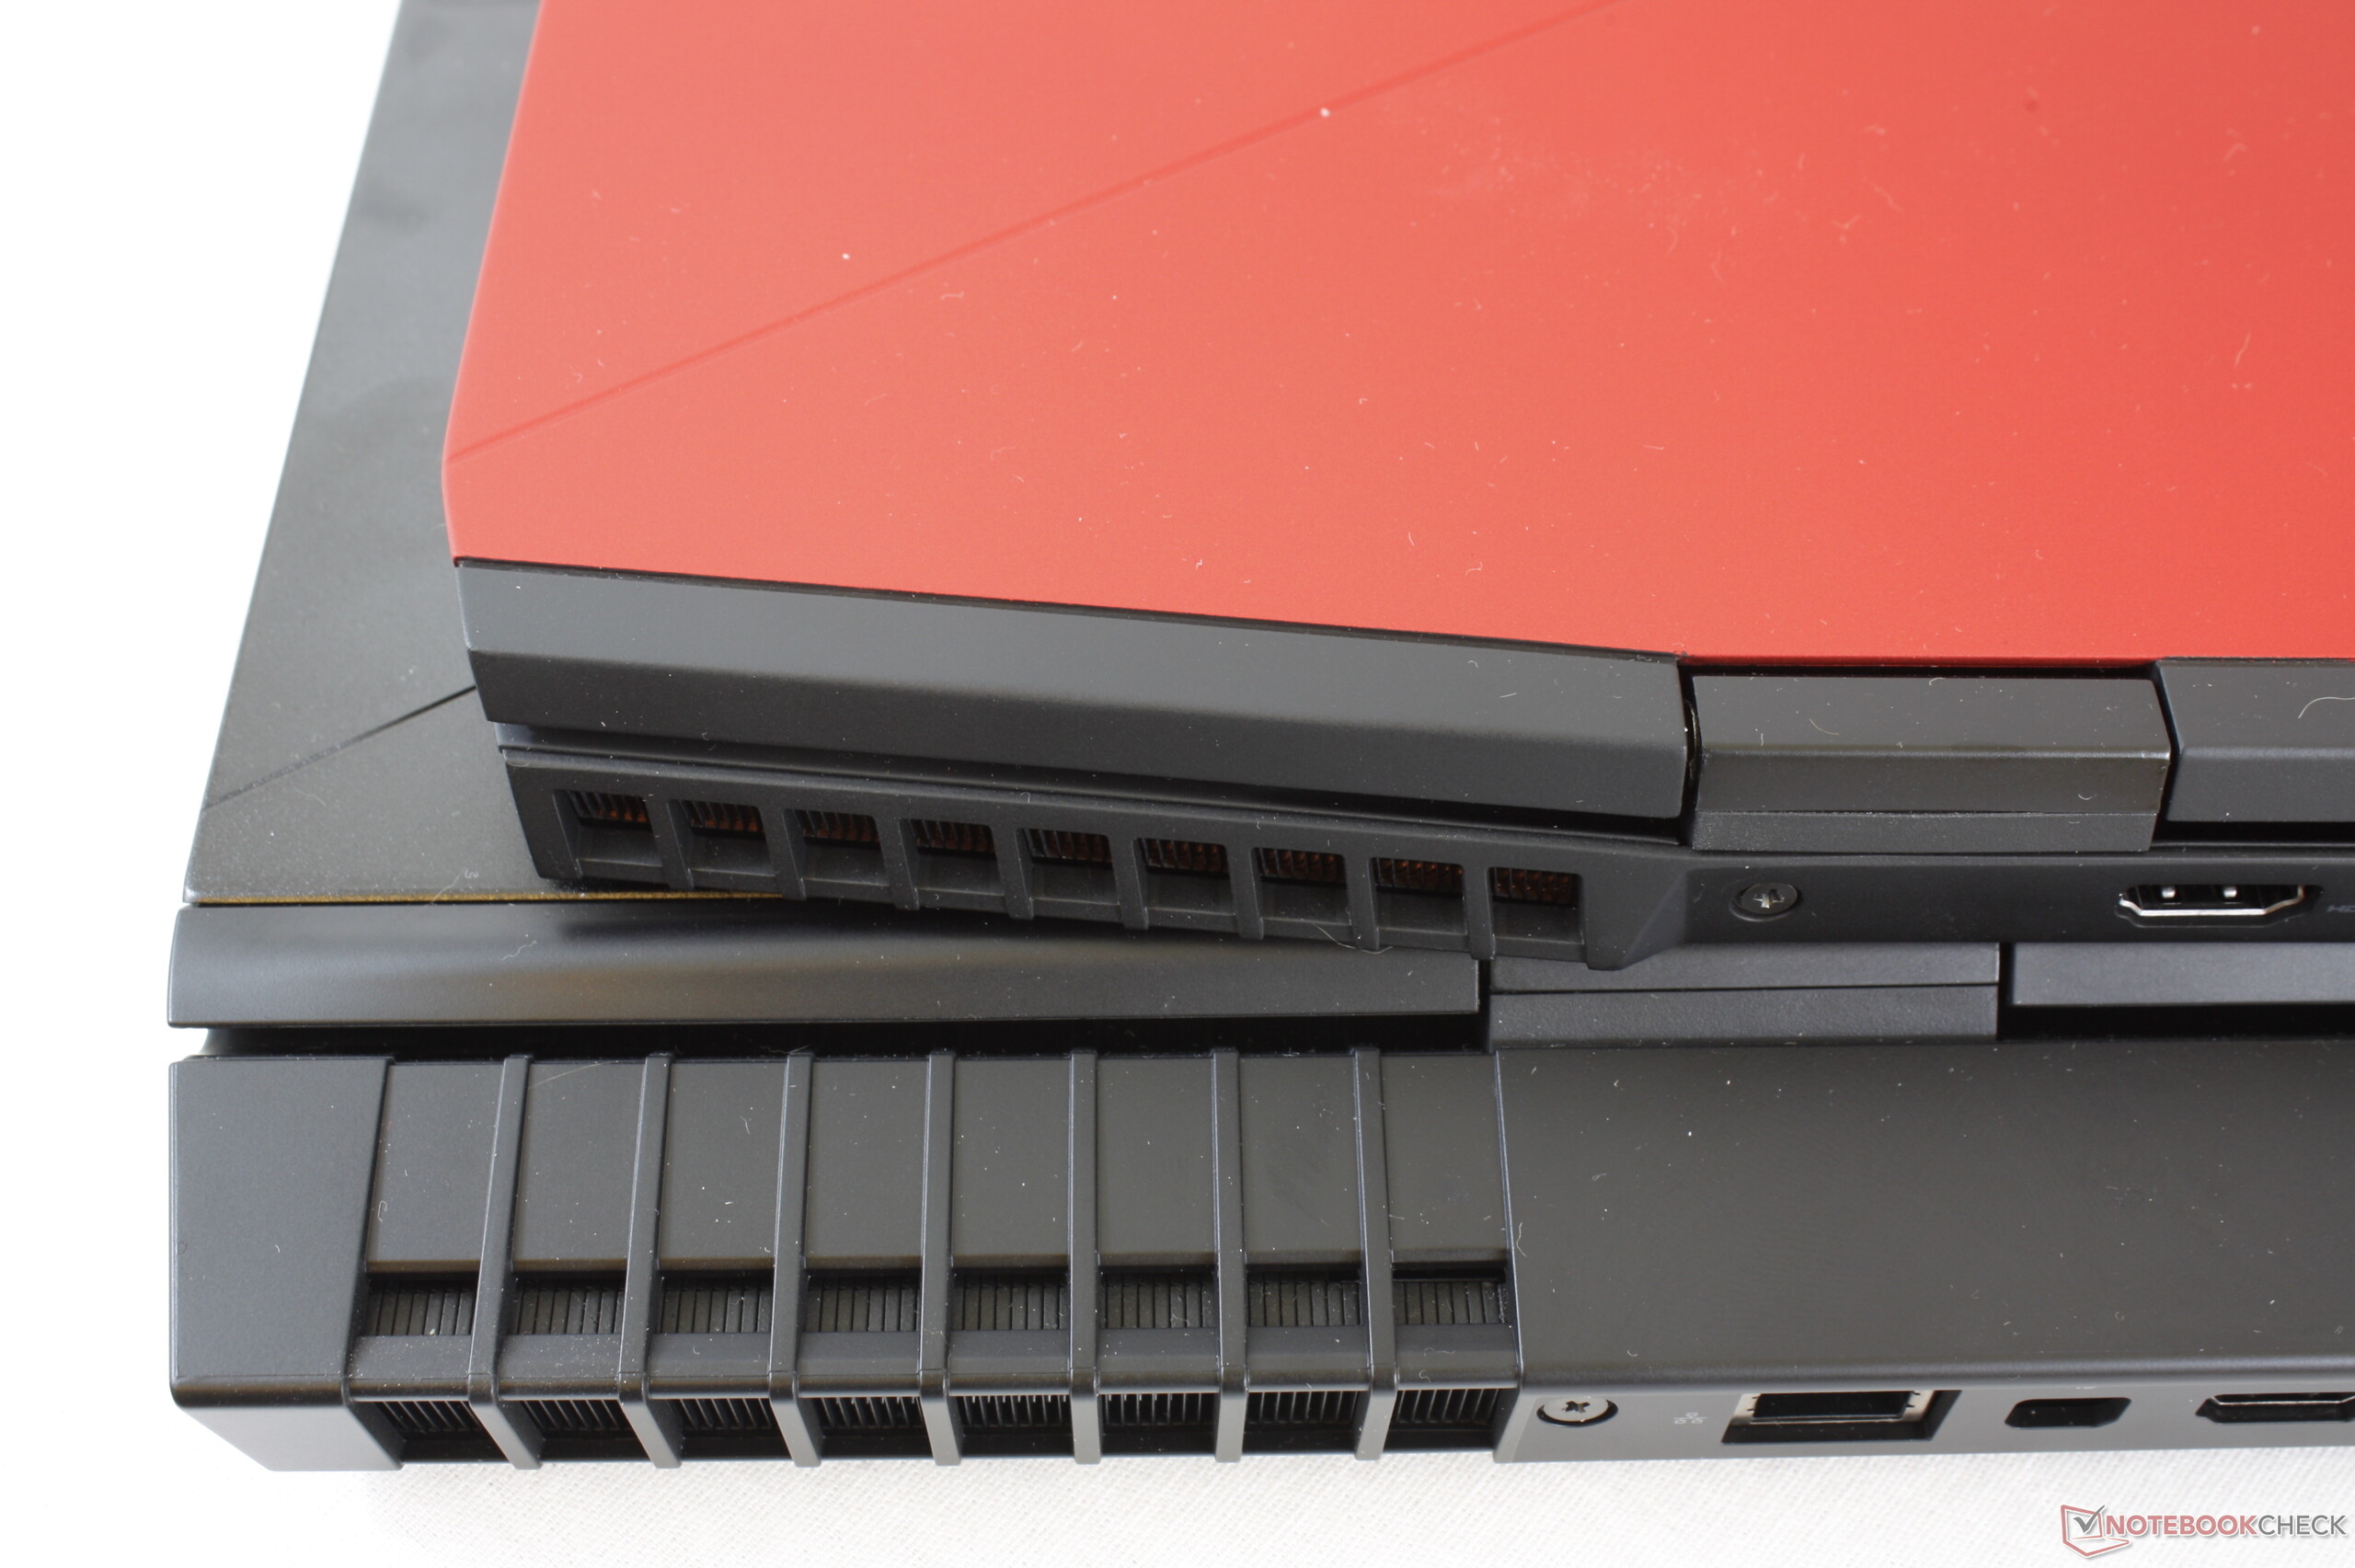
The size and weight differences between the Alienware 15 R4 and m15 can't be understated. The new system is 38 percent lighter and 30 percent smaller than its larger sibling all while offering the same size display. Dell was able to achieve this by narrowing the side bezels and removing the large rear "jet-engine" ventilation grilles present on the Alienware 15 and Alienware 17. If anything, the m15 only exacerbates how large and unwieldy the original Alienware design can be these days.
Even with this in mind, the m15 is still thicker and larger than competing ultrathin 15-inch gaming laptops especially in terms of width. Its two side bezels may be narrow, but the top and bottom bezels are very thick for a larger footprint. Thus, its excellent rigidity comes at the cost of size and weight in relative terms. The Blade 15 feels just as strong as the Alienware m15, if not more so, while being smaller and lighter.
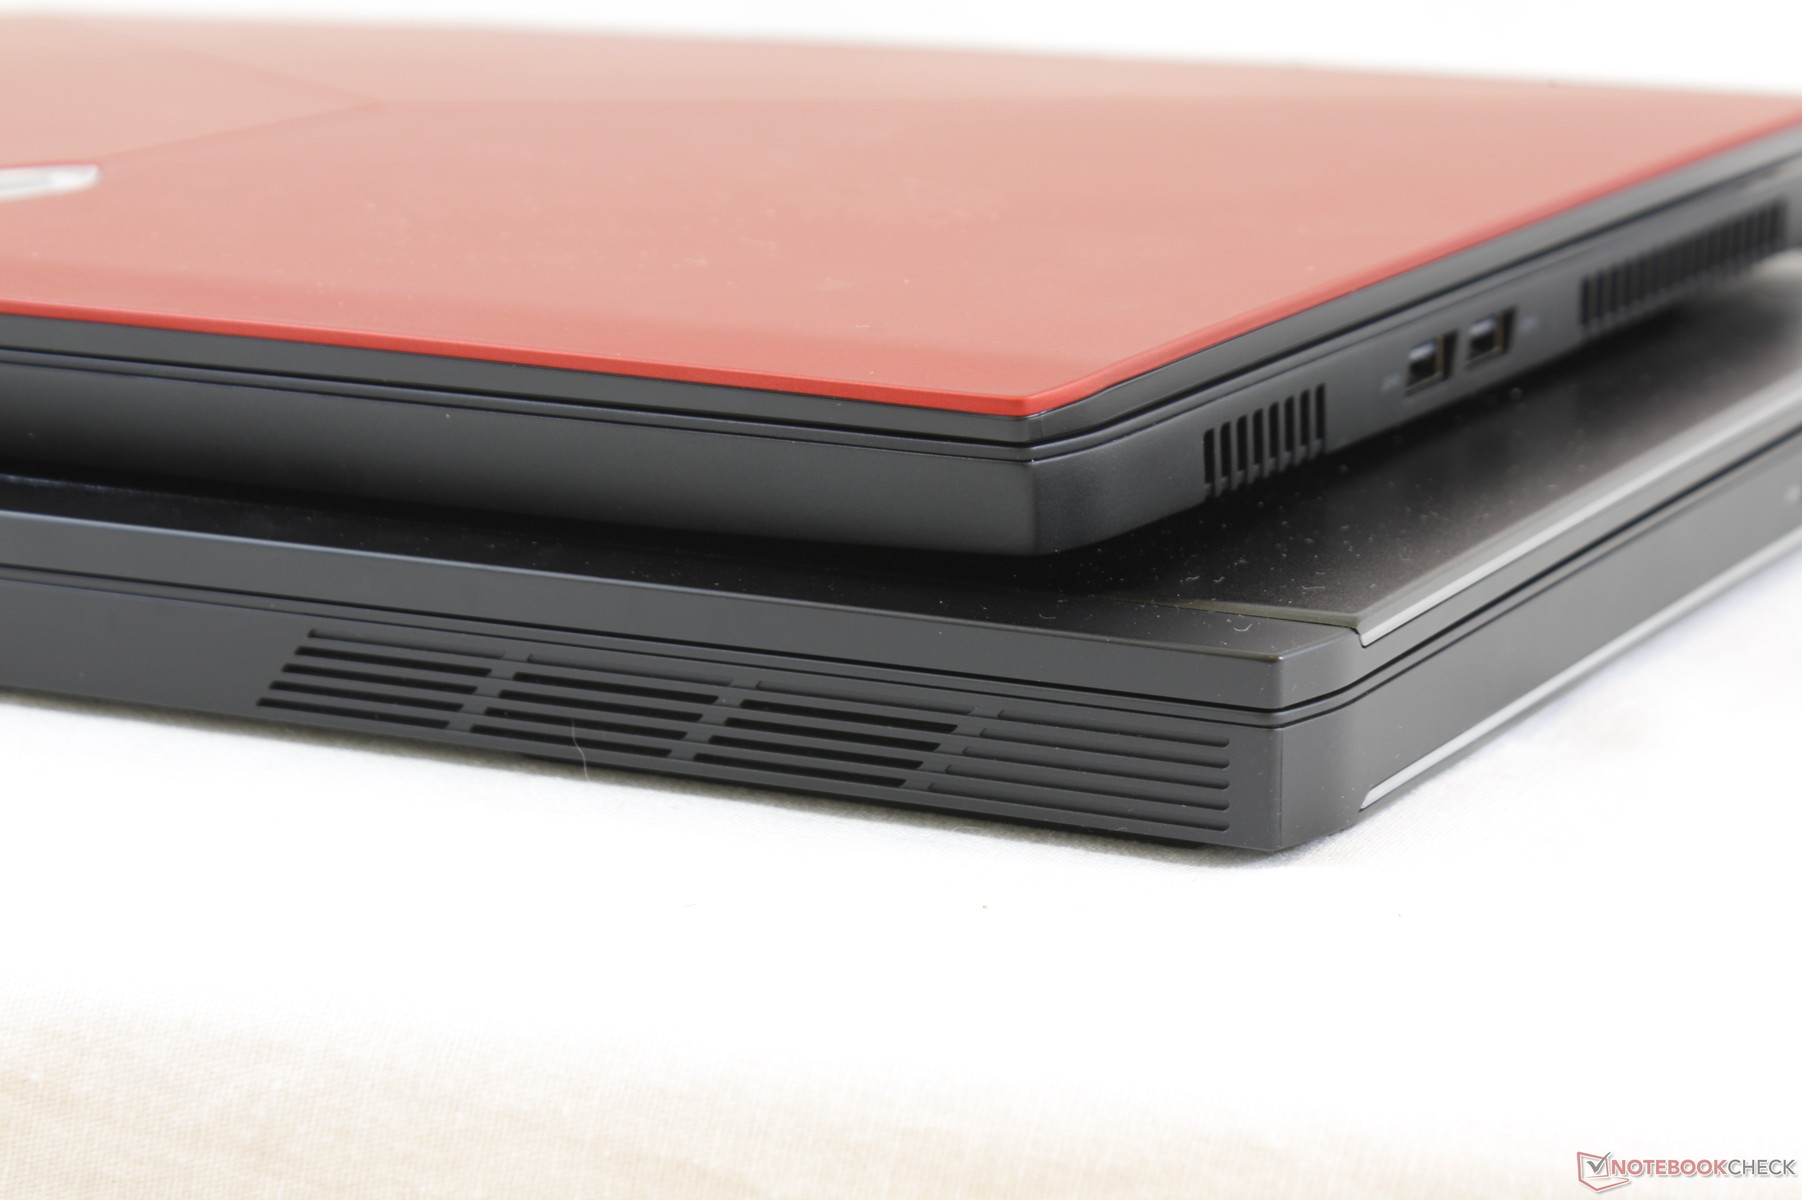
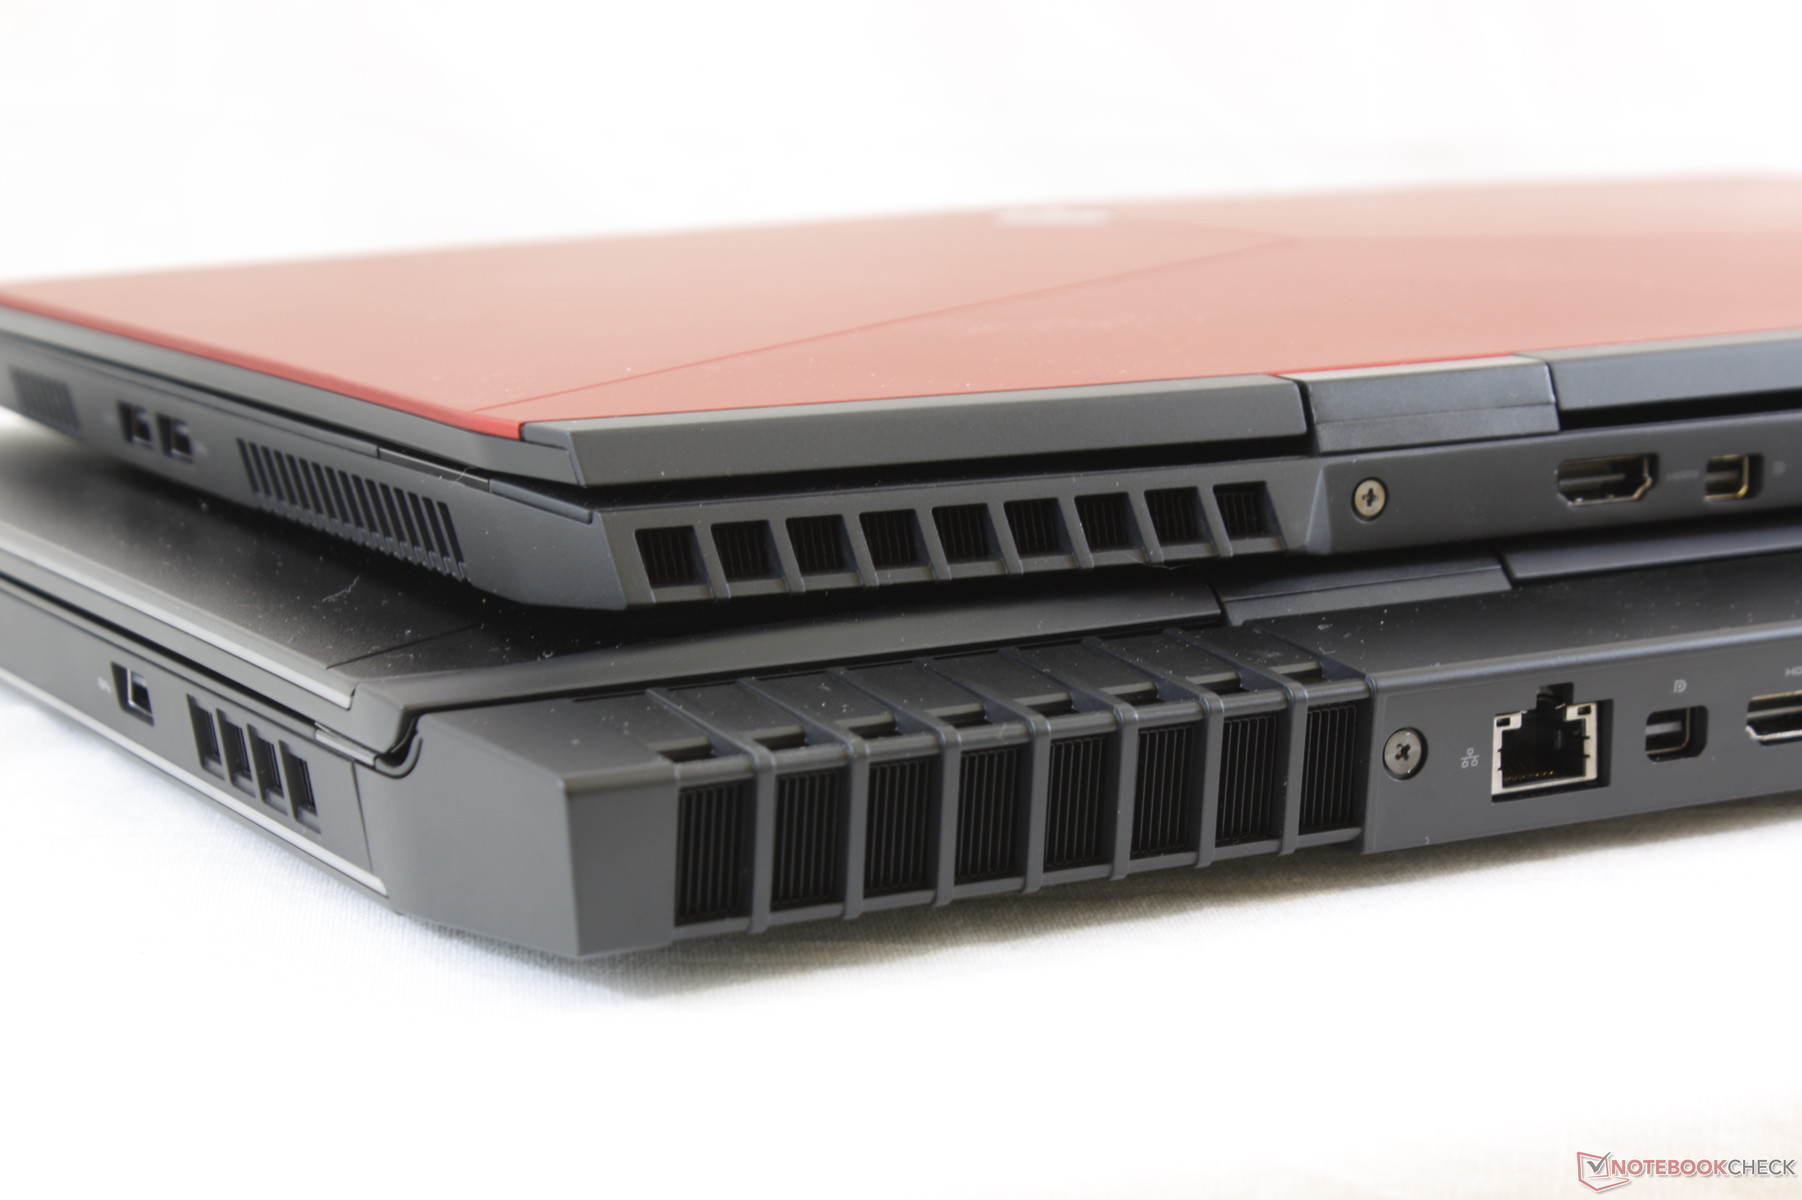

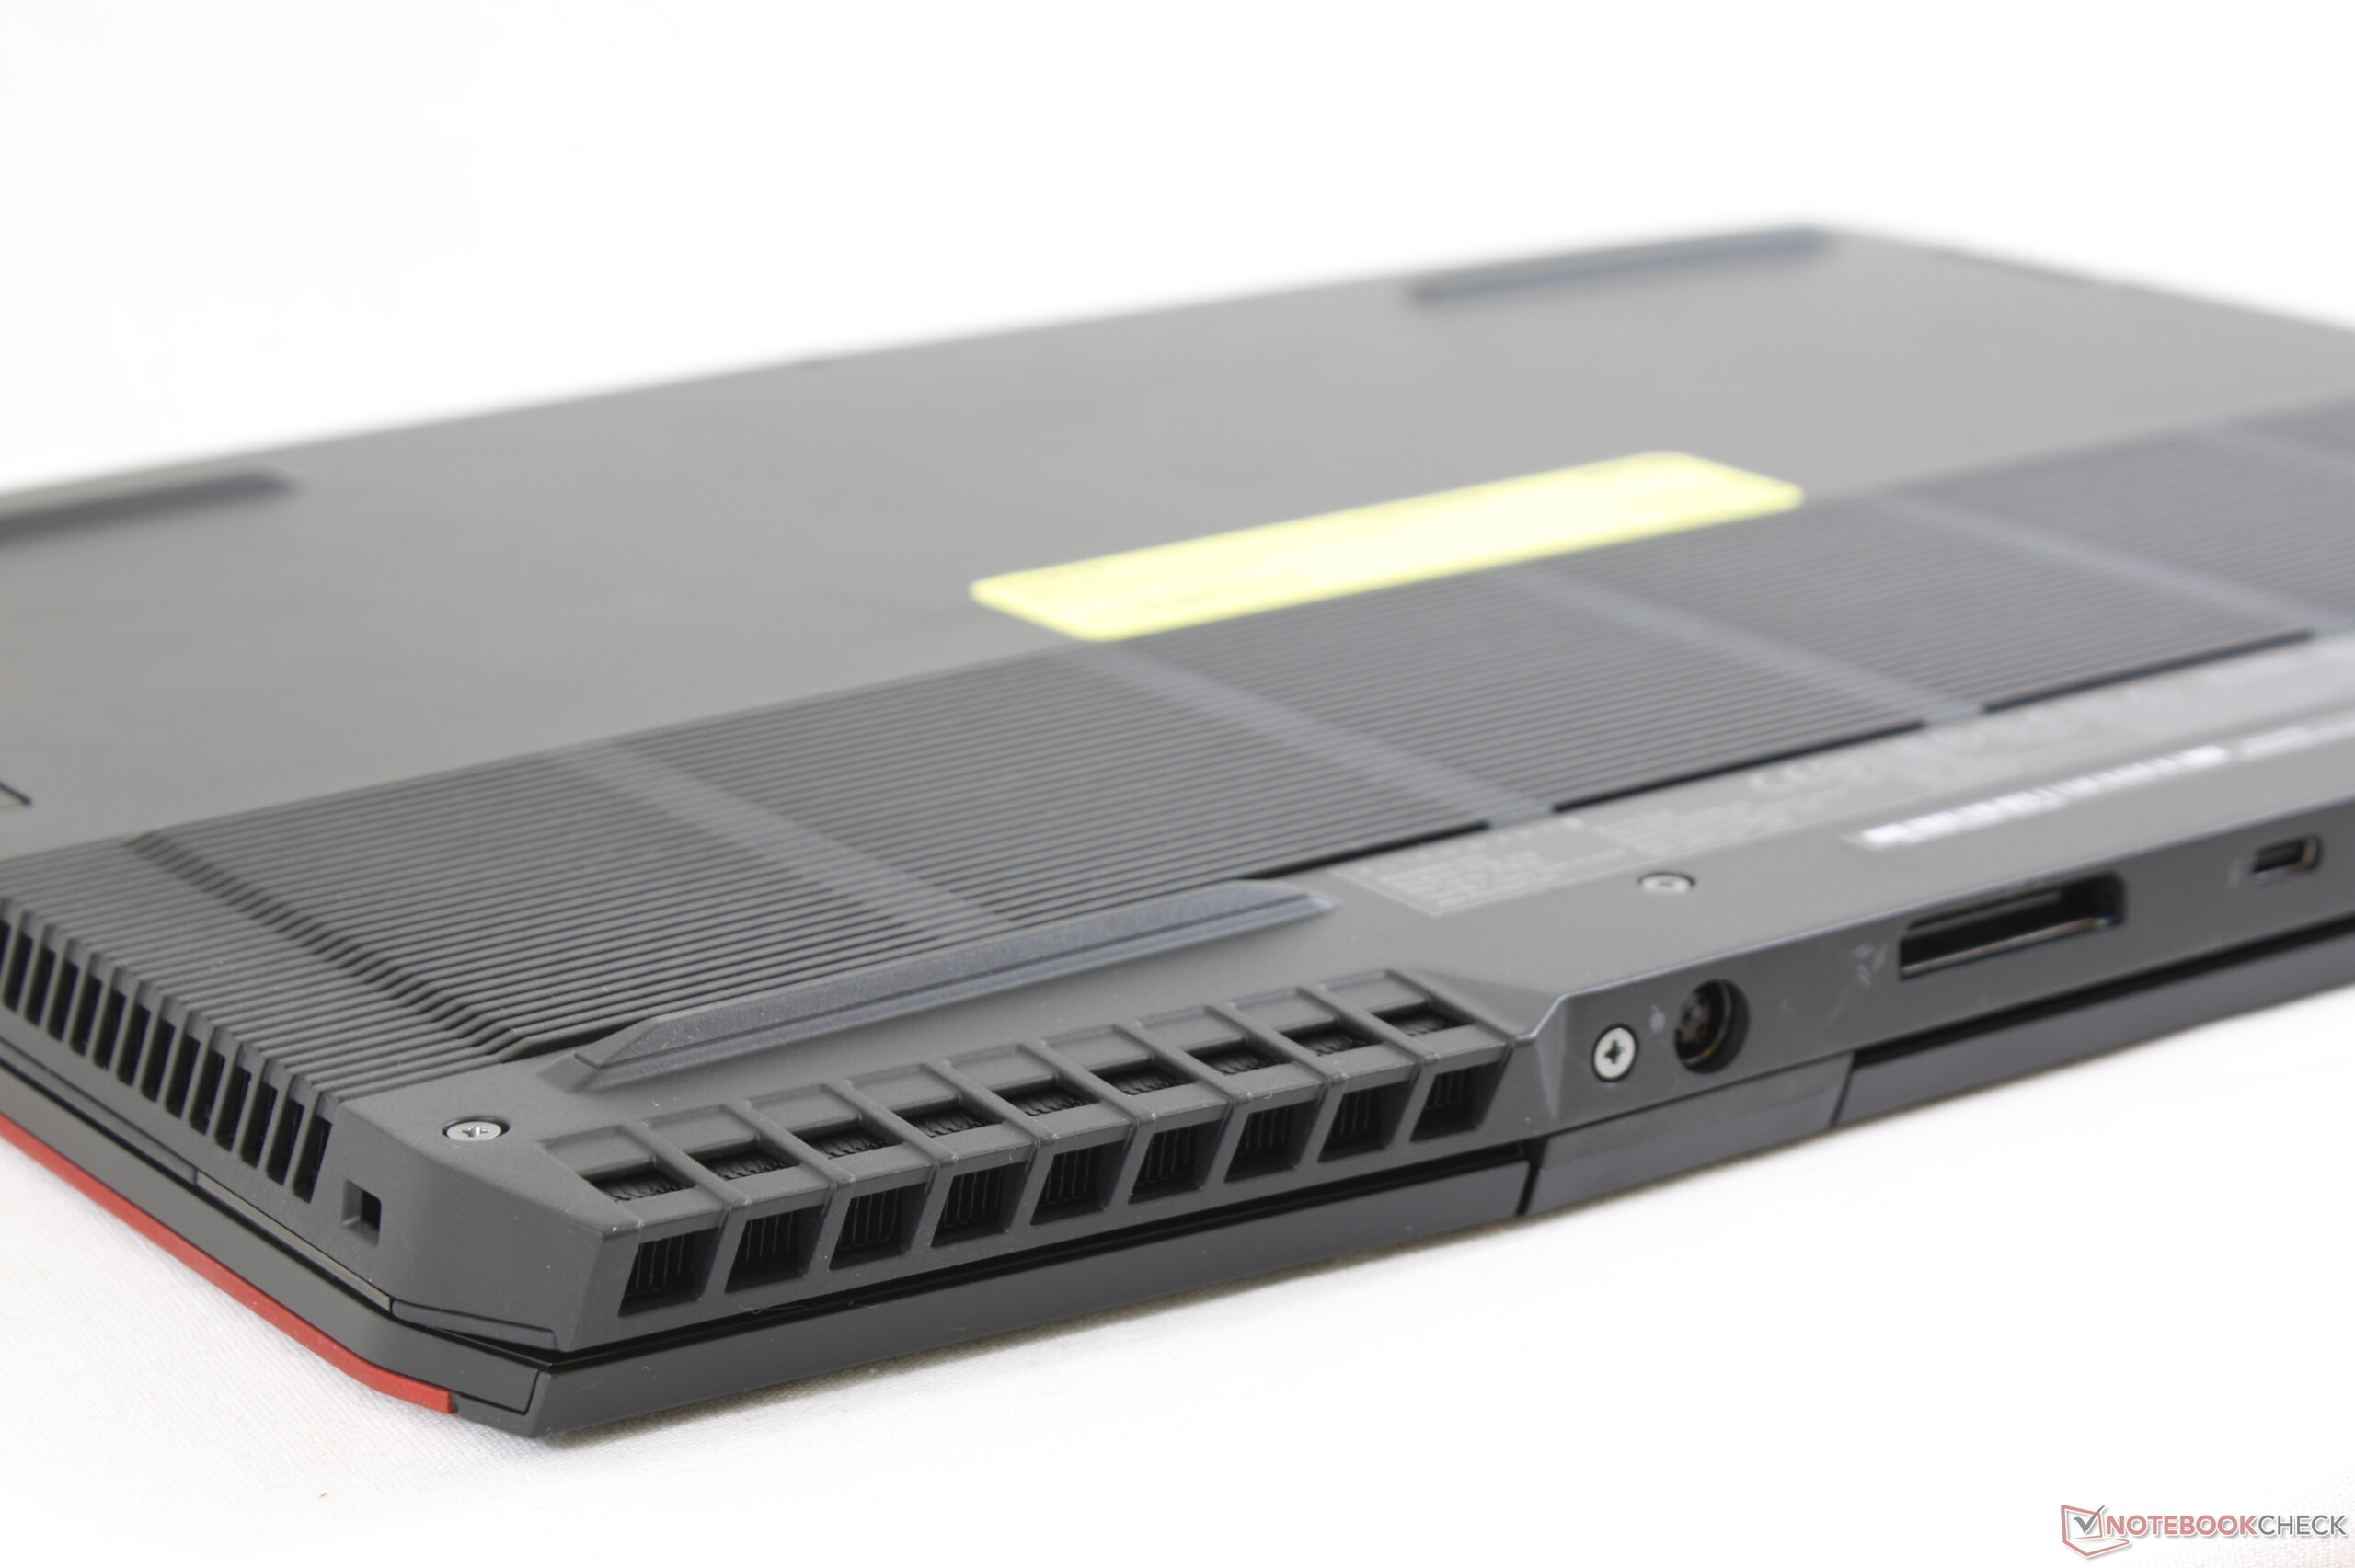
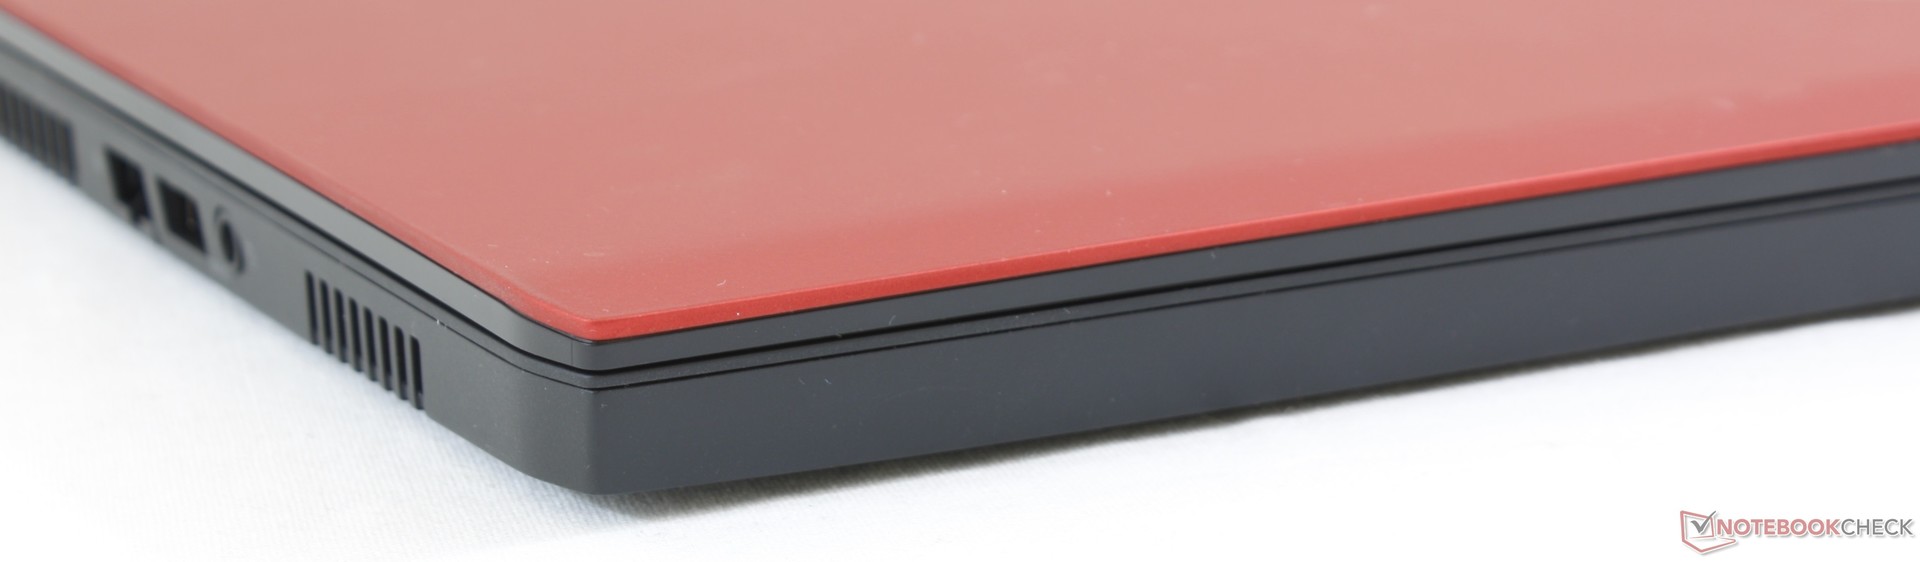
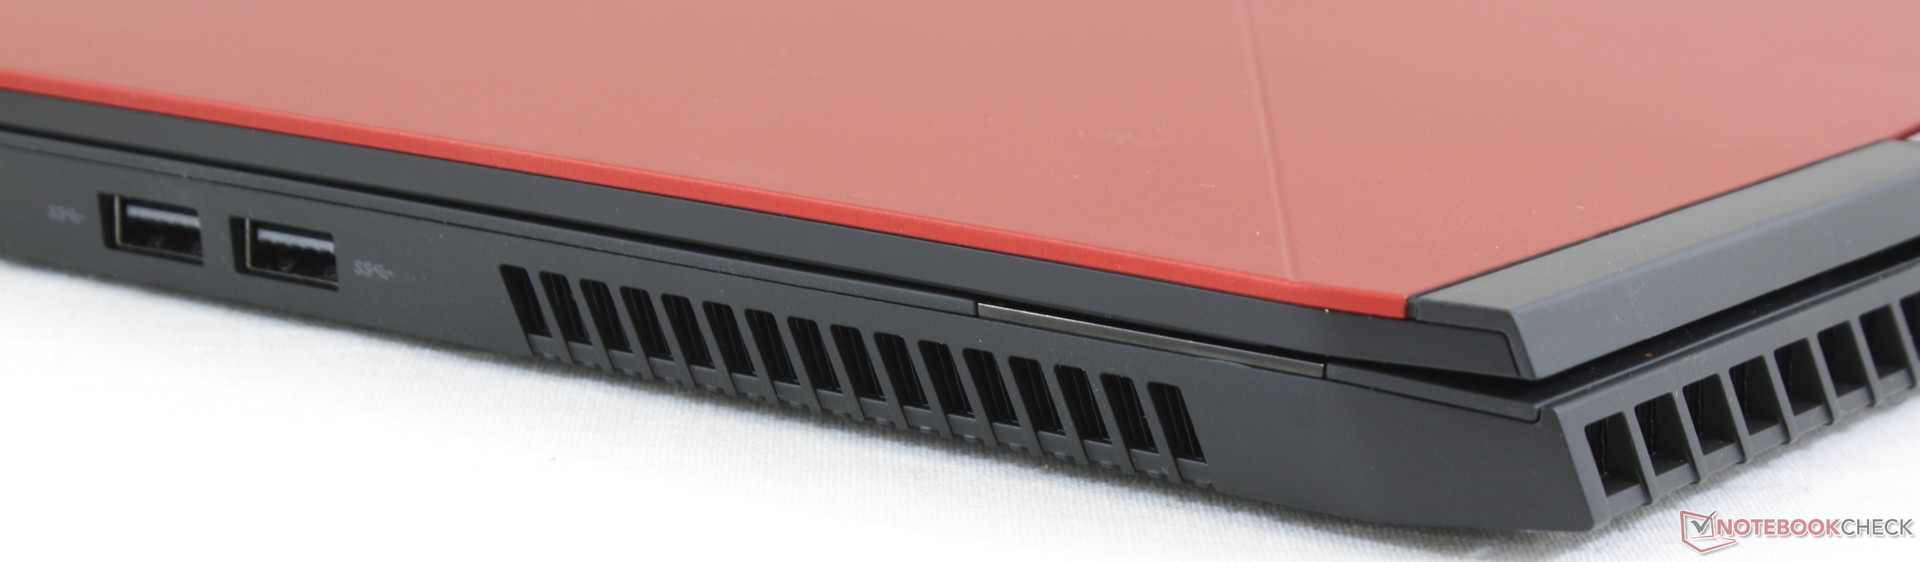
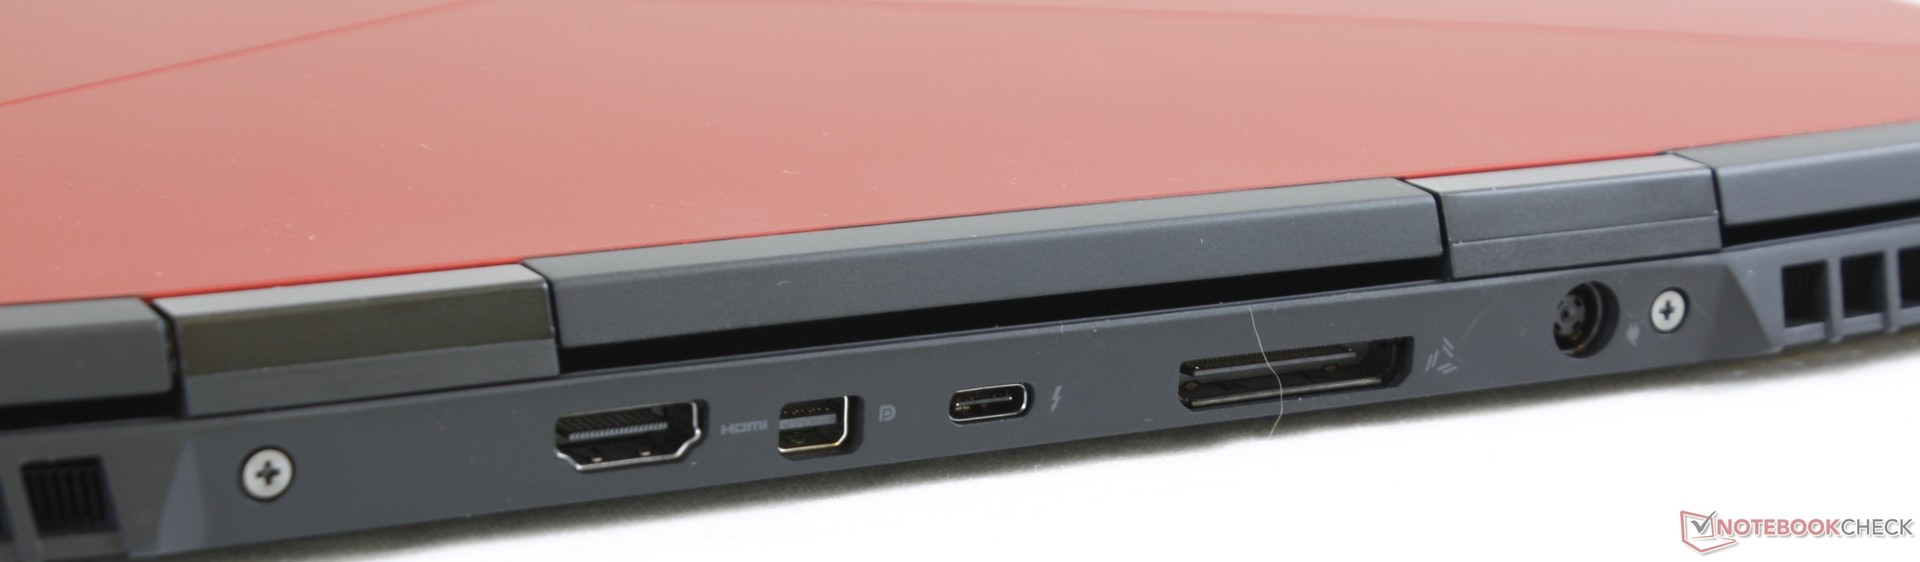
Connectivity
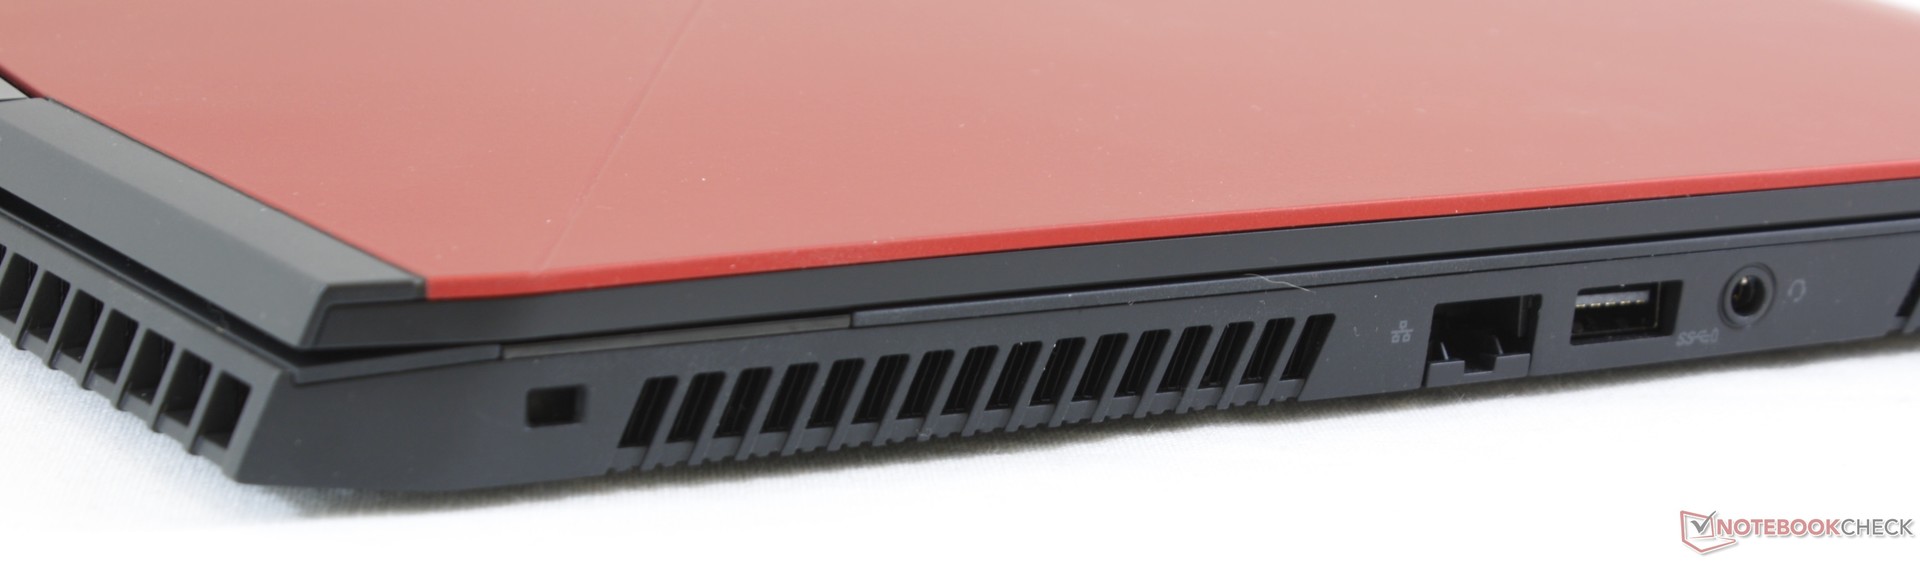
The Alienware m15 has the exact same ports as the Razer Blade 15 but with one special extra: the proprietary Graphics Amplifier port. Unlike Thunderbolt 3, this port offers the full PCIe x16 bandwidth for the external Alienware Graphics dock should users choose to go that route.
Port positioning has its pros and cons. While the side ports are easy to reach, they occupy desk space and are rather close to the front. The commonly used USB Type-C port on the rear can be annoying to access since it is quite small. The larger Alienware 15 includes two USB Type-C ports to avoid this small nuisance.
There is still no SD card reader which shouldn't be surprising since the larger standard model omits one as well.
Communication
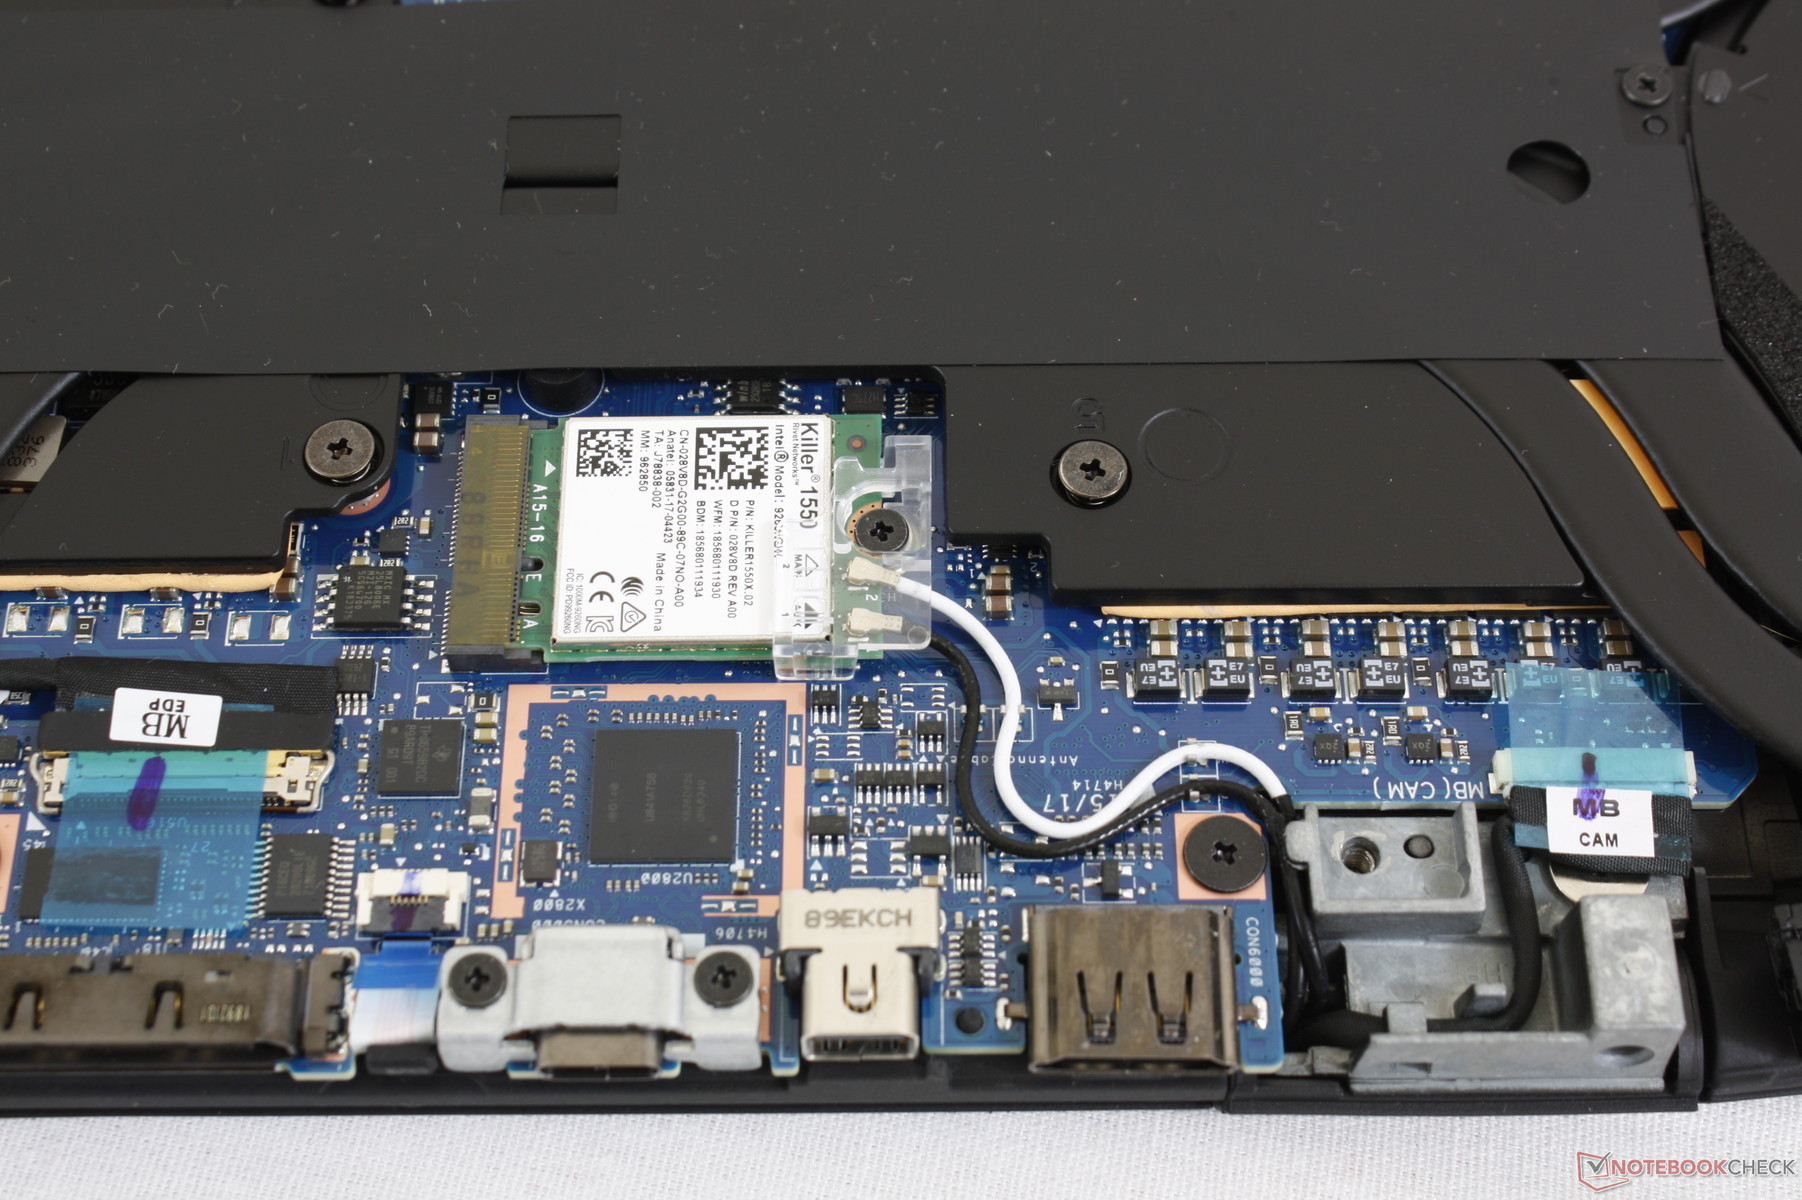
All current SKUs come standard with the Killer 1550 for integrated Bluetooth 5 and theoretical transfer rates of 1.73 Gbps. Its key advantages over the Intel 9560 are its Killer Control Center software and customizeable network prioritization features that hardcore gamers may appreciate. The module can also turn the notebook into an access point to extend the wireless range of a home network.
Our test server is limited by a 1 Gbps line and so the Killer 1550 can perform faster than what we've recorded below. We didn't experience any connectivity issues during our time with the unit.
Maintenance
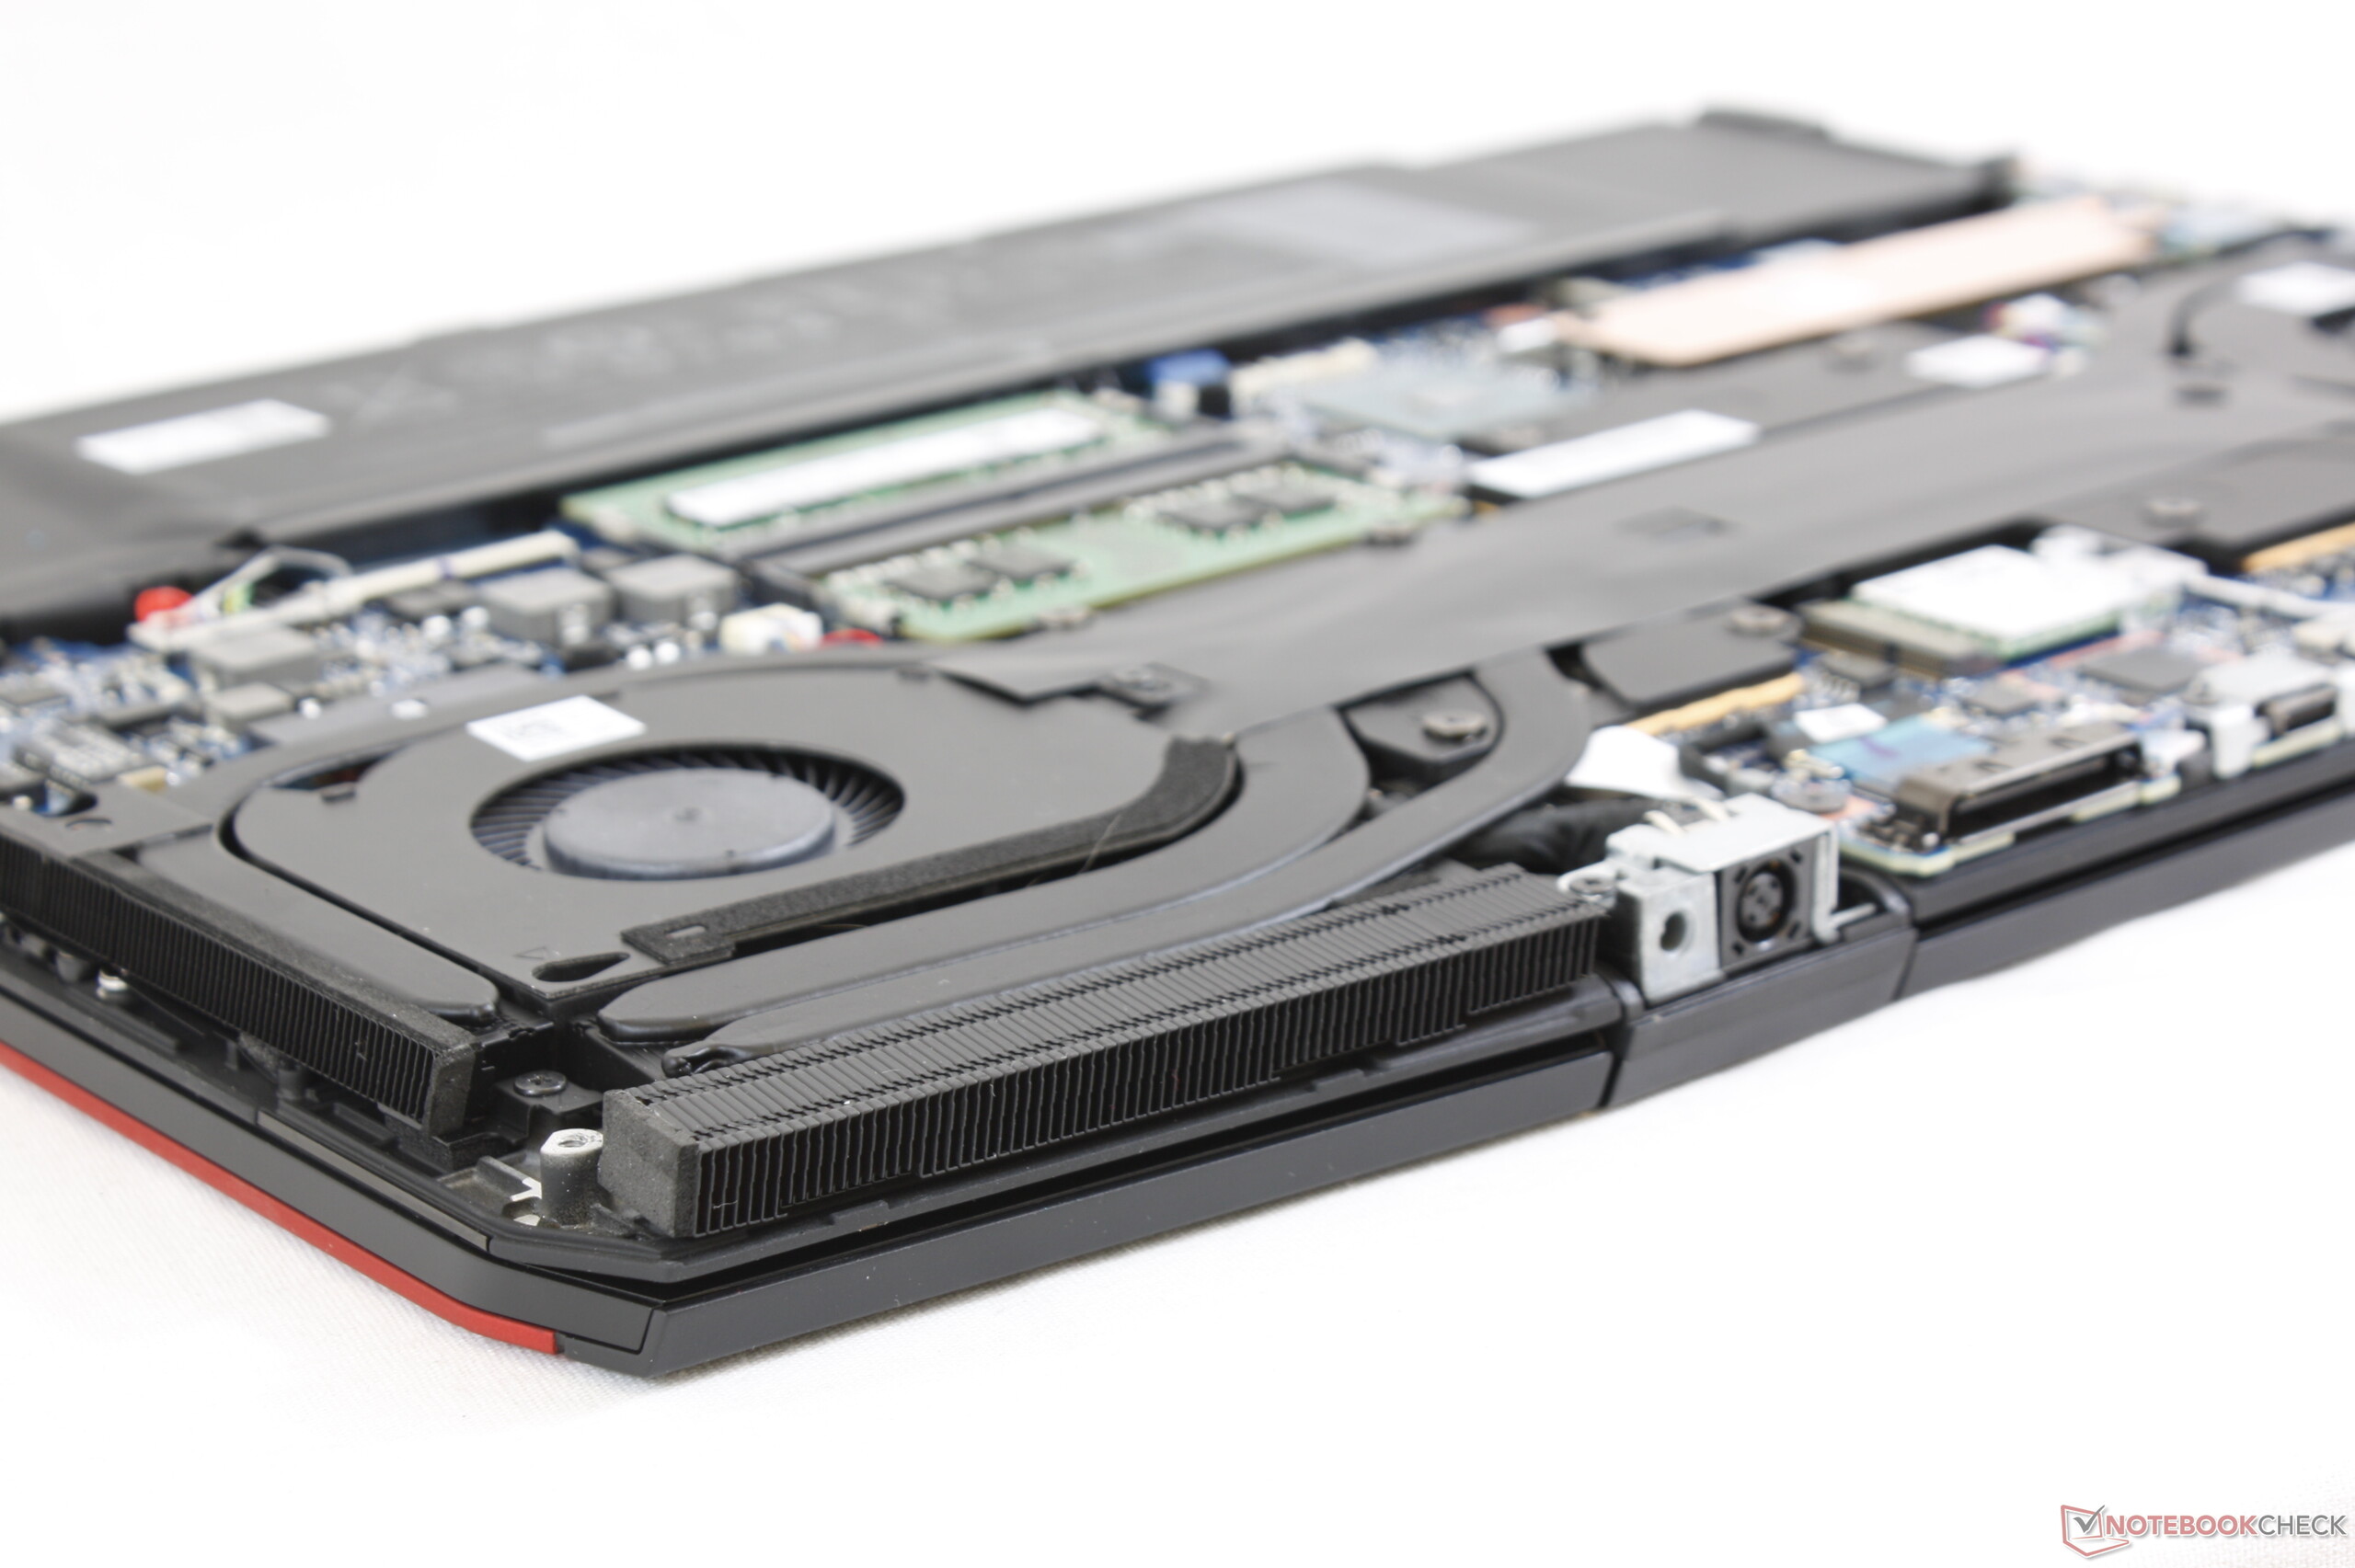
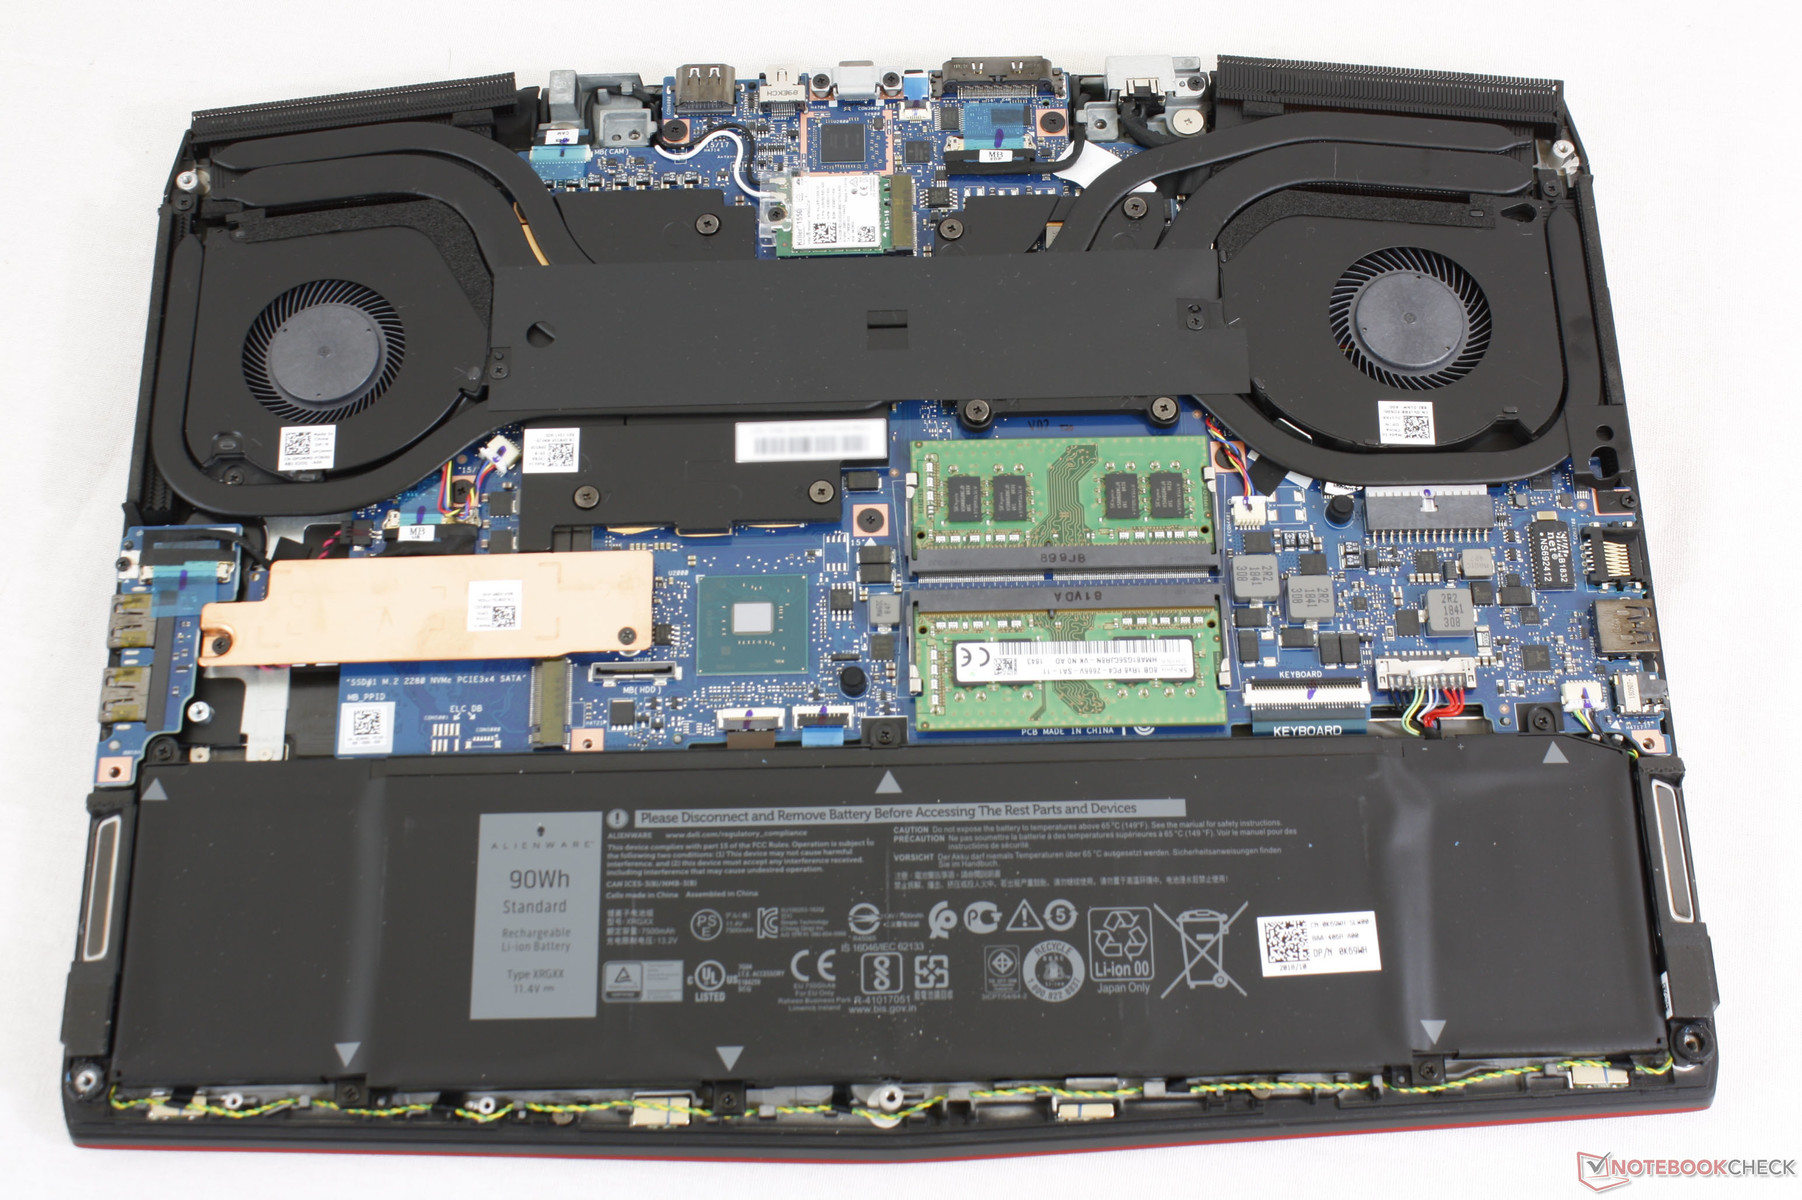
Serviceability requires a Philips screwdriver and sharp edge. Gone is the reinforced skeleton of the Alienware 15 series for a completely open motherboard design. Servicing is thus easier on the m15 at the cost of a slightly more flexible base as we've noted above. Even so, we're glad that additional disassembly is not required to service most components unlike on the MSI GS65.
Accessories and Warranty
There are no extras in the box outside of the Quick Start guide and warranty card. A cleaning cloth or carrying case would have been nice additions.
The standard one-year limited warranty applies with options to extend up to five years. Please see our Guarantees, Return policies and Warranties article for country-specific information.
Input Devices
Keyboard
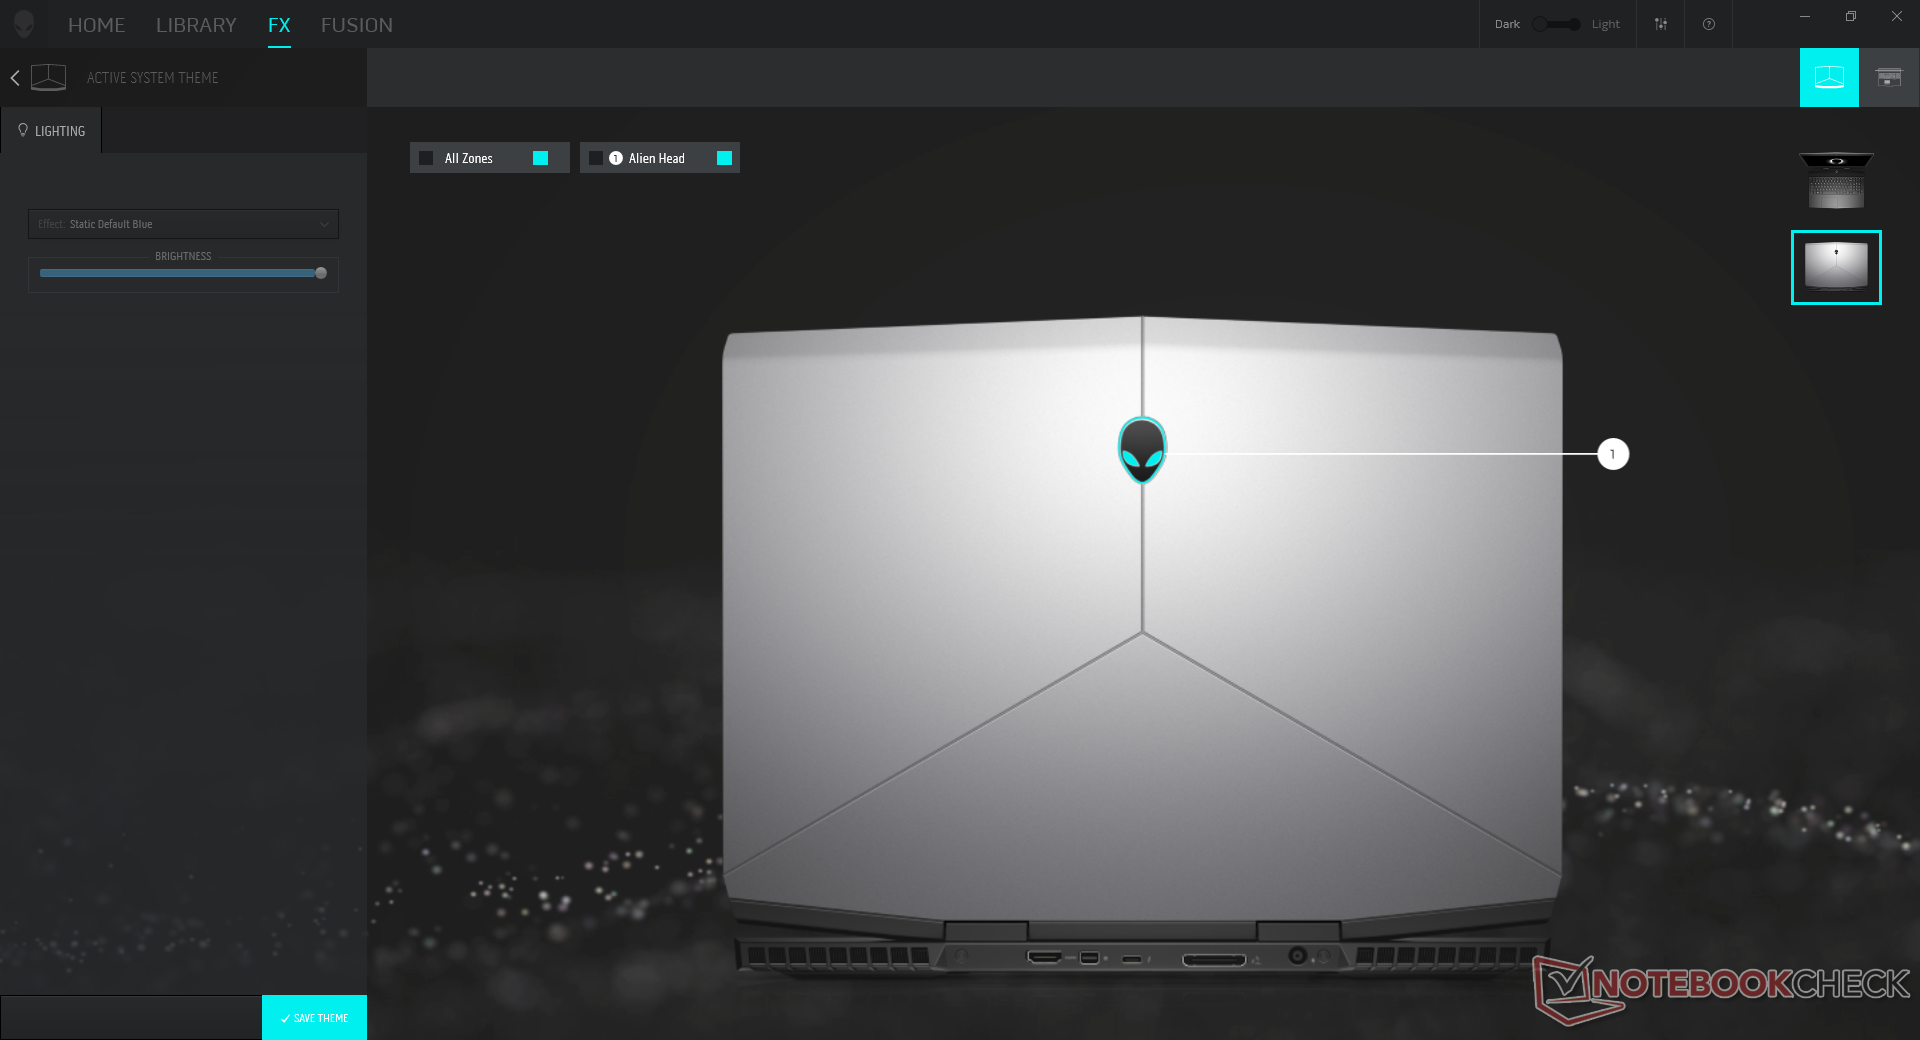
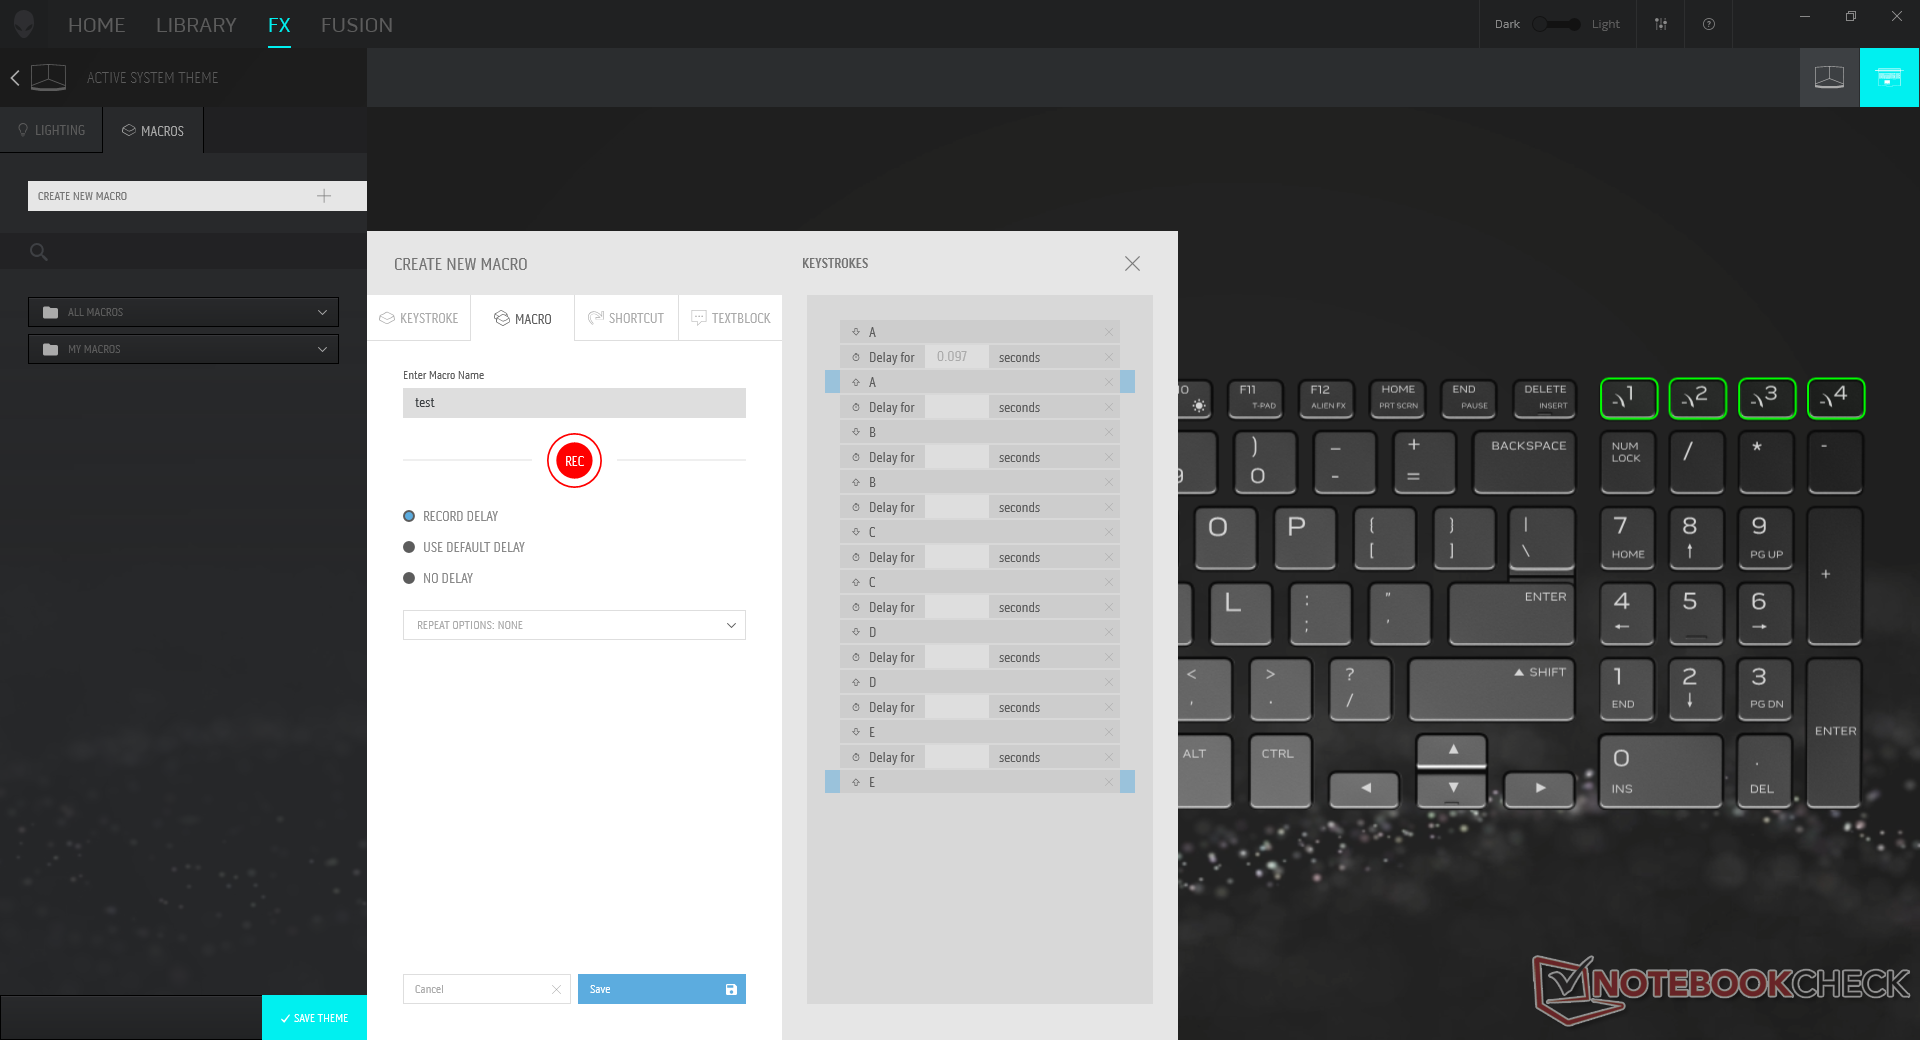
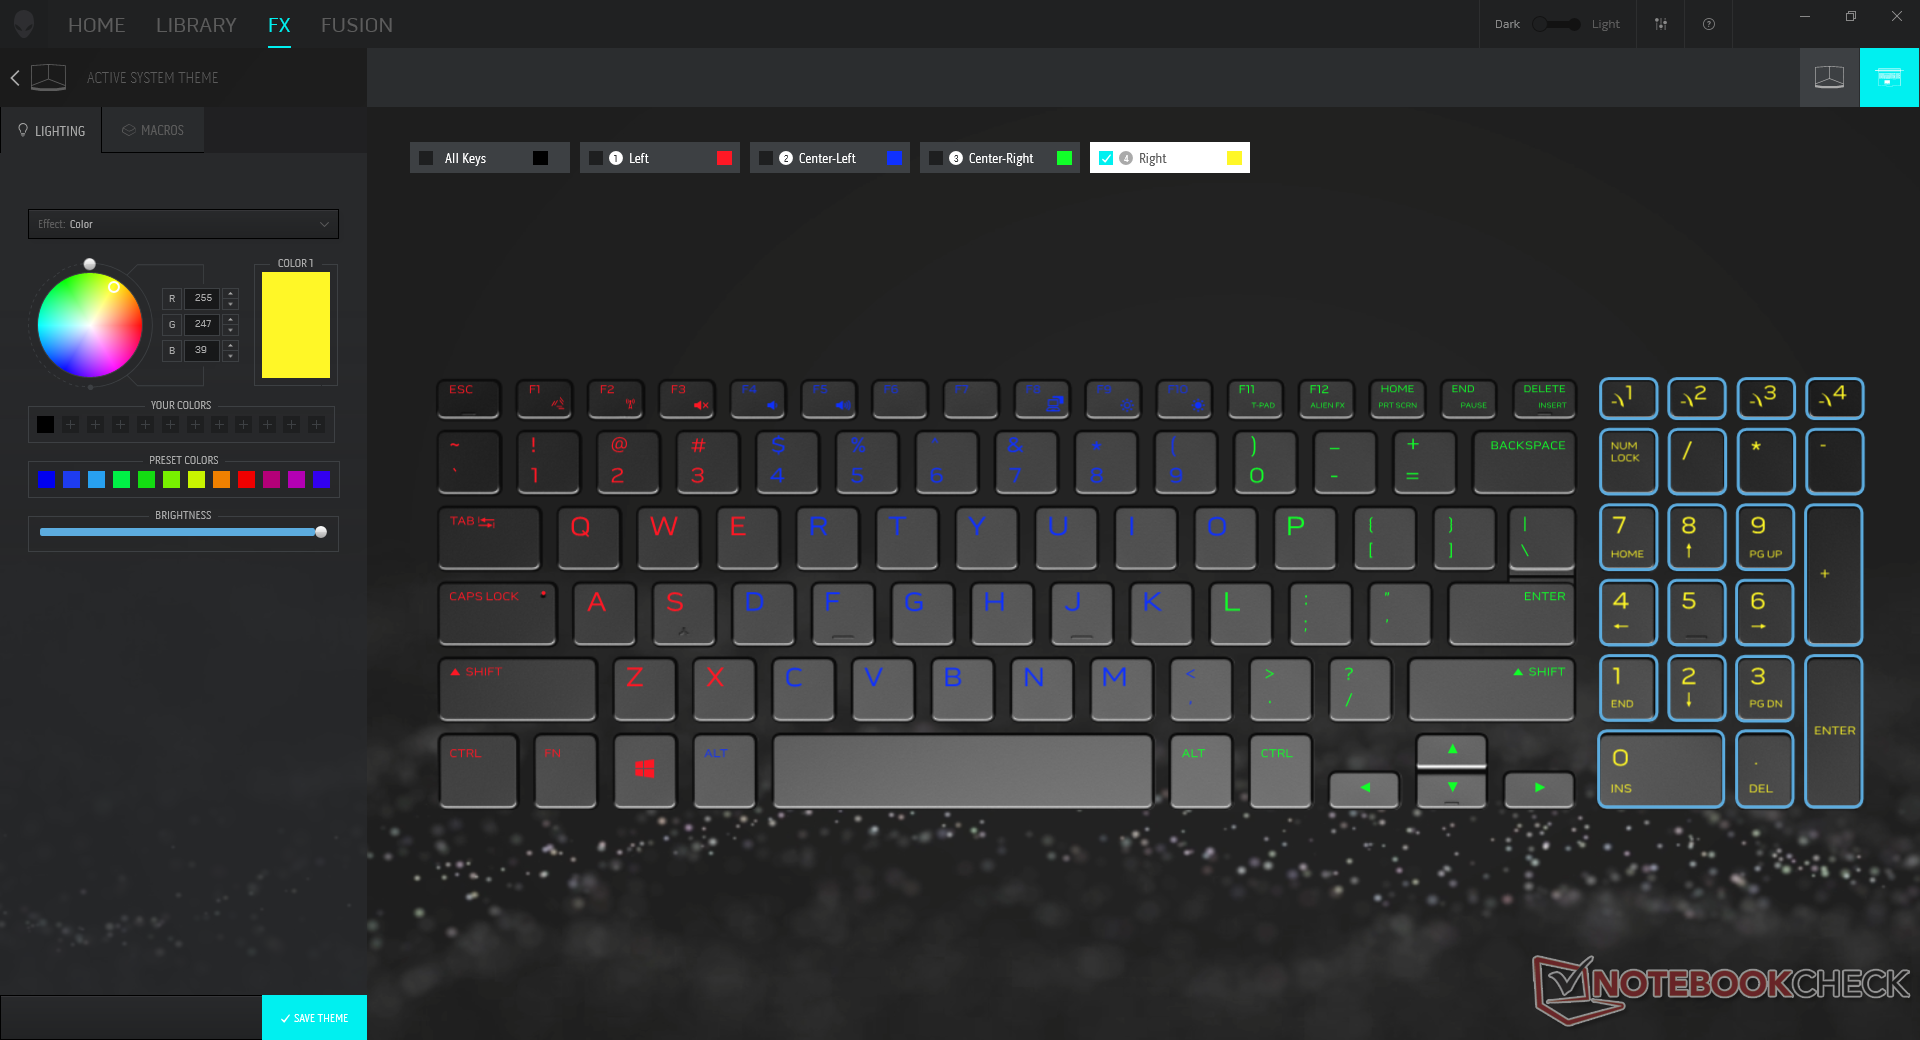
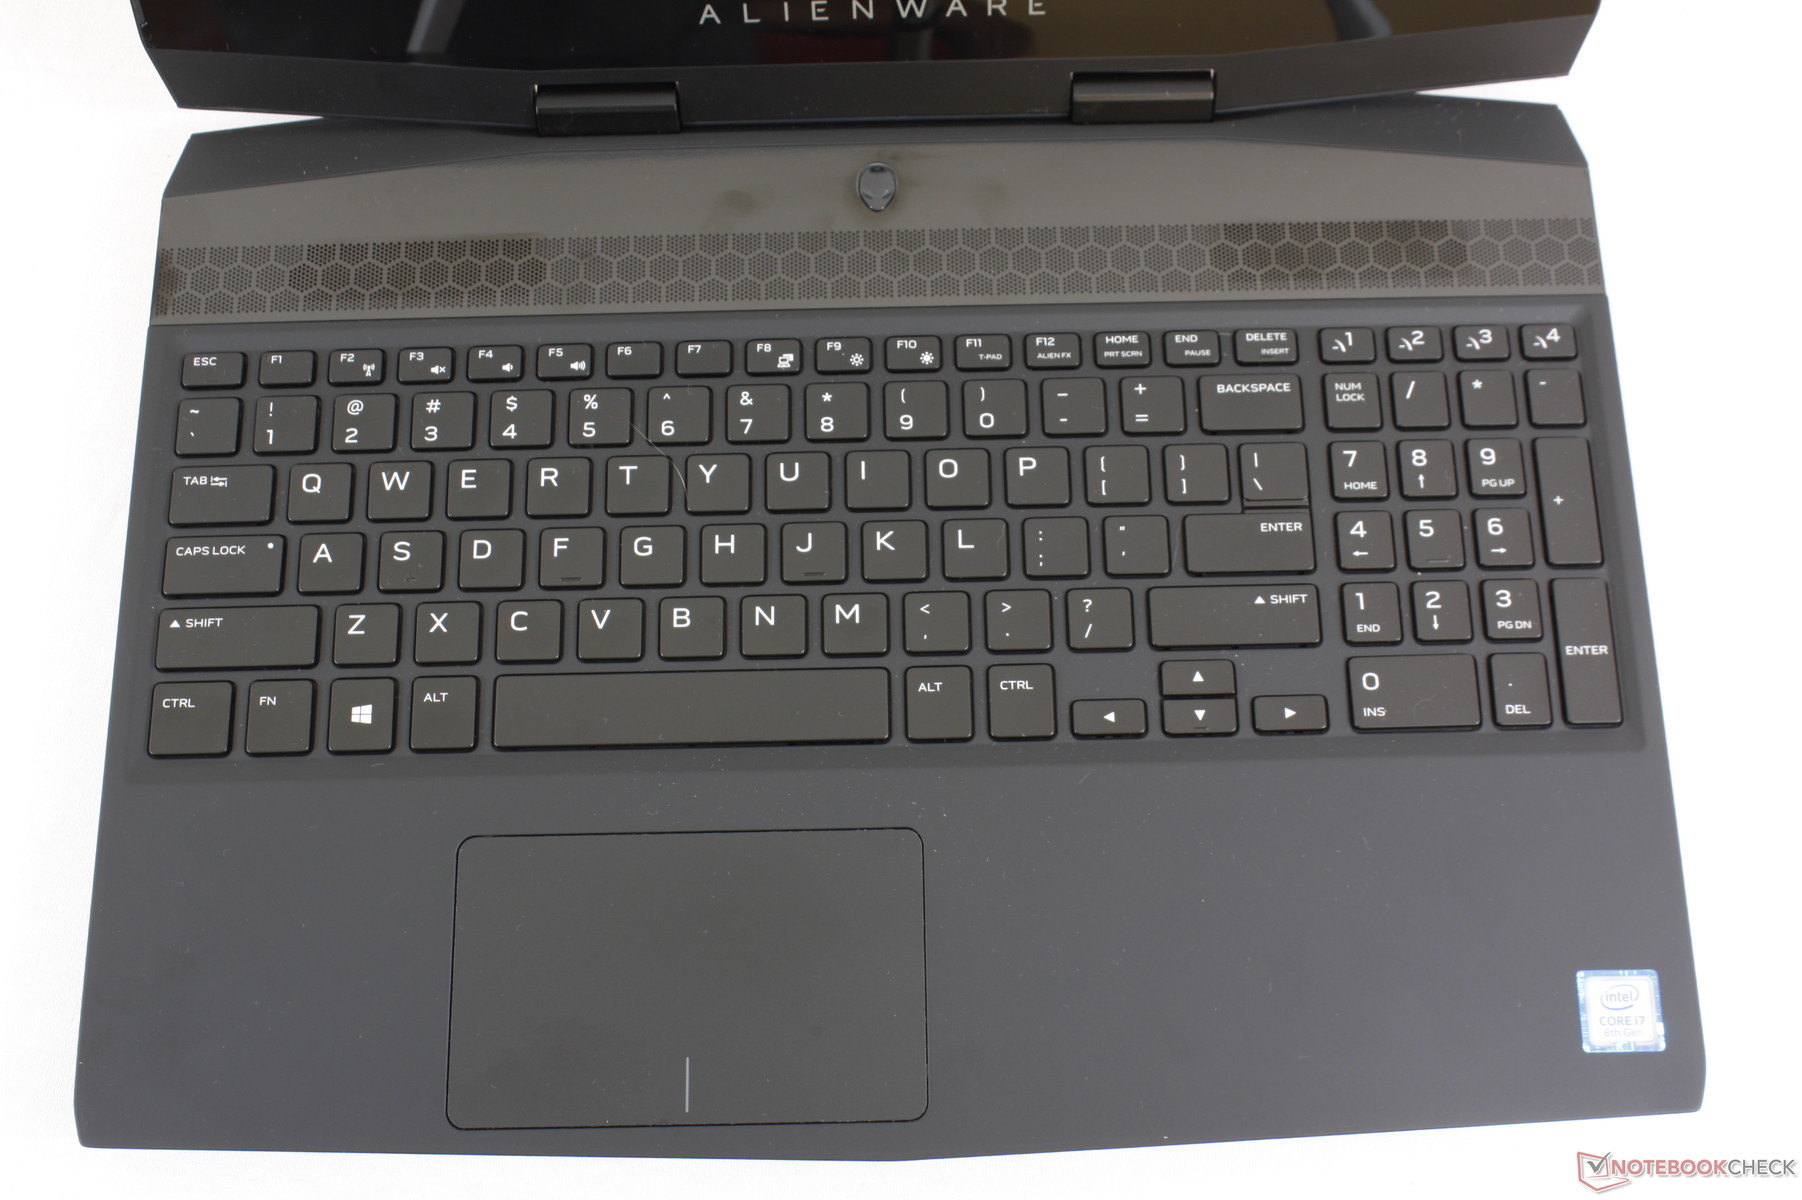
Dell has completely revamped the keyboard. Whereas the beveled keyboard on the 15 R4 is per-key RGB lit with no NumPad, the chiclet m15 keyboard is quad-zone RGB with a dedicated NumPad. Clatter is a bit louder but feedback feels nearly the same. The notable exceptions are the smaller first row of function keys and the Arrow keys as these are noticeably spongier on the m15 than the equivalent keys on the 15 R4. Additionally, the NumPad keys are narrower than the main QWERTY keys and they can can feel cramped to use as a result.
key travel is short at just 1.4 mm to be the same as last year's Dell Inspiron 15 7577. A deeper key travel like the 2.2 mm keys of the larger Alienware 17 or Gigabyte P55W would have made the typing experience closer to a standard desktop keyboard. Gamers may find the m15 keyboard a bit shallower than what they are accustomed to.
Annoyingly, there is no hotkey for quickly adjusting the brightness of the keyboard backlight. We can at least appreciate that all letters and symbols are highlighted when the backlight is on unlike on the Razer Blade 15 series.
Touchpad
The trackpad on the m15 is larger than the trackpad on the 15 R4 (10.5 x 6.5 cm vs. 10.0 x 5.0 cm) despite the significant differences in chassis size. This was achieved by omitting the dedicated mouse keys found on the 15 R4. Surface texture is otherwise similar between them except that the m15 trackpad is slightly more susceptible to flexing.
The new integrated mouse keys are very shallow in travel with slightly firmer feedback than the trackpads on the XPS 15 9570 or GS65. When compared to the 15 R4, the keys have a louder and more satisfying click when pressed. It's still a trade-off because the m15 trackpad is roomier for multi-touch inputs and general cursor control while the 15 R4 is better for more accurate mouse clicks. Either way, most users will likely have an external mouse ready for gaming purposes.
Display
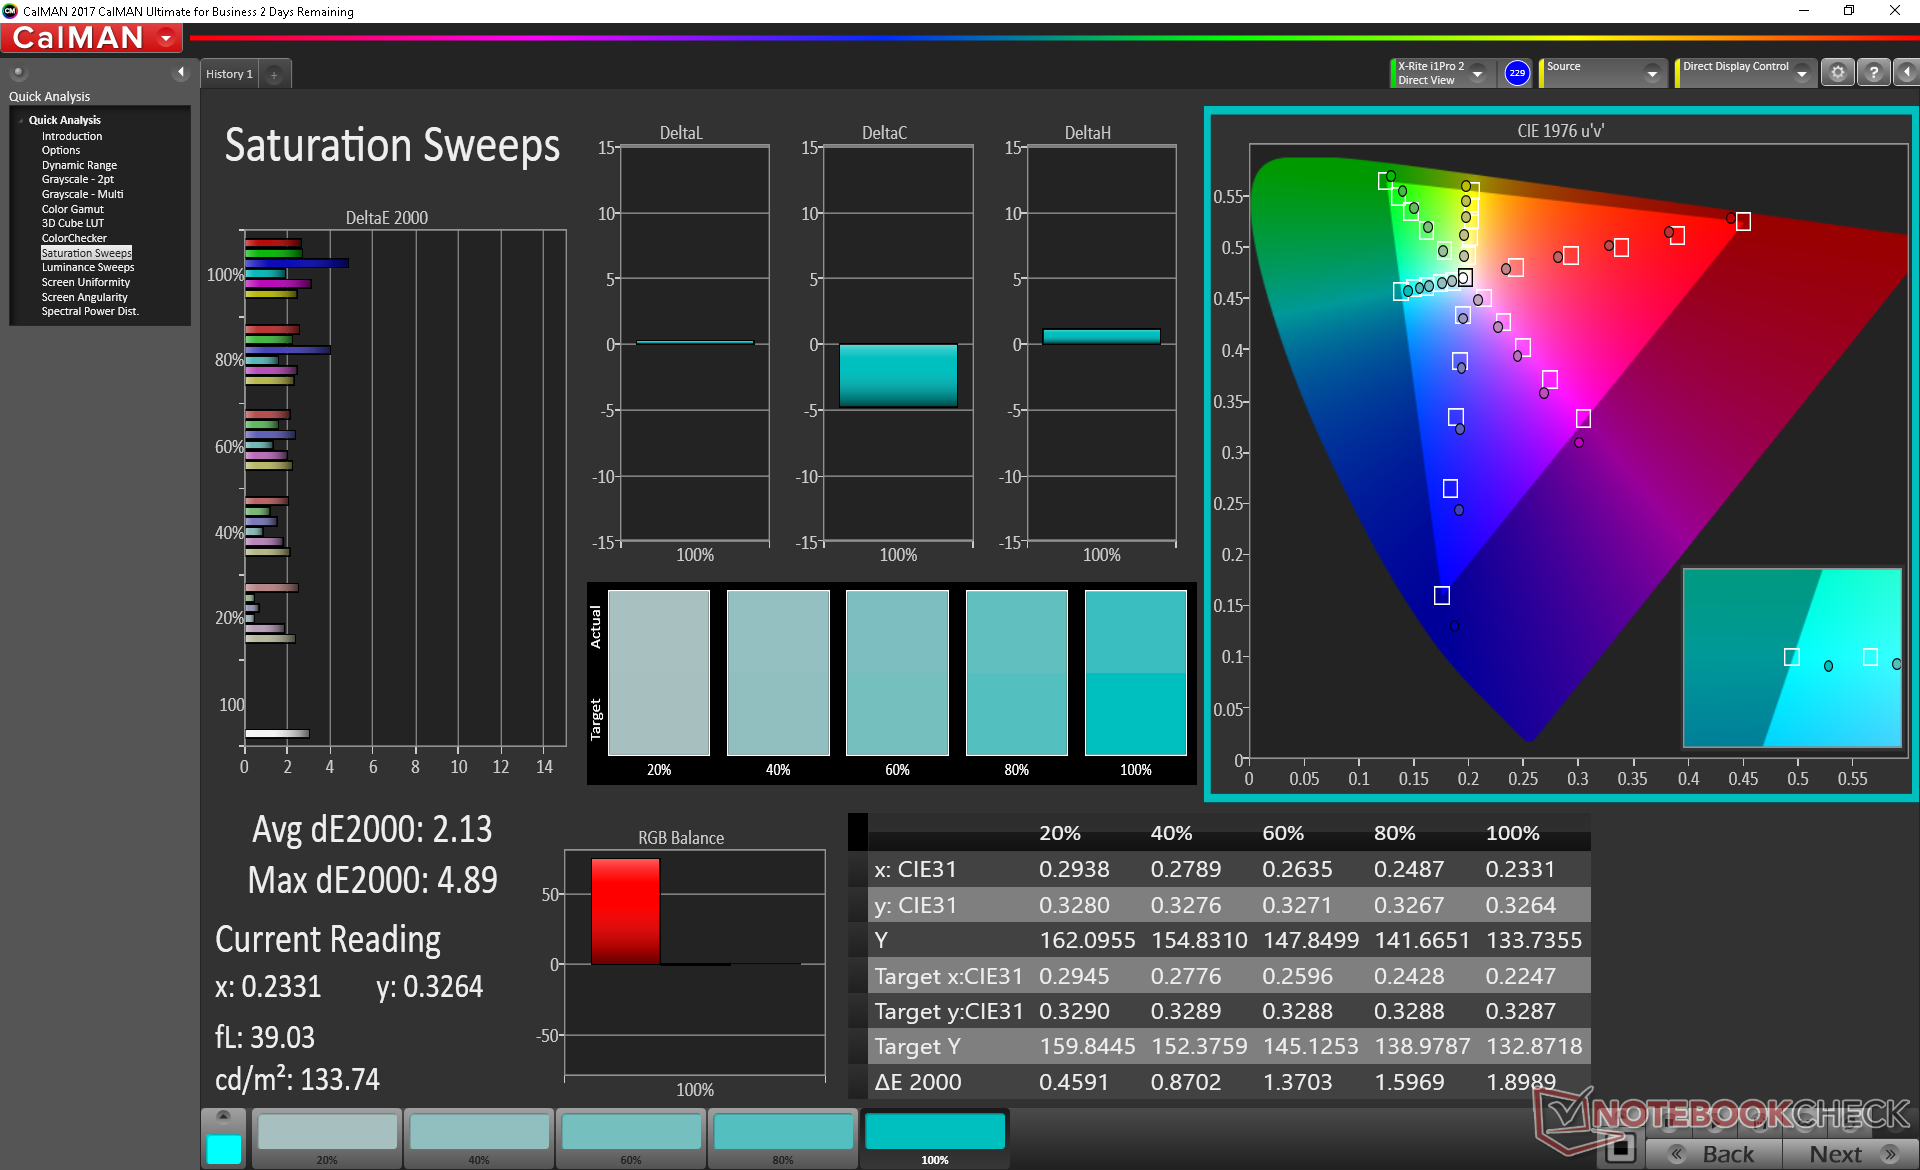
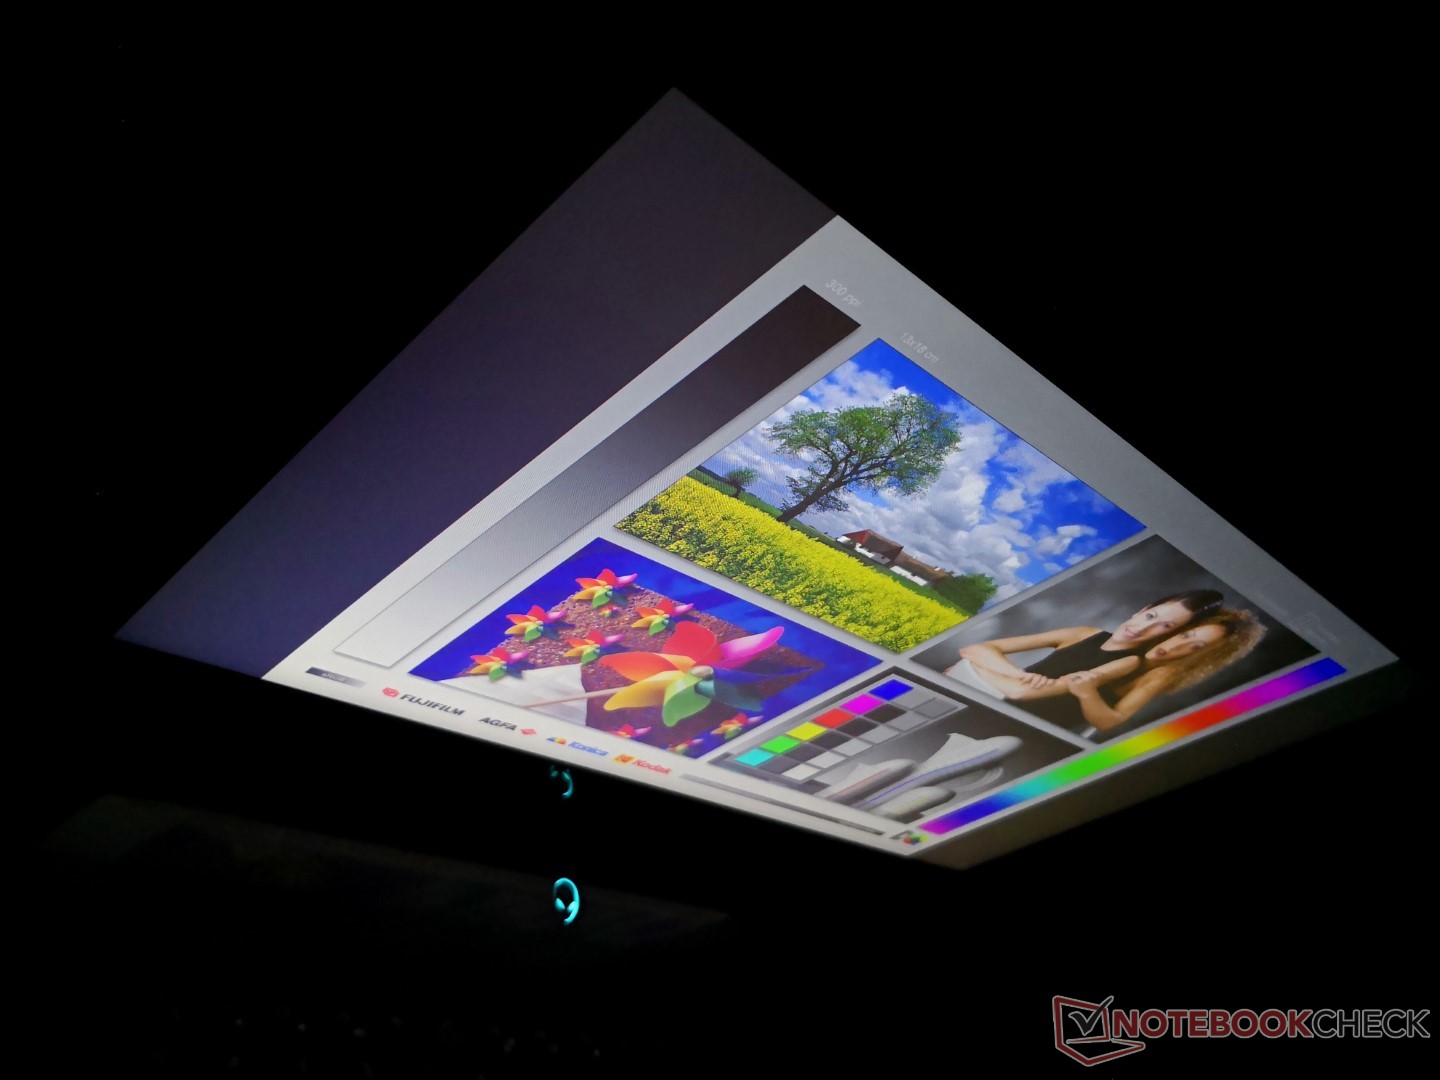
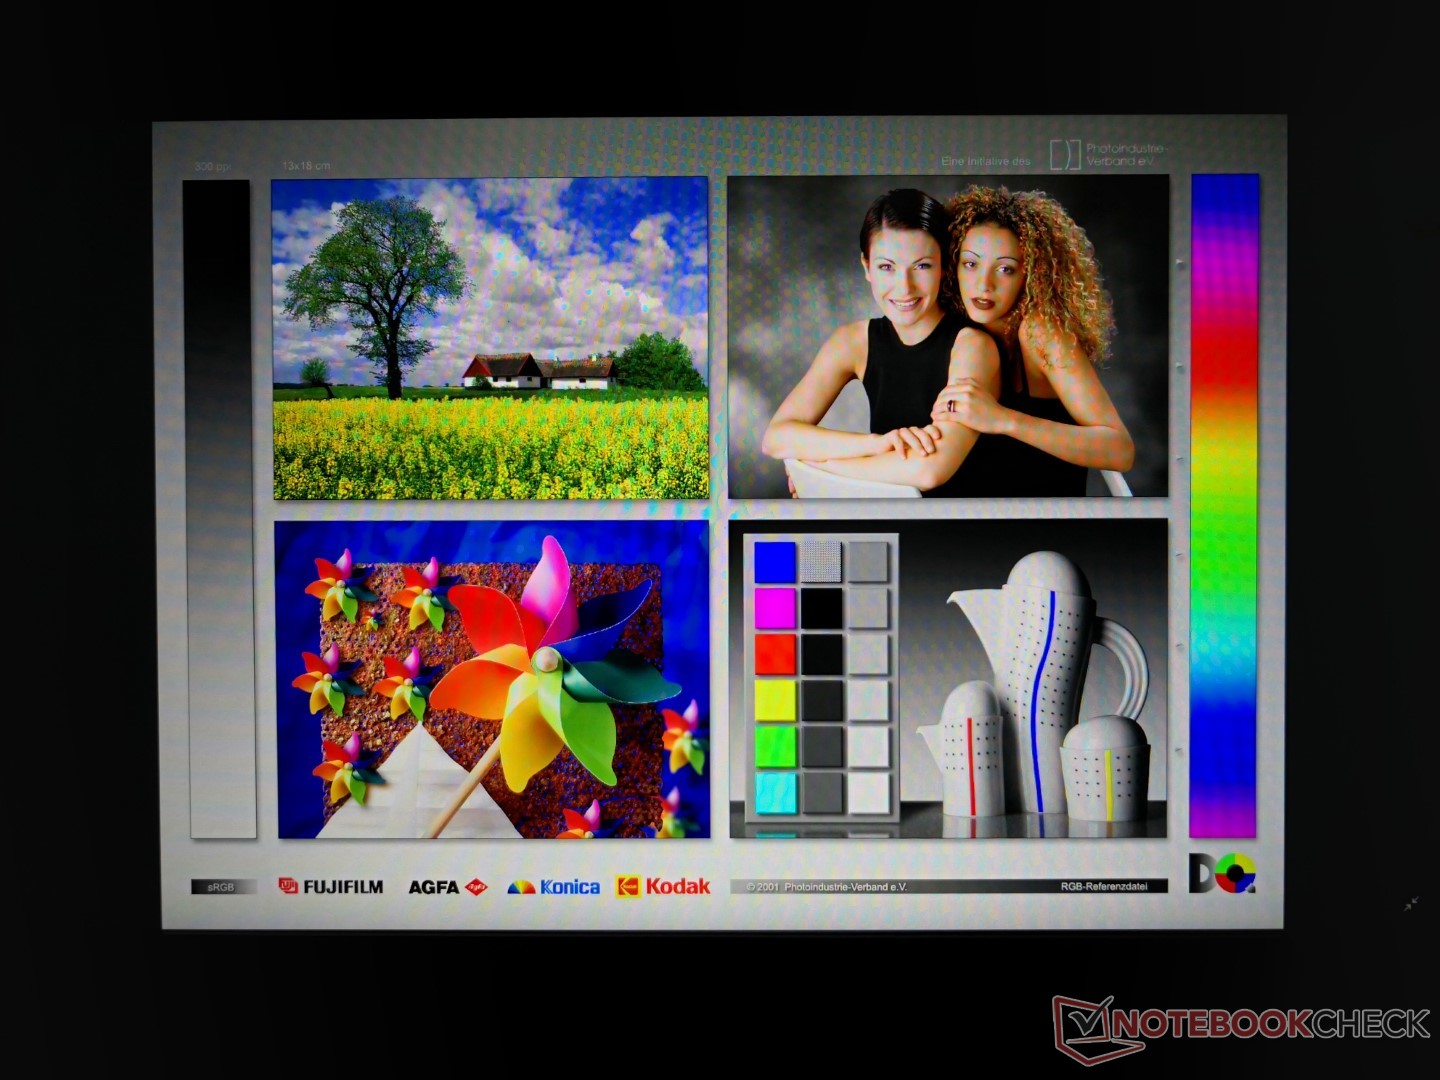
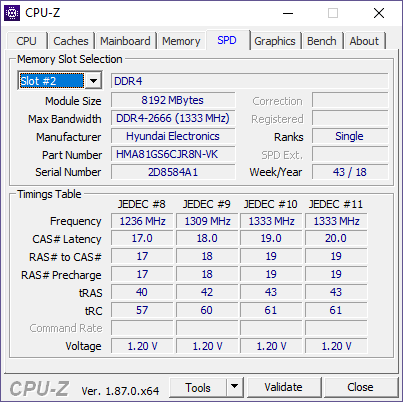
Users can choose between 1080p 60 Hz, 1080p 144 Hz, or 4K UHD 60 Hz. Our 1080p 144 Hz SKU utilizes the same AU Optronics AUO80ED panel as found on the MSI GS65 and so both laptops share similar characteristics such as response times, contrast ratio, and color space. Dell advertises a 300-nit display, but our independent measurements are closer to 350 nits to be slightly brighter than the average gaming laptop.
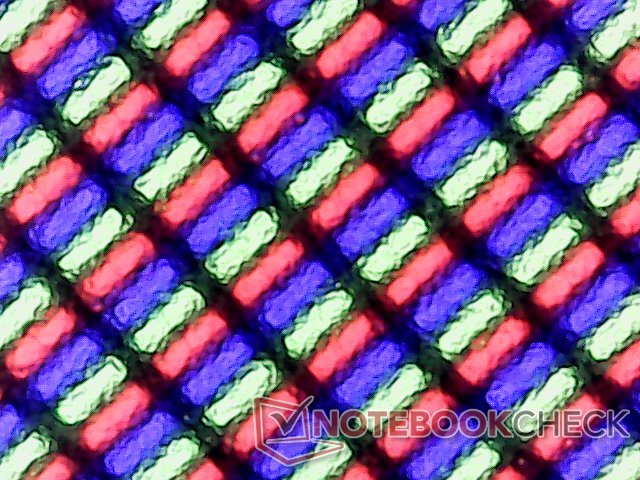
Display quality is excellent with only a small hint of graininess common amongst matte panels. The very fast response times and high refresh rate are immediately noticeable and a boon to gaming to reduce both screen tearing and ghosting. Users who opt in for the pricier 4K UHD option will be gaining both a higher resolution and wider color gamut at the expense of slower refresh rate and response times.
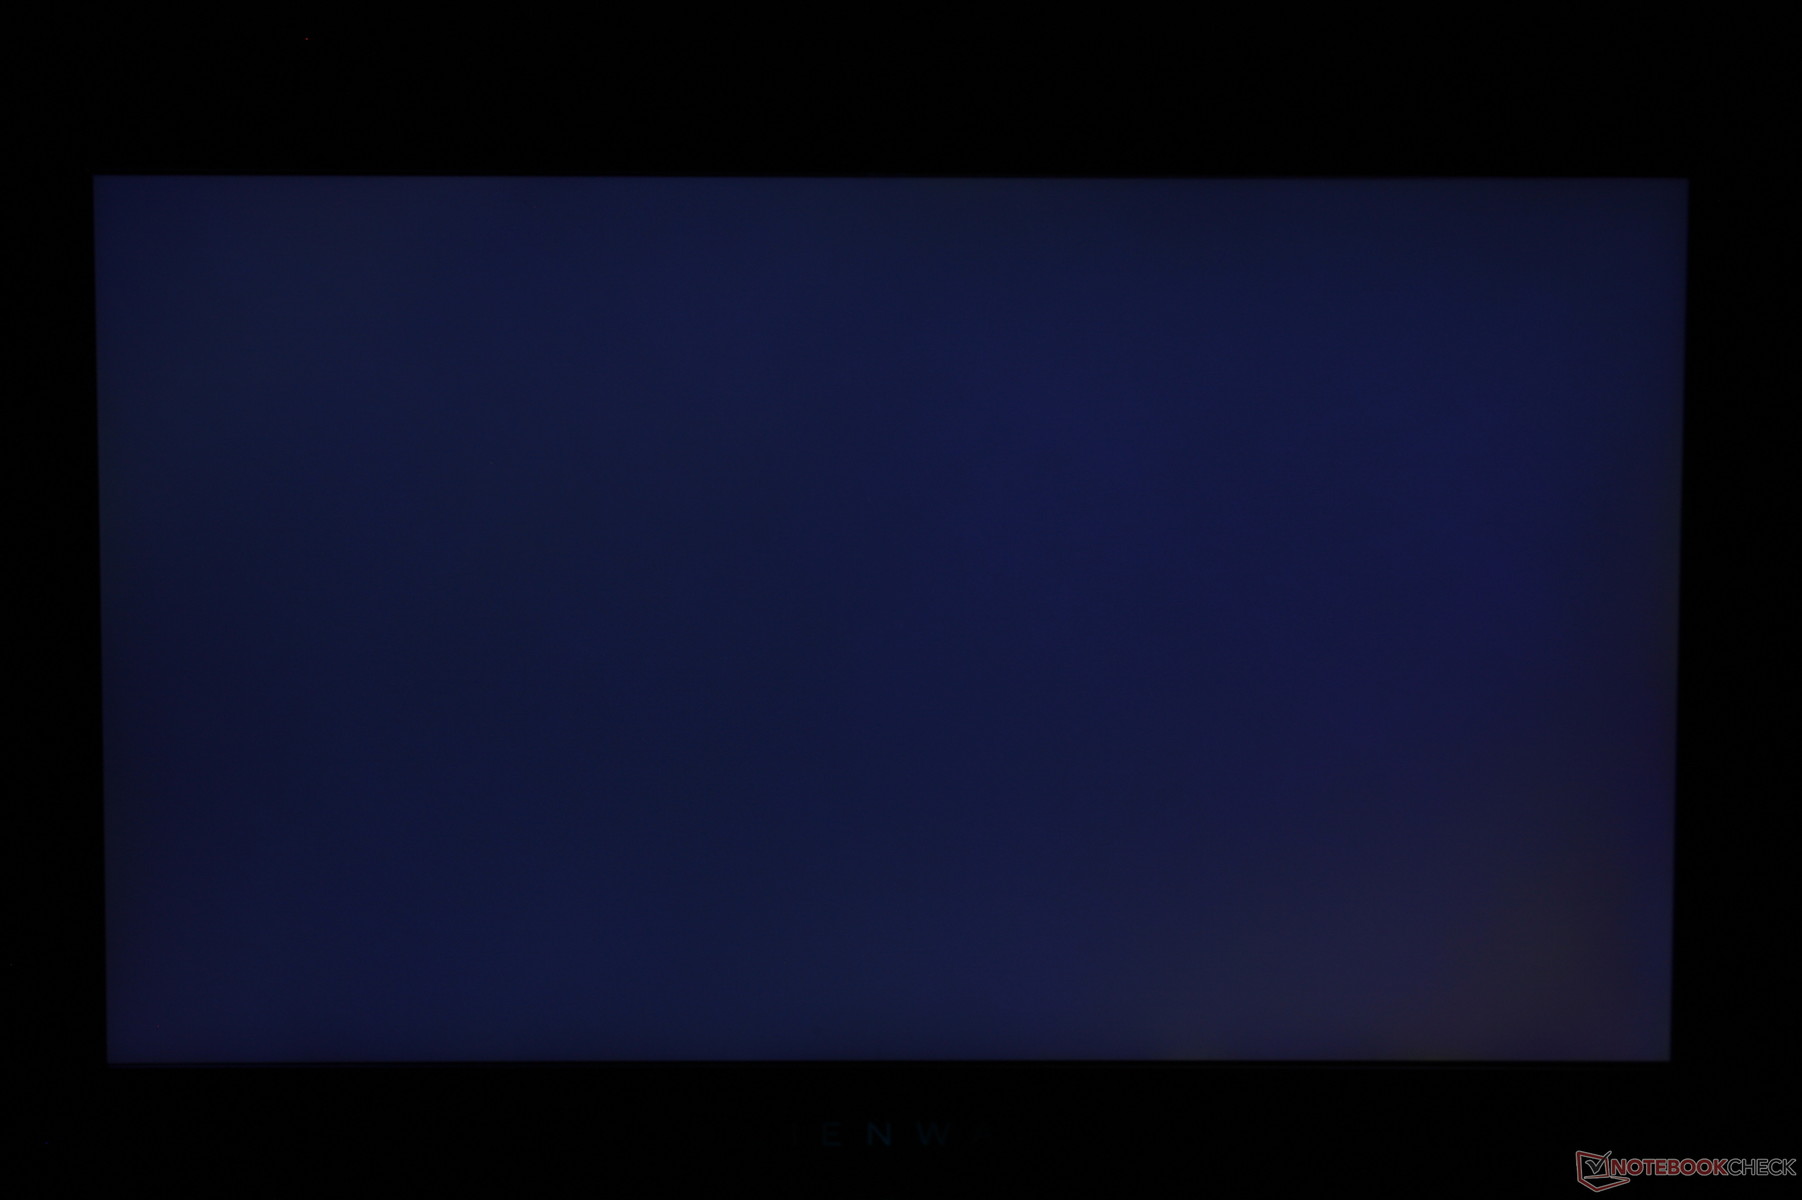
Uneven backlight bleeding is very minor on our unit and there is no detectable pulse-width modulation from the display backlight.
| |||||||||||||||||||||||||
Brightness Distribution: 86 %
Center on Battery: 353.6 cd/m²
Contrast: 1179:1 (Black: 0.3 cd/m²)
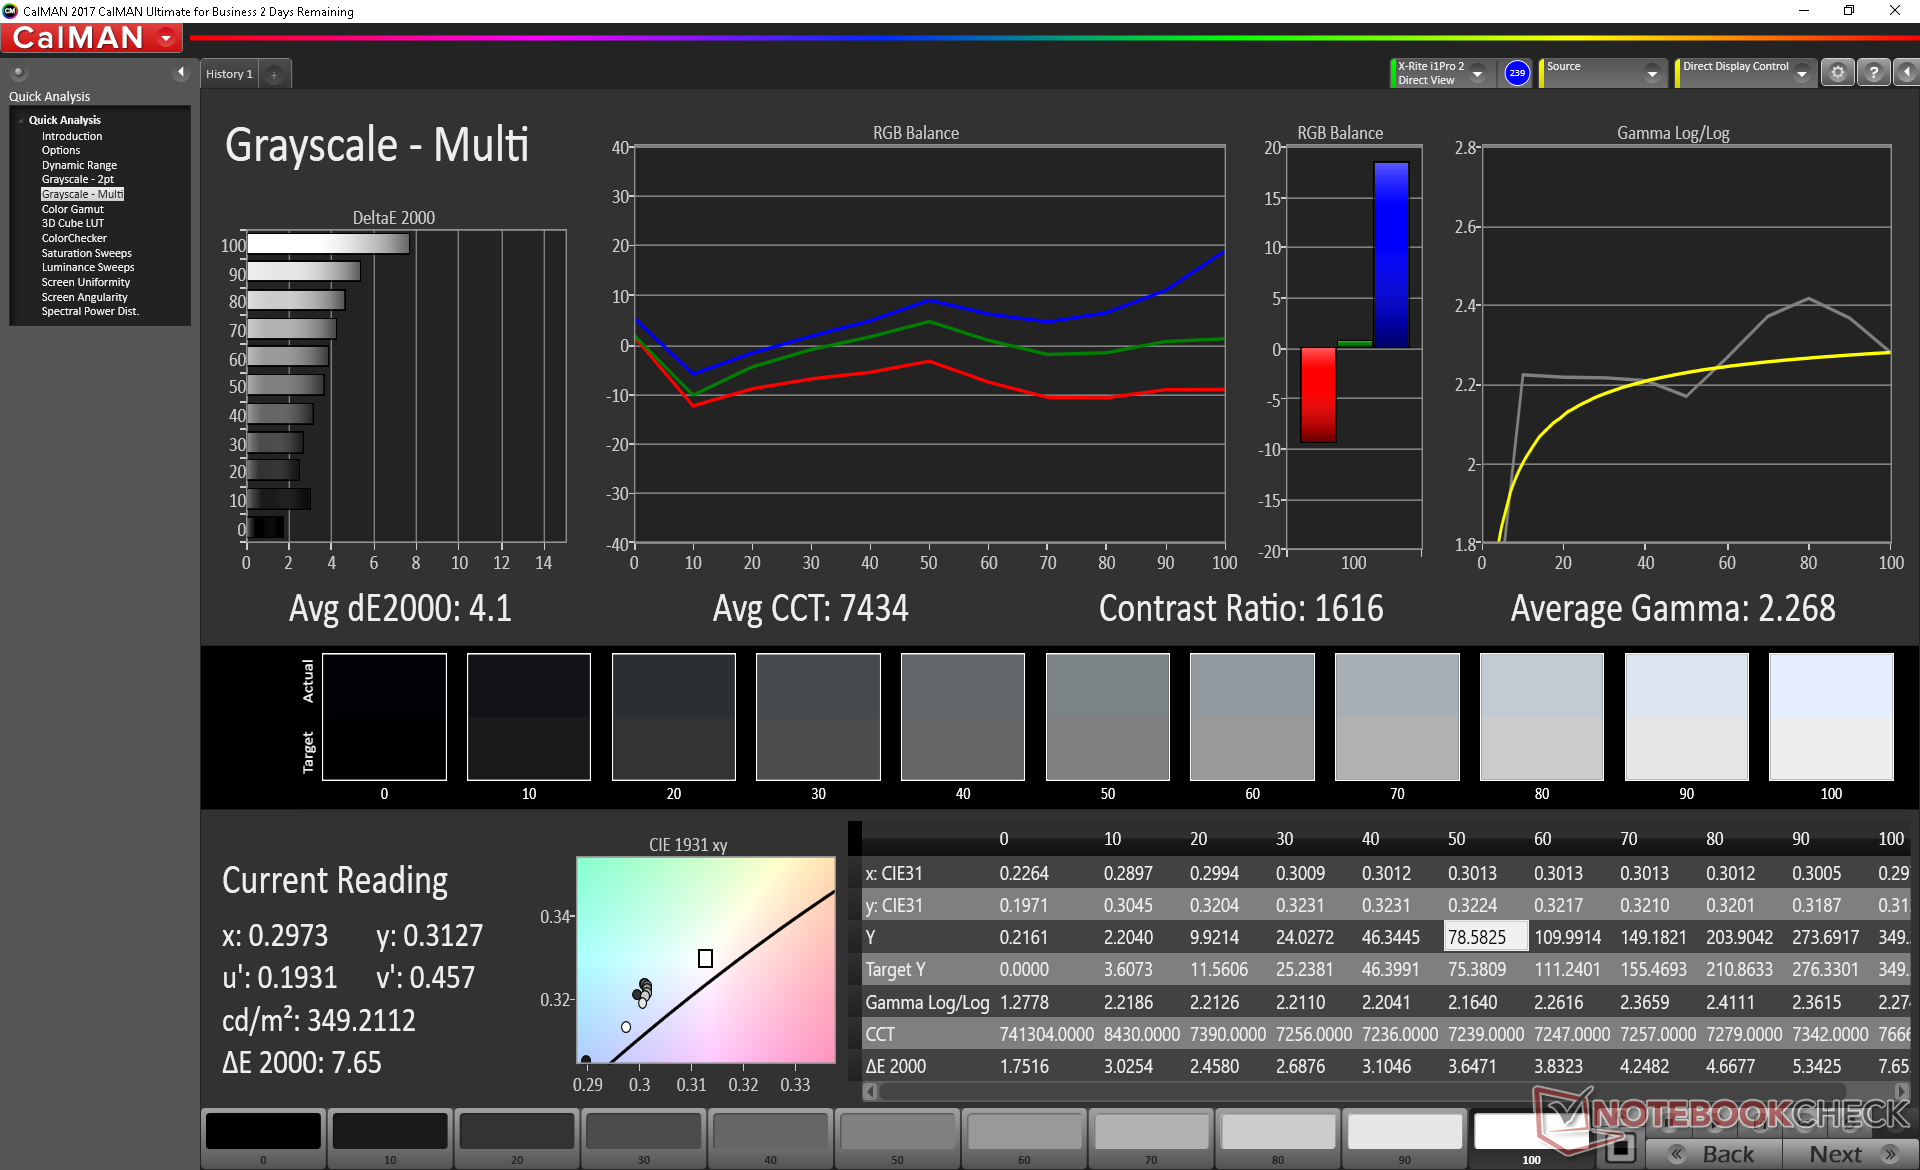
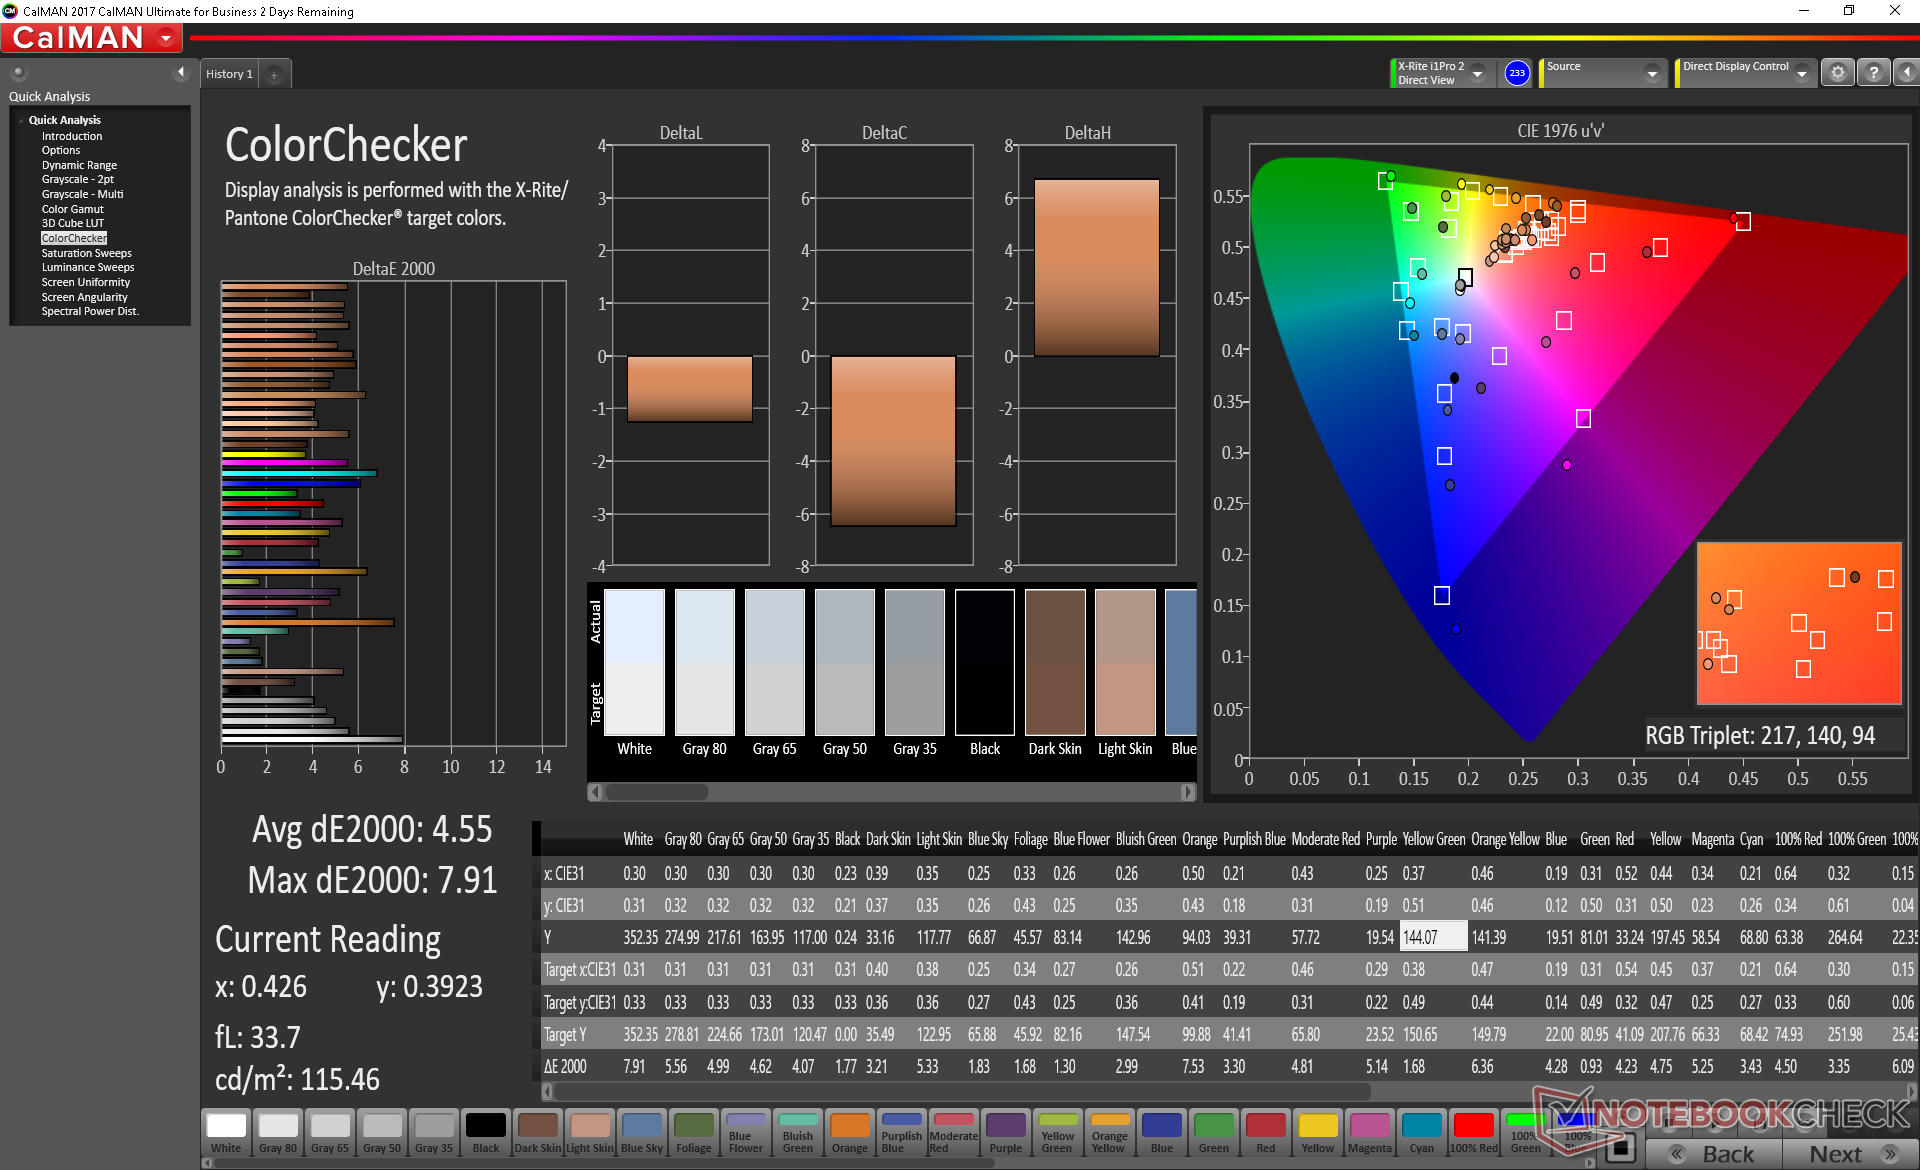
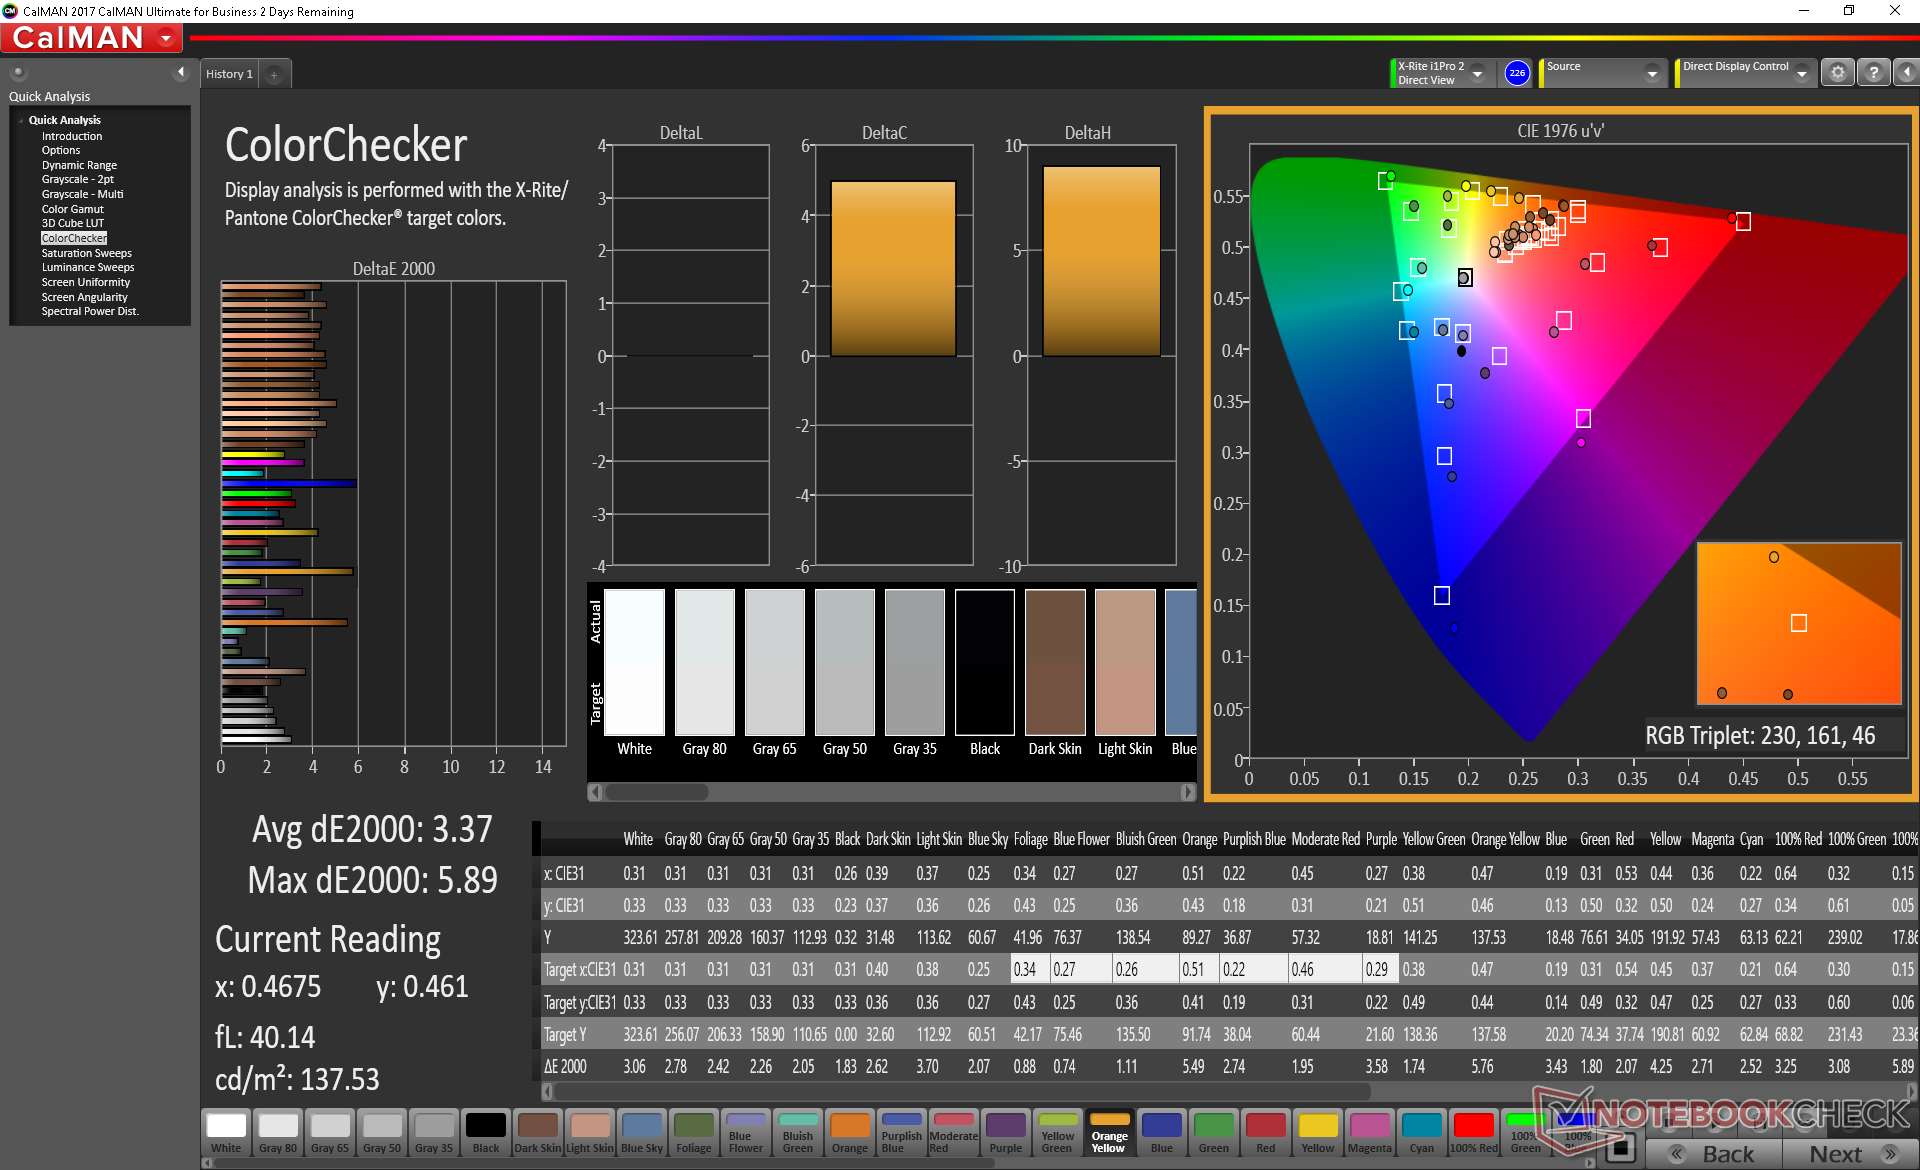
ΔE Color 4.55 | 0.5-29.43 Ø5, calibrated: 3.37
ΔE Greyscale 4.1 | 0.57-98 Ø5.3
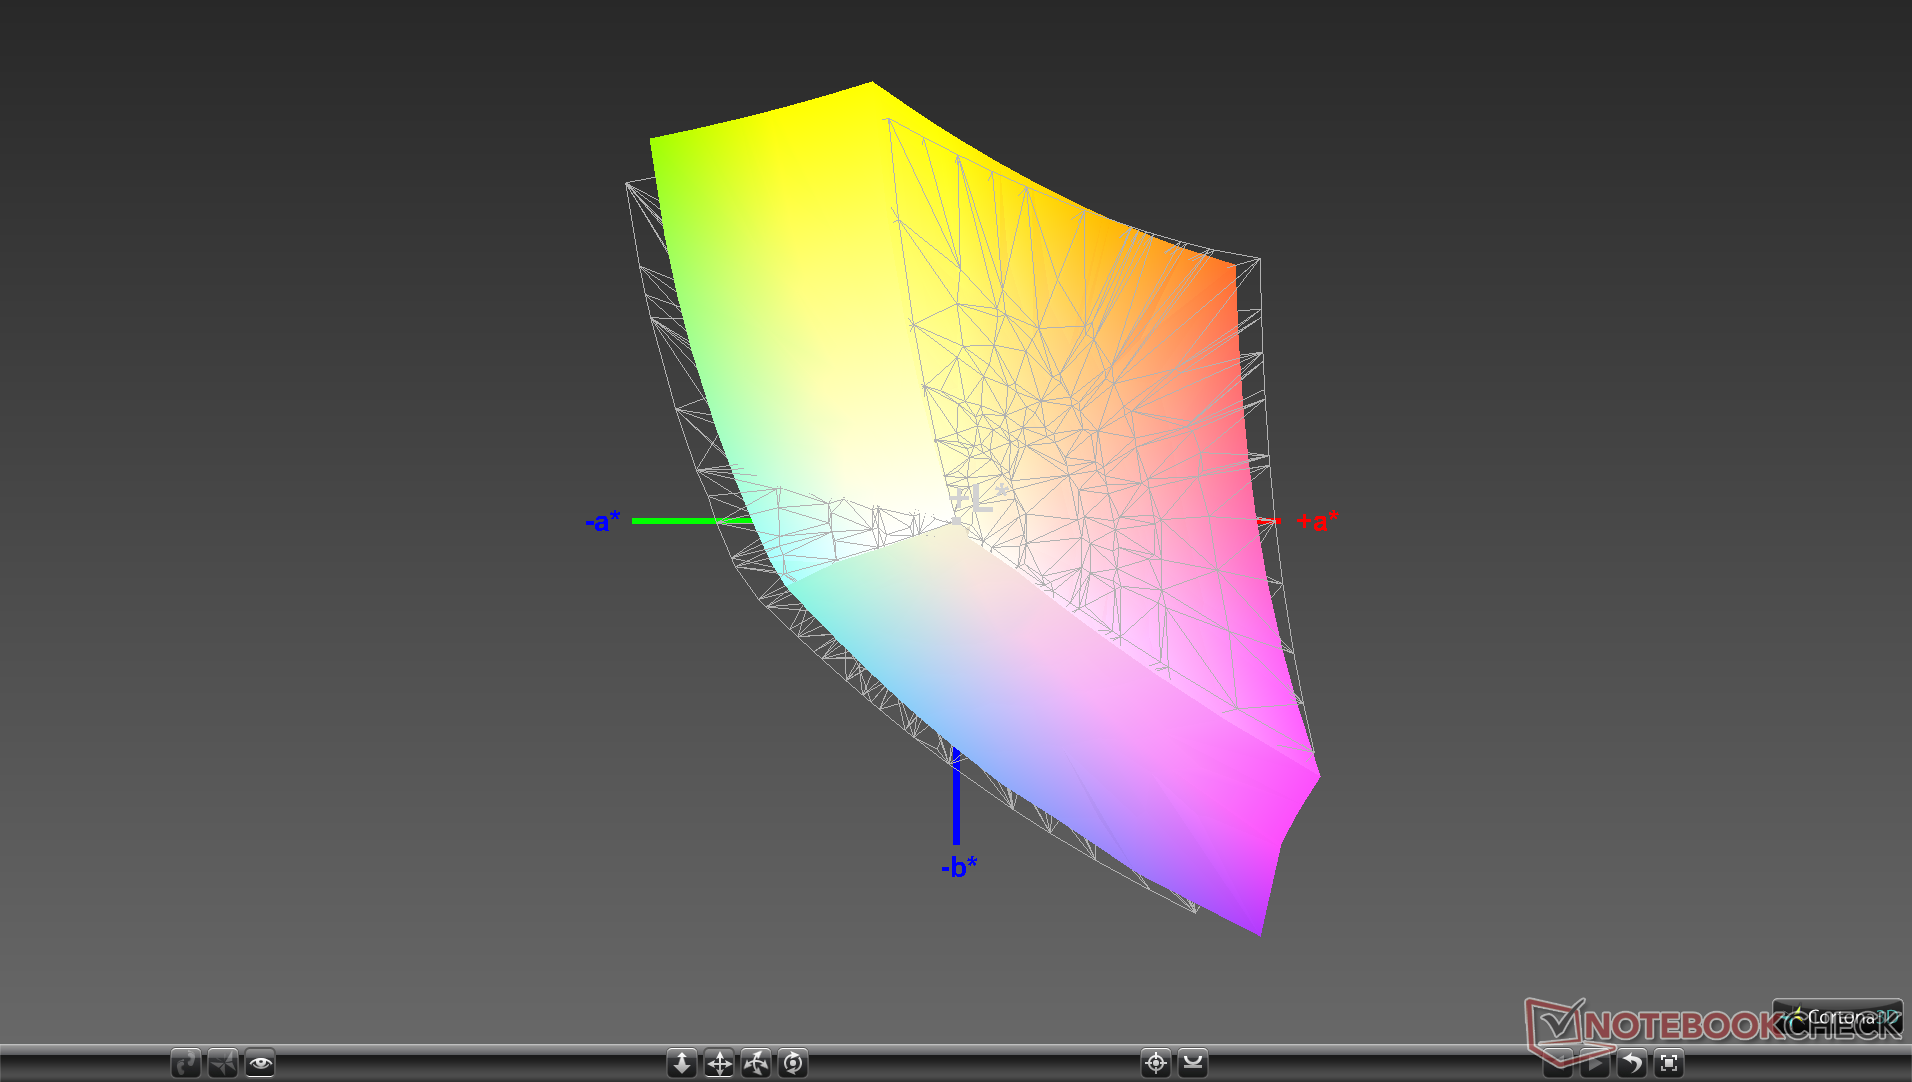
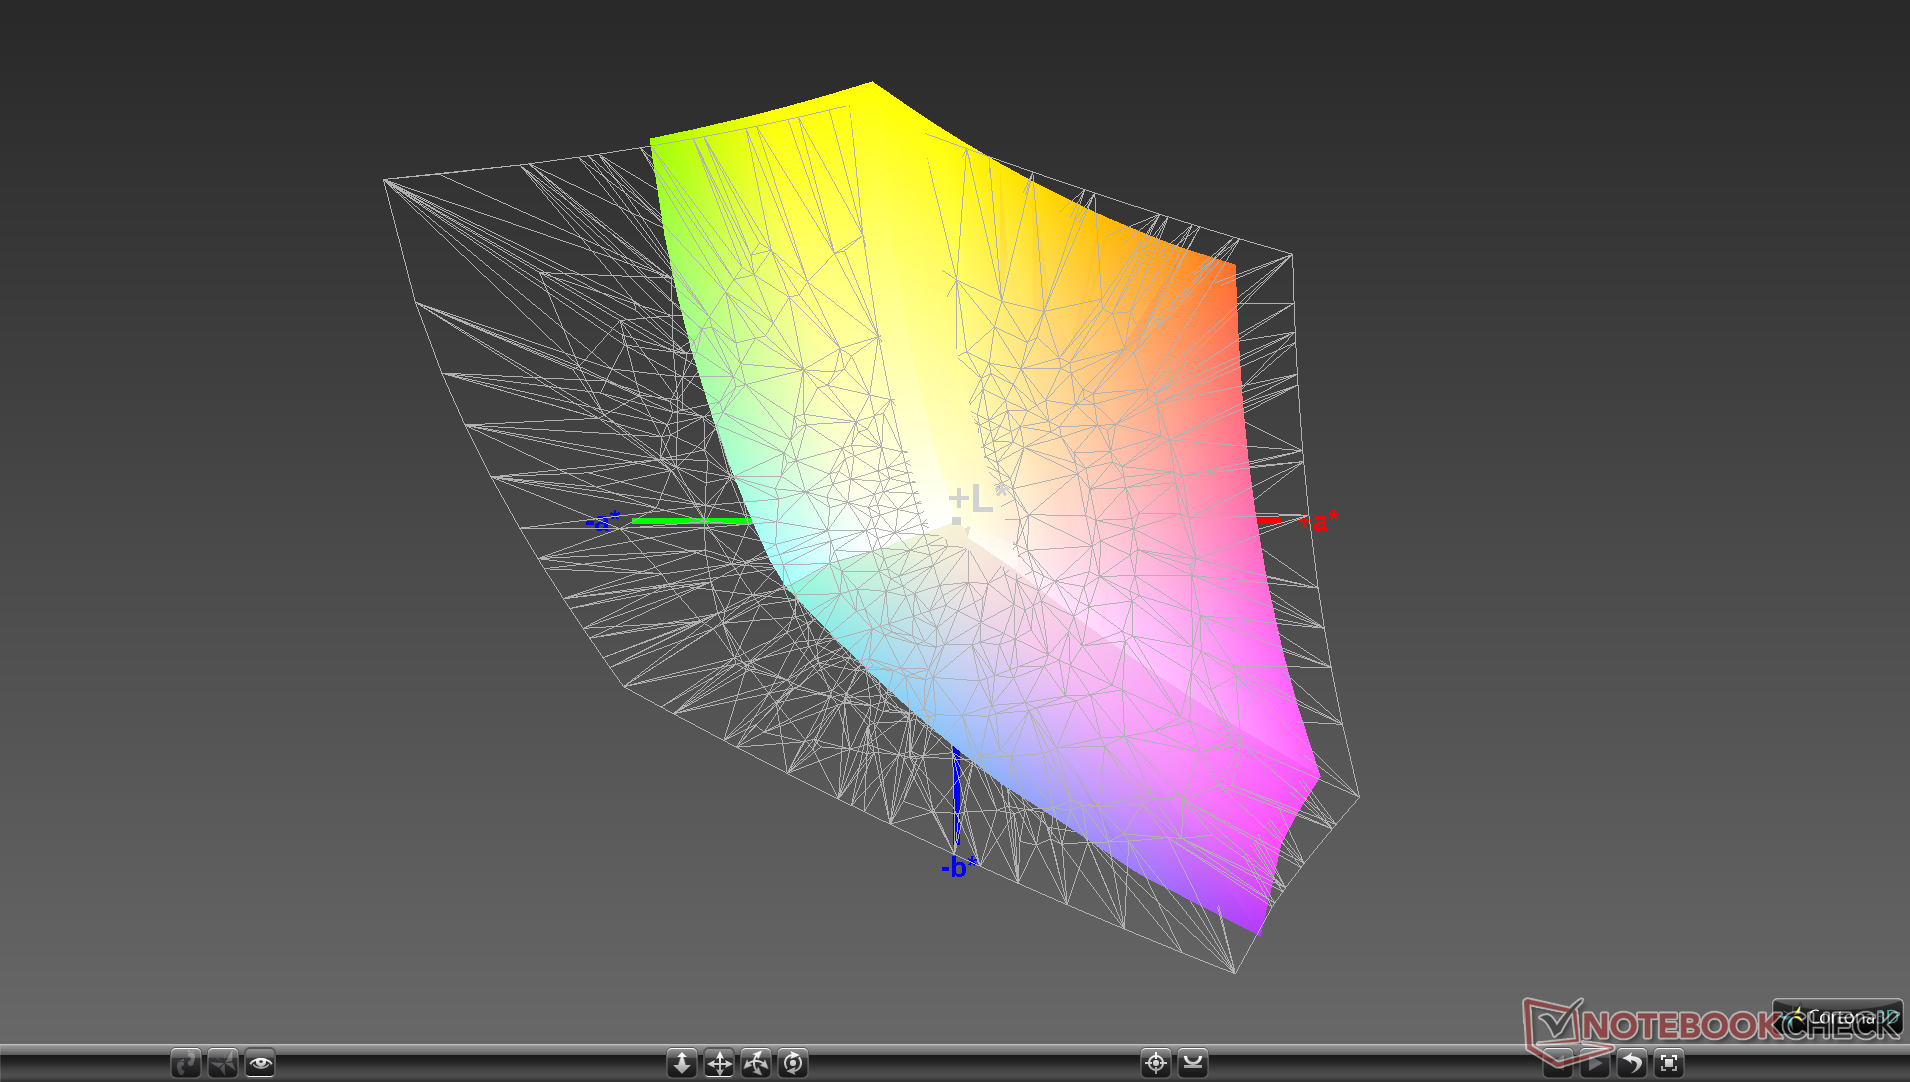
88.9% sRGB (Argyll 1.6.3 3D)
57.9% AdobeRGB 1998 (Argyll 1.6.3 3D)
64.5% AdobeRGB 1998 (Argyll 2.2.0 3D)
89.4% sRGB (Argyll 2.2.0 3D)
63.5% Display P3 (Argyll 2.2.0 3D)
Gamma: 2.27
| Alienware m15 GTX 1070 Max-Q AU Optronics B156HAN, IPS, 15.60, 1920x1080 | Razer Blade 15 2018 LGD05C0, IPS, 15.60, 1920x1080 | Alienware 15 R4 LG Philips LP156WF6 (LGD0540), IPS, 15.60, 1920x1080 | MSI GS65 8RF-019DE Stealth Thin AU Optronics B156HAN08.0 (AUO80ED), IPS, 15.60, 1920x1080 | Asus Zephyrus S GX531GS AU Optronics B156HAN08.2 (AUO82ED), IPS, 15.60, 1920x1080 | Gigabyte Aero 15X v8 LGD05C0, IPS, 15.60, 1920x1080 | |
|---|---|---|---|---|---|---|
| Display | 3% | -1% | 4% | 3% | 2% | |
| Display P3 Coverage | 63.5 | 64.3 1% | 65.7 3% | 66.2 4% | 66.7 5% | 63.6 0% |
| sRGB Coverage | 89.4 | 93.7 5% | 86.4 -3% | 92.1 3% | 91.2 2% | 93.8 5% |
| AdobeRGB 1998 Coverage | 64.5 | 65.5 2% | 63.1 -2% | 67.2 4% | 66.7 3% | 64.9 1% |
| Response Times | 2% | -105% | -3% | 38% | 7% | |
| Response Time Grey 50% / Grey 80% * | 18 ? | 17.2 ? 4% | 37.6 ? -109% | 17.6 ? 2% | 7.4 ? 59% | 16.8 ? 7% |
| Response Time Black / White * | 12 ? | 12 ? -0% | 24 ? -100% | 12.8 ? -7% | 10 ? 17% | 11.2 ? 7% |
| PWM Frequency | 20830 ? | |||||
| Screen | 10% | -7% | 16% | 13% | 18% | |
| Brightness middle | 353.6 | 290 -18% | 292 -17% | 254 -28% | 294 -17% | 313 -11% |
| Brightness | 346 | 281 -19% | 278 -20% | 262 -24% | 275 -21% | 300 -13% |
| Brightness Distribution | 86 | 82 -5% | 88 2% | 89 3% | 84 -2% | 78 -9% |
| Black Level * | 0.3 | 0.3 -0% | 0.29 3% | 0.22 27% | 0.24 20% | 0.33 -10% |
| Contrast | 1179 | 967 -18% | 1007 -15% | 1155 -2% | 1225 4% | 948 -20% |
| Colorchecker dE 2000 * | 4.55 | 2.85 37% | 4.9 -8% | 2.37 48% | 2.57 44% | 1.29 72% |
| Colorchecker dE 2000 max. * | 7.91 | 6.27 21% | 10.08 -27% | 4.71 40% | 4.88 38% | 2.04 74% |
| Colorchecker dE 2000 calibrated * | 3.37 | 1.39 59% | 2.27 33% | 1.84 45% | 2.14 36% | |
| Greyscale dE 2000 * | 4.1 | 2.4 41% | 4.89 -19% | 1.58 61% | 2.41 41% | 0.69 83% |
| Gamma | 2.27 97% | 2.34 94% | 2.36 93% | 2.48 89% | 2.5 88% | 2.43 91% |
| CCT | 7434 87% | 6718 97% | 7598 86% | 6785 96% | 6370 102% | 6550 99% |
| Color Space (Percent of AdobeRGB 1998) | 57.9 | 60 4% | 56 -3% | 60 4% | 59 2% | 60 4% |
| Color Space (Percent of sRGB) | 88.9 | 94 6% | 86 -3% | 92 3% | 91 2% | 94 6% |
| Total Average (Program / Settings) | 5% /
8% | -38% /
-18% | 6% /
11% | 18% /
15% | 9% /
13% |
* ... smaller is better
Color coverage is approximately 58 percent and 89 percent of the AdobeRGB and sRGB standards, respectively, to be comparable to other high-end competitors like the Razer Blade 15 or MSI GS65. The panel strikes a great balance between response times and gamut that mainstream and hardcore gamers can appreciate. Cheaper panels, like the one on the Lenovo Legion Y7000, have noticeably more ghosting.
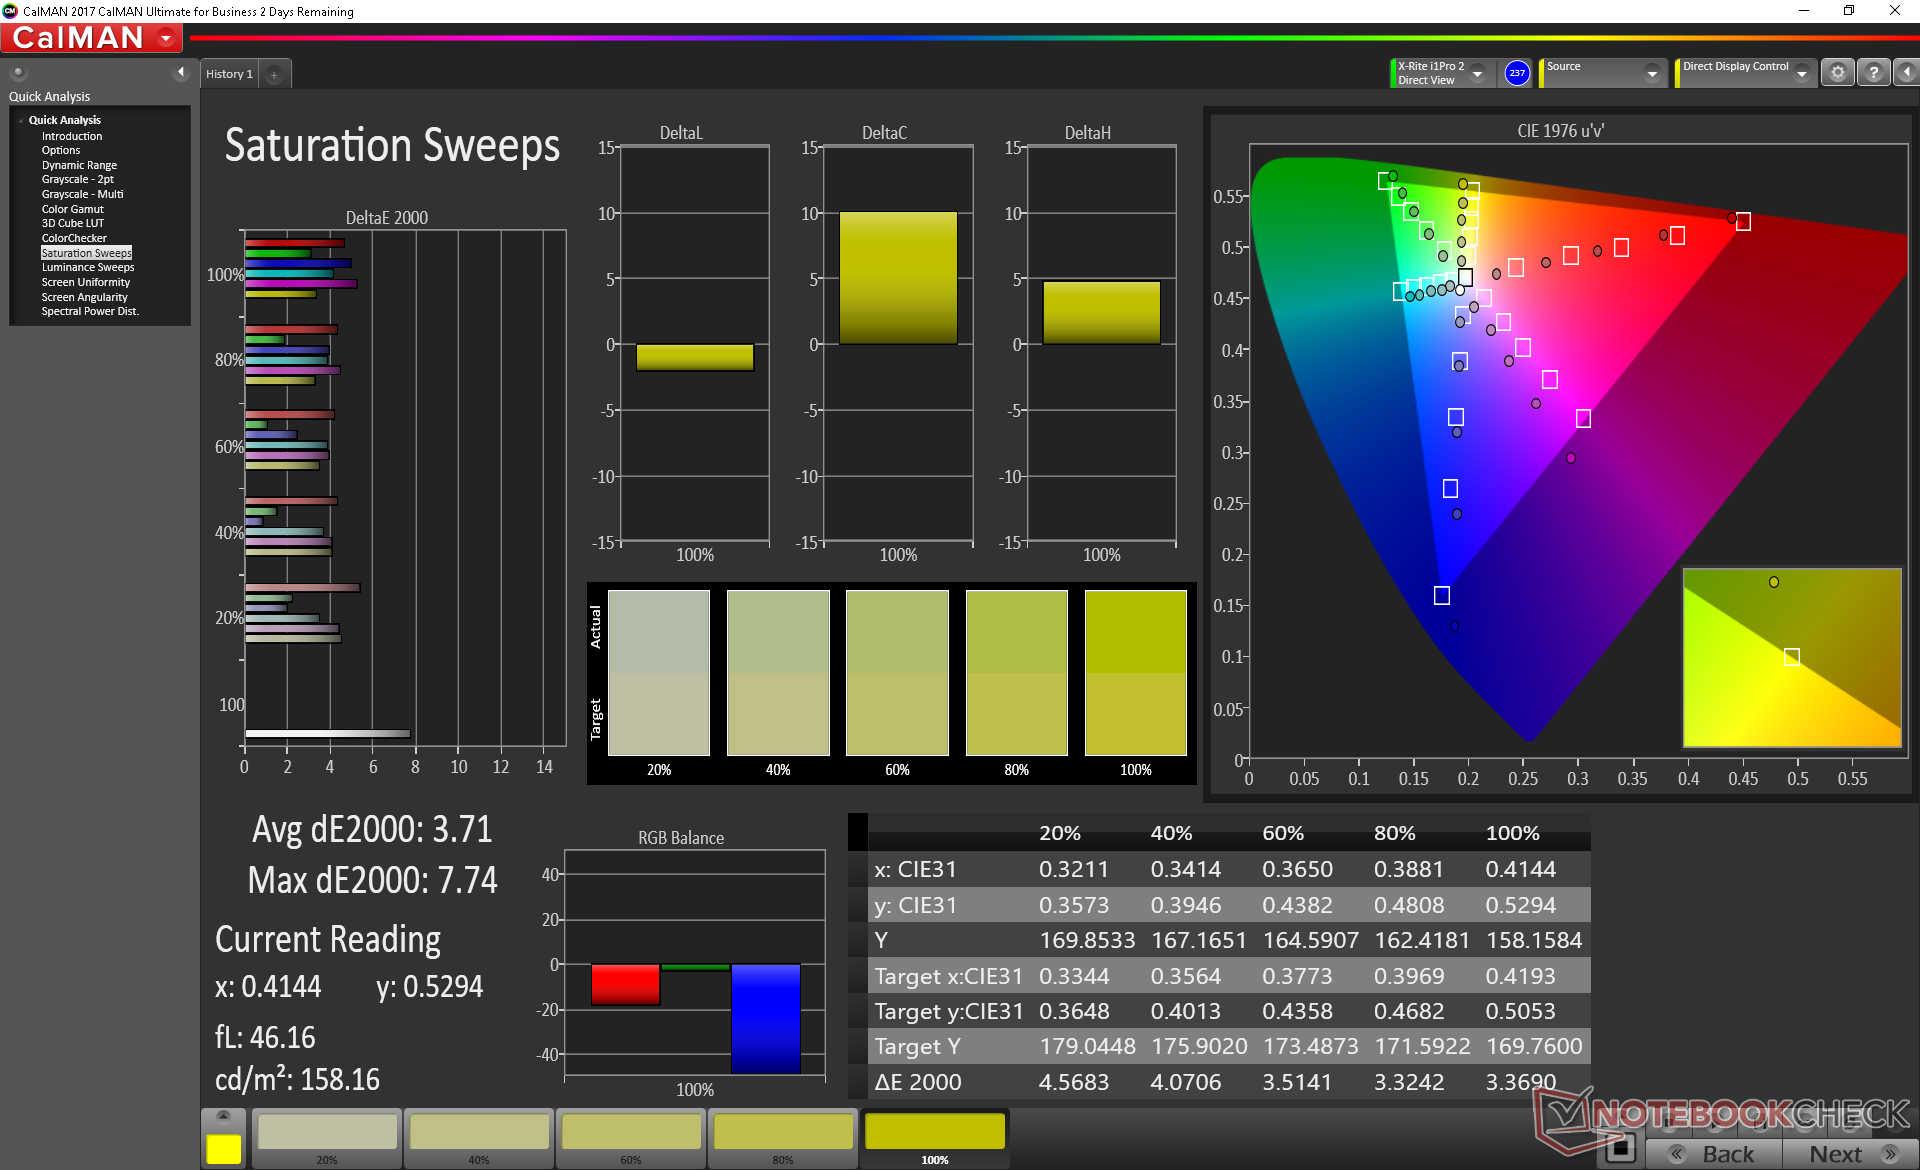
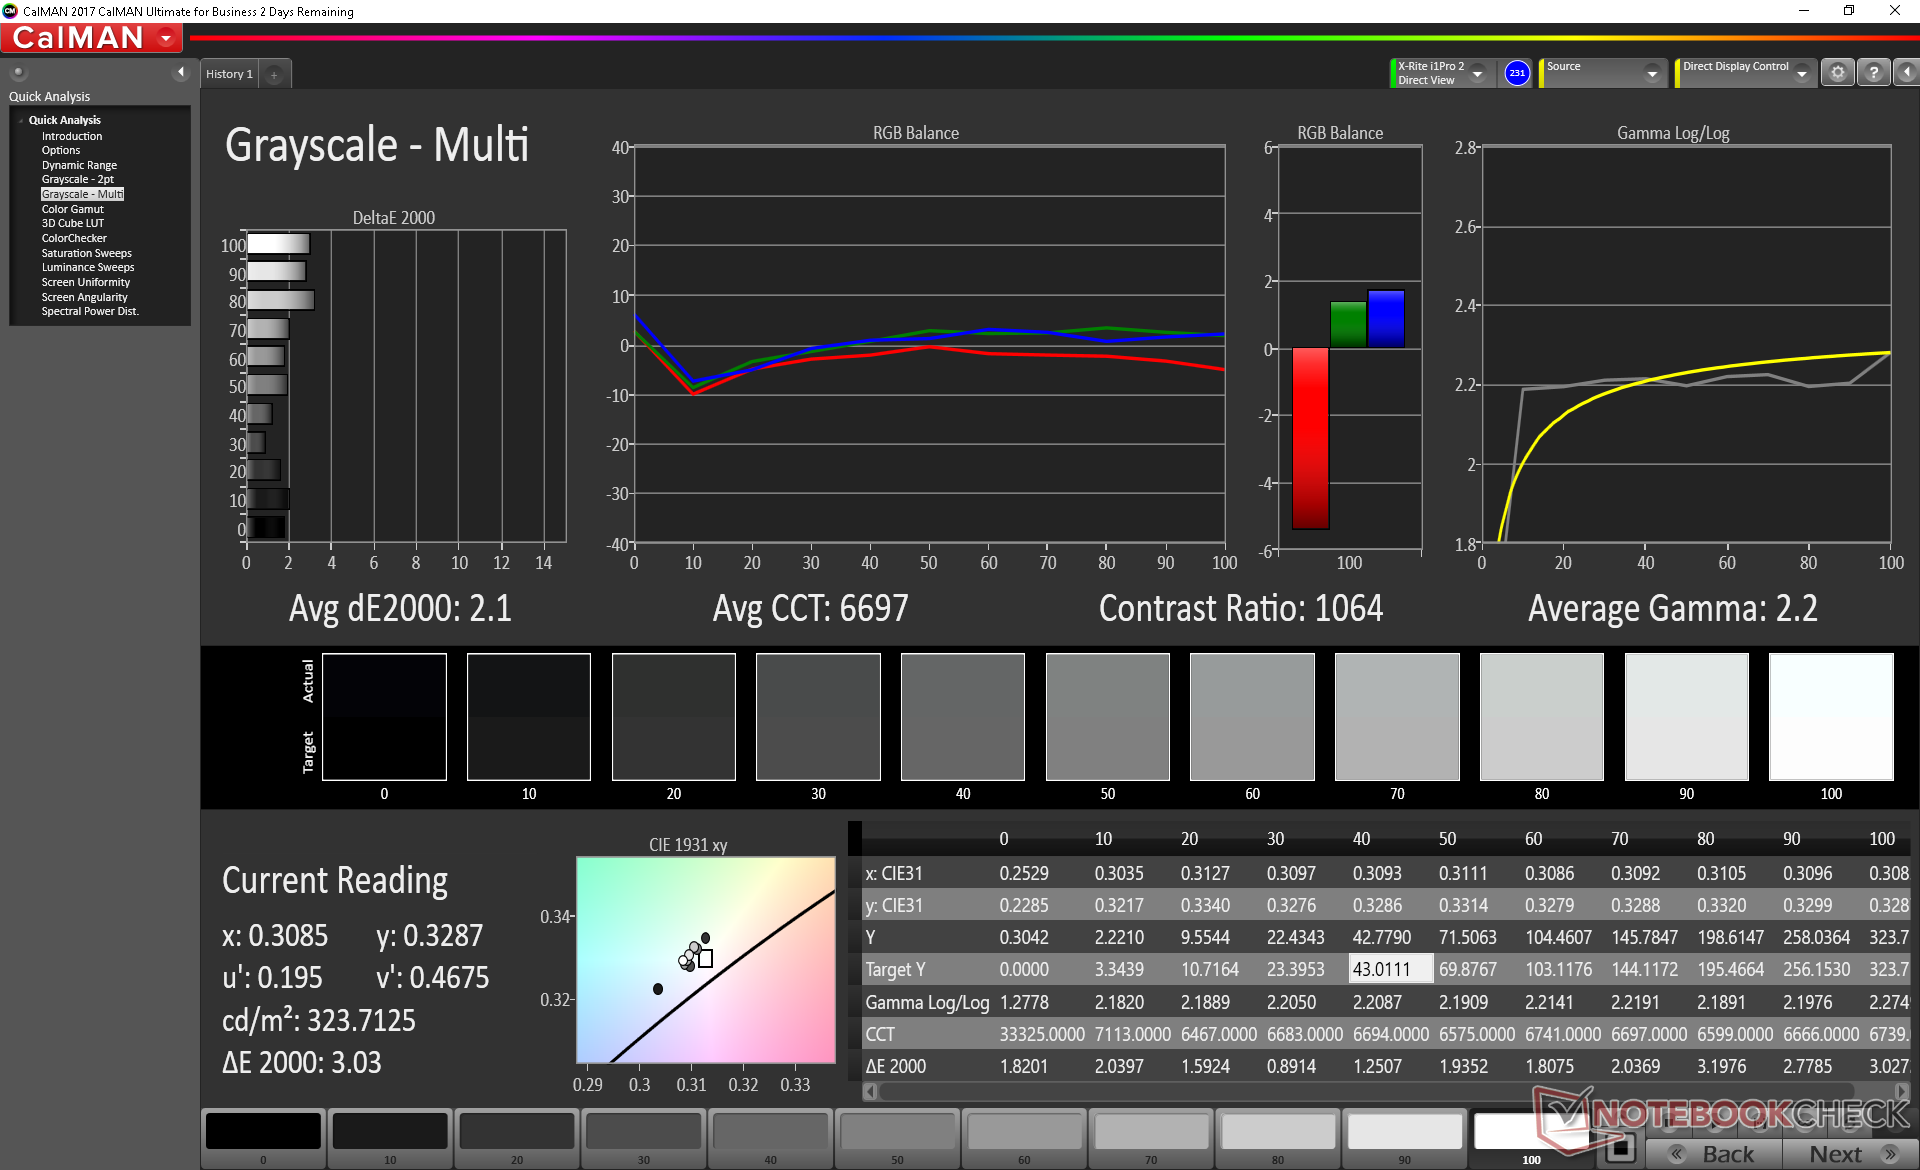
Further measurements with a X-Rite colorimeter show accurate colors out of the box even though grayscale is slightly on the cooler side. Our calibration fixes the grayscale issue and improves color accuracy even further. Colors still become slightly less accurate at higher saturation levels since sRGB coverage is imperfect.
Display Response Times
| ↔ Response Time Black to White | ||
|---|---|---|
| 12 ms ... rise ↗ and fall ↘ combined | ↗ 6.8 ms rise | 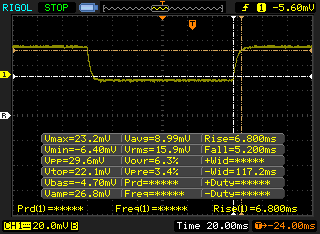 |
| ↘ 5.2 ms fall | ||
| The screen shows good response rates in our tests, but may be too slow for competitive gamers. In comparison, all tested devices range from 0.1 (minimum) to 240 (maximum) ms. » 26 % of all devices are better. This means that the measured response time is better than the average of all tested devices (21.5 ms). | ||
| ↔ Response Time 50% Grey to 80% Grey | ||
| 18 ms ... rise ↗ and fall ↘ combined | ↗ 9.2 ms rise | 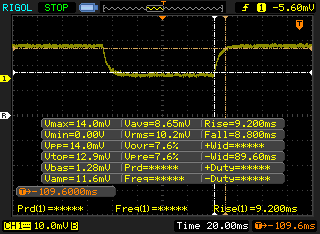 |
| ↘ 8.8 ms fall | ||
| The screen shows good response rates in our tests, but may be too slow for competitive gamers. In comparison, all tested devices range from 0.2 (minimum) to 636 (maximum) ms. » 27 % of all devices are better. This means that the measured response time is better than the average of all tested devices (33.7 ms). | ||
Screen Flickering / PWM (Pulse-Width Modulation)
| Screen flickering / PWM not detected | 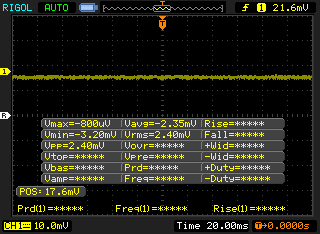 | ||
In comparison: 53 % of all tested devices do not use PWM to dim the display. If PWM was detected, an average of 17900 (minimum: 5 - maximum: 3846000) Hz was measured. | |||
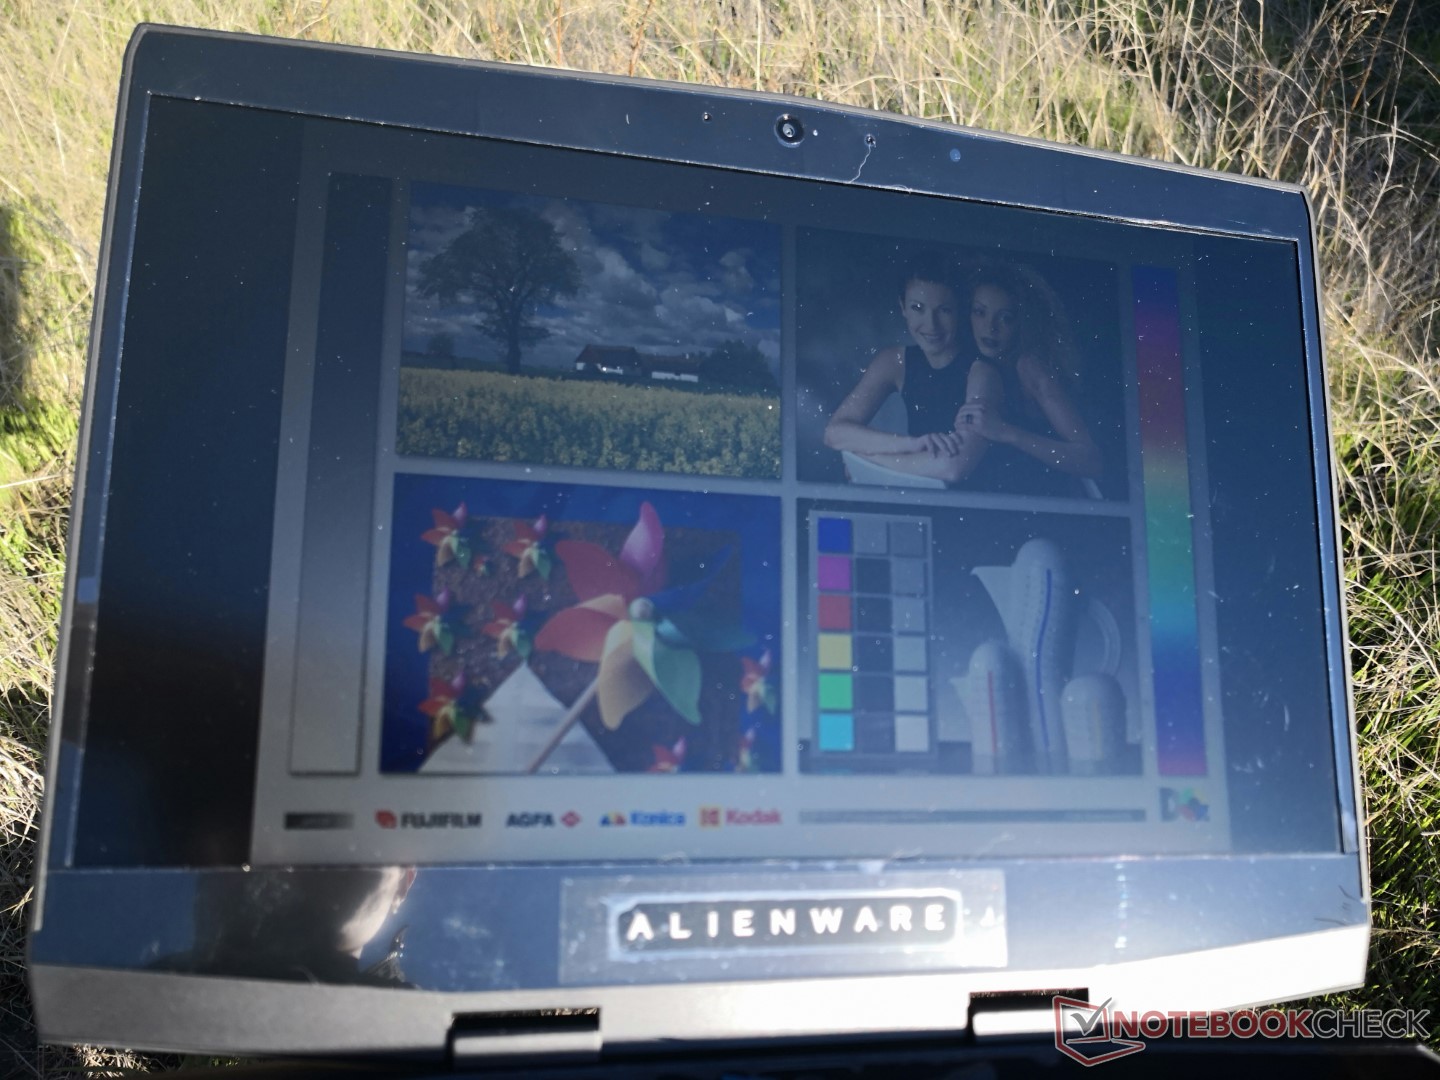
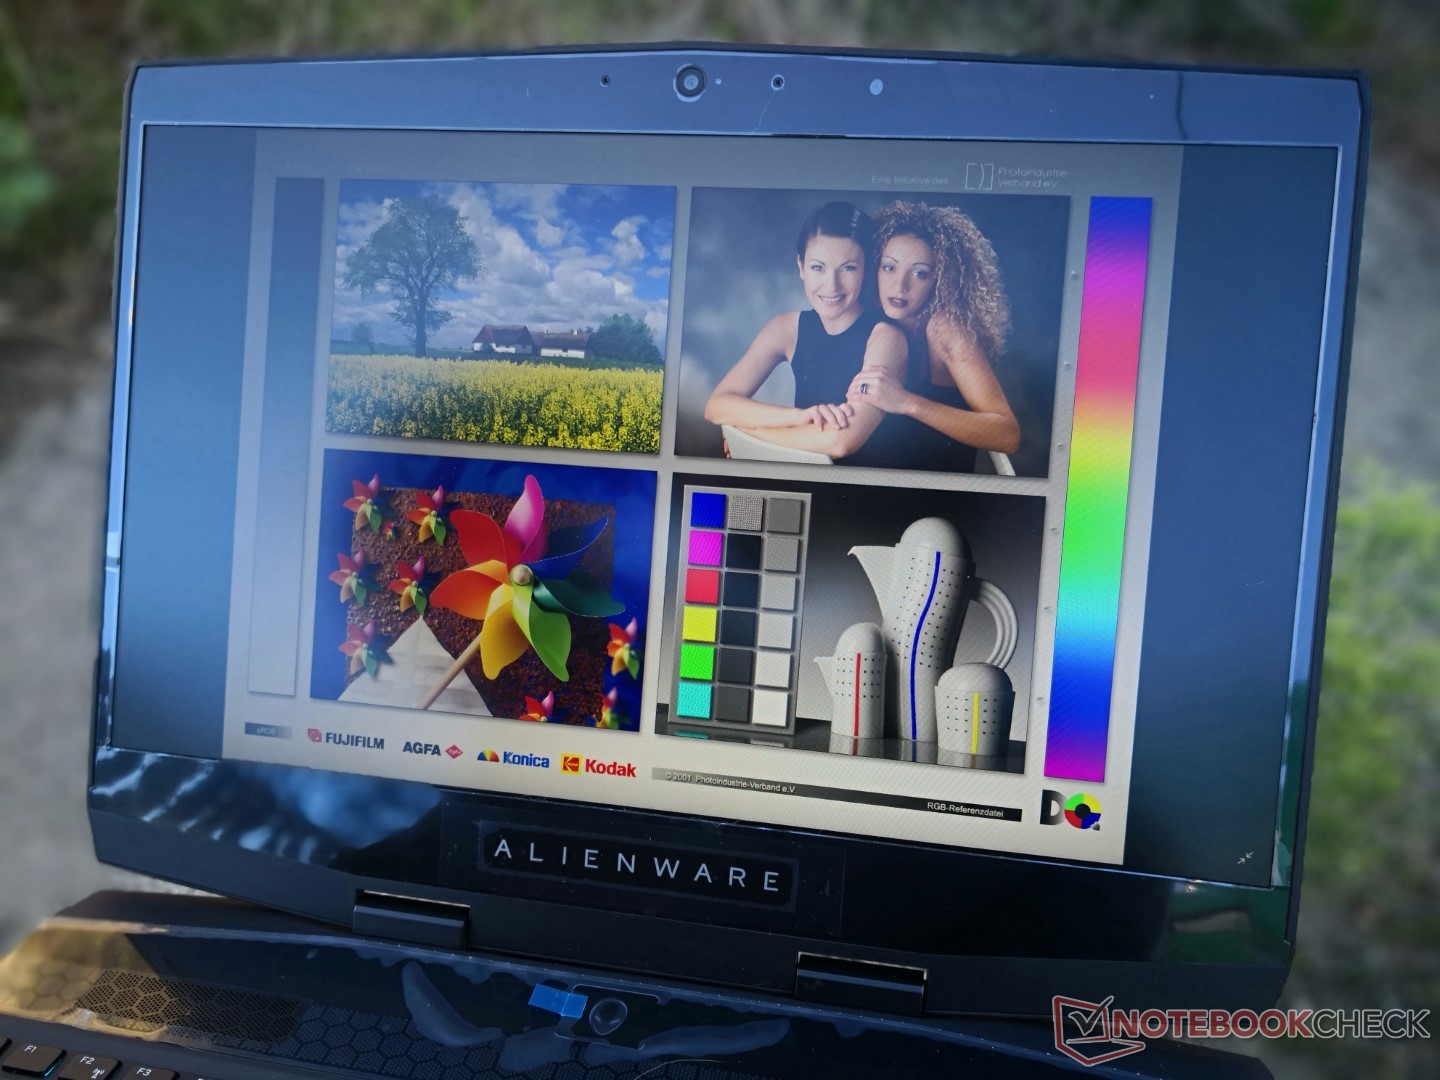
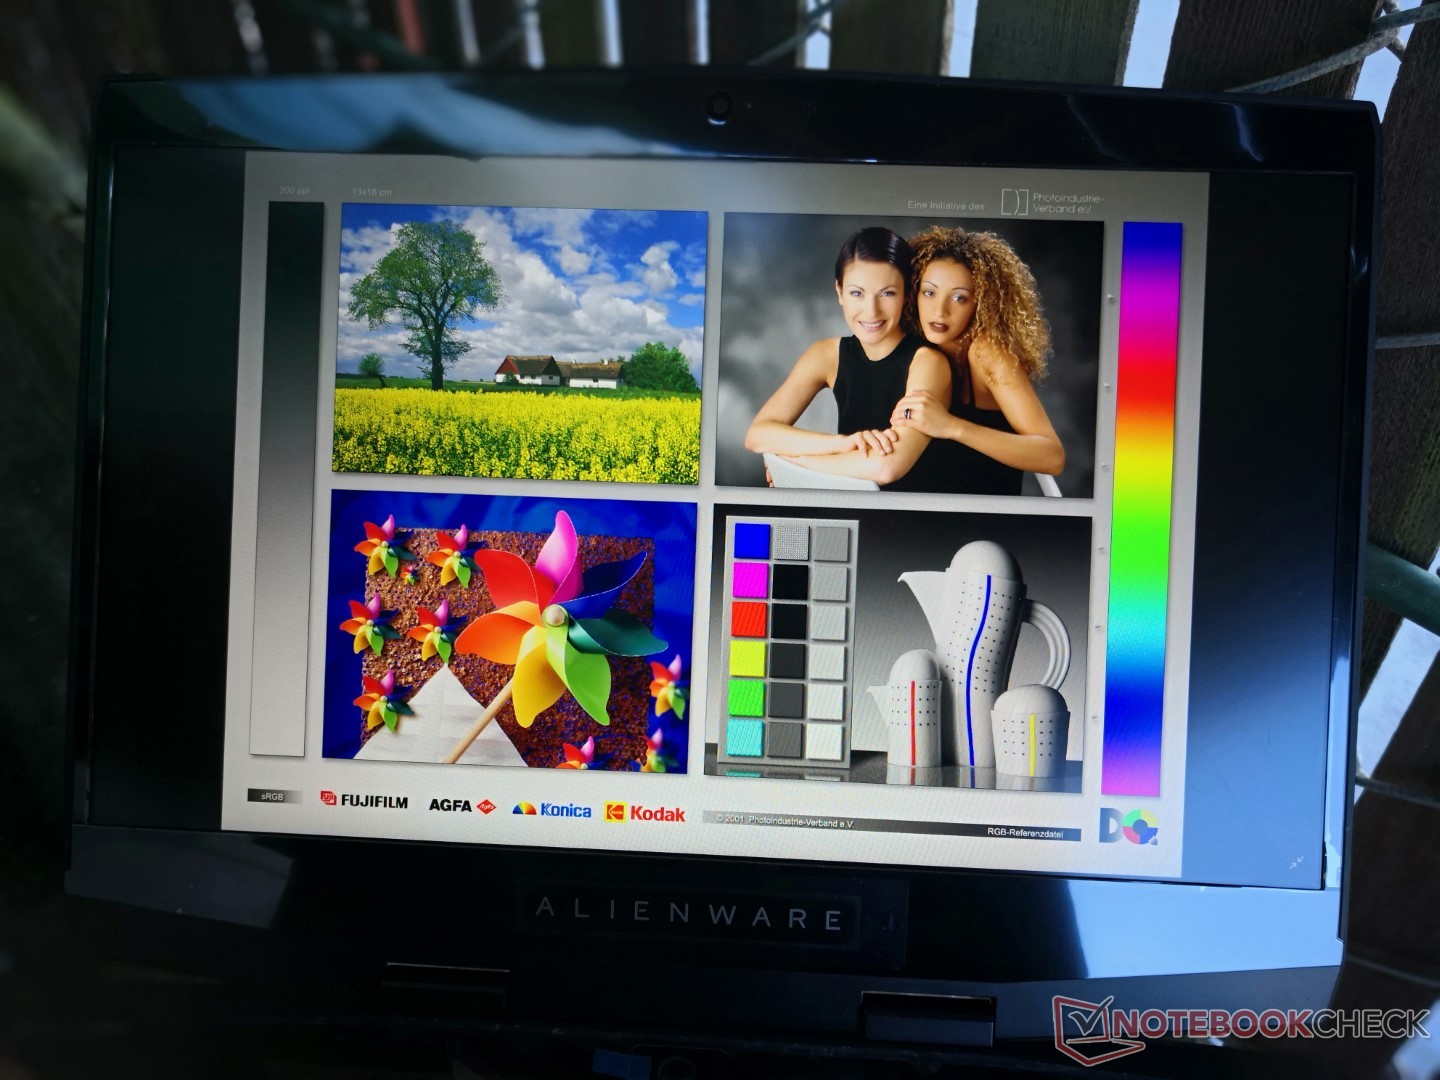
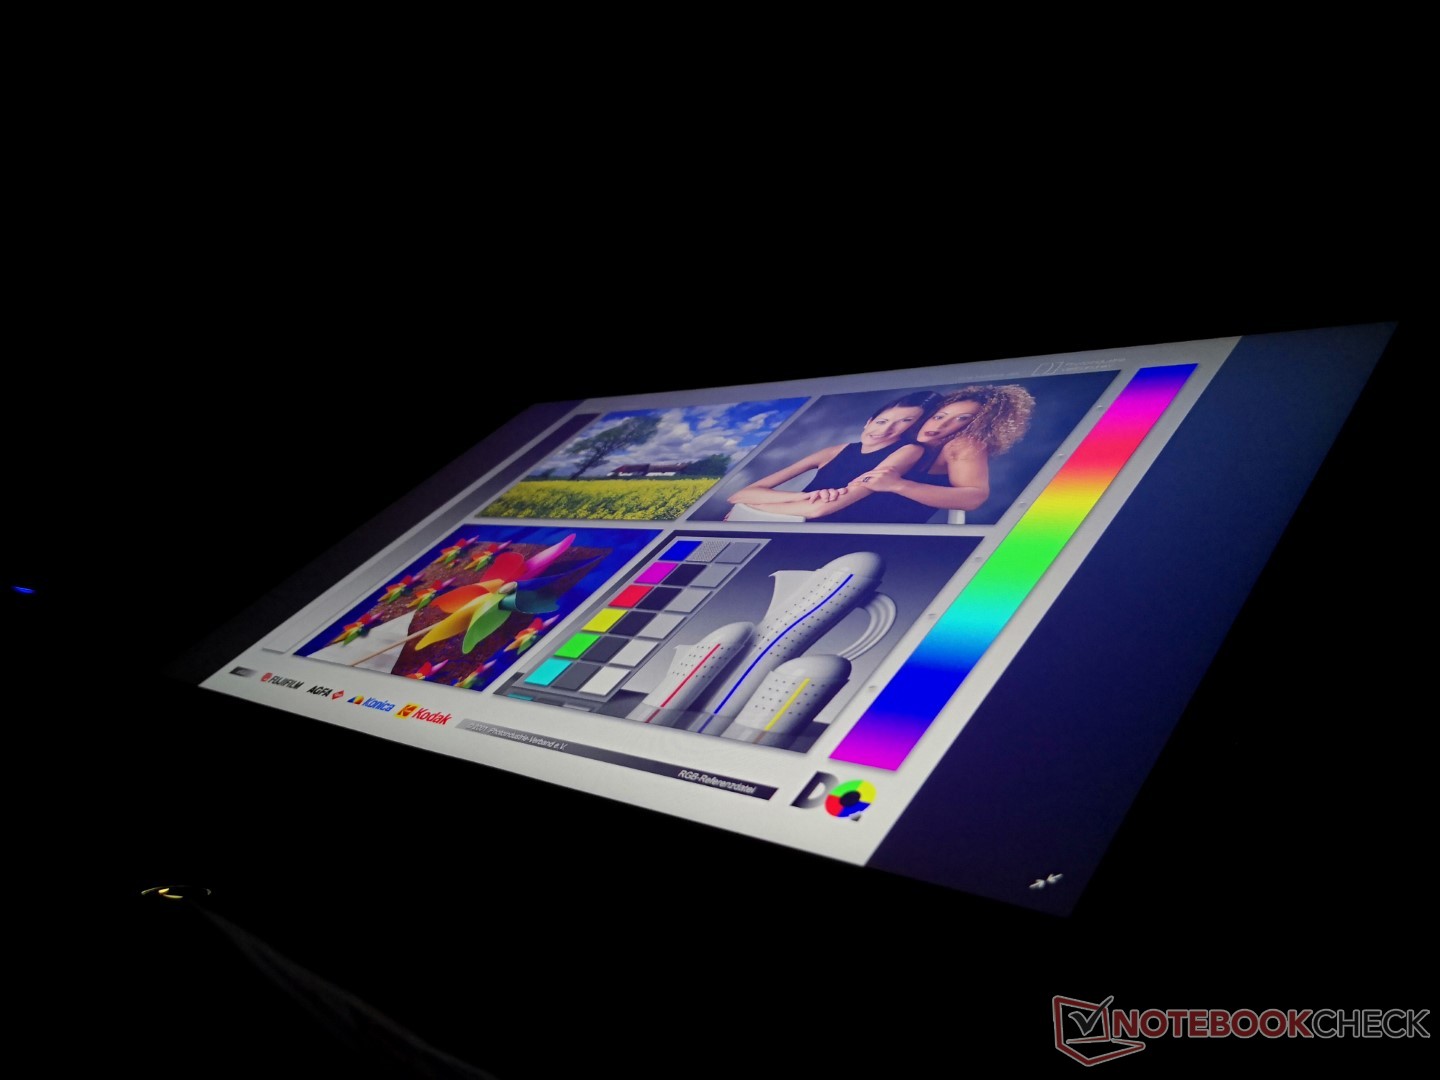
Outdoor visibility is not unlike most other gaming laptops since the display brightness is only slightly above average for its category. Remaining under shade is still the best option if possible. The wide-angle hinges can be used to reduce glare if needed.
Performance
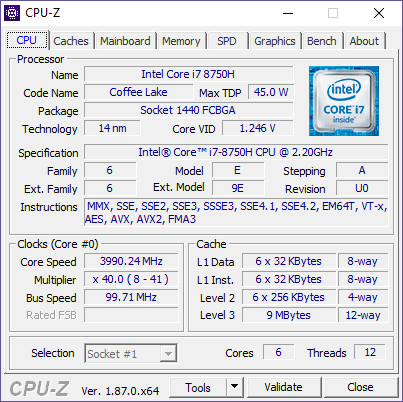
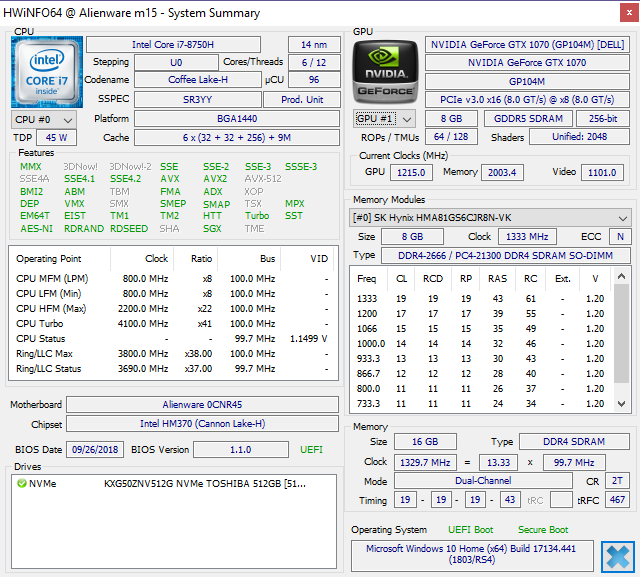
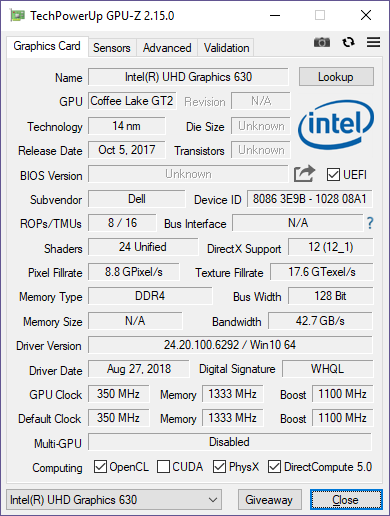
The Coffee Lake-H Core i7-8750H CPU directly succeeds the last generation Kaby Lake Core i7-7700HQ to become the de facto processor for mainstream to enthusiast performance laptops. GPU performance is equally high-end even though there are no GTX 1080 Max-Q options unlike on last year's Zephyrus GX501.
Nvidia Optimus is included for automatic graphics switching and power savings. G-Sync is not an option as a result.
Processor
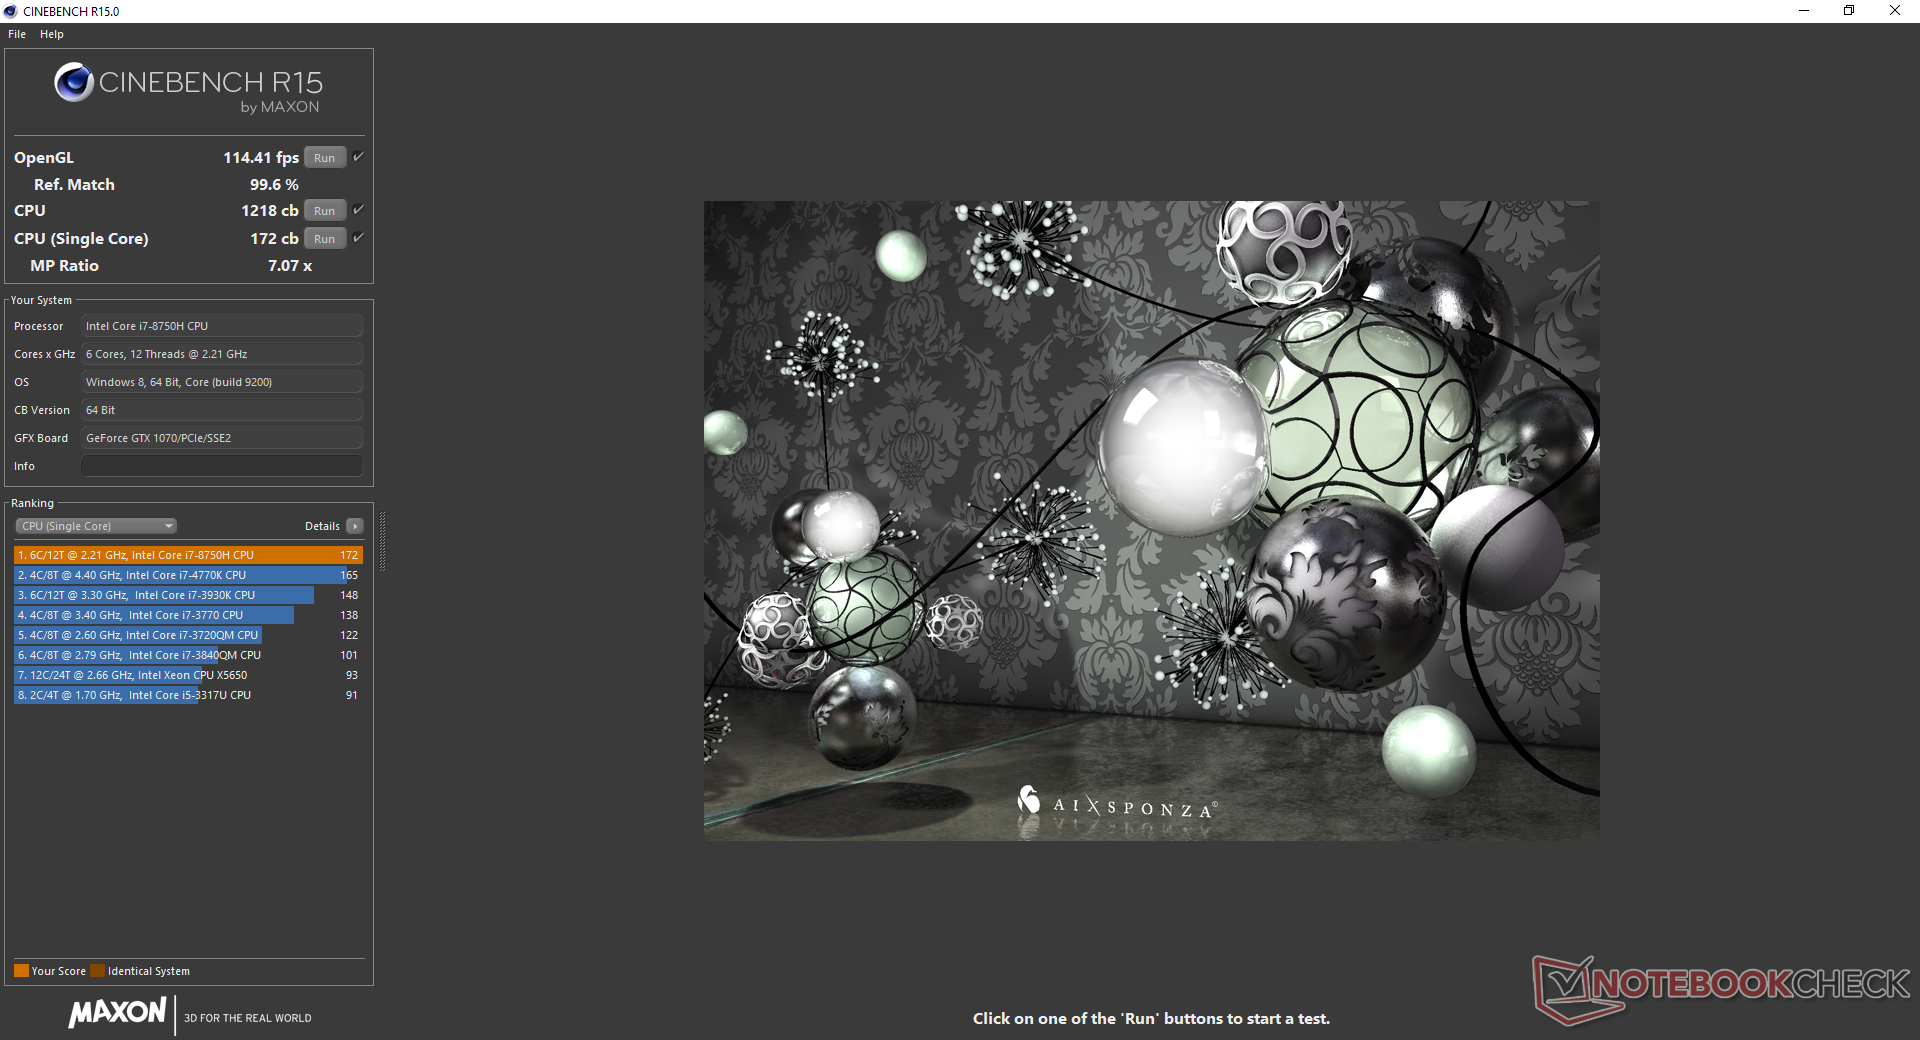
The i7-8750H in our Alienware is about 10 percent faster than the average i7-8750H in our database due to its excellent Turbo Boost performance. By running CineBench R15 Multi-Thread in a loop, we can observe that our system can maintain higher clock rates for longer than the Lenovo Legion Y7000 or Pavilion Gaming 15 each with the exact same CPU. Our initial Multi-Thread score of 1214 points drops by just 4 percent to 1169 points by the third loop. We were worried about processor performance because of the shrunken chassis, but the end result is impressive especially after the disappointing Core i9 performance on the Alienware 15 R4 and 2018 XPS 15.
See our dedicated page on the Core i7-8750H for more technical information and benchmarks.
| Cinebench R10 | |
| Rendering Multiple CPUs 32Bit | |
| SCHENKER XMG Ultra 17 Coffee Lake Refresh | |
| Average Intel Core i7-8750H (29664 - 35307, n=25) | |
| Dell Inspiron 15 7000 7577 4K | |
| Dell XPS 13 9370 i7 UHD | |
| Rendering Single 32Bit | |
| SCHENKER XMG Ultra 17 Coffee Lake Refresh | |
| Average Intel Core i7-8750H (6236 - 6645, n=25) | |
| Dell XPS 13 9370 i7 UHD | |
| Dell Inspiron 15 7000 7577 4K | |
| wPrime 2.10 - 1024m | |
| Dell XPS 13 9370 i7 UHD | |
| Dell Inspiron 15 7000 7577 4K | |
| Average Intel Core i7-8750H (125.5 - 180.5, n=6) | |
* ... smaller is better
System Performance
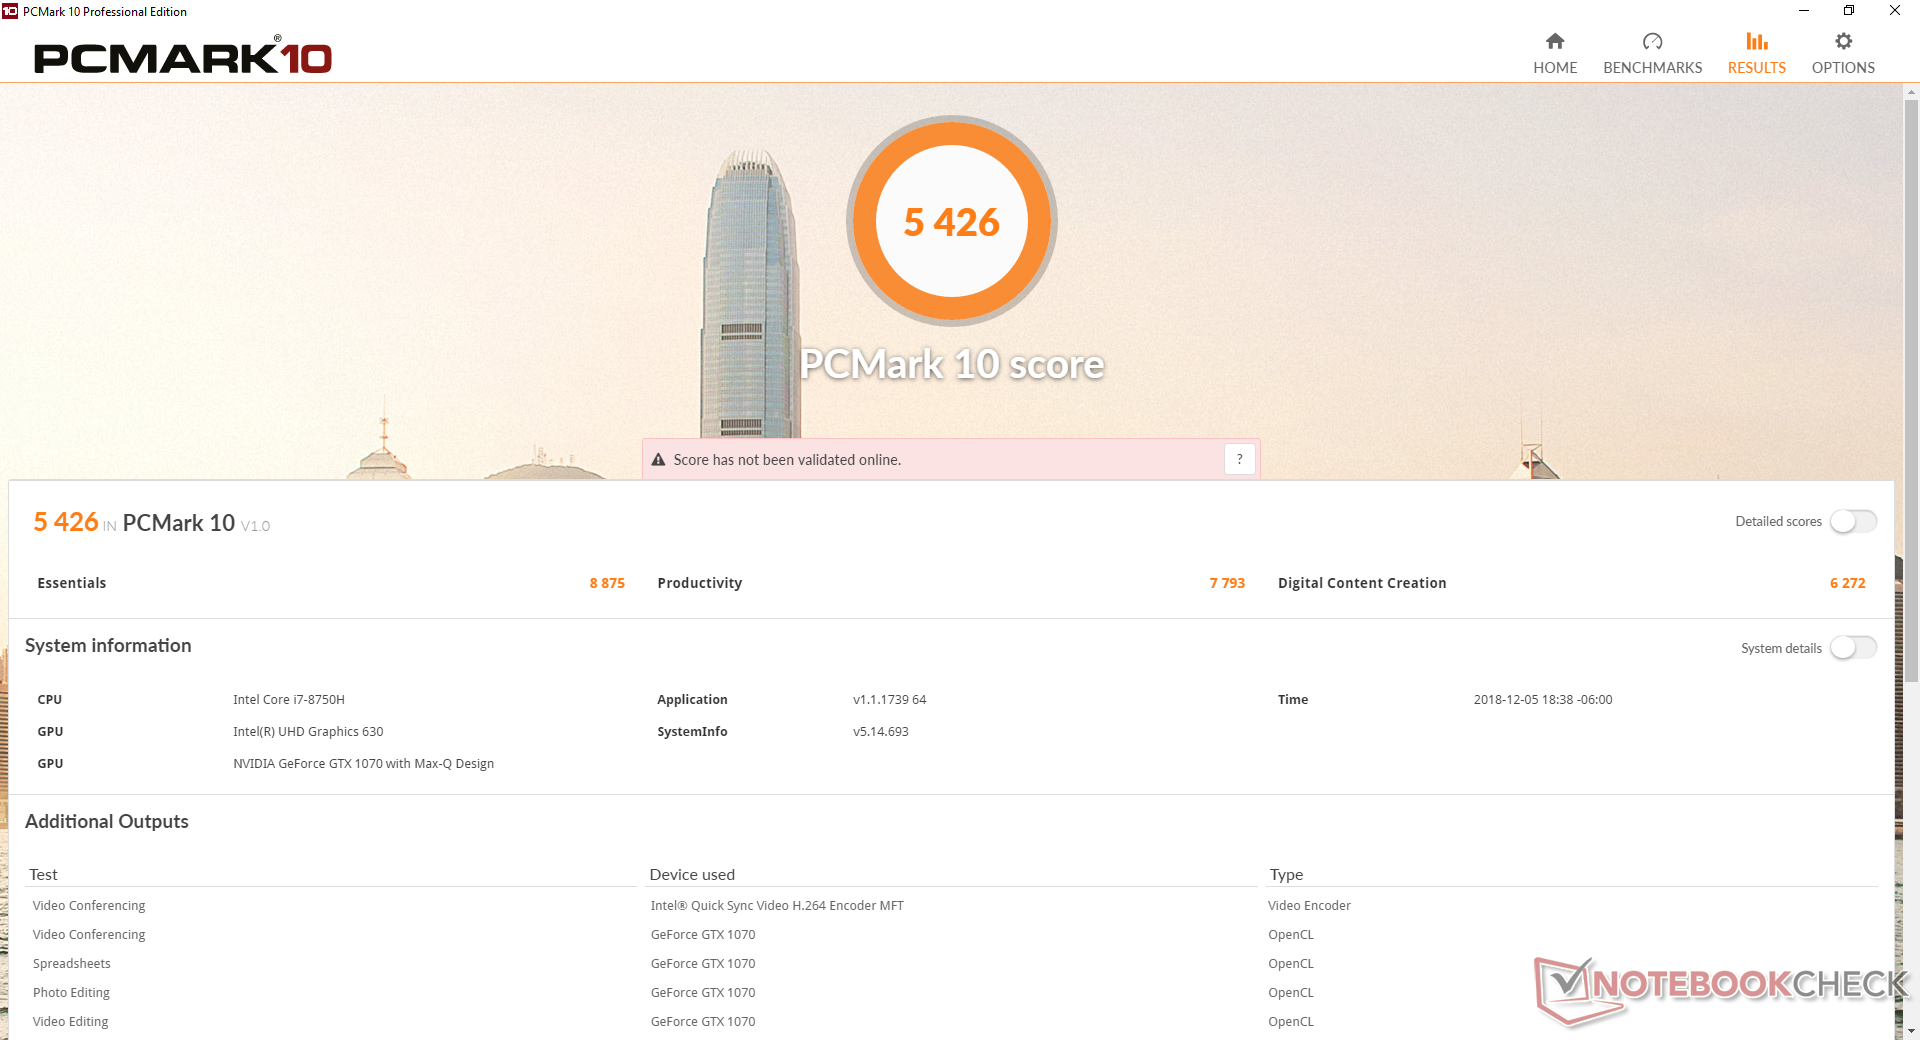
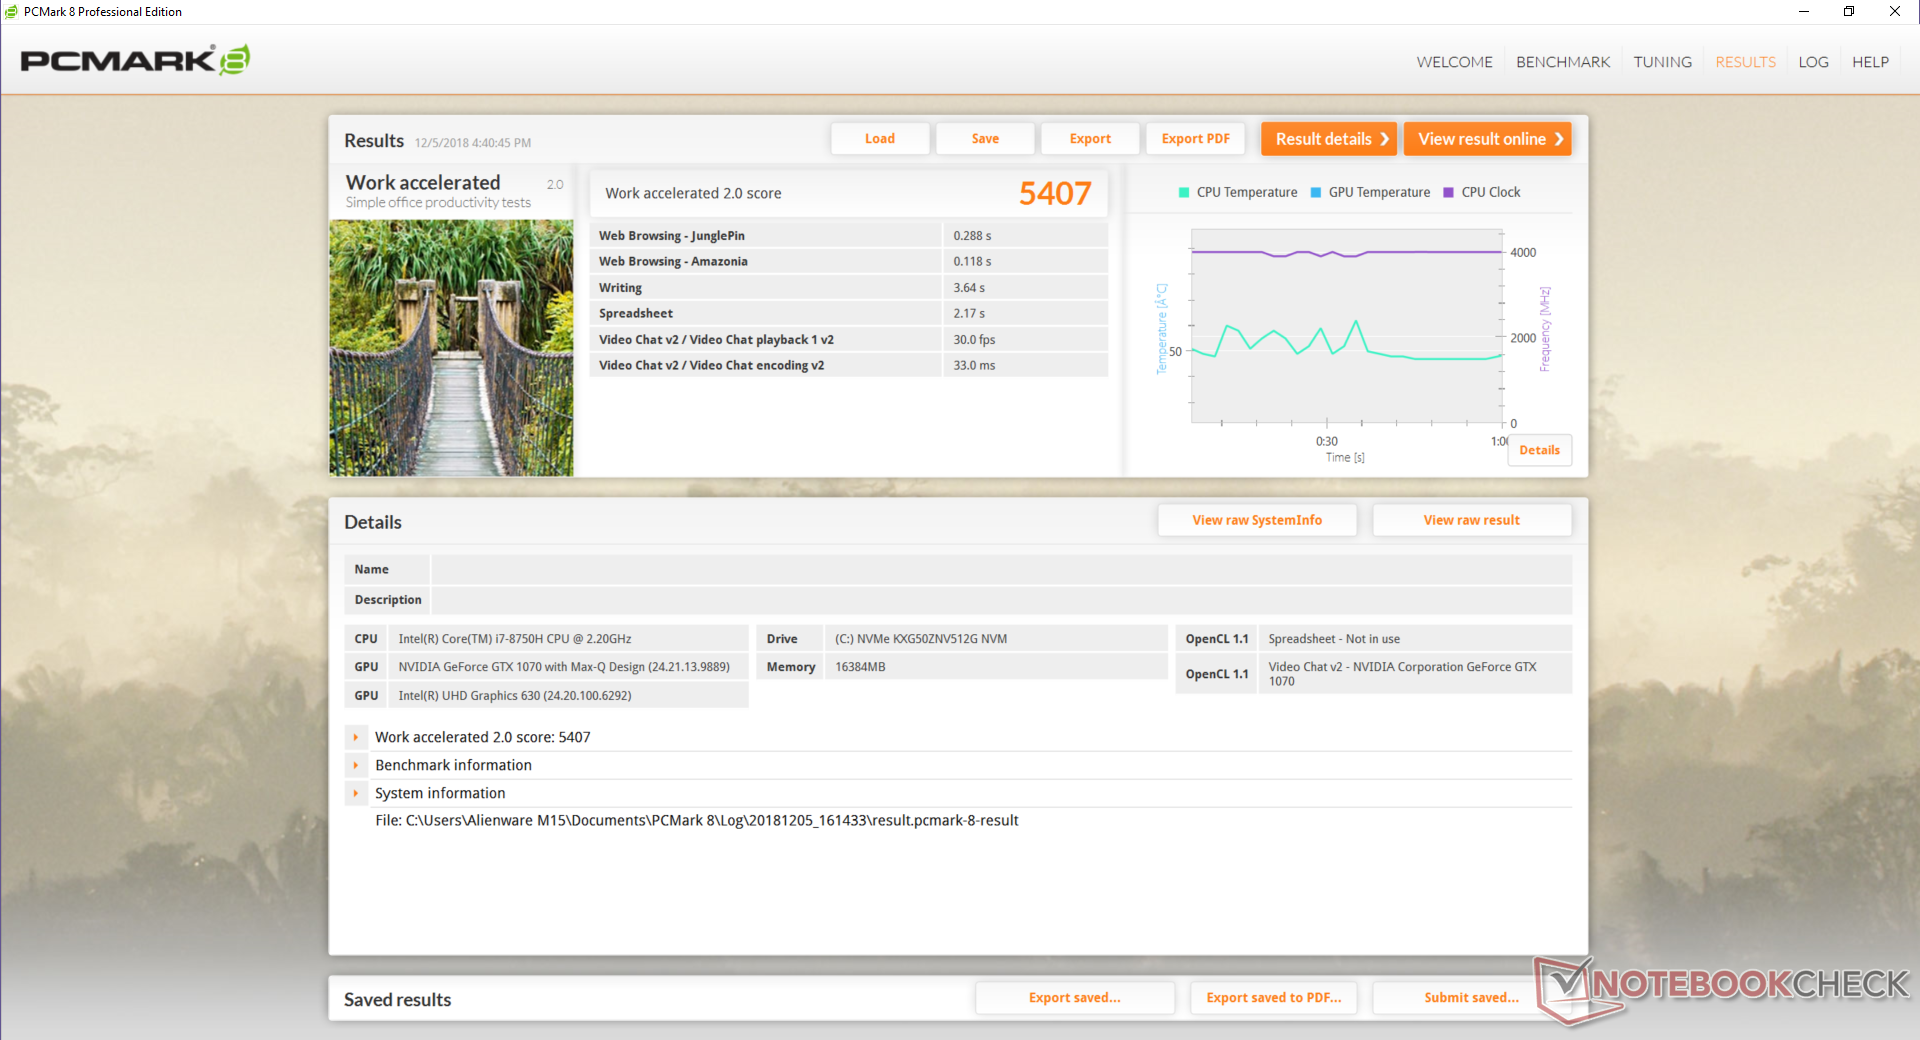
PCMark benchmarks rank our Alienware a few percentage points higher than competing models.
We experienced no hardware or software issues during our time with the test unit. When attempting to reset Windows, however, the system became stuck in a boot loop. Interestingly, this exact same behavior occurred on our HP Spectre Folio 13 unit as well.
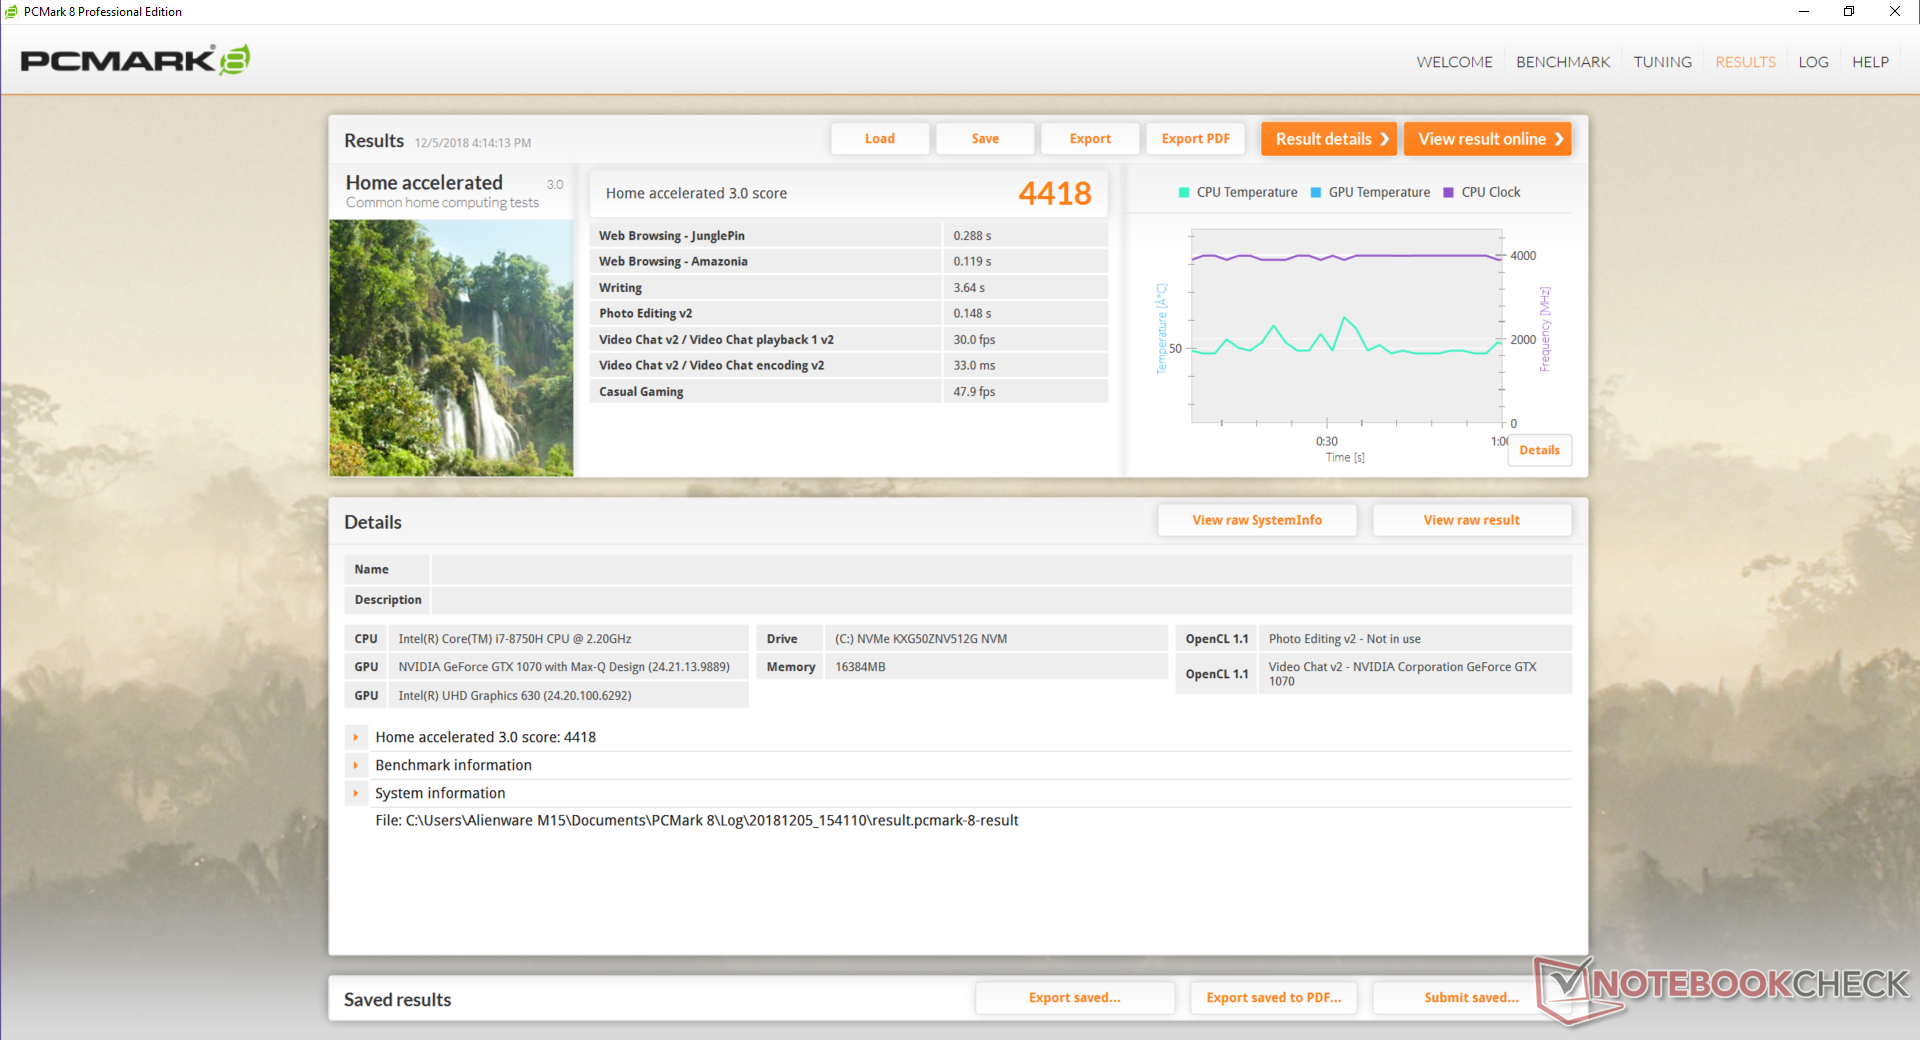
| PCMark 8 Home Score Accelerated v2 | 4418 points | |
| PCMark 8 Work Score Accelerated v2 | 5407 points | |
| PCMark 10 Score | 5426 points | |
Help | ||
Storage Devices
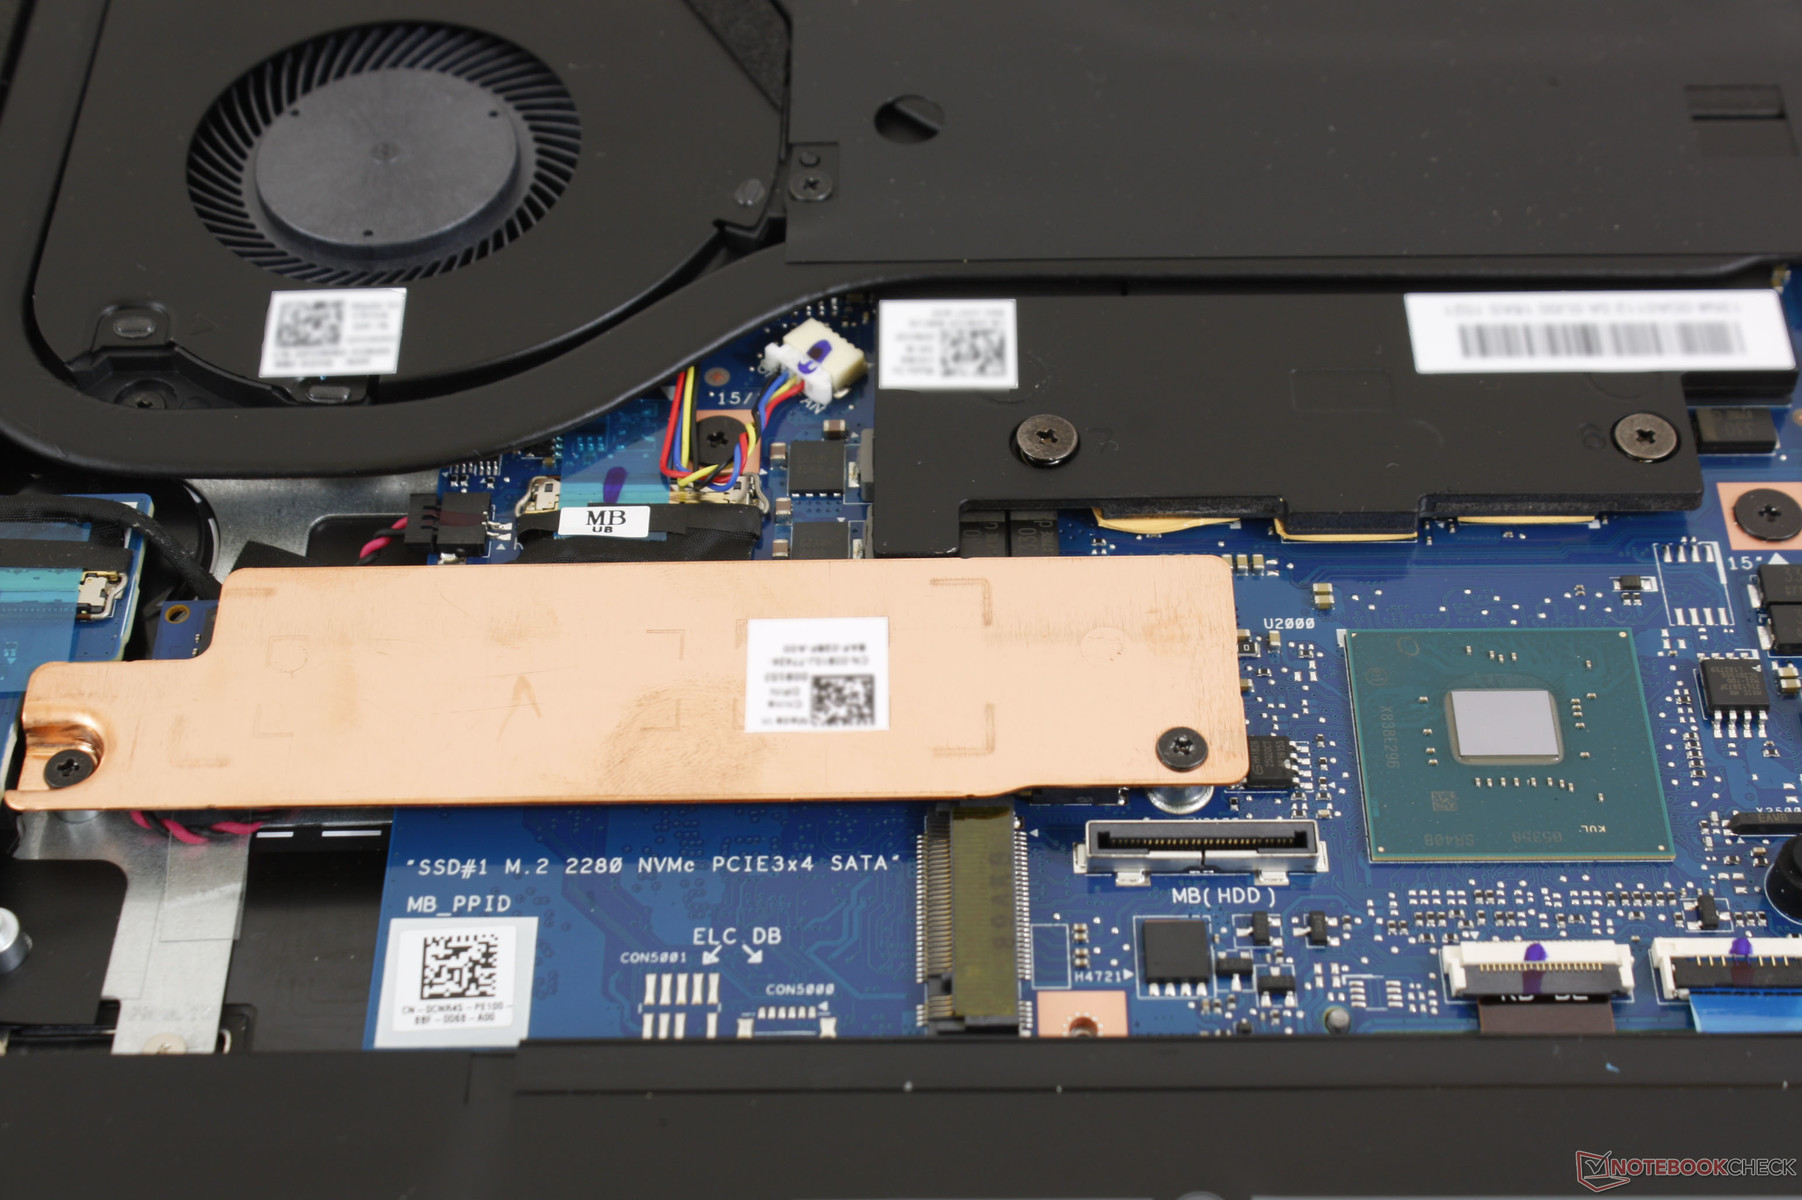
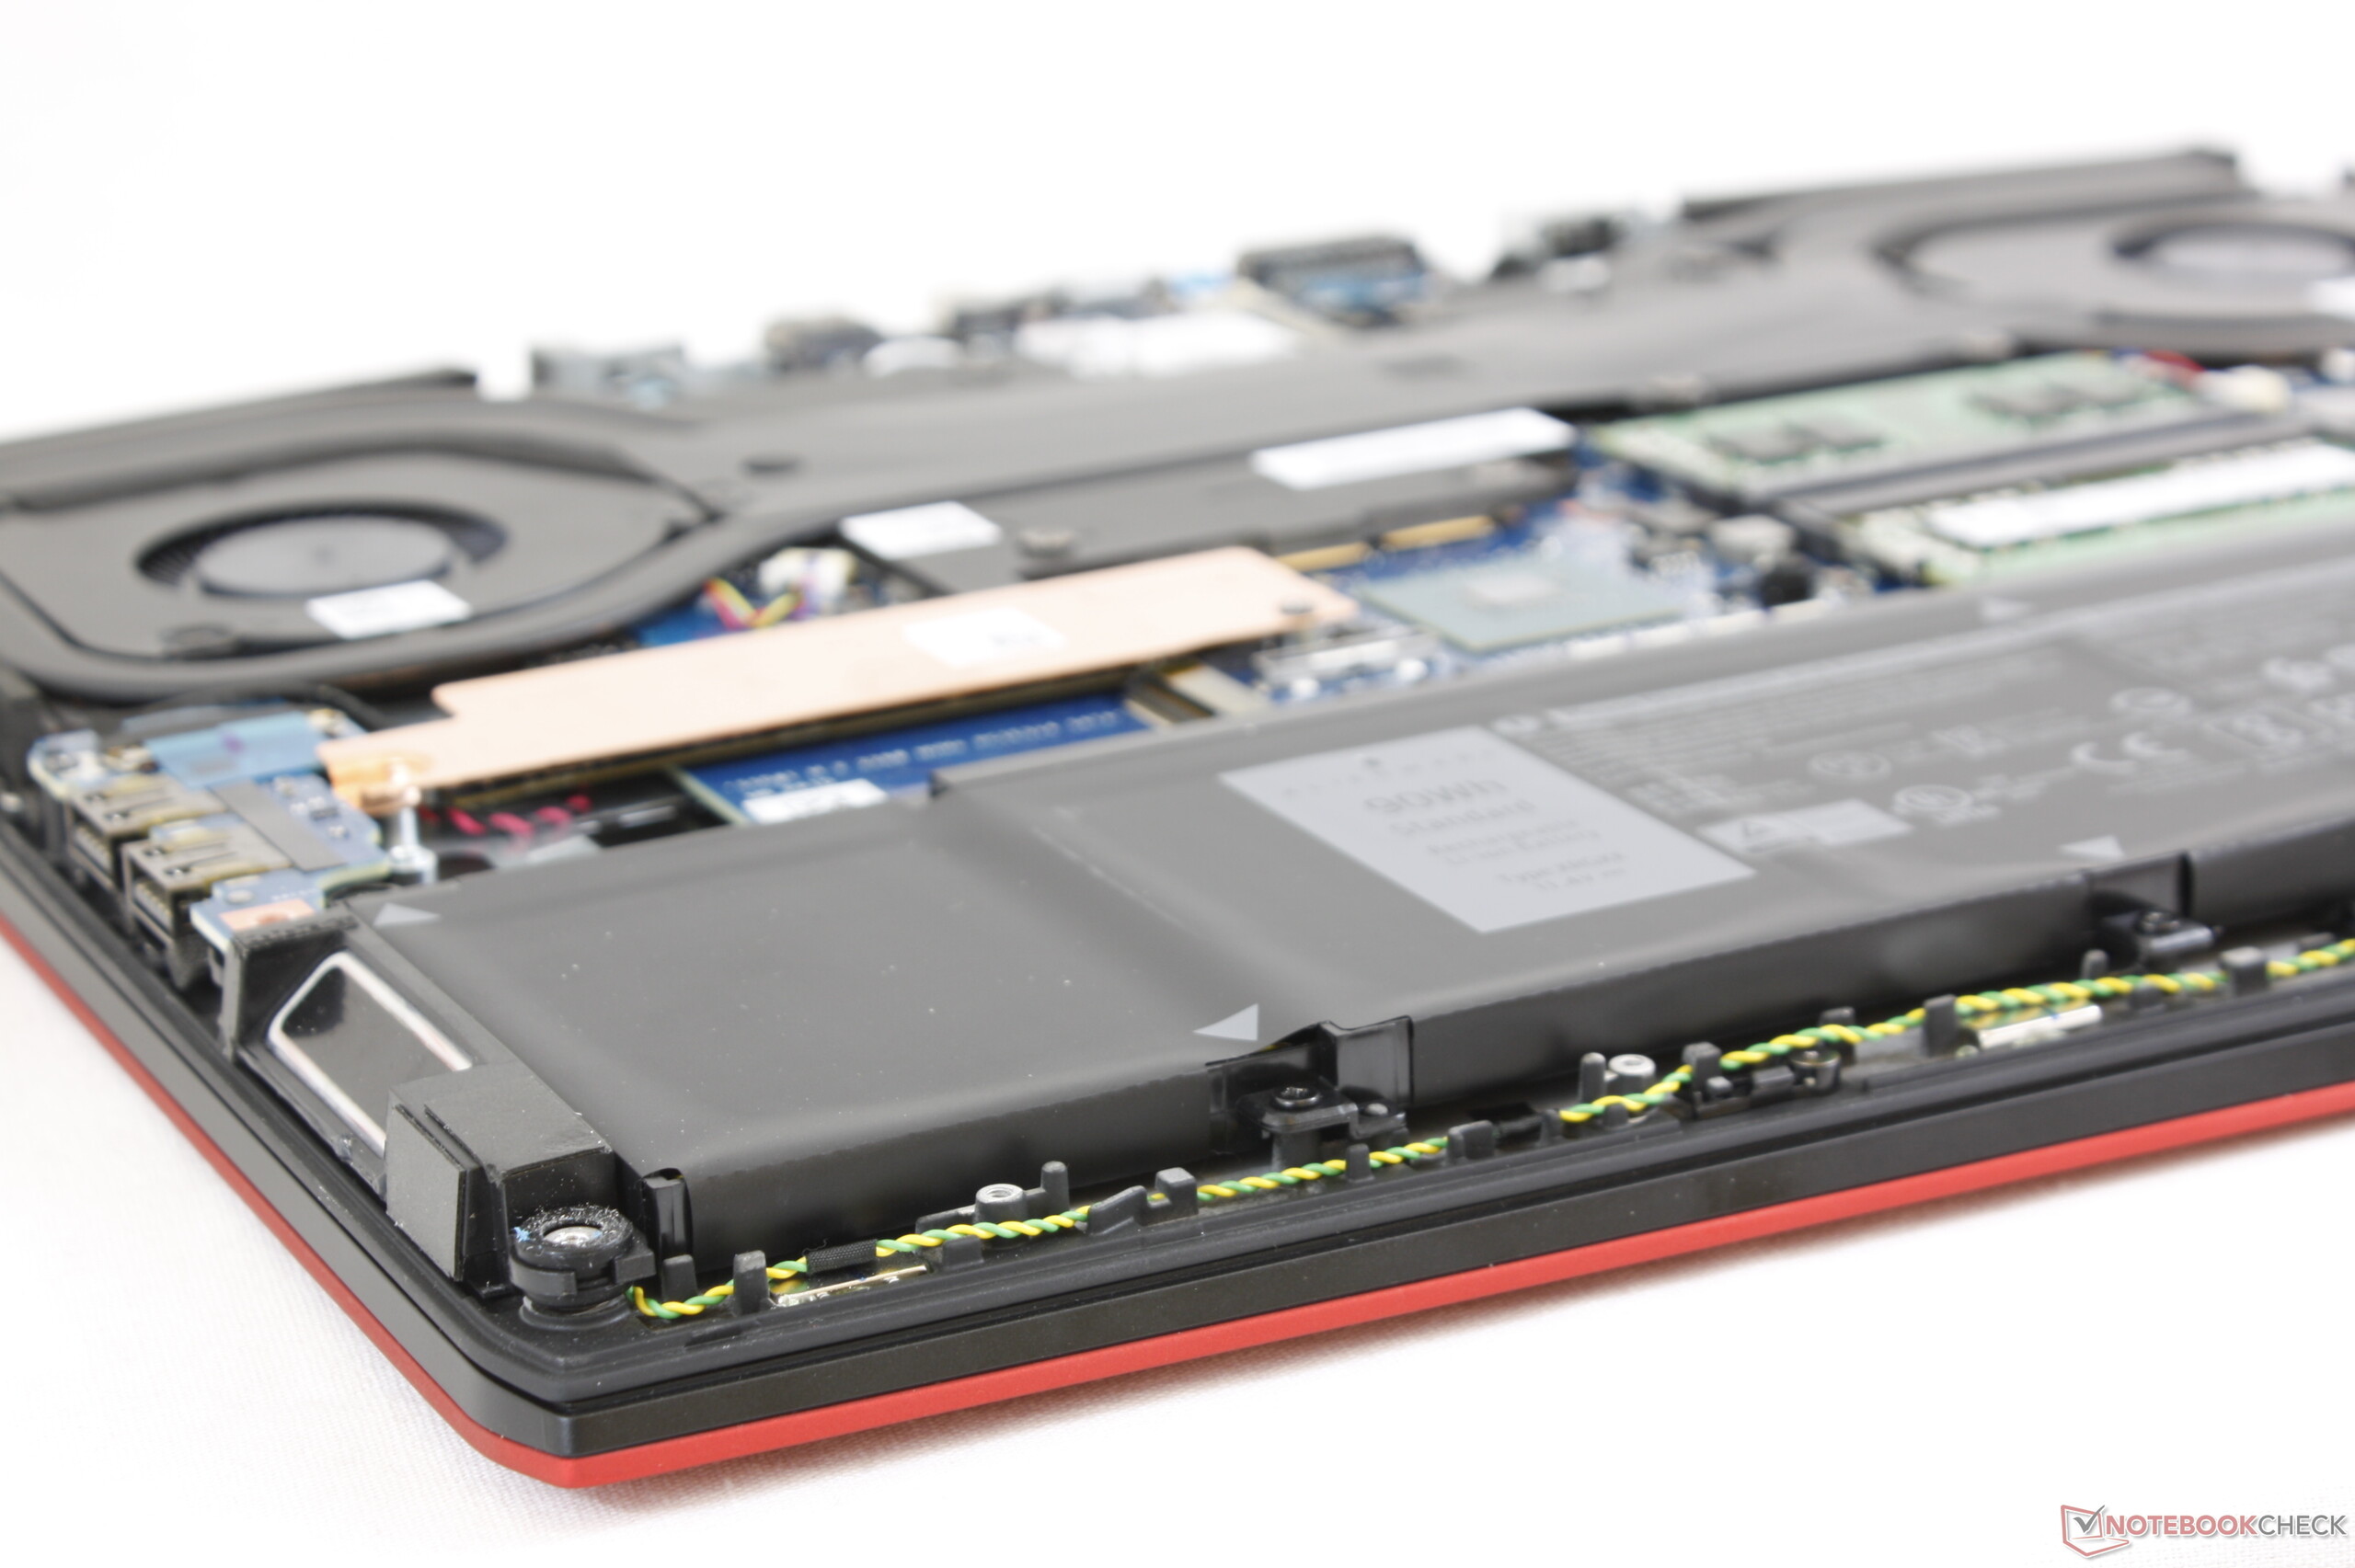
Depending on the SKU, internal storage bays can include either 2x M.2 2280 slots (like our review unit today) or 2x M.2 2280 slots plus 1x 2.5-inch SATA III bay. The latter option ships with a smaller 60 Wh internal battery in order to make room for the 2.5-inch bay. The larger Alienware 15 R4 includes 3x storage bays by default without needing to cut battery capacity. Even so, we're surprised to even see 3x storage bays as an option since competing ultrathin laptops like the Gigabyte Aero 15x, Razer Blade 15, or MSI GS65 have just one or two storage bays at most.
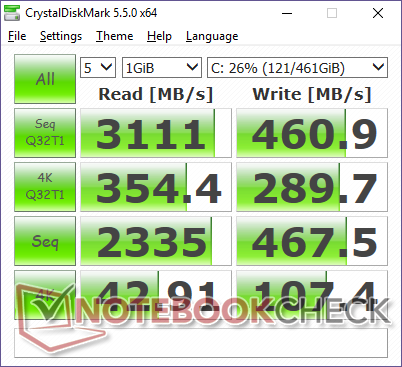
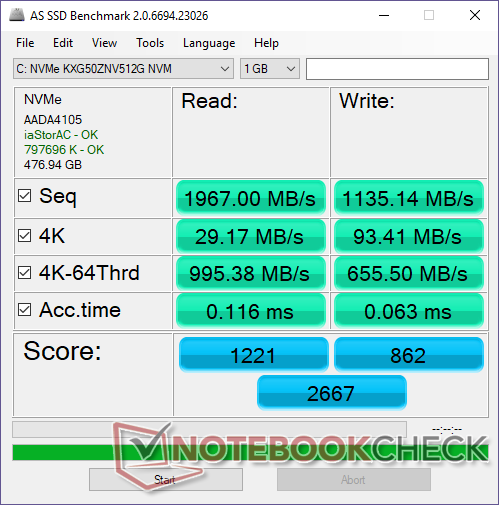
Perhaps unsurprisingly, the 512 GB NVMe SSD in our test unit is the same Toshiba XG5 KXG50ZNV512G SSD as found on the Alienware 15 R4. While performance is good especially in regards to sequential read rates, the drive is still a step below the competing 512 GB Samsung PM961 as found on the Razer Blade 15. Toshiba NVMe SSDs in general tend to have slower sequential write rates than Samsung options.
Strangely, Dell configures Intel Optane for the SKUs with 3x storage bays only.
See our table of SSDs and HDDs for more benchmark comparisons.
| Alienware m15 GTX 1070 Max-Q Toshiba XG5 KXG50ZNV512G | Razer Blade 15 2018 Samsung PM961 NVMe MZVLW512HMJP | Alienware 15 R4 Toshiba XG5 KXG50ZNV256G | MSI GS65 Stealth Thin 8RE-051US Samsung SSD PM981 MZVLB256HAHQ | Asus Zephyrus S GX531GS WDC PC SN520 SDAPNUW-512G | Gigabyte Aero 15X v8 Toshiba NVMe THNSN5512GPU7 | |
|---|---|---|---|---|---|---|
| AS SSD | 42% | -24% | 0% | 21% | -0% | |
| Seq Read | 1967 | 2376 21% | 2441 24% | 1612 -18% | 903 -54% | 2213 13% |
| Seq Write | 1135 | 1521 34% | 300.4 -74% | 1475 30% | 1261 11% | 1163 2% |
| 4K Read | 29.17 | 46.45 59% | 32.87 13% | 43.09 48% | 40.02 37% | 23.36 -20% |
| 4K Write | 93.4 | 93.6 0% | 94.8 1% | 83.8 -10% | 103.6 11% | 80.4 -14% |
| 4K-64 Read | 995 | 1300 31% | 437.4 -56% | 611 -39% | 1030 4% | 847 -15% |
| 4K-64 Write | 656 | 1204 84% | 310.5 -53% | 570 -13% | 1285 96% | 742 13% |
| Access Time Read * | 0.116 | 0.051 56% | 0.116 -0% | 0.071 39% | 0.129 -11% | 0.119 -3% |
| Access Time Write * | 0.063 | 0.038 40% | 0.053 16% | 0.045 29% | 0.036 43% | 0.046 27% |
| Score Read | 1221 | 1584 30% | 714 -42% | 815 -33% | 1161 -5% | 1092 -11% |
| Score Write | 862 | 1450 68% | 435 -50% | 802 -7% | 1515 76% | 939 9% |
| Score Total | 2667 | 3806 43% | 1416 -47% | 2039 -24% | 3294 24% | 2536 -5% |
| Copy ISO MB/s | 642 | |||||
| Copy Program MB/s | 431.5 | |||||
| Copy Game MB/s | 706 | |||||
| CrystalDiskMark 5.2 / 6 | 49% | -10% | 49% | 36% | 36% | |
| Write 4K | 107.4 | 94.2 -12% | 96.8 -10% | 91.5 -15% | 98.2 -9% | 94.4 -12% |
| Read 4K | 42.91 | 39.23 -9% | 35.73 -17% | 40.41 -6% | 39.43 -8% | 37.65 -12% |
| Write Seq | 467.5 | 1483 217% | 362.3 -23% | 1528 227% | 1386 196% | 1335 186% |
| Read Seq | 2335 | 1371 -41% | 2110 -10% | 1235 -47% | 1100 -53% | 1404 -40% |
| Write 4K Q32T1 | 289.7 | 296.2 2% | 318.6 10% | 259 -11% | 270.3 -7% | 268.6 -7% |
| Read 4K Q32T1 | 354.4 | 342.5 -3% | 366.7 3% | 364.9 3% | 340.3 -4% | 332.8 -6% |
| Write Seq Q32T1 | 460.9 | 1527 231% | 351 -24% | 1529 232% | 1454 215% | 1375 198% |
| Read Seq Q32T1 | 3111 | 3280 5% | 2813 -10% | 3472 12% | 1681 -46% | 2627 -16% |
| Total Average (Program / Settings) | 46% /
45% | -17% /
-18% | 25% /
21% | 29% /
27% | 18% /
15% |
* ... smaller is better

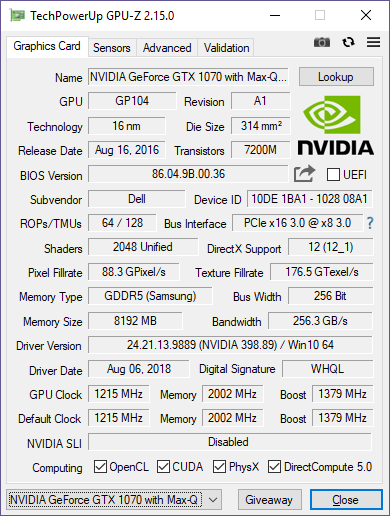
GPU Performance
The GeForce GTX 1070 Max-Q is only about 10 percent slower than the standard GTX 1070 in the Alienware 15 R4 according to 3DMark benchmarks. Users who want the lower-end configuration of the Alienware m15 with GTX 1060 graphics will see a performance decrease of about 25 to 30 percent. Should Dell decide to introduce a GTX 1080 Max-Q option in the future like on the Alienware 15 R3, then expect a graphics boost of about 15 percent or more over the GTX 1070 Max-Q when on higher resolutions.
See our dedicated page on the GTX 1070 Max-Q for more technical information and benchmarks.
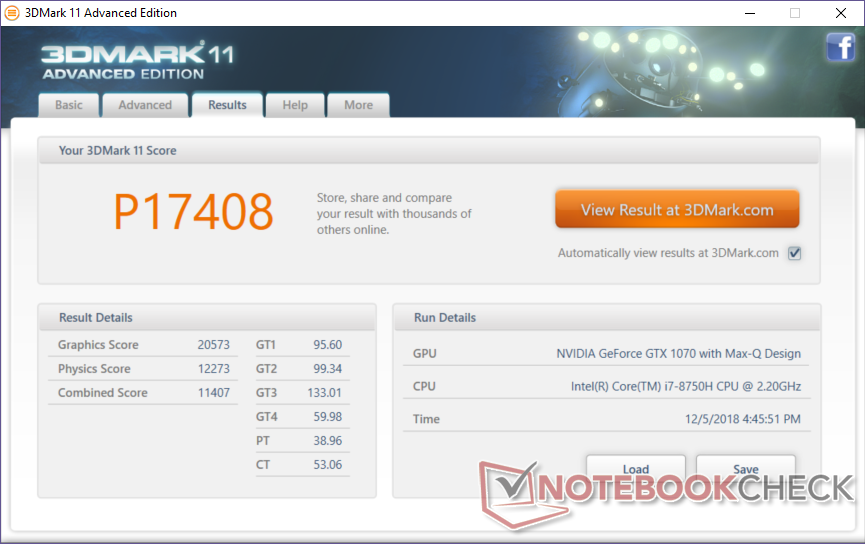
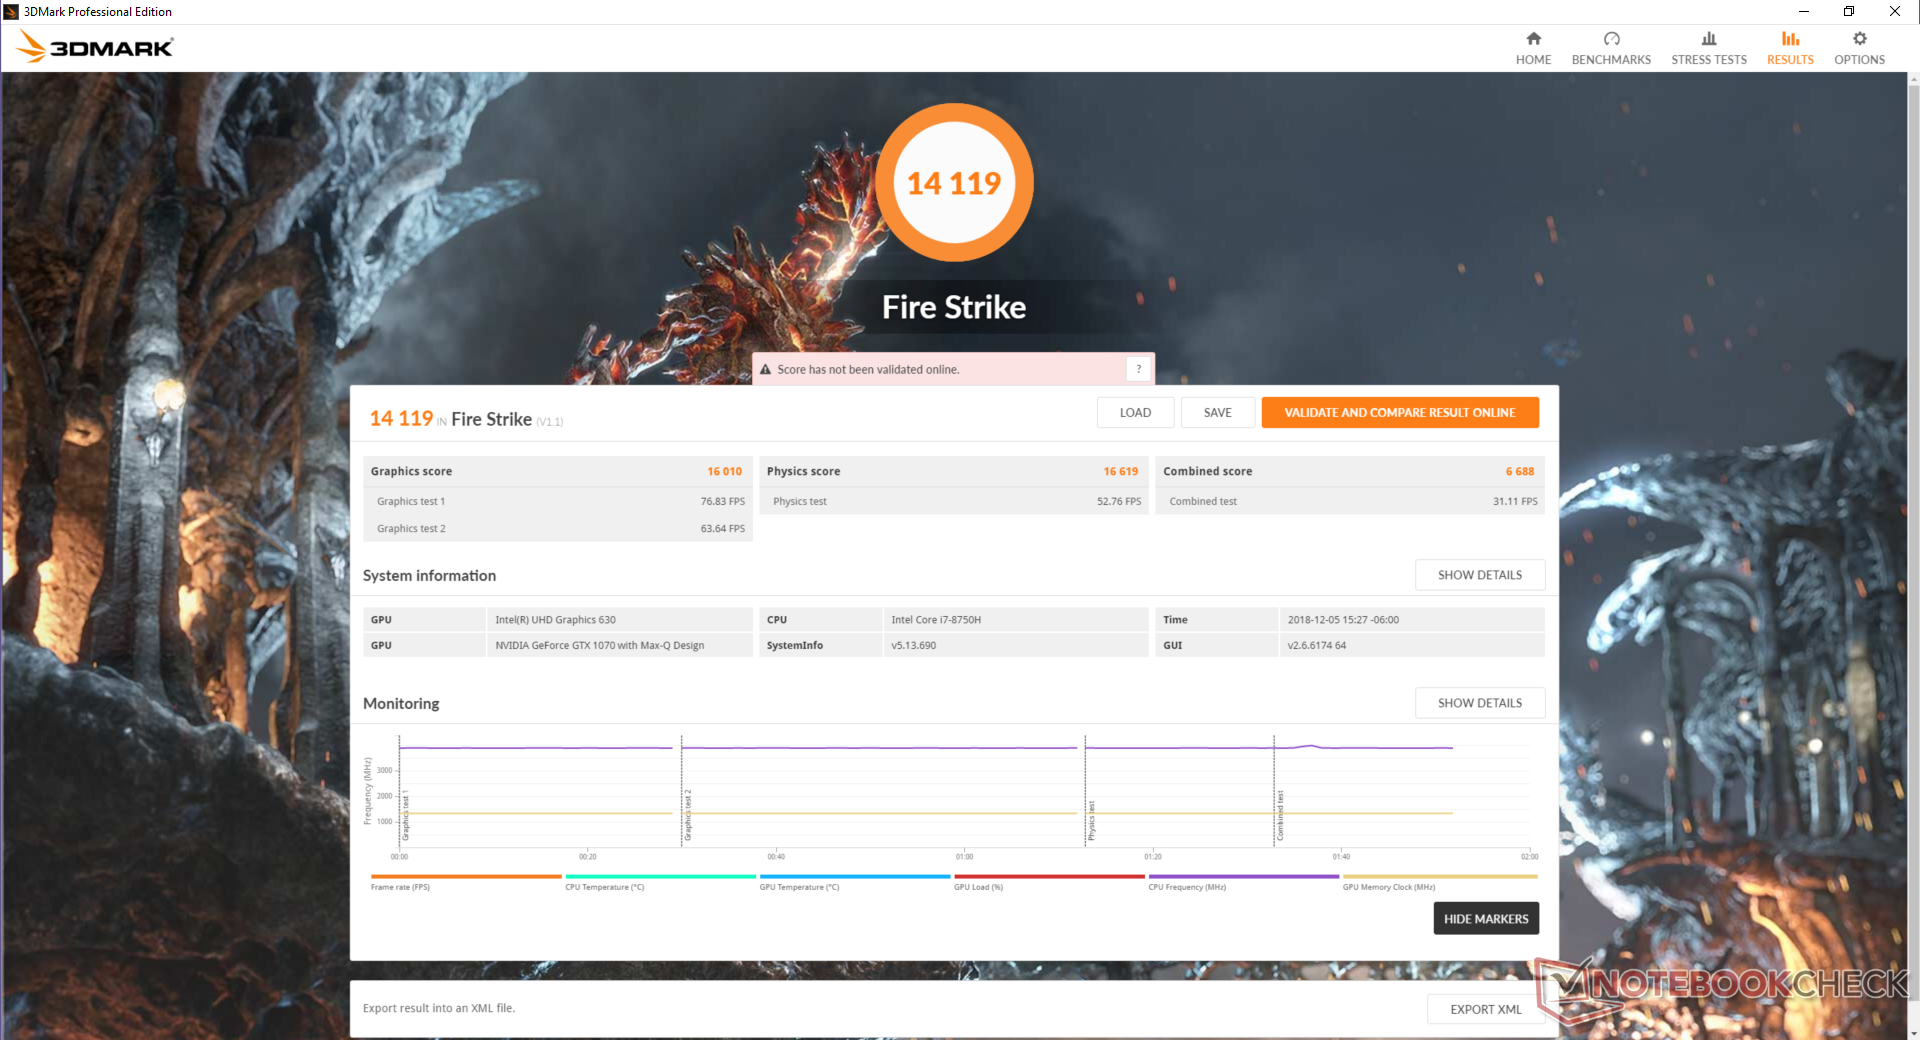
| 3DMark 11 Performance | 17408 points | |
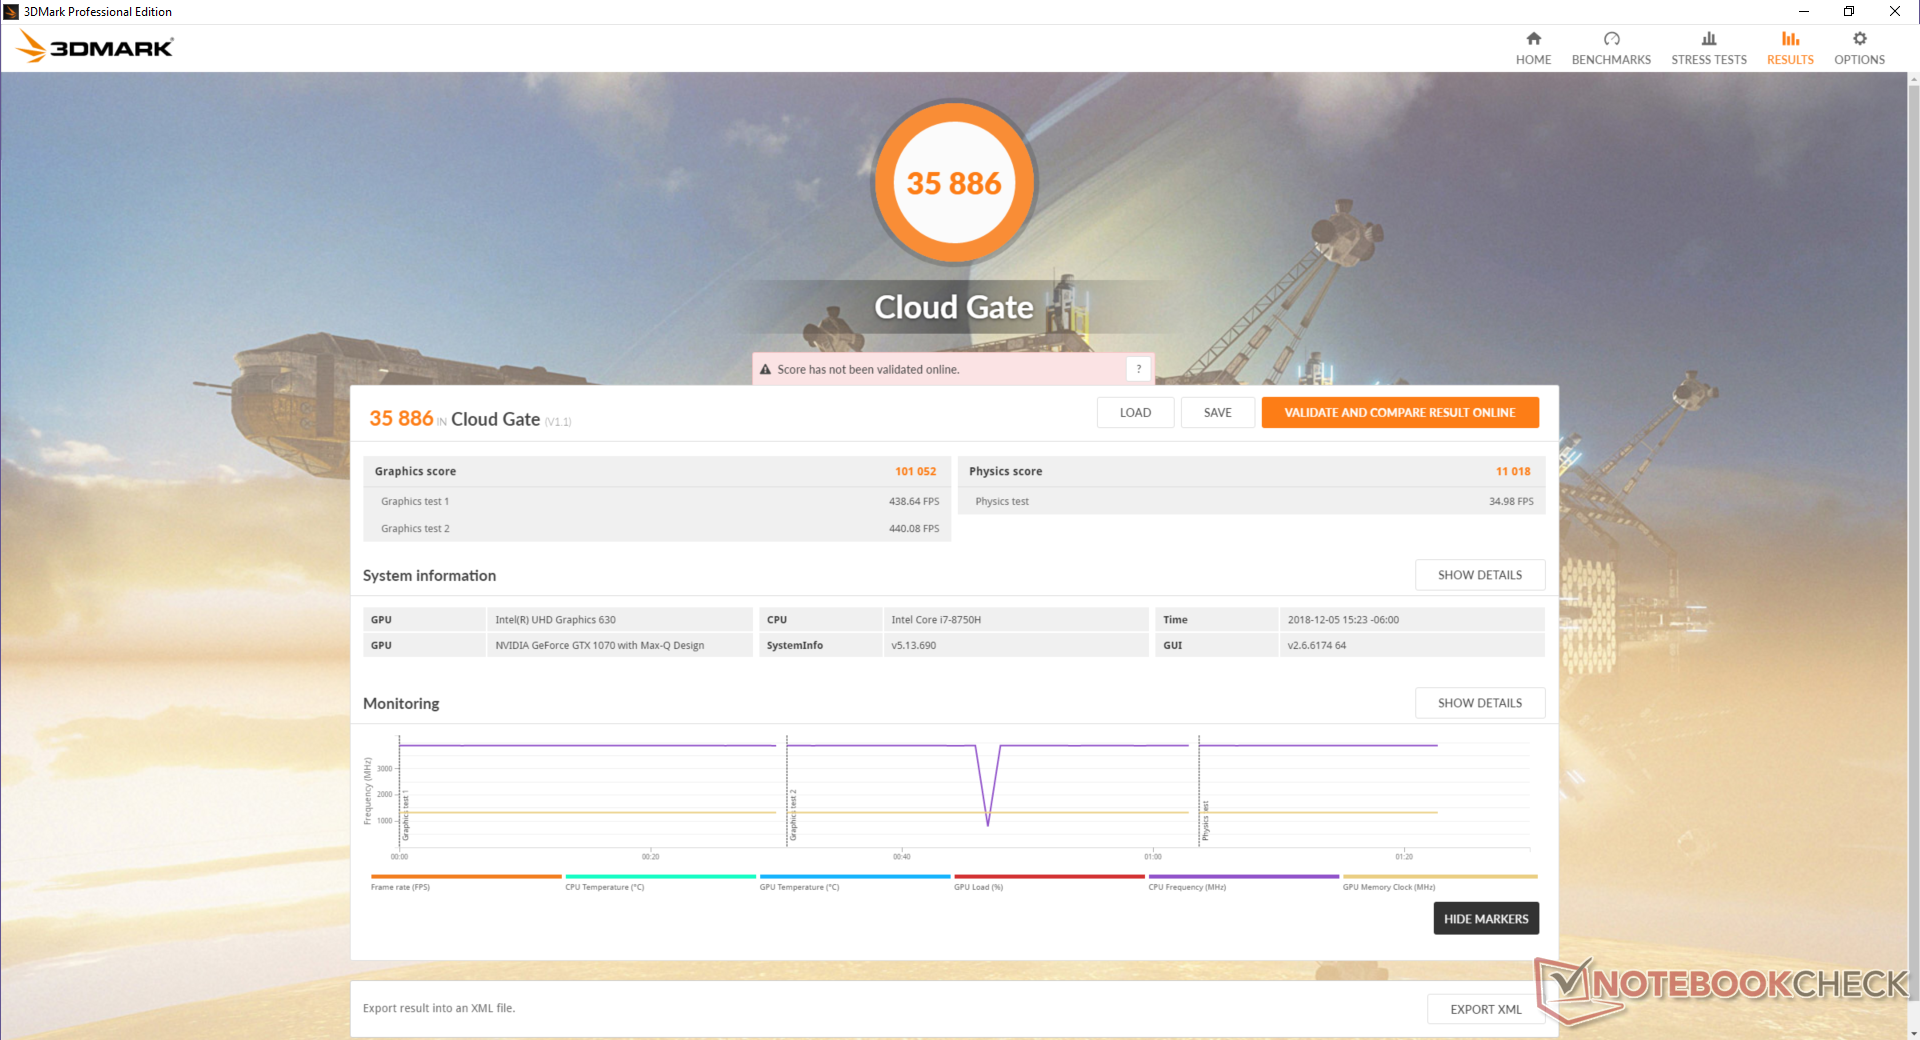
| 3DMark Cloud Gate Standard Score | 35886 points | |
| 3DMark Fire Strike Score | 14119 points | |
Help | ||
Gaming Performance
We recommend the GTX 1070 Max-Q at minimum if configuring with a 1080p 144 Hz display. The extra horsepower is put to good use for reaching frame rates above 100 FPS especially for more demanding titles. If your gaming habits consist mostly of less demanding titles like Fortnite, LoL, CS:GO or Overwatch, however, then the GTX 1060 should suffice if just barely.
Frame rates when idling on Witcher 3 are stable with no recurring dips to suggest no interrupting background activity.
| low | med. | high | ultra | |
| BioShock Infinite (2013) | 291.6 | 247.6 | 242.8 | 136.8 |
| The Witcher 3 (2015) | 254 | 173.9 | 101.6 | 54.2 |
| Rise of the Tomb Raider (2016) | 217.5 | 166 | 102.8 | 85.1 |
Emissions
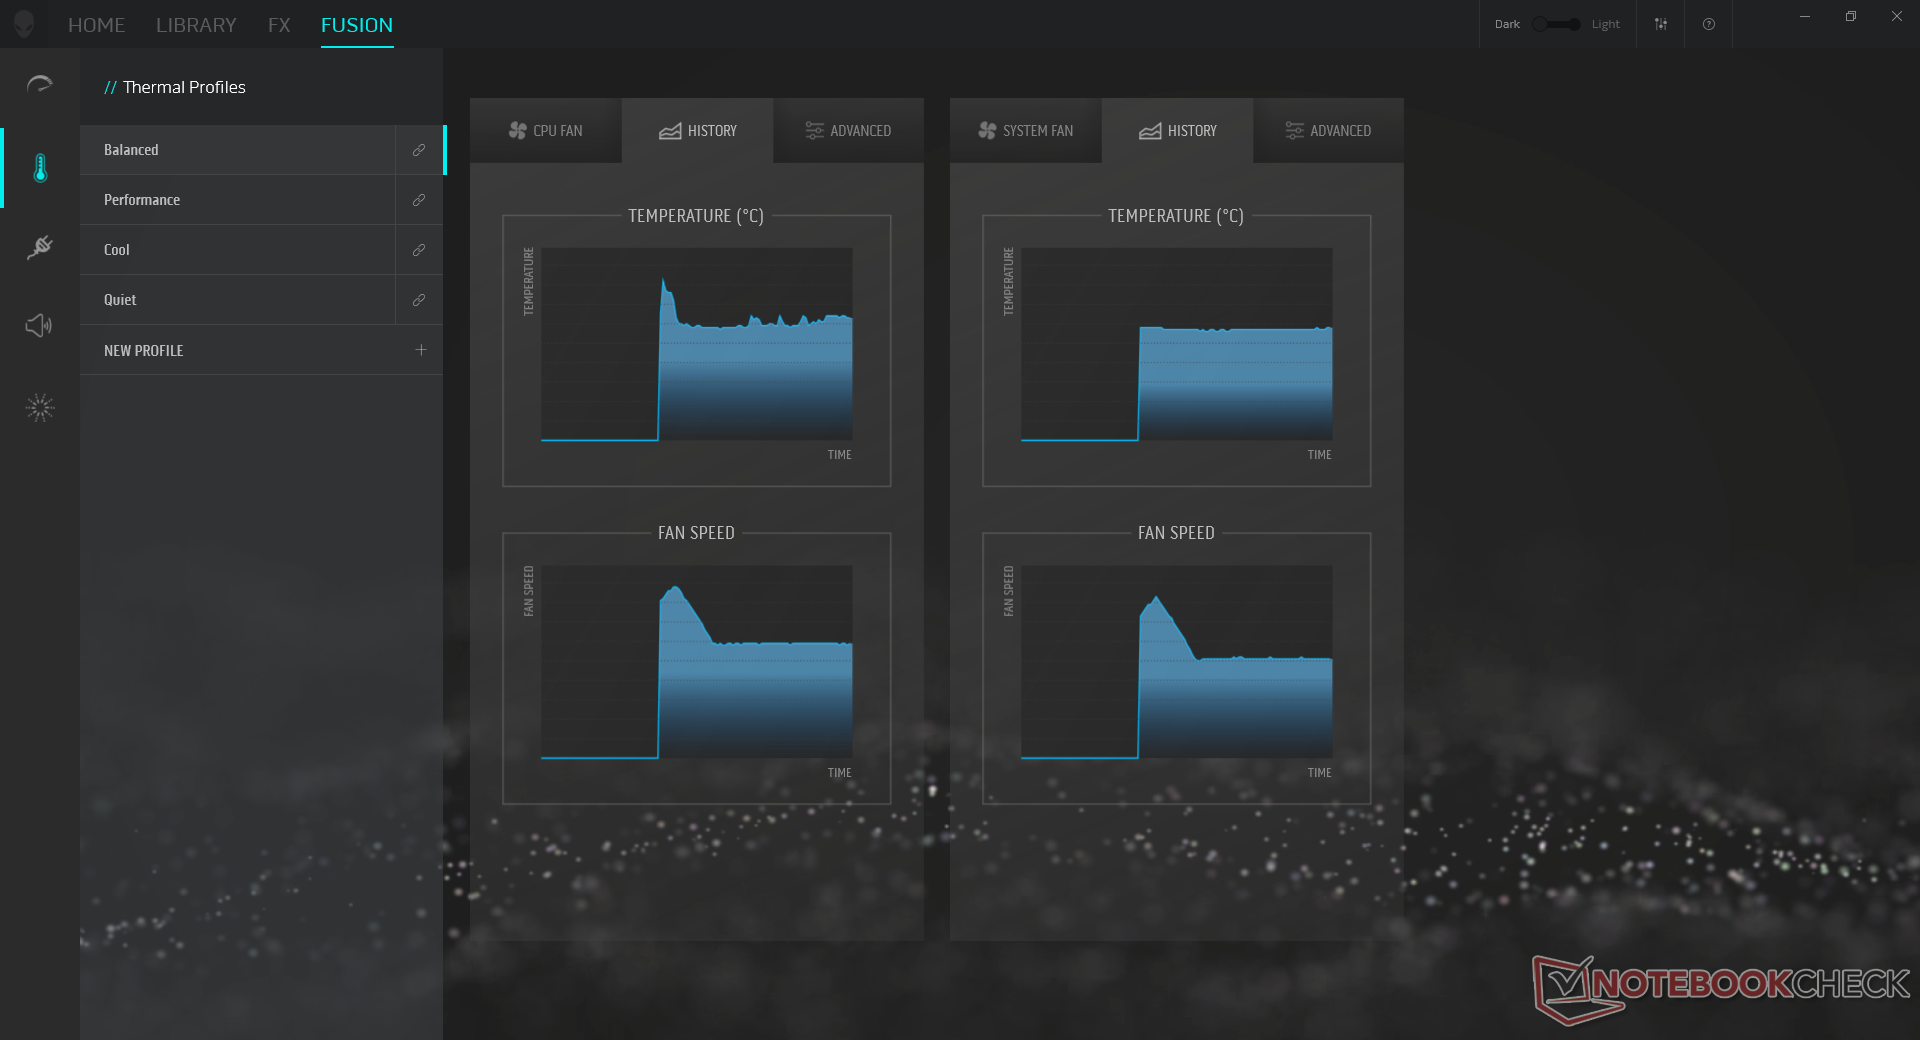
System Noise
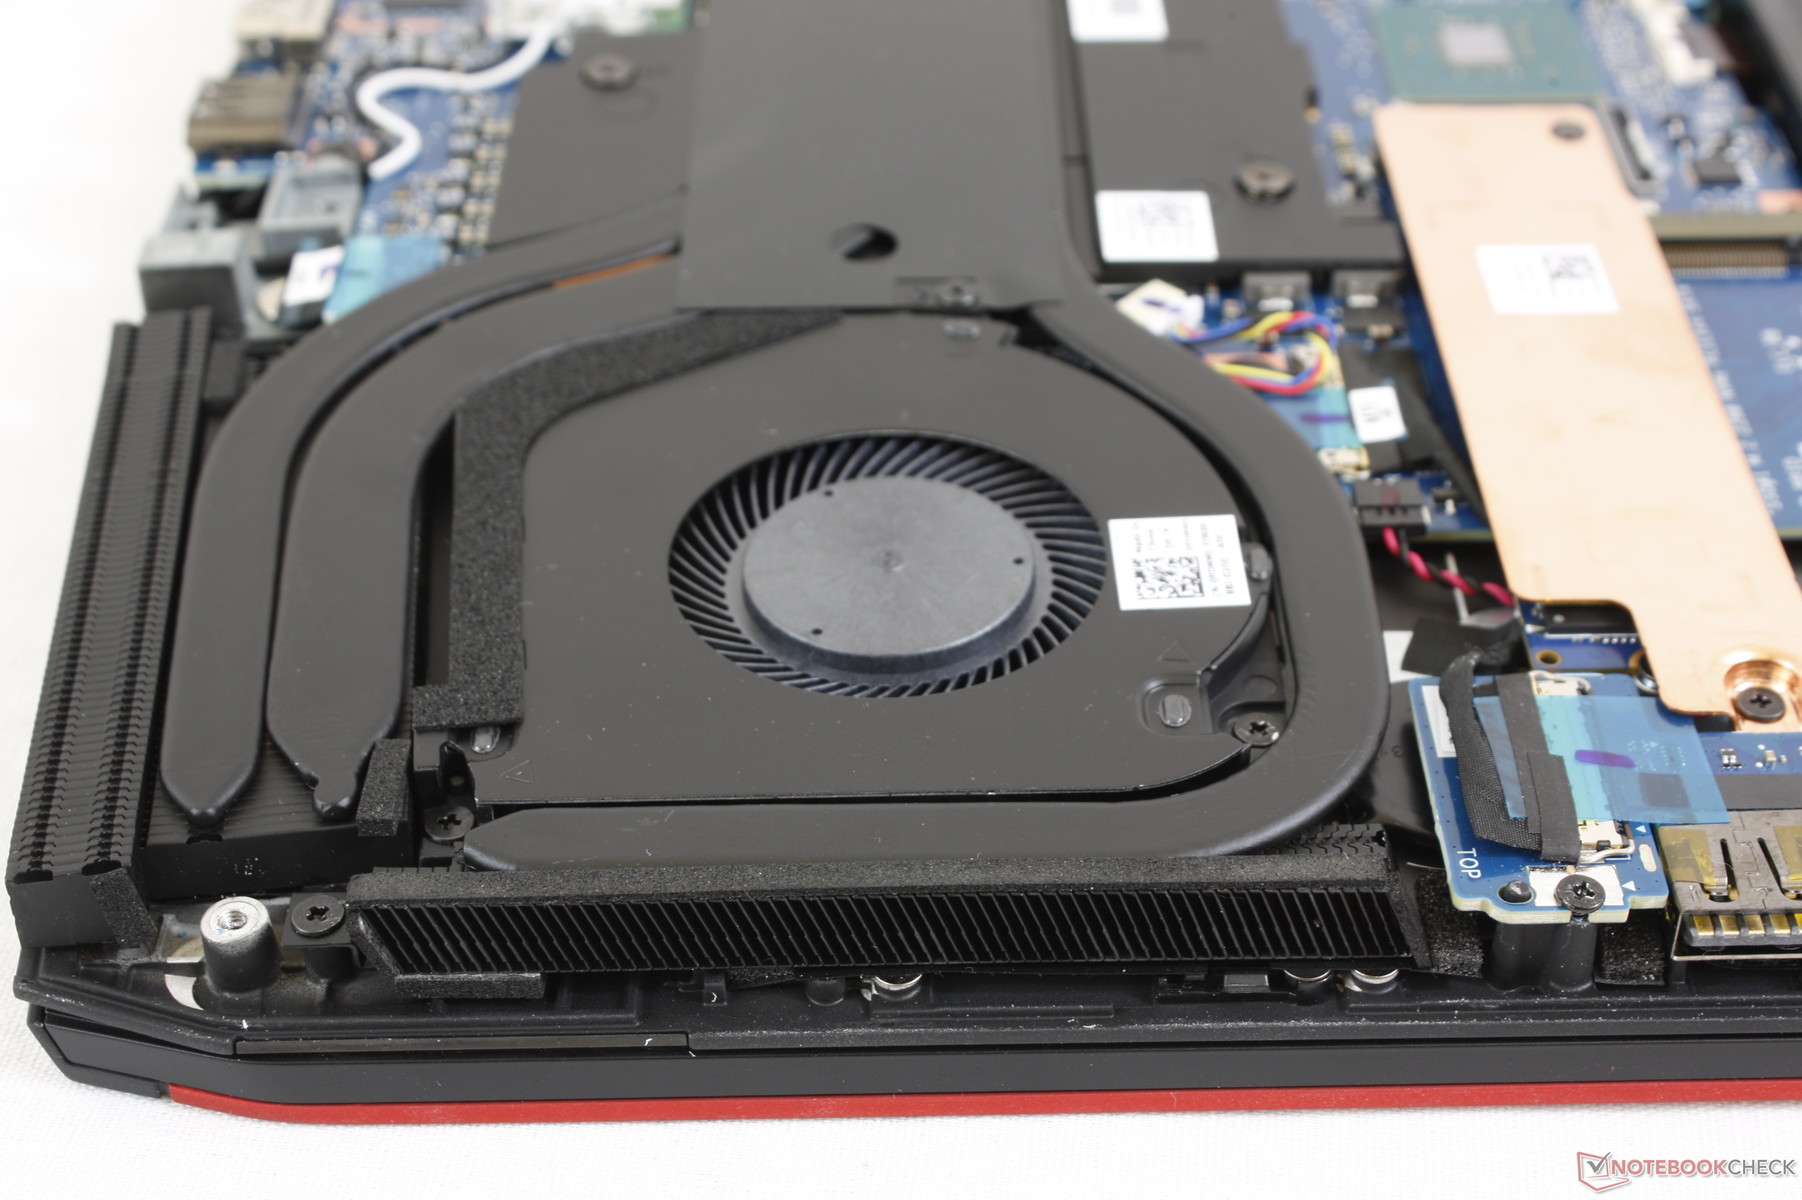
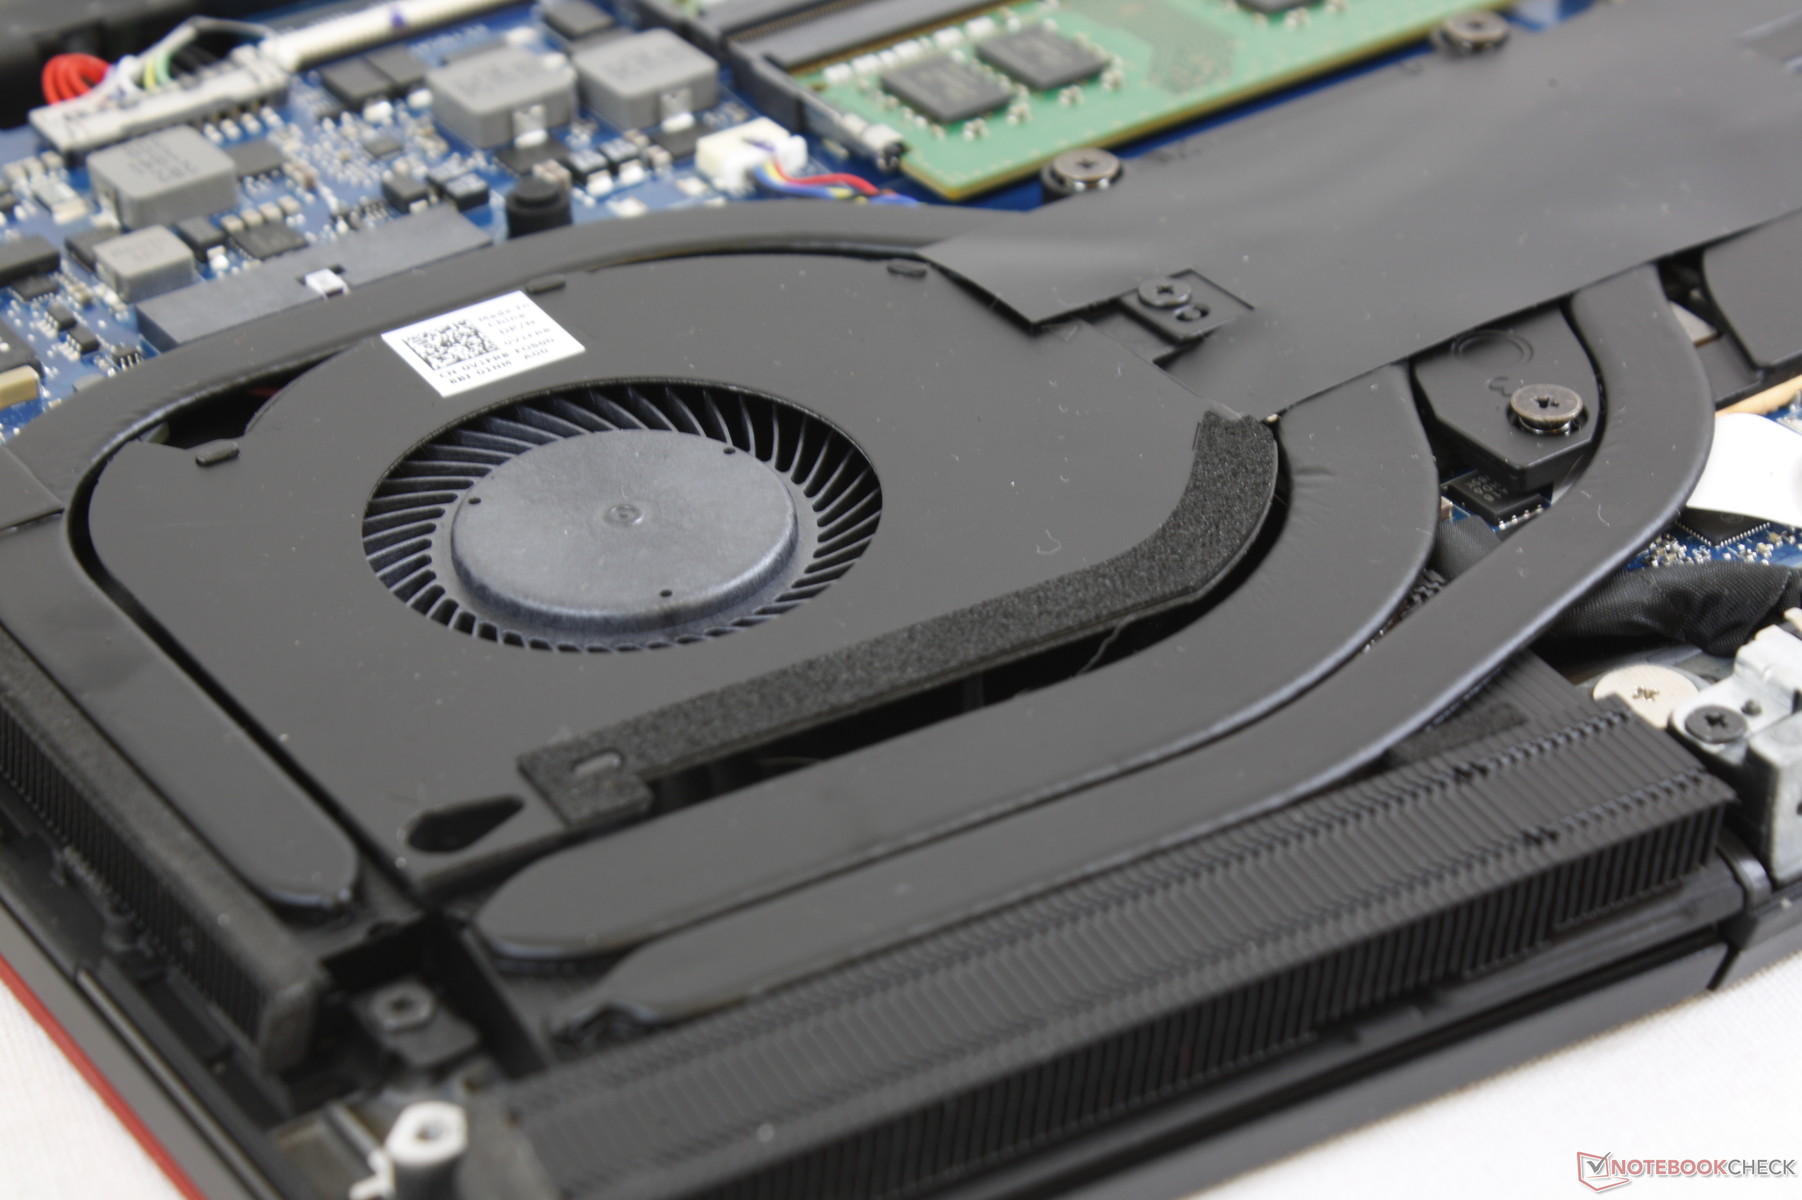
The cooling solution consists of twin fans and four heat pipes between them. Both fans will idle if simply idling on desktop which is an improvement over the always-active fans of the 15 R4. However, it doesn't take much effort to kick start the fans of the m15 as simple actions like launching applications will induce a short-lived pulse of up to 34 dB(A).
When under higher loads like gaming, fan noise jumps to about 45 dB(A) for the first few minutes. Thereafter, fan noise becomes even louder at almost 50 dB(A) as core temperatures rise. The m15 is therefore not significantly louder or quieter than its larger sibling when gaming. When compared to its closest competitors, the system is louder than both the Razer Blade 15 and MSI GS65 but quieter than the Asus Zephyrus GX531 and Gigabyte Aero 15X.
We are able to notice slight electronic noise emanating from the right half of our test unit possibly from the NVMe SSD. As a result, our unit is never completely silent when powered on even if its fans are inactive.
| Alienware m15 GTX 1070 Max-Q GeForce GTX 1070 Max-Q, i7-8750H, Toshiba XG5 KXG50ZNV512G | Razer Blade 15 2018 GeForce GTX 1070 Max-Q, i7-8750H, Samsung PM961 NVMe MZVLW512HMJP | Alienware 15 R4 GeForce GTX 1070 Mobile, i9-8950HK, Toshiba XG5 KXG50ZNV256G | MSI GS65 Stealth Thin 8RE-051US GeForce GTX 1060 Mobile, i7-8750H, Samsung SSD PM981 MZVLB256HAHQ | Asus Zephyrus S GX531GS GeForce GTX 1070 Max-Q, i7-8750H, WDC PC SN520 SDAPNUW-512G | Gigabyte Aero 15X v8 GeForce GTX 1070 Max-Q, i7-8750H, Toshiba NVMe THNSN5512GPU7 | |
|---|---|---|---|---|---|---|
| Noise | -6% | -19% | 1% | -14% | -10% | |
| off / environment * | 28.6 | 29 -1% | 29 -1% | 28.4 1% | 29 -1% | 29 -1% |
| Idle Minimum * | 28.6 | 29 -1% | 32 -12% | 28.4 1% | 33 -15% | 30 -5% |
| Idle Average * | 28.6 | 30 -5% | 33 -15% | 28.4 1% | 34 -19% | 31 -8% |
| Idle Maximum * | 28.6 | 38 -33% | 50 -75% | 29.6 -3% | 40 -40% | 35 -22% |
| Load Average * | 40.8 | 46 -13% | 50 -23% | 43.5 -7% | 47 -15% | 49 -20% |
| Witcher 3 ultra * | 49.6 | 49 1% | 51 -3% | 45.7 8% | 51 -3% | 51 -3% |
| Load Maximum * | 49.6 | 46 7% | 51 -3% | 45.7 8% | 53 -7% | 54 -9% |
* ... smaller is better
Noise Level
| Idle |
| 28.6 / 28.6 / 28.6 dB(A) |
| Load |
| 40.8 / 49.6 dB(A) |
 | ||
30 dB silent 40 dB(A) audible 50 dB(A) loud |
||
min: | ||
Temperature
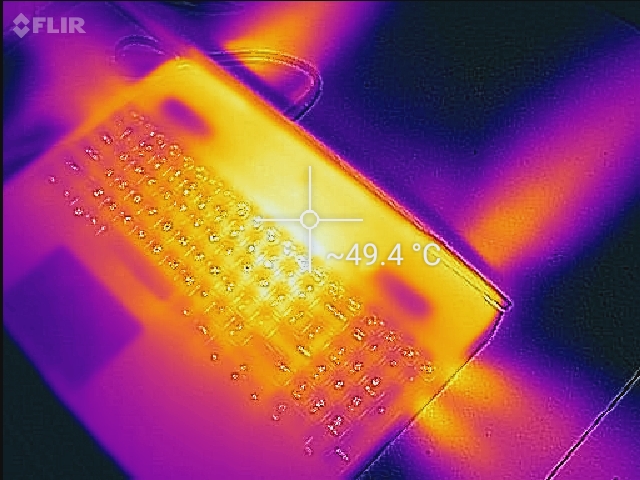
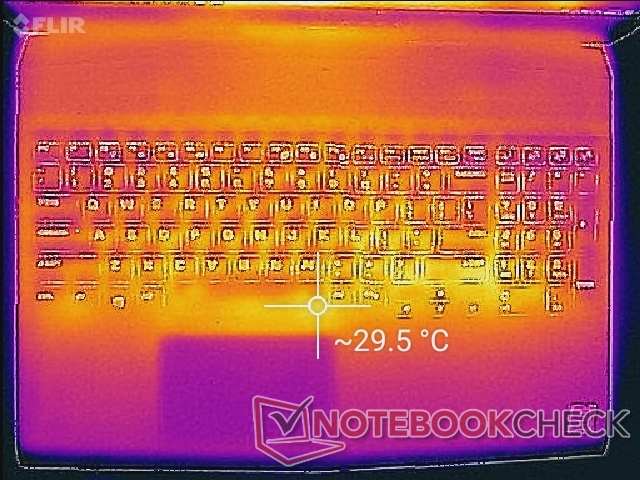
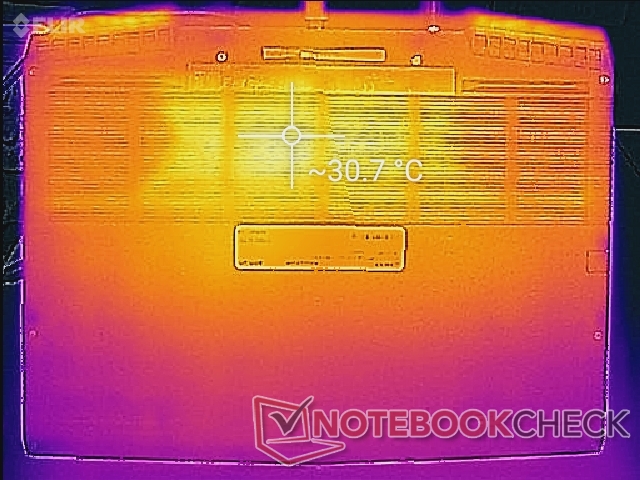
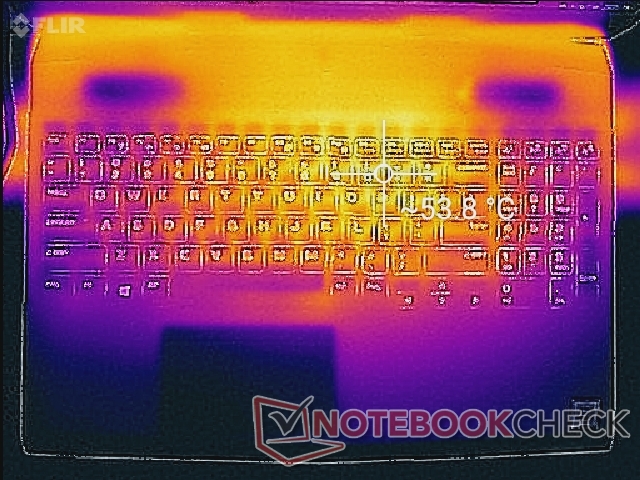
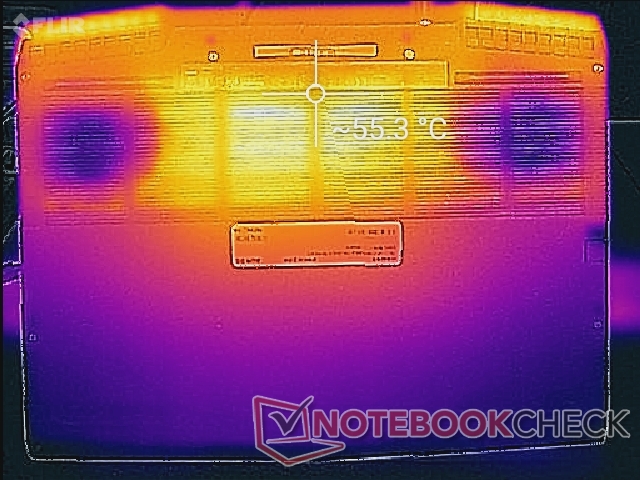
Surface temperatures when idling are already quite warm at almost 30 C average on both the top and bottom likely due to the idling fans. This isn't particularly surprising, however, as the MSI GS65 and Asus Zephyrus GX531 are similar.
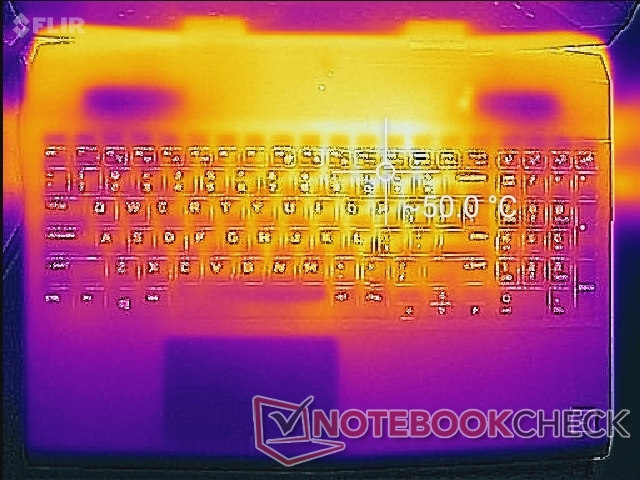
When under higher loads like gaming, the hot spot towards the "0" key can become as warm as 50 C not unlike on the Gigabyte Aero 15X. Fortunately, surfaces around the palm rests, trackpad, NumPad, and WASD keys remain relatively cool for comfortable hands and fingers when gaming. The rubberized surfaces prevents these areas from becoming too warm unlike on the Razer Blade 15 where the anodized magnesium palm rests can be as warm as 40 C.
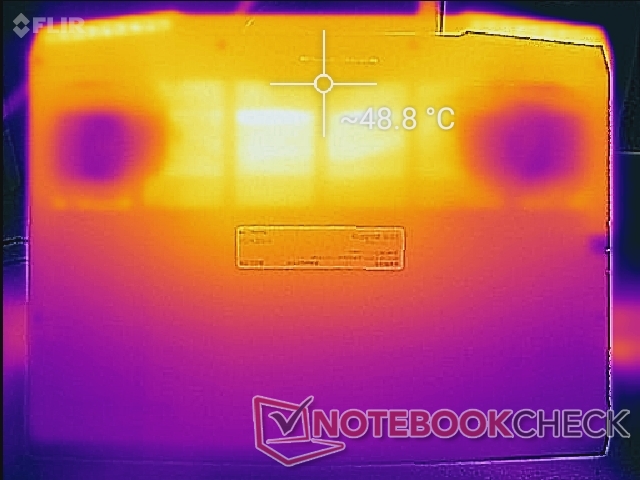
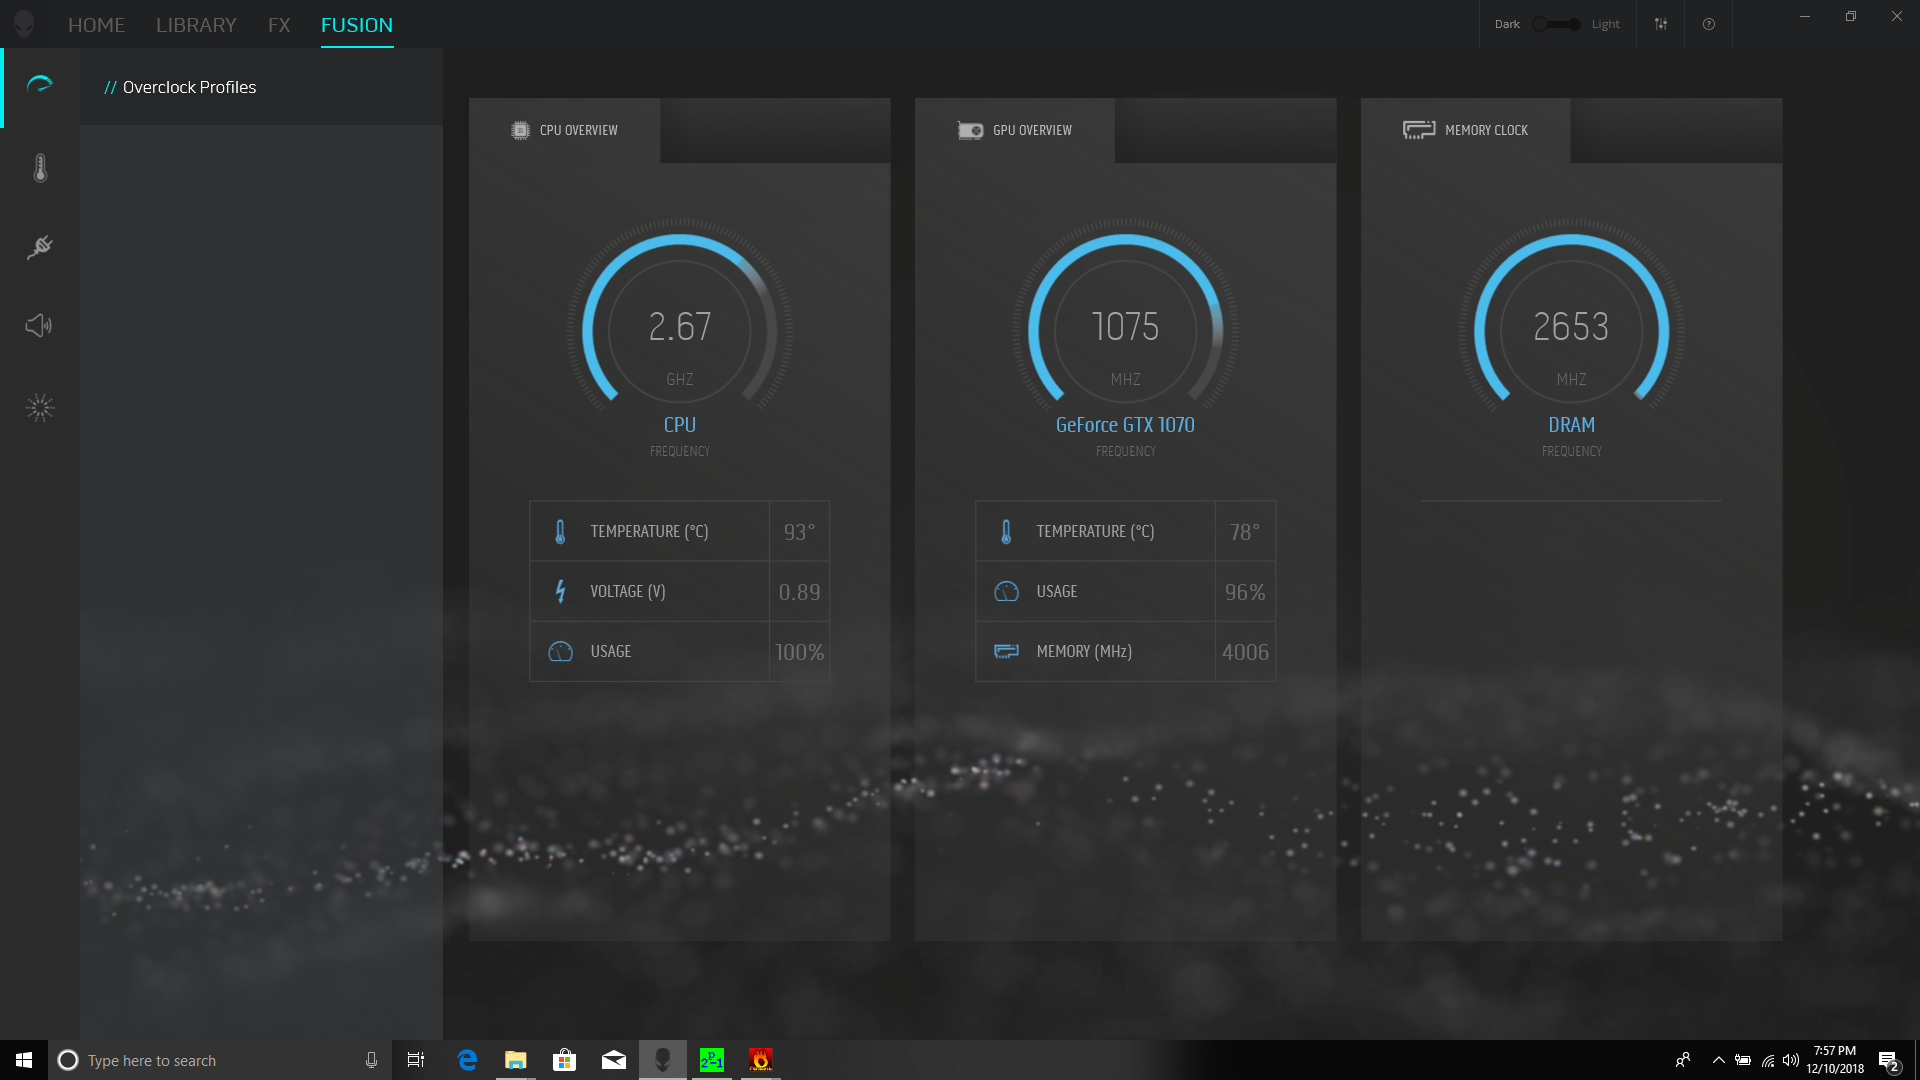
We stress the system with synthetic loads to identify for any potential throttling or stability issues. When subjected to Prime95 load, CPU clock rate remains steady at 3.5 to 3.6 GHz and at a respectable core temperature of 80 C. If running both Prime95 and FurMark simultaneously, CPU and GPU temperatures jump to 84 C and 74 C, respectively. Results here are cooler than on the Razer Blade 15 where CPU and GPU temperatures stabilize at 94 C and 84 C, respectively, when subjected to similar loads. CPU temperatures do indeed reach as high as 99 C during the start of our maximum stress test (Prime95+FurMark) in an attempt to squeeze out faster clock rates, but throttling eventually kicks in as shown by our graph below.
Running on battery power will impact CPU and GPU performance. A 3DMark 11 run on batteries returns Physics and Graphics scores of 9680 points and 6859 points, respectively, compared to 12273 points and 20573 points when on mains.
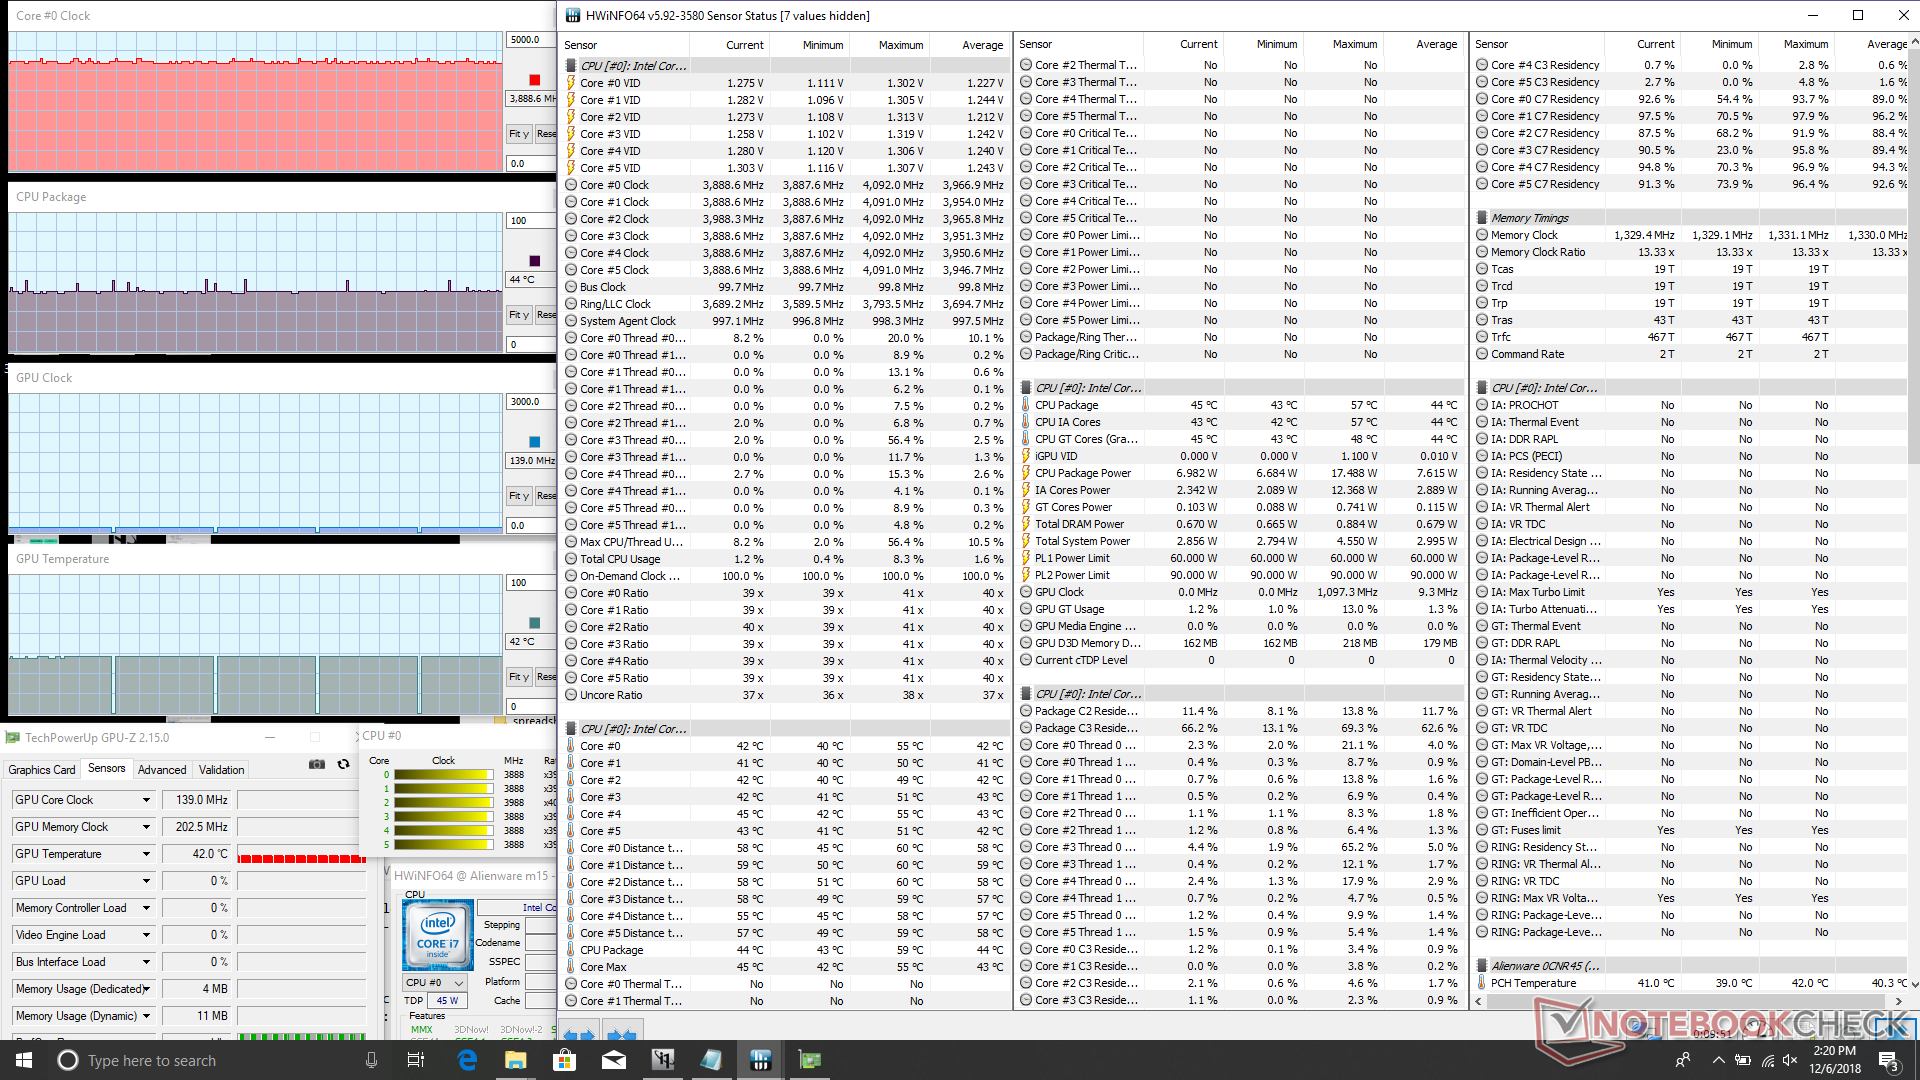
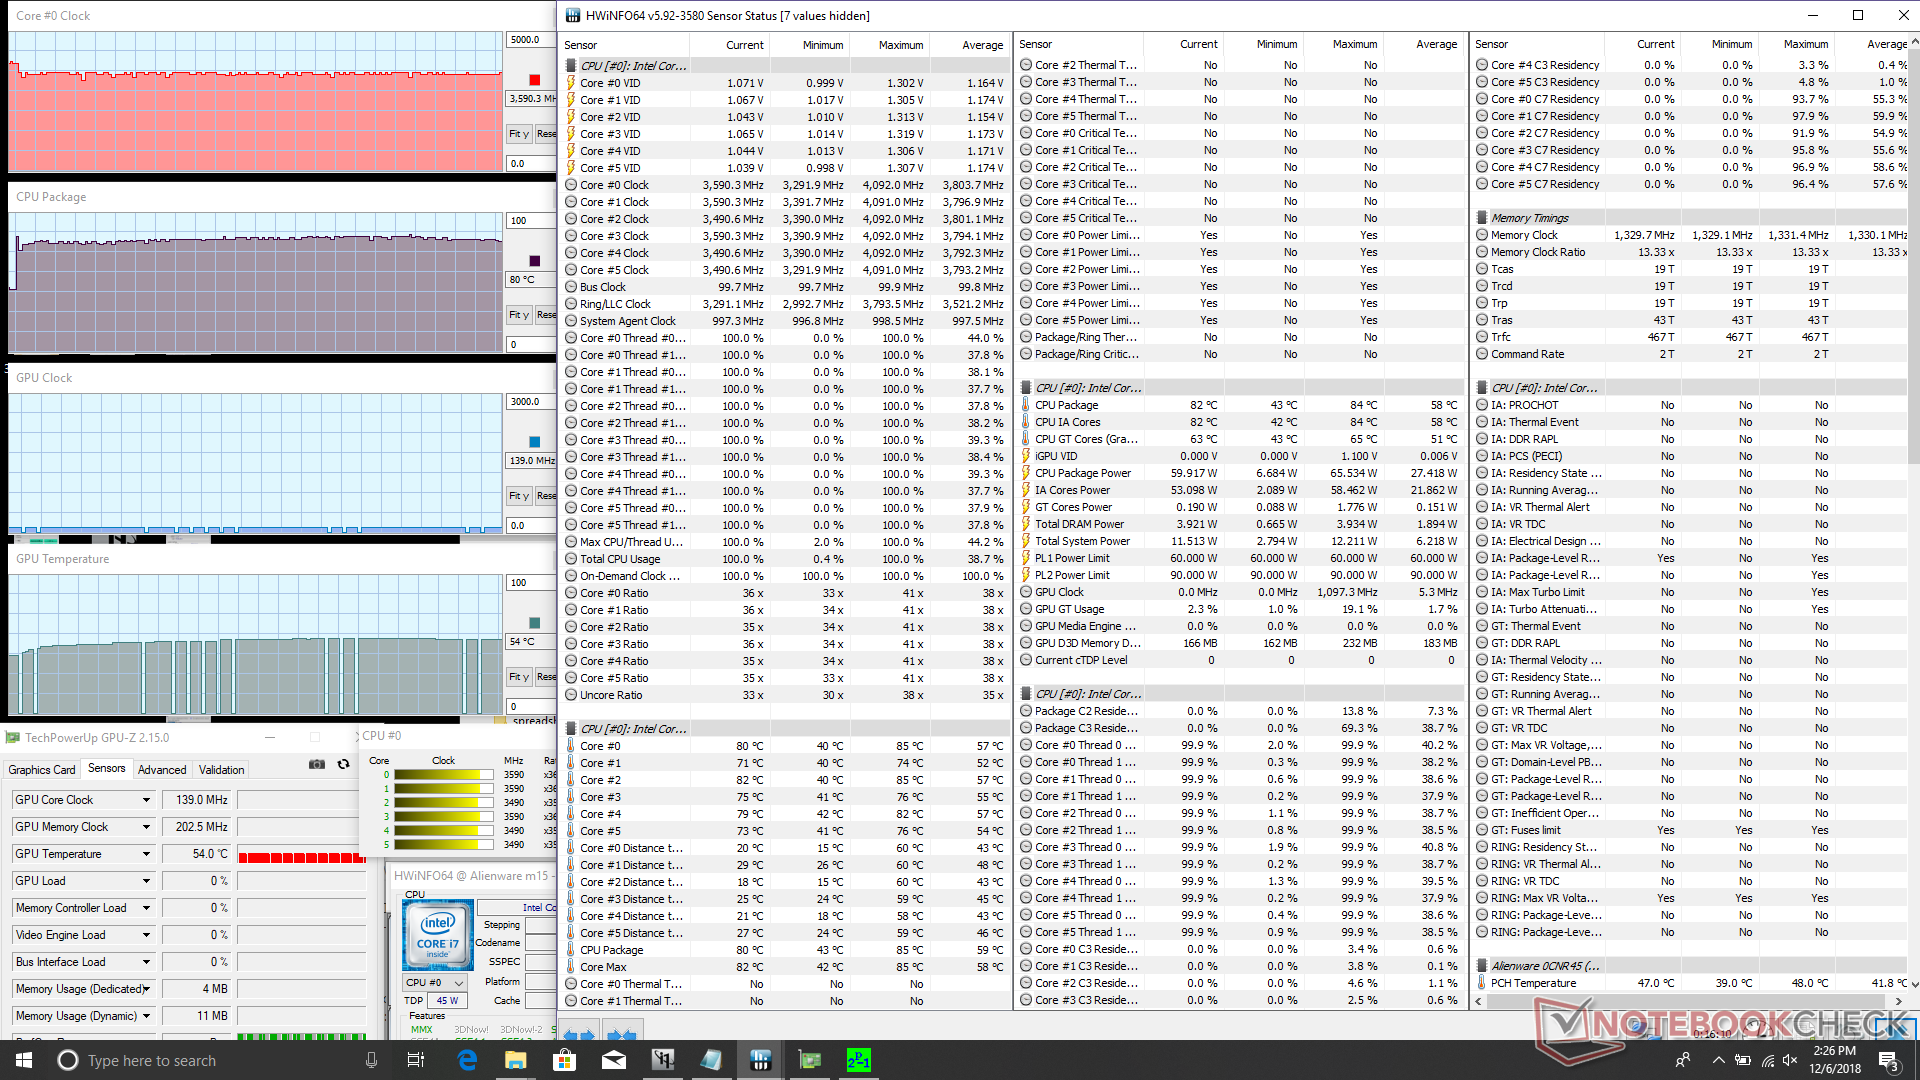
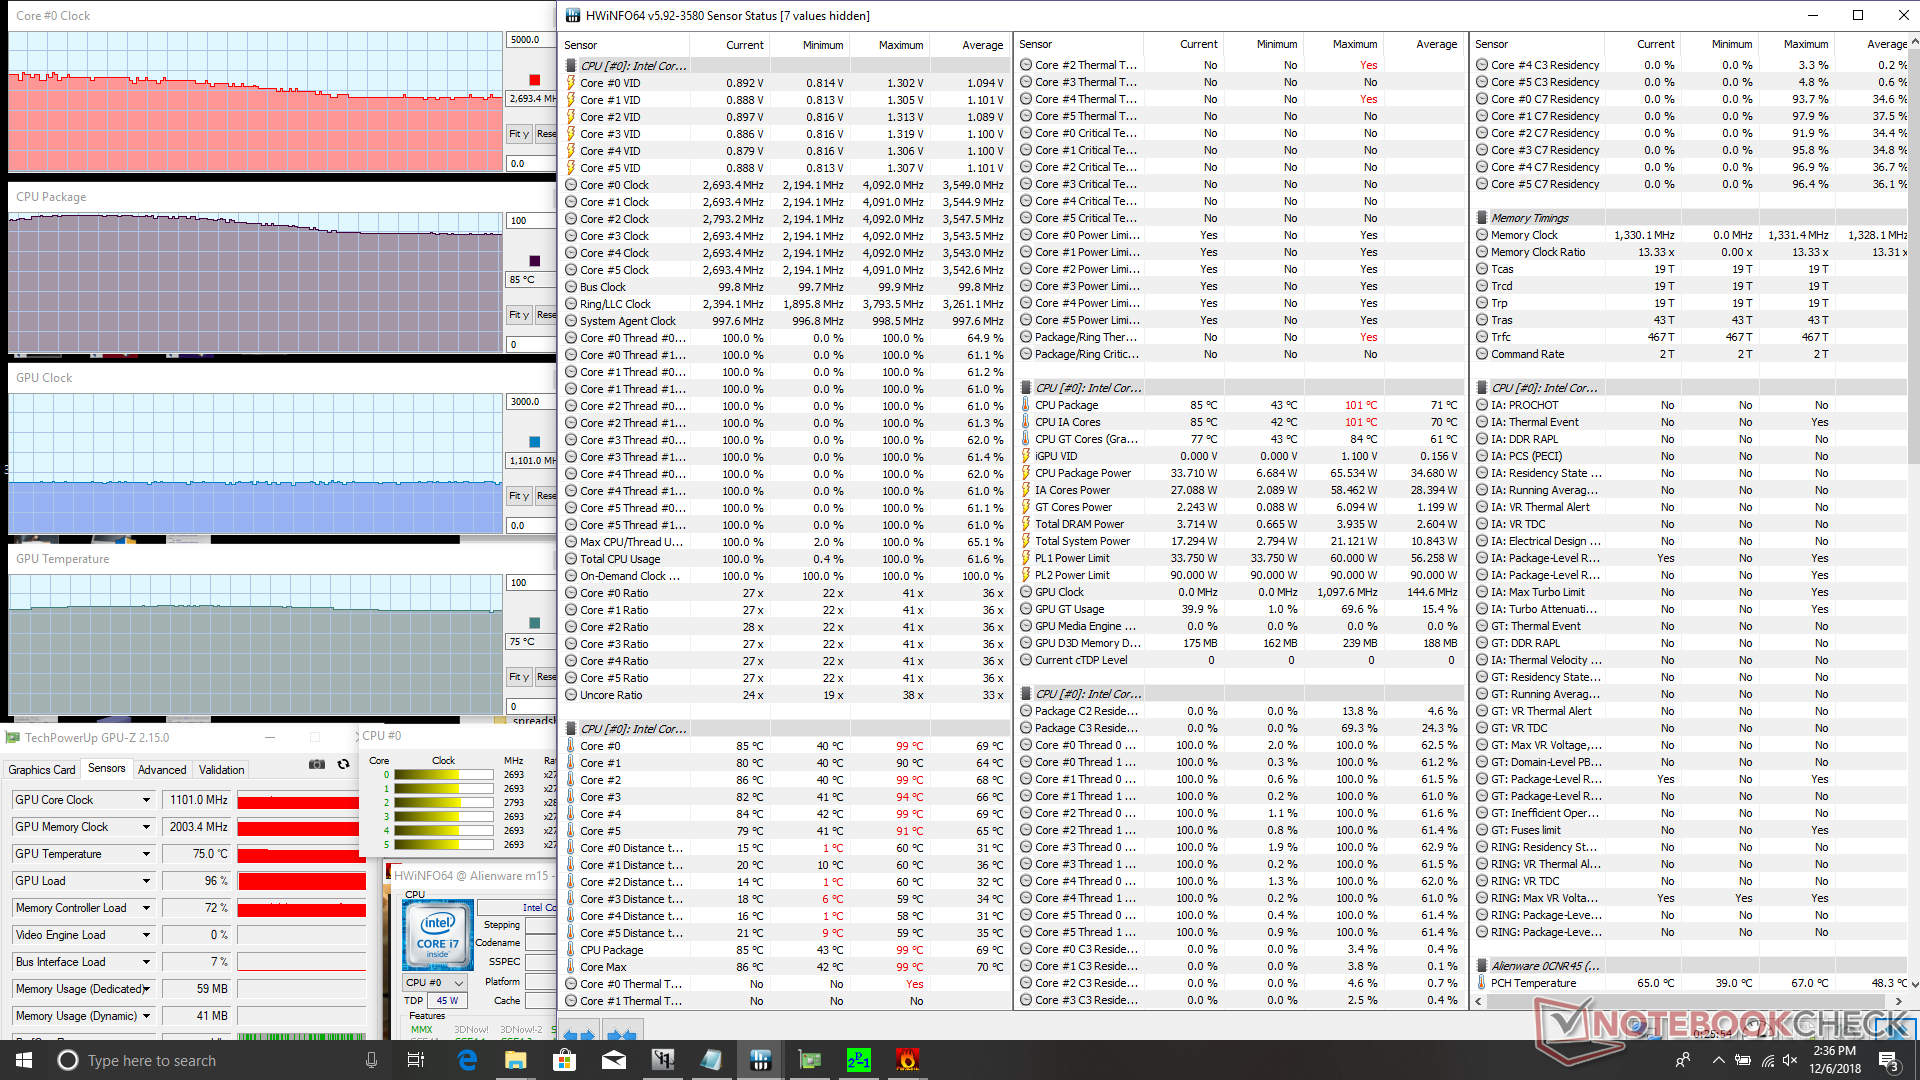
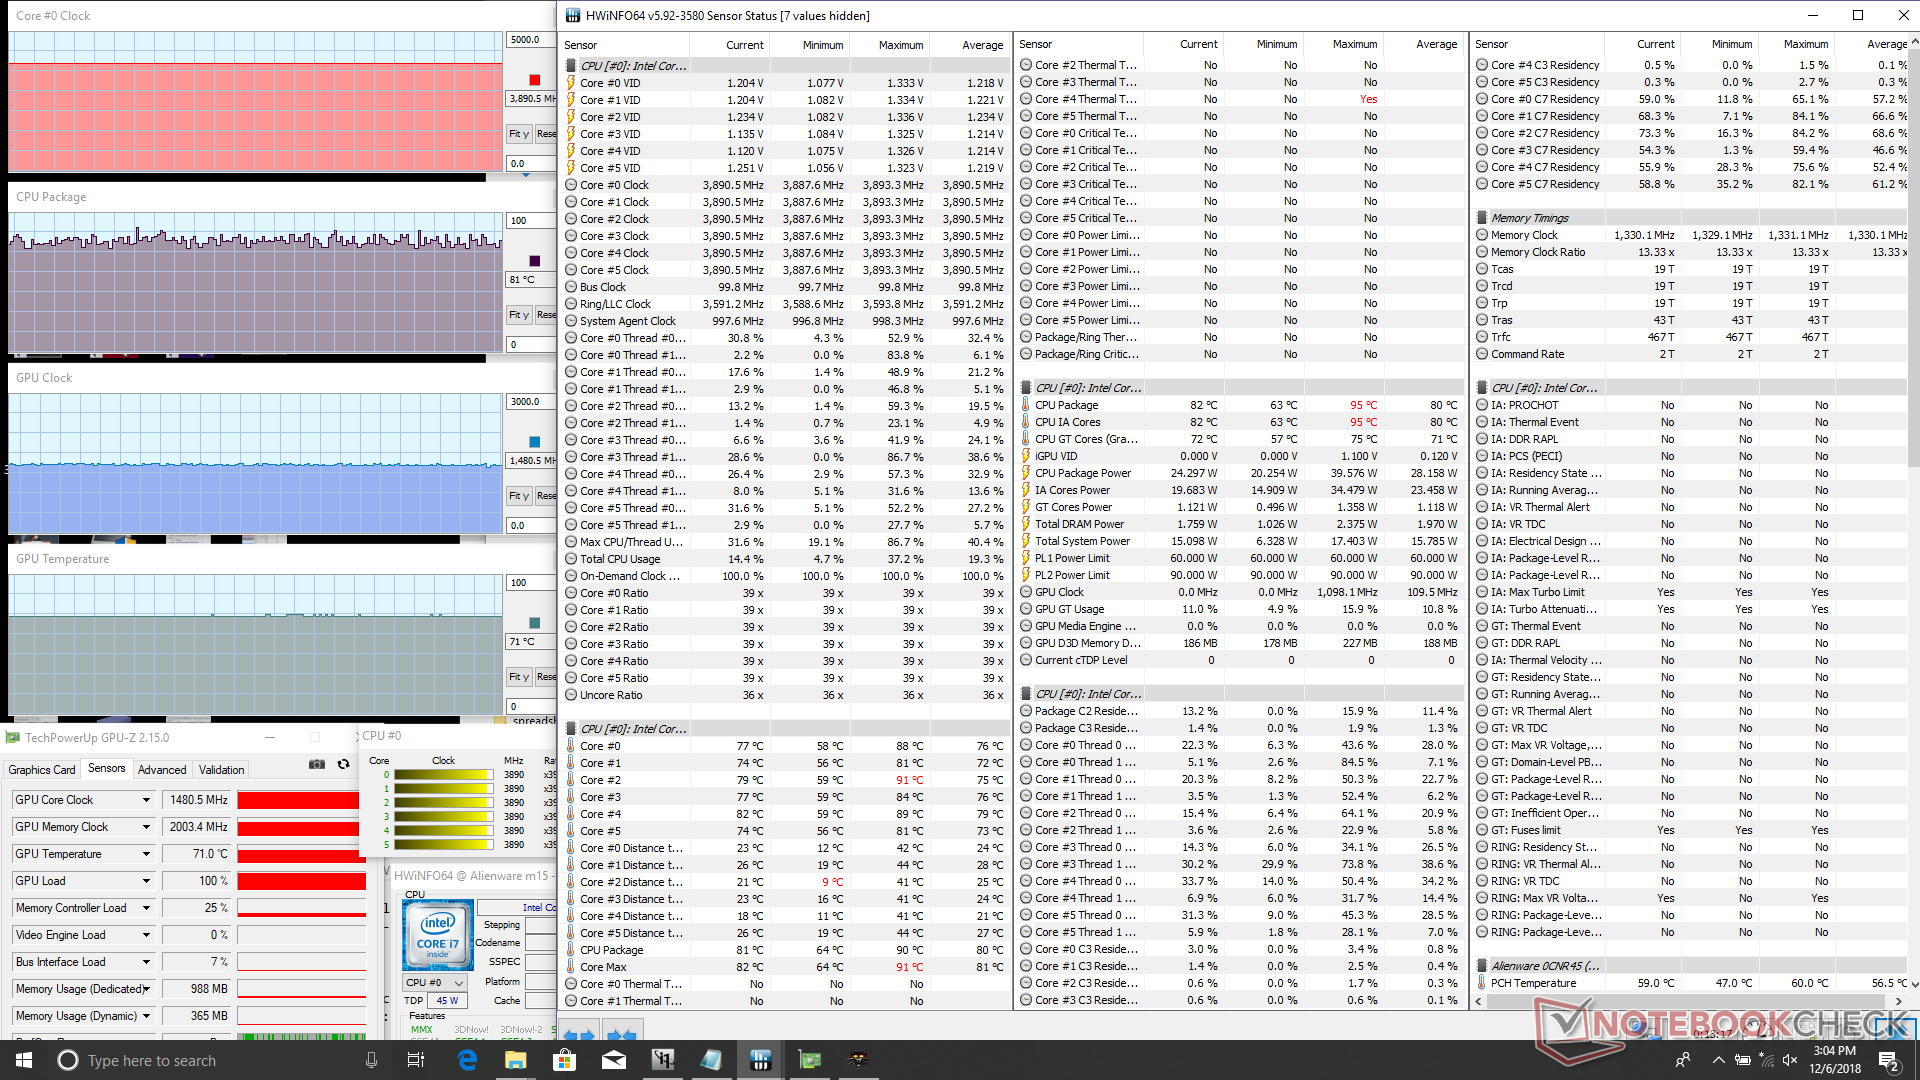
| CPU Clock (GHz) | GPU Clock (MHz) | Average CPU Temperature (°C) | Average GPU Temperature (°C) | |
| System Idle | -- | -- | 44 | 42 |
| Prime95 Stress | 3.6 | -- | 80 | 54 |
| Prime95 + FurMark Stress | 2.7 | 1101 | 84 | 74 |
| Witcher 3 Stress | 3.9 | 1481 | 81 | 71 |
(-) The maximum temperature on the upper side is 52 °C / 126 F, compared to the average of 40.4 °C / 105 F, ranging from 21.2 to 68.8 °C for the class Gaming.
(-) The bottom heats up to a maximum of 55.6 °C / 132 F, compared to the average of 43.2 °C / 110 F
(+) In idle usage, the average temperature for the upper side is 27.6 °C / 82 F, compared to the device average of 33.8 °C / 93 F.
(-) Playing The Witcher 3, the average temperature for the upper side is 38.5 °C / 101 F, compared to the device average of 33.8 °C / 93 F.
(+) The palmrests and touchpad are cooler than skin temperature with a maximum of 30.6 °C / 87.1 F and are therefore cool to the touch.
(±) The average temperature of the palmrest area of similar devices was 28.9 °C / 84 F (-1.7 °C / -3.1 F).
Speakers
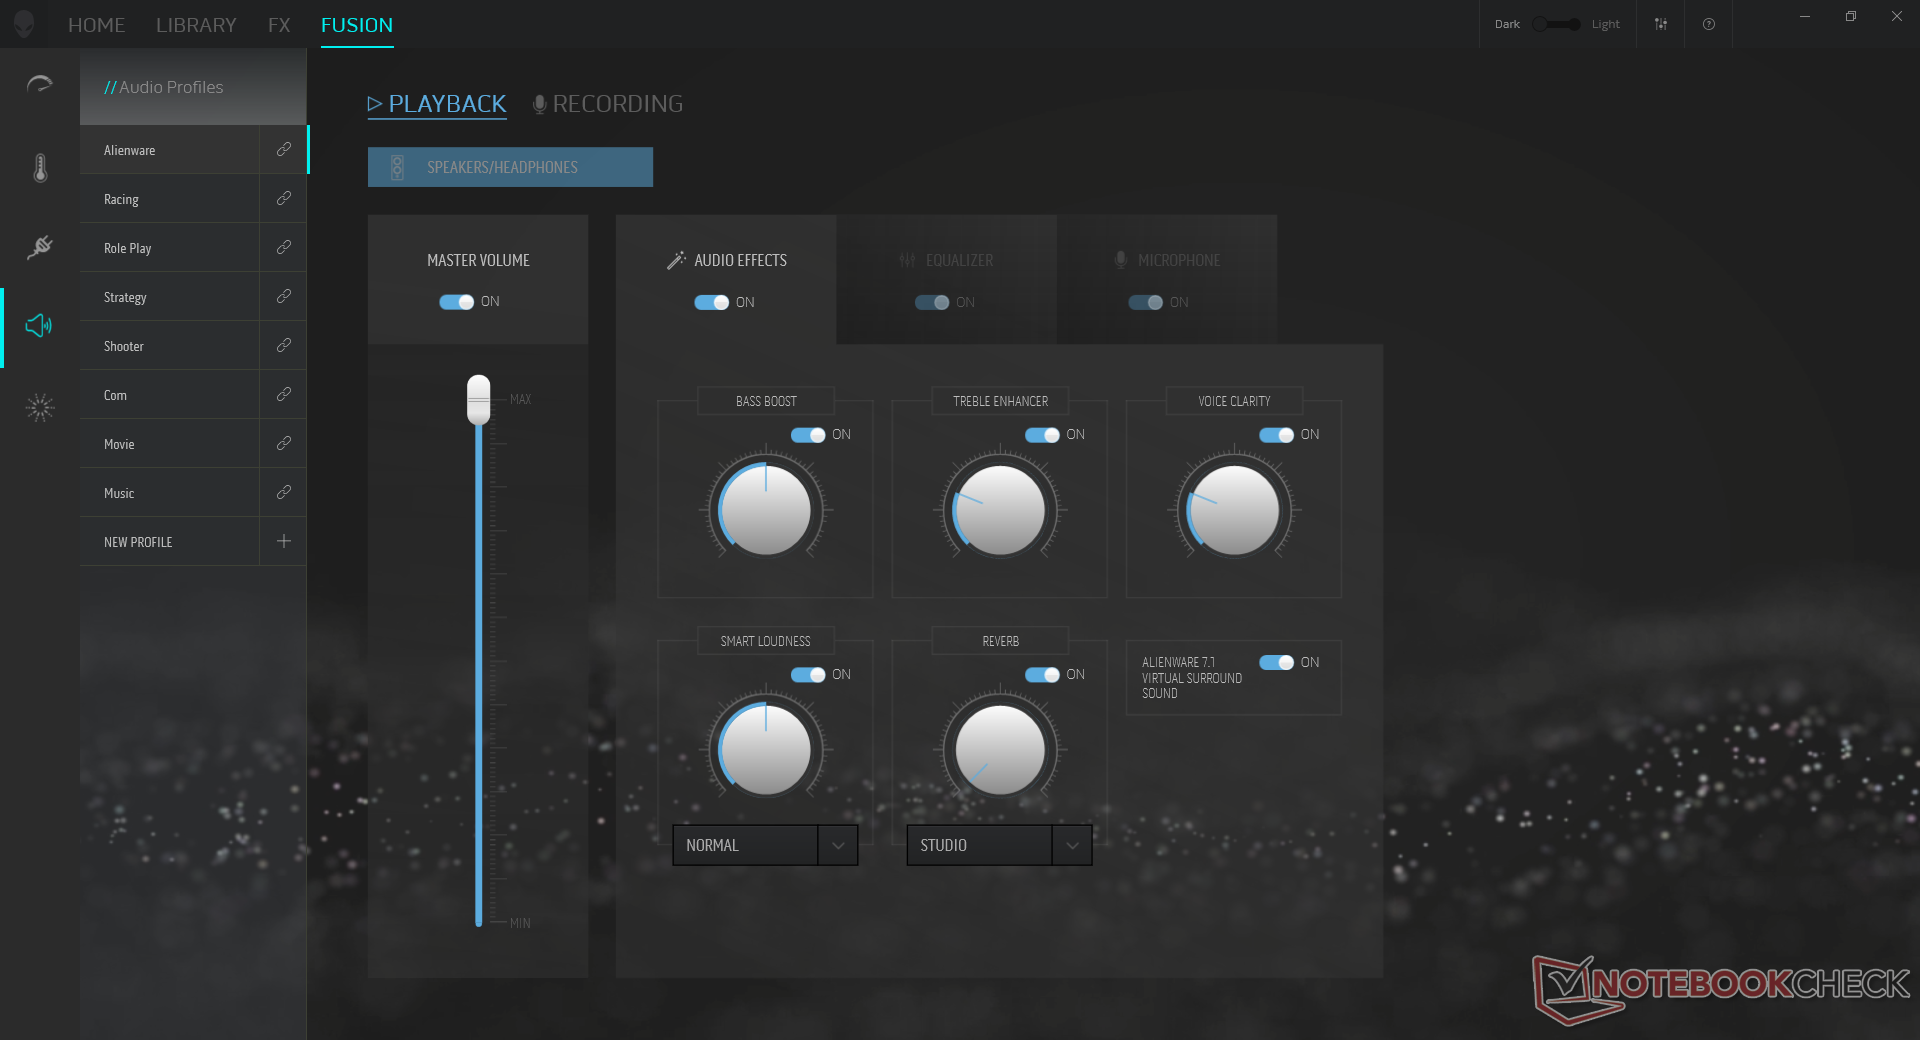
The stereo speakers lack bass and have a narrow range. While volume is loud, sounds feel weaker and not as rich as on the 15 R4 no matter how many audio settings we tune in the Control Center software. Maximum volume will not introduce any static or reverberations.


Alienware m15 GTX 1070 Max-Q audio analysis
(±) | speaker loudness is average but good (78.9 dB)
Bass 100 - 315 Hz
(-) | nearly no bass - on average 19.7% lower than median
(±) | linearity of bass is average (10.8% delta to prev. frequency)
Mids 400 - 2000 Hz
(±) | higher mids - on average 8.5% higher than median
(±) | linearity of mids is average (11.6% delta to prev. frequency)
Highs 2 - 16 kHz
(+) | balanced highs - only 2.5% away from median
(±) | linearity of highs is average (8.5% delta to prev. frequency)
Overall 100 - 16.000 Hz
(±) | linearity of overall sound is average (24.7% difference to median)
Compared to same class
» 87% of all tested devices in this class were better, 4% similar, 9% worse
» The best had a delta of 6%, average was 18%, worst was 132%
Compared to all devices tested
» 71% of all tested devices were better, 6% similar, 23% worse
» The best had a delta of 4%, average was 25%, worst was 134%
Apple MacBook 12 (Early 2016) 1.1 GHz audio analysis
(+) | speakers can play relatively loud (83.6 dB)
Bass 100 - 315 Hz
(±) | reduced bass - on average 11.3% lower than median
(±) | linearity of bass is average (14.2% delta to prev. frequency)
Mids 400 - 2000 Hz
(+) | balanced mids - only 2.4% away from median
(+) | mids are linear (5.5% delta to prev. frequency)
Highs 2 - 16 kHz
(+) | balanced highs - only 2% away from median
(+) | highs are linear (4.5% delta to prev. frequency)
Overall 100 - 16.000 Hz
(+) | overall sound is linear (10.2% difference to median)
Compared to same class
» 5% of all tested devices in this class were better, 2% similar, 93% worse
» The best had a delta of 5%, average was 19%, worst was 53%
Compared to all devices tested
» 3% of all tested devices were better, 1% similar, 96% worse
» The best had a delta of 4%, average was 25%, worst was 134%
Energy Management
Power Consumption
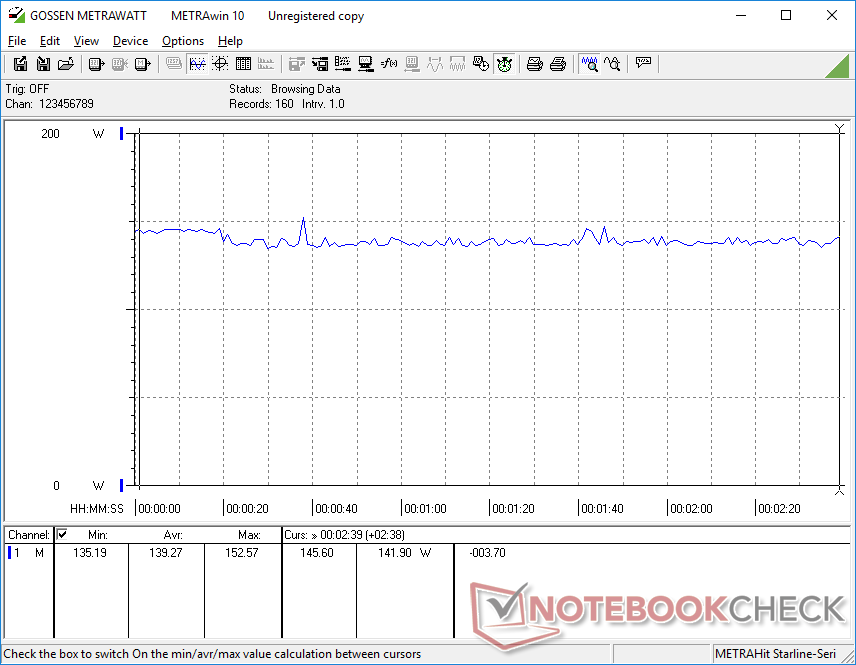
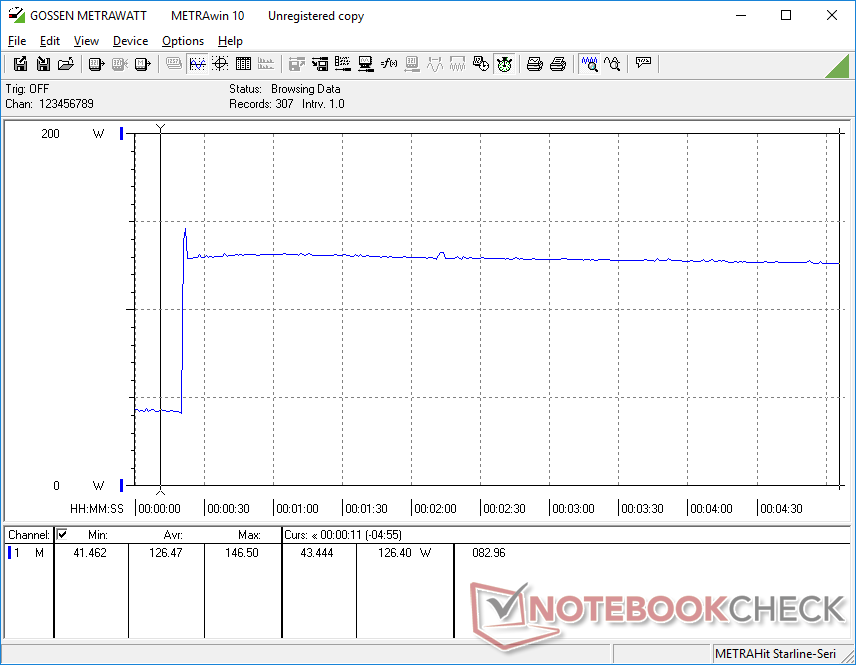
The system is astonishingly two times more power efficient than its larger Alienware 15 R3 and R4 siblings when idling on desktop likely due to its smaller size and lack of extraneous LED lights. When gaming, power consumption is only 9 percent less than the Alienware 15 R3 with GTX 1080 Max-Q graphics even though the GTX 1070 Max-Q is about 15 percent slower. More surprisingly, the Alienware 15 R4 with standard GTX 1070 graphics consumes 25 percent more power for only a 10 percent gain in GPU power over the GTX 1070 Max-Q. The higher performance-per-Watt of the Max-Q series is certainly well-represented here.
We are able to record a maximum consumption of 172.5 W from the medium-sized (15.5 x 7.5 x 3.0 cm) 180 W AC adapter.
| Off / Standby | |
| Idle | |
| Load |
|
| Alienware m15 GTX 1070 Max-Q i7-8750H, GeForce GTX 1070 Max-Q, Toshiba XG5 KXG50ZNV512G, IPS, 1920x1080, 15.60 | Razer Blade 15 2018 i7-8750H, GeForce GTX 1070 Max-Q, Samsung PM961 NVMe MZVLW512HMJP, IPS, 1920x1080, 15.60 | Alienware 15 R4 i9-8950HK, GeForce GTX 1070 Mobile, Toshiba XG5 KXG50ZNV256G, IPS, 1920x1080, 15.60 | MSI GS65 Stealth Thin 8RE-051US i7-8750H, GeForce GTX 1060 Mobile, Samsung SSD PM981 MZVLB256HAHQ, IPS, 1920x1080, 15.60 | Asus Zephyrus S GX531GS i7-8750H, GeForce GTX 1070 Max-Q, WDC PC SN520 SDAPNUW-512G, IPS, 1920x1080, 15.60 | Alienware 15 R3 Max-Q i7-7820HK, GeForce GTX 1080 Max-Q, LiteOn CX2-8B256, IPS, 1920x1080, 15.60 | |
|---|---|---|---|---|---|---|
| Power Consumption | -25% | -77% | 1% | -52% | -71% | |
| Idle Minimum * | 7.6 | 14 -84% | 23 -203% | 8.7 -14% | 17 -124% | 22 -189% |
| Idle Average * | 13.8 | 17 -23% | 26 -88% | 13 6% | 20 -45% | 26 -88% |
| Idle Maximum * | 14.6 | 21 -44% | 30 -105% | 14.3 2% | 29 -99% | 33 -126% |
| Load Average * | 97.6 | 95 3% | 111 -14% | 107.4 -10% | 112 -15% | 86 12% |
| Witcher 3 ultra * | 145.8 | 141 3% | 182 -25% | 129 12% | 152 -4% | 159 -9% |
| Load Maximum * | 172.5 | 179 -4% | 222 -29% | 151.5 12% | 211 -22% | 215 -25% |
* ... smaller is better
Battery Life
Battery capacity can be either 60 W or 90 W depending on the choice of storage. Either way, capacity is smaller than the 99 Wh battery on the larger Alienware 15 series.
Runtimes are impressive especially for a gaming laptop. Expect almost 8 hours of real-world WLAN use to be a few hours longer than both the Razer Blade 15 and larger Alienware 15 R4. The new Asus Zephyrus GX531 falls short mostly due to its smaller 50 Wh battery. Though we have yet to test the 60 Wh Alienware m15 SKU, it's safe to approximate a runtime of about two-thirds of what we've recorded below.
Charging from empty to full capacity takes between 1.5 to 2 hours.
| Alienware m15 GTX 1070 Max-Q i7-8750H, GeForce GTX 1070 Max-Q, 90 Wh | Razer Blade 15 2018 i7-8750H, GeForce GTX 1070 Max-Q, 80 Wh | Alienware 15 R4 i9-8950HK, GeForce GTX 1070 Mobile, 99 Wh | MSI GS65 Stealth Thin 8RE-051US i7-8750H, GeForce GTX 1060 Mobile, 82 Wh | Asus Zephyrus S GX531GS i7-8750H, GeForce GTX 1070 Max-Q, 50 Wh | Gigabyte Aero 15X v8 i7-8750H, GeForce GTX 1070 Max-Q, 94.24 Wh | |
|---|---|---|---|---|---|---|
| Battery Runtime | -33% | -40% | -26% | -64% | 28% | |
| Reader / Idle | 627 | 382 -39% | 370 -41% | 213 -66% | 762 22% | |
| WiFi v1.3 | 463 | 322 -30% | 304 -34% | 372 -20% | 157 -66% | 513 11% |
| Load | 103 | 72 -30% | 58 -44% | 70 -32% | 42 -59% | 156 51% |
Verdict
Pros
Cons
Alienware laptops are traditionally known for being bigger, sturdier, and more colorful than competing gaming laptops. The Alienware m15 was likely a very challenging design prospect in this regard as it must balance all the aforementioned factors while looking as thin and small as something like a Razer Blade 15 or MSI GS65. It's true that the new chassis is slightly weaker than the mainline Alienware 15 R4 with small cuts to port selection, RGB lighting, hinge rigidity, storage bays, and battery capacity, but the significantly lighter package may be well worth the trade-offs to many users. In fact, it even offers a few features not found on its larger alternative including longer battery life and a dedicated NumPad.
Comparing the Alienware m15 to the GS65, Blade 15, Aero 15x, Zephyrus GX531, or Predator Triton 700 would be a fairer test. The system is thicker and heavier than many of these ultrathin alternatives, but it is also built tougher than most with the added benefit of longer runtimes and more internal storage options. The best surprise is perhaps its excellent CPU Turbo Boost sustainability for faster CPU performance than other ultrathins equipped with the same i7-8750H processor including the Blade 15.
There are a number of drawbacks preventing the m15 from being the top dog in its ultrathin category. Aside from its slightly thicker profile, the lack of per-key RGB lighting is a disadvantage. Key feedback, clickpad feedback, fan noise, and speaker quality are all nothing special and merely average for its size class. Cosmetically, some users may be turned off by the glossy bezels, fingerprint-prone palm rests, or difficult-to-reach rear ports. Nonetheless, anyone on the fence for an Alienware 15 R4 or ultrathin gaming laptop should give the Alienware m15 a look as it offers a handful of advantages not found on competing models.
The Alienware m15 works as a solid middle-ground for gamers who want super-thin designs without sacrificing the rigidity of larger alternatives. Its high Turbo Boost sustainability and long battery life are unexpected advantages over the competition considering its small chassis size.
Alienware m15 GTX 1070 Max-Q
-
12/11/2018 v6(old)
Allen Ngo
More articles related to this device
Alienware m15 GTX 1070 Max-Q (m15 Series)Related Articles

Pricecompare
