Notebookcheck Logo

Qualcomm Adreno 642 vs Qualcomm Adreno 612 vs Qualcomm Adreno 685

Qualcomm Adreno 642

► remove from comparison Qualcomm Adreno 642

The Qualcomm Adreno 642 is a smartphone and tablet GPU that is integrated within the Qualcomm Snapdragon 780G SoC. The chip will be available from mid 2021 and will be used mainly in upper mid-range Android devices.

According to Qualcomm, the Adreno 642 GPU offers a 50% improved performance over the Adreno 620, its predecessor, which is integrated in the Snapdragon 768G SoC. This is also thanks to the fast LPDDR4X-4200 memory support of the SoC.

The Adreno 642 supports OpenCL 2.0 FP, OpenGL ES 3.2 and Vulkan 1.1.

The Snapdragon 780G is manufactured in the modern 5nm LPPE process with EUV at Samsung that should provide a good power efficiency.

Qualcomm Adreno 612

► remove from comparison

The Qualcomm Adreno 612 is a mobile graphics card for mid-range smartphones and tablets (mostly Android based). It is included in the Qualcomm Snapdragon 675 SoCs and based on the Adreno 600 architecture (like the Adreno 630, which should be fully compatible in software).

The performance is similar to the old Adreno 512 graphics card and therefore only in the lower mid-range of modern smartphone SoCs.

The GPU supports modern standards like Vulkan 1.0 (according to Wikipedia), OpenGL ES 3.2, OpenCL 2.0 and DirectX 11 (FL 11_1).

Qualcomm Adreno 685

► remove from comparison Qualcomm Adreno 685

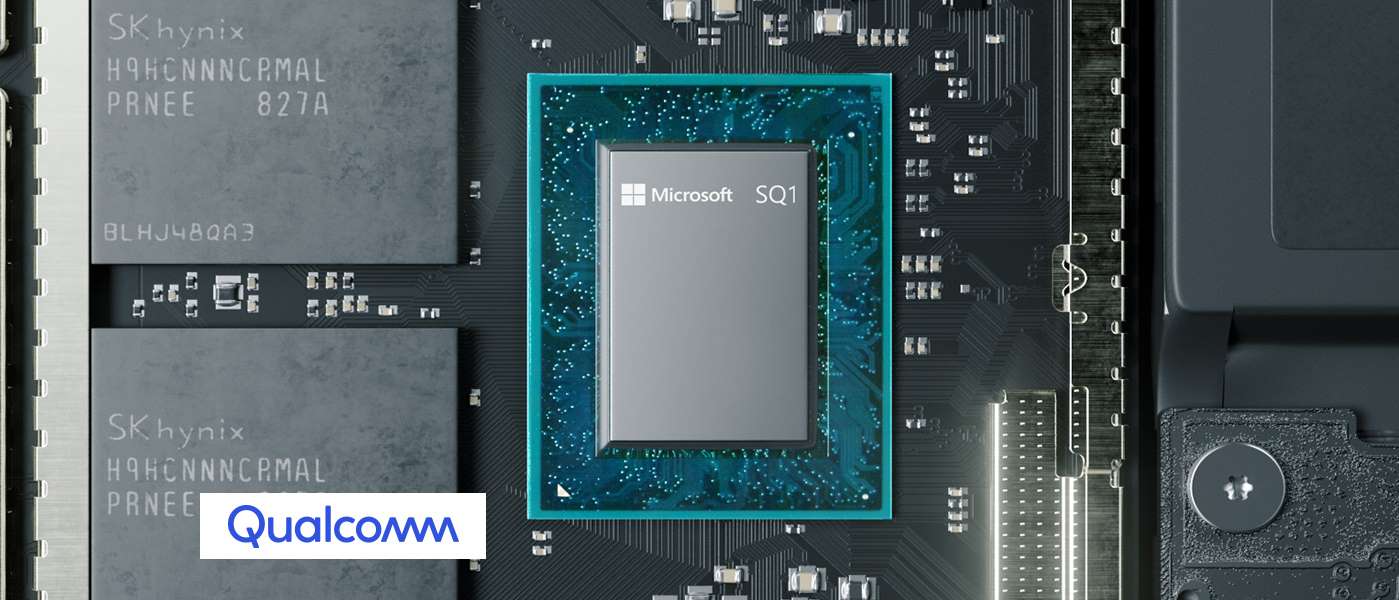
The Qualcomm Adreno 685 is an integrated graphics card in the Microsoft SQ1 ARM-based SoC. It is similar to the Adreno 680 in the Qualcomm Snapdragon 8cx SoC for Windows laptops but higher clocked and therefore with a higher theoretical performance (2 versus 1.8 TFlops).

Qualcomm Adreno 642Qualcomm Adreno 612Qualcomm Adreno 685
Adreno 600 Series
Adreno 660
Adreno 650 @ 0.25 - 0.67 GHz
Adreno 690
Adreno 685
Adreno 680
Adreno 644
Adreno 643 @ 0.81 GHz
Adreno 642
Adreno 642L
Adreno 640
Adreno 630
Adreno 620
Adreno 619
Adreno 619L
Adreno 618
Adreno 616
Adreno 612
Adreno 610
Adreno 660
Adreno 650 @ 0.25 - 0.67 GHz
Adreno 690
Adreno 685
Adreno 680
Adreno 644
Adreno 643 @ 0.81 GHz
Adreno 642
Adreno 642L
Adreno 640
Adreno 630
Adreno 620
Adreno 619
Adreno 619L
Adreno 618
Adreno 616
Adreno 612
Adreno 610
Adreno 660
Adreno 650 @ 0.25 - 0.67 GHz
Adreno 690
Adreno 685
Adreno 680
Adreno 644
Adreno 643 @ 0.81 GHz
Adreno 642
Adreno 642L
Adreno 640
Adreno 630
Adreno 620
Adreno 619
Adreno 619L
Adreno 618
Adreno 616
Adreno 612
Adreno 610
Shared Memoryyesyesyes
APIOpenGL ES 3.2DirectX 12.1, OpenGL ES 3.2, VulkanDirectX 12
technology5 nm14 nm7 nm
FeaturesOpenGL ES 3.2, OpenCL 2.0, DirectX 12, Vulkan 1.1OpenGL ES 3.2, OpenCL 2.0, Direct3D 12 (FL 12_1)
Date of Announcement07.05.2021 15.12.2015 06.12.2018
ArchitectureAdreno 600
Power Consumption7 Watt
CPU in Adreno 642GPU Base SpeedGPU Boost / Turbo
Qualcomm Snapdragon 780G 5G8 x 1900 MHz? MHz? MHz
CPU in Adreno 612GPU Base SpeedGPU Boost / Turbo
Qualcomm Snapdragon 6788 x 1700 MHz? MHz? MHz
Qualcomm Snapdragon 6758 x 1600 MHz? MHz? MHz
min. - max.? MHz? MHz
CPU in Adreno 685GPU Base SpeedGPU Boost / Turbo
Microsoft SQ18 x 3000 MHz? MHz? MHz

Benchmarks

3DMark - 3DMark Ice Storm Unlimited Graphics
min: 26320     avg: 28142     median: 26734 (3%)     max: 31129 Points
3DMark - 3DMark Sling Shot (ES 3.0) Unlimited
5587 Points (24%)
min: 1621     avg: 1897     median: 1737 (8%)     max: 2344 Points
3DMark - 3DMark Sling Shot (ES 3.0) Unlimited Graphics
8380 Points (18%)
min: 1571     avg: 1784     median: 1614 (4%)     max: 2245 Points
3DMark - 3DMark Sling Shot Extreme (ES 3.1) Unlimited
4478 Points (22%)
min: 1057     avg: 1207     median: 1110 (6%)     max: 1499 Points
3DMark - 3DMark Sling Shot Extreme (ES 3.1) Unlimited Graphics
6148 Points (18%)
min: 851     avg: 1030     median: 955 (3%)     max: 1303 Points
3DMark - 3DMark Wild Life Unlimited
3212 Points (2%)
482 Points (0%)
3DMark - 3DMark Wild Life Extreme Unlimited
786 Points (1%)
143 Points (0%)
3DMark 11 - 3DM11 Performance Score
1968 Points (3%)
3DMark 11 - 3DM11 Performance GPU
1927 Points (2%)
Cinebench R10 Cinebench R10 Shading (32bit) + Qualcomm Adreno 685
Cinebench R10 - Cinebench R10 Shading (32bit)
373 Points (0%)
GFXBench - GFXBench 5.0 Aztec Ruins High Tier Offscreen
18 fps (3%)
min: 3     avg: 3.6     median: 3.3 (1%)     max: 4.8 fps
GFXBench - GFXBench 5.0 Aztec Ruins Normal Tier Offscreen
50 fps (4%)
min: 9     avg: 9.4     median: 9.1 (1%)     max: 10 fps
GFXBench - GFXBench Car Chase Offscreen
40 fps (5%)
min: 8     avg: 8.5     median: 8.2 (1%)     max: 9.2 fps
GFXBench 3.1 - GFXBench Manhattan ES 3.1 Offscreen
65 fps (1%)
min: 14     avg: 15.7     median: 15 (0%)     max: 18 fps
GFXBench 3.0 - GFXBench 3.0 Manhattan Offscreen
90 fps (5%)
min: 20     avg: 22     median: 21 (1%)     max: 25 fps
31.7 fps (2%)
GFXBench (DX / GLBenchmark) 2.7
GFXBench T-Rex HD Offscreen C24Z16 + Qualcomm Adreno 642
GFXBench (DX / GLBenchmark) 2.7 - GFXBench T-Rex HD Offscreen C24Z16
153 fps (1%)
GFXBench T-Rex HD Offscreen C24Z16 + Qualcomm Adreno 612
min: 41     avg: 43     median: 41 (0%)     max: 47 fps
GFXBench T-Rex HD Offscreen C24Z16 + Qualcomm Adreno 685
167.7 fps (1%)
Antutu v9 - AnTuTu v9 GPU
162946 Points (20%)
43224 Points (5%)
Basemark GPU 1.2 - Basemark GPU 1.2 Vulkan Official Medium Offscreen 1080
48 fps (0%)
14.3 fps (0%)
ComputeMark v2.1 - ComputeMark v2.1 Result
2292 Points (2%)
PassMark PerformanceTest Mobile V1 - PerformanceTest Mobile V1 2D Graphics Tests
min: 9815     avg: 16853     median: 16853 (17%)     max: 23891 Points
PassMark PerformanceTest Mobile V1 - PerformanceTest Mobile V1 3D Graphics Tests
min: 1491     avg: 8575     median: 8575 (15%)     max: 15659 Points

Average Benchmarks Qualcomm Adreno 642 → 100% n=2

Average Benchmarks Qualcomm Adreno 612 → 25% n=2

Average Benchmarks Qualcomm Adreno 685 → 72% n=2

- Range of benchmark values for this graphics card
- Average benchmark values for this graphics card
* Smaller numbers mean a higher performance
1 This benchmark is not used for the average calculation

Game Benchmarks

The following benchmarks stem from our benchmarks of review laptops. The performance depends on the used graphics memory, clock rate, processor, system settings, drivers, and operating systems. So the results don't have to be representative for all laptops with this GPU. For detailed information on the benchmark results, click on the fps number.

Armajet

Armajet

2020
high
100%
Adreno 642:
30  fps
100%
Adreno 612:
30  fps
PUBG Mobile

PUBG Mobile

2018
low
100%
Adreno 642:
60  fps
67%
Adreno 612:
40  fps
med.
100%
Adreno 642:
59  fps
high
100%
Adreno 642:
60  fps
50%
Adreno 612:
30  fps
ultra
100%
Adreno 642:
40  fps
Shadow Fight 3

Shadow Fight 3

2018
high
Adreno 612:
60  fps
Dead Trigger 2

Dead Trigger 2

2013
high
Adreno 612:
60  fps
Asphalt 9: Legends

Asphalt 9: Legends

2013
low
100%
Adreno 642:
60  fps
42%
Adreno 612:
20 30 ~ 25 fps
high
100%
Adreno 642:
60  fps
38%
Adreno 612:
16 30 ~ 23 fps

Average Gaming Qualcomm Adreno 642 → 100%

Average Gaming 30-70 fps → 100%

Average Gaming Qualcomm Adreno 612 → 59%

Average Gaming 30-70 fps → 67%

Qualcomm Adreno 642lowmed.highultraQHD4K
Armajet30
PUBG Mobile60596040
Asphalt 9: Legends6060
< 30 fps
< 60 fps
< 120 fps
≥ 120 fps


2

1


1
2

1


Qualcomm Adreno 612lowmed.highultraQHD4K
Armajet30
PUBG Mobile4030
Shadow Fight 360
Dead Trigger 260
Asphalt 9: Legends2523
< 30 fps
< 60 fps
< 120 fps
≥ 120 fps
1
1


1
2
2


For more games that might be playable and a list of all games and graphics cards visit our Gaming List

v1.26
log 19. 09:23:32

#0 checking url part for id 10693 +0s ... 0s

#1 checking url part for id 9876 +0s ... 0s

#2 checking url part for id 9954 +0s ... 0s

#3 not redirecting to Ajax server +0s ... 0s

#4 did not recreate cache, as it is less than 5 days old! Created at Fri, 19 Apr 2024 05:40:26 +0200 +0.001s ... 0.001s

#5 composed specs +0.191s ... 0.192s

#6 did output specs +0s ... 0.192s

#7 start showIntegratedCPUs +0s ... 0.192s

#8 getting avg benchmarks for device 10693 +0.051s ... 0.243s

#9 got single benchmarks 10693 +0.008s ... 0.251s

#10 getting avg benchmarks for device 9876 +0.002s ... 0.253s

#11 got single benchmarks 9876 +0.024s ... 0.277s

#12 getting avg benchmarks for device 9954 +0.002s ... 0.279s

#13 got single benchmarks 9954 +0.008s ... 0.287s

#14 got avg benchmarks for devices +0s ... 0.287s

#15 min, max, avg, median took s +0.132s ... 0.419s

#16 before gaming benchmark output +0s ... 0.419s

#17 Got 16 rows for game benchmarks. +0.006s ... 0.425s

#18 composed SQL query for gamebenchmarks +0s ... 0.425s

#19 got data and put it in $dataArray +0.003s ... 0.428s

#20 benchmarks composed for output. +0.012s ... 0.44s

#21 calculated avg scores. +0s ... 0.44s

#22 return log +0.002s ... 0.442s

Please share our article, every link counts!
> Expert Reviews and News on Laptops, Smartphones and Tech Innovations > Benchmarks / Tech > Graphics Card Comparison - Head 2 Head
Redaktion, 2017-09- 8 (Update: 2023-07- 1)