Qualcomm Adreno 640 vs Qualcomm Adreno 620
Qualcomm Adreno 640 ► remove from comparison
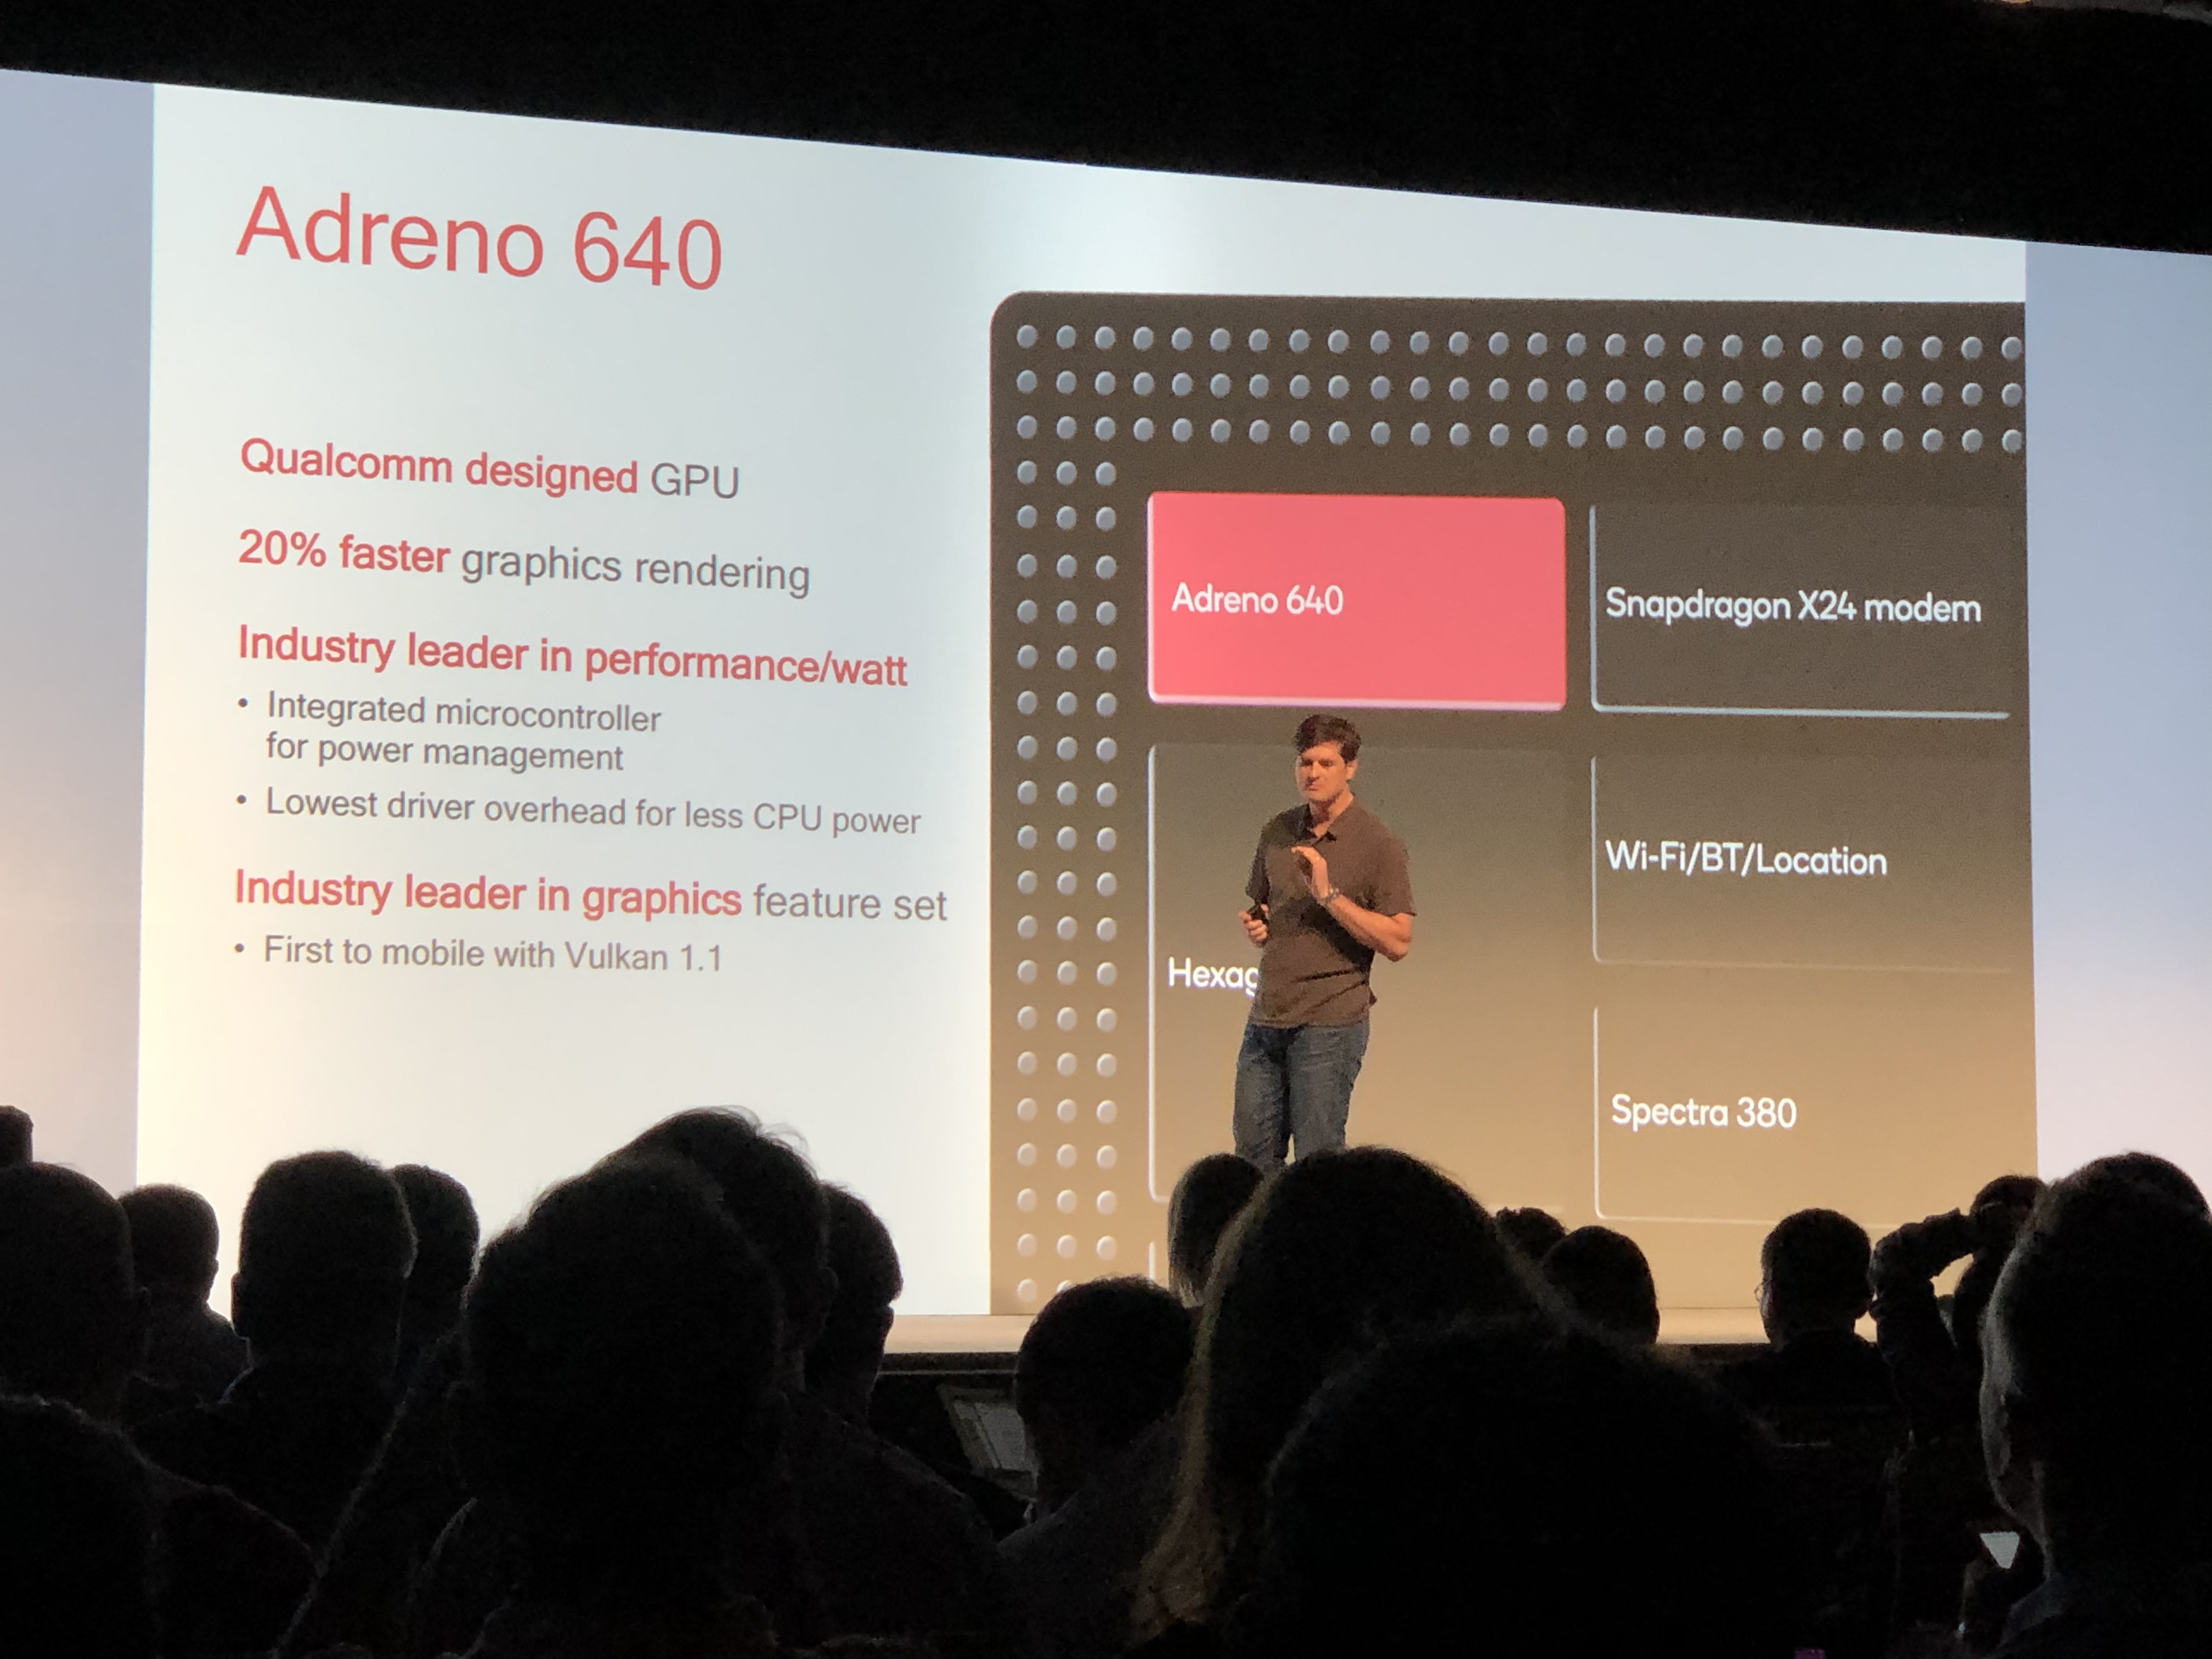
The Qualcomm Adreno 640 is a smartphone and tablet GPU that is integrated within the Qualcomm Snapdragon 855 SoC. The chip will be available from early 2019 and will be used mainly in high-end Android devices.
According to Qualcomm, the Adreno 640 GPU offers a 20% improved performance over the Adreno 630, its predecessor, which is integrated in the Snapdragon 845 SoC. The enhanced performance is achieved by the Adreno 640 having 50% more FP16 and FP32 compute units (ALUs) than the Adreno 630, while its 7 nm FinFET manufacturing process makes it 20% more efficient too.
The Adreno 640 will also support the Vulkan 1.1 API, something which is possible for other Adreno 600 series GPUs too.
Qualcomm Adreno 620 ► remove from comparison
The Qualcomm Adreno 620 is a mobile graphics card for upper mid-range smartphones and tablets (mostly Android based). It is included in the Qualcomm Snapdragon 765G and 765 SoCs and based on the Adreno 600 architecture (like the Adreno 630, which should be fully compatible in software).
According to Qualcomm, the Adreno 620 in the 765G is 10% faster than the one in the 765 and 20% faster than the old Adreno 618. In our benchmarks, the Adreno 620 in the Snapdragon 765G even was 25% faster in selected benchmarks, but the faster CPU will also influence the results.
The GPU supports modern standards like Vulkan 1.0 (according to Wikipedia), OpenGL ES 3.2, OpenCL 2.0 and DirectX 11 (FL 11_1).
Qualcomm Adreno 640 Qualcomm Adreno 620 Adreno 600 Series Shared Memory yes yes API DirectX 12, OpenGL ES 3.2 DirectX 12, OpenGL ES 3.2, Vulkan 1.1 technology 10 nm 14 nm Features OpenGL ES 3.2, OpenCL 2.0, DirectX 12, Vulkan 1.1 OpenGL ES 3.2, OpenCL 2.0, Direct3D 12 (FL 11_1) Date of Announcement 12.02.2018 09.04.2019 Architecture Adreno 600
Benchmarks 3DMark - 3DMark Ice Storm Unlimited Graphics
min: 97354 avg: 108080 median: 106829 (12%) max: 118129 Points
min: 56690 avg: 67038 median: 68764 (8%) max: 70216 Points
3DMark - 3DMark Sling Shot (ES 3.0) Unlimited
min: 5268 avg: 7441 median: 7659 (33%) max: 8661 Points
min: 3678 avg: 4551 median: 4663 (20%) max: 4893 Points
3DMark - 3DMark Sling Shot (ES 3.0) Unlimited Graphics
min: 6358 avg: 9988 median: 10199 (22%) max: 12070 Points
min: 4036 avg: 5146 median: 5344 (12%) max: 5437 Points
3DMark - 3DMark Sling Shot Extreme (ES 3.1) Unlimited
min: 3969 avg: 6014 median: 6182 (31%) max: 6981 Points
min: 2934 avg: 3394 median: 3494 (17%) max: 3605 Points
3DMark - 3DMark Sling Shot Extreme (ES 3.1) Unlimited Graphics
min: 5184 avg: 7016 median: 7072.5 (21%) max: 8218 Points
min: 2814 avg: 3435 median: 3554 (11%) max: 3592 Points
3DMark - 3DMark Wild Life Unlimited
min: 3079 avg: 3323 median: 3436 (2%) max: 3455 Points
min: 1022 avg: 1402 median: 1604 (1%) max: 1681 Points
3DMark - 3DMark Wild Life Extreme Unlimited
min: 864 avg: 936 median: 970 (1%) max: 974 Points
min: 443 avg: 443.5 median: 443.5 (1%) max: 444 Points
GFXBench - GFXBench 5.0 4K Aztec Ruins High Tier Offscreen
6.6 fps (3%)
GFXBench - GFXBench 5.0 Aztec Ruins High Tier Offscreen
min: 8.5 avg: 17.5 median: 17 (3%) max: 39 fps
min: 5.3 avg: 8.3 median: 8.5 (2%) max: 13 fps
GFXBench - GFXBench 5.0 Aztec Ruins Normal Tier Offscreen
min: 16 avg: 40.5 median: 42 (3%) max: 47 fps
min: 12 avg: 21.5 median: 23 (2%) max: 24 fps
GFXBench - GFXBench Car Chase Offscreen
min: 22 avg: 40.2 median: 42 (5%) max: 48 fps
min: 12 avg: 19.7 median: 21 (2%) max: 21 fps
GFXBench 3.1 - GFXBench Manhattan ES 3.1 Offscreen
min: 35 avg: 64.4 median: 69 (1%) max: 79 fps
min: 22 avg: 35 median: 37 (1%) max: 38 fps
GFXBench 3.0 - GFXBench 3.0 Manhattan Offscreen
min: 50 avg: 94.7 median: 99.5 (6%) max: 112 fps
min: 31 avg: 50.9 median: 54 (3%) max: 56 fps
GFXBench (DX / GLBenchmark) 2.7 + Qualcomm Adreno 640 GFXBench (DX / GLBenchmark) 2.7 - GFXBench T-Rex HD Offscreen C24Z16
min: 85 avg: 158.9 median: 166 (1%) max: 185 fps
GFXBench T-Rex HD Offscreen C24Z16 + Qualcomm Adreno 620
min: 48 avg: 88.4 median: 95 (1%) max: 97 fps
Antutu v9 - AnTuTu v9 GPU
min: 204205 avg: 204715 median: 204715 (26%) max: 205225 Points
Basemark GPU 1.2 - Basemark GPU 1.2 Vulkan Official Medium Offscreen 1080
64.9 fps (0%)
30.4 fps (0%)
Geekbench 6.2 - Geekbench 6.2 GPU OpenCL
2968 Points (1%)
Geekbench 6.2 - Geekbench 6.2 GPU Vulkan
2419 Points (1%)
PassMark PerformanceTest Mobile V1 - PerformanceTest Mobile V1 2D Graphics Tests
min: 10504 avg: 18251 median: 14922.5 (15%) max: 40654 Points
min: 11776 avg: 21536 median: 21536 (22%) max: 31296 Points
PassMark PerformanceTest Mobile V1 - PerformanceTest Mobile V1 3D Graphics Tests
min: 4244 avg: 11804 median: 5422.5 (9%) max: 44840 Points
min: 5334 avg: 16658 median: 16657.5 (29%) max: 27981 Points
Power Consumption - GFXBench Aztec Ruins Normal Tier Offscreen Power Consumption 150cd *
7.8 Watt (3%)
Average Benchmarks Qualcomm Adreno 640 → 100% n=16 Average Benchmarks Qualcomm Adreno 620 → 75% n=16
- Range of benchmark values for this graphics card
- Average benchmark values for this graphics card
* Smaller numbers mean a higher performance
1 This benchmark is not used for the average calculation
Game Benchmarks The following benchmarks stem from our benchmarks of review laptops. The performance depends on the used graphics memory, clock rate, processor, system settings, drivers, and operating systems. So the results don't have to be representative for all laptops with this GPU. For detailed information on the benchmark results, click on the fps number.
Adreno 620:
52 [X] Vivo X51 5G 1.1.1_1437351_1398019
Qualcomm Snapdragon 765G 1.8GHz
Adreno 620
min:
20 fps, max:
59 fps
fps
Adreno 620:
23 [X] Vivo X51 5G 1.1.1_1437351_1398019
Qualcomm Snapdragon 765G 1.8GHz
Adreno 620
min:
1 fps, max:
82 fps
fps
100%
Adreno 640:
30 30 [X] Xiaomi Pad 5 1.61.6
Qualcomm Snapdragon 860 GHz
Adreno 640
min:
30 fps, max:
30 fps
~ 30 fps
250%
Adreno 620:
60 90 [X] Google Pixel 5 1.55.5
Qualcomm Snapdragon 765G 1.8GHz
Adreno 620
min:
79 fps, max:
90 fps
~ 75 fps
Adreno 620:
30 [X] OnePlus Nord 0.19.0
Qualcomm Snapdragon 765G 1.8GHz
Adreno 620
min:
29 fps, max:
31 fps
40 [X] Motorola Edge 0.18.0
Qualcomm Snapdragon 765 1.8GHz
Adreno 620
min:
39 fps, max:
41 fps
40 40 40 40 [X] Nokia 8.3 5G 1.0.0
Qualcomm Snapdragon 765G 1.8GHz
Adreno 620
min:
37 fps, max:
41 fps
~ 38 fps
72%
Adreno 620:
30 30 [X] Motorola Edge 0.18.0
Qualcomm Snapdragon 765 1.8GHz
Adreno 620
min:
29 fps, max:
31 fps
30 30 30 [X] OnePlus Nord 0.19.0
Qualcomm Snapdragon 765G 1.8GHz
Adreno 620
min:
19 fps, max:
31 fps
30 30 [X] Google Pixel 5 1.0.0
Qualcomm Snapdragon 765G 1.8GHz
Adreno 620
min:
27 fps, max:
31 fps
30 [X] Nokia 8.3 5G 1.0.0
Qualcomm Snapdragon 765G 1.8GHz
Adreno 620
min:
28 fps, max:
31 fps
30 40 [X] Vivo X51 5G 1.1.0
Qualcomm Snapdragon 765G 1.8GHz
Adreno 620
min:
35 fps, max:
41 fps
~ 31 fps
100%
Adreno 640:
59 60 [X] OnePlus 7 Pro 1.28.2.2
Qualcomm Snapdragon 855 2.8GHz
Adreno 640
min:
58 fps, max:
61 fps
60 [X] OnePlus 7 1.29.1.2
Qualcomm Snapdragon 855 2.8GHz
Adreno 640
min:
59 fps, max:
60 fps
60 [X] LG G8s ThinQ 1.29.1.2
Qualcomm Snapdragon 855 2.8GHz
Adreno 640
min:
59 fps, max:
61 fps
60 [X] OnePlus 7T 1.31.1.5
Qualcomm Snapdragon 855+ / 855 Plus GHz
Adreno 640
min:
59 fps, max:
60 fps
60 [X] OnePlus 7T Pro 1.31.1.5
Qualcomm Snapdragon 855+ / 855 Plus GHz
Adreno 640
min:
58 fps, max:
60 fps
60 ~ 60 fps
75%
Adreno 620:
30 [X] Motorola Edge 1.34.1.10
Qualcomm Snapdragon 765 1.8GHz
Adreno 620
min:
29 fps, max:
31 fps
60 ~ 45 fps
100%
Adreno 640:
30 [X] Asus ROG Phone 2 1.32.1.2
Qualcomm Snapdragon 855+ / 855 Plus GHz
Adreno 640
min:
30 fps, max:
31 fps
59 60 [X] OnePlus 7 Pro 1.28.2.2
Qualcomm Snapdragon 855 2.8GHz
Adreno 640
min:
59 fps, max:
61 fps
60 [X] OnePlus 7 1.29.1.2
Qualcomm Snapdragon 855 2.8GHz
Adreno 640
min:
58 fps, max:
60 fps
60 [X] LG G8s ThinQ 1.29.1.2
Qualcomm Snapdragon 855 2.8GHz
Adreno 640
min:
53 fps, max:
61 fps
60 [X] OnePlus 7T 1.31.1.5
Qualcomm Snapdragon 855+ / 855 Plus GHz
Adreno 640
min:
1 fps, max:
60 fps
60 [X] OnePlus 7T Pro 1.31.1.5
Qualcomm Snapdragon 855+ / 855 Plus GHz
Adreno 640
min:
50 fps, max:
60 fps
60 61 [X] Asus ROG Phone 2 1.32.1.2
Qualcomm Snapdragon 855+ / 855 Plus GHz
Adreno 640
min:
60 fps, max:
63 fps
62 [X] Google Pixel 4 1.31.1.5
Qualcomm Snapdragon 855 2.8GHz
Adreno 640
min:
35 fps, max:
63 fps
~ 57 fps
79%
Adreno 620:
30 [X] Motorola Edge 1.34.1.10
Qualcomm Snapdragon 765 1.8GHz
Adreno 620
min:
29 fps, max:
31 fps
60 ~ 45 fps
100%
Adreno 640:
59 60 [X] OnePlus 7 Pro 1.18.3
Qualcomm Snapdragon 855 2.8GHz
Adreno 640
min:
2 fps, max:
61 fps
60 [X] OnePlus 7T Pro 1.19.2
Qualcomm Snapdragon 855+ / 855 Plus GHz
Adreno 640
min:
59 fps, max:
60 fps
60 ~ 60 fps
100%
Adreno 640:
59 60 [X] OnePlus 7 Pro 1.18.3
Qualcomm Snapdragon 855 2.8GHz
Adreno 640
min:
2 fps, max:
61 fps
60 [X] OnePlus 7T Pro 1.19.2
Qualcomm Snapdragon 855+ / 855 Plus GHz
Adreno 640
min:
52 fps, max:
60 fps
60 ~ 60 fps
100%
Adreno 640:
60 120 [X] Asus ROG Phone 2 1.6.3
Qualcomm Snapdragon 855+ / 855 Plus GHz
Adreno 640
min:
118 fps, max:
121 fps
~ 90 fps
101%
Adreno 620:
62 [X] Vivo X51 5G 1.6.10
Qualcomm Snapdragon 765G 1.8GHz
Adreno 620
min:
61 fps, max:
62 fps
120 ~ 91 fps
100%
Adreno 640:
28 [X] LG G8s ThinQ 1.6.3a
Qualcomm Snapdragon 855 2.8GHz
Adreno 640
min:
26 fps, max:
30 fps
30 [X] OnePlus 7 Pro 1.5.4a
Qualcomm Snapdragon 855 2.8GHz
Adreno 640
min:
29 fps, max:
31 fps
30 [X] OnePlus 7 1.5.4a
Qualcomm Snapdragon 855 2.8GHz
Adreno 640
min:
29 fps, max:
31 fps
30 30 [X] OnePlus 7T 1.7.3a
Qualcomm Snapdragon 855+ / 855 Plus GHz
Adreno 640
min:
29 fps, max:
31 fps
30 [X] OnePlus 7T Pro 1.8.1a
Qualcomm Snapdragon 855+ / 855 Plus GHz
Adreno 640
min:
27 fps, max:
31 fps
30 30 60 [X] Asus ROG Phone 2 1.8.1a
Qualcomm Snapdragon 855+ / 855 Plus GHz
Adreno 640
min:
44 fps, max:
61 fps
60 [X] Asus ROG Phone 2 1.8.1a
Qualcomm Snapdragon 855+ / 855 Plus GHz
Adreno 640
min:
56 fps, max:
61 fps
~ 36 fps
83%
Adreno 620:
29 30 30 [X] Motorola Edge 2.2.2a
Qualcomm Snapdragon 765 1.8GHz
Adreno 620
min:
23 fps, max:
31 fps
30 30 [X] OnePlus Nord 2.3.4a
Qualcomm Snapdragon 765G 1.8GHz
Adreno 620
min:
24 fps, max:
31 fps
30 [X] Nokia 8.3 5G 2.5.3a
Qualcomm Snapdragon 765G 1.8GHz
Adreno 620
min:
23 fps, max:
31 fps
~ 30 fps
100%
Adreno 640:
28 [X] LG G8s ThinQ 1.6.3a
Qualcomm Snapdragon 855 2.8GHz
Adreno 640
min:
24 fps, max:
30 fps
29 30 [X] OnePlus 7 Pro 1.5.4a
Qualcomm Snapdragon 855 2.8GHz
Adreno 640
min:
27 fps, max:
31 fps
30 [X] OnePlus 7 1.5.4a
Qualcomm Snapdragon 855 2.8GHz
Adreno 640
min:
27 fps, max:
31 fps
30 30 [X] OnePlus 7T 1.7.3a
Qualcomm Snapdragon 855+ / 855 Plus GHz
Adreno 640
min:
27 fps, max:
31 fps
30 30 [X] OnePlus 7T Pro 1.8.1a
Qualcomm Snapdragon 855+ / 855 Plus GHz
Adreno 640
min:
25 fps, max:
31 fps
60 ~ 33 fps
88%
Adreno 620:
21 30 30 [X] Motorola Edge 2.2.2a
Qualcomm Snapdragon 765 1.8GHz
Adreno 620
min:
25 fps, max:
31 fps
30 30 [X] OnePlus Nord 2.3.4a
Qualcomm Snapdragon 765G 1.8GHz
Adreno 620
min:
25 fps, max:
30 fps
30 [X] Nokia 8.3 5G 2.5.3a
Qualcomm Snapdragon 765G 1.8GHz
Adreno 620
min:
14 fps, max:
31 fps
~ 29 fps
100%
Adreno 640:
120 [X] Asus ROG Phone 2 1.62.1
Qualcomm Snapdragon 855+ / 855 Plus GHz
Adreno 640
min:
118 fps, max:
121 fps
fps
100%
Adreno 640:
60 120 [X] Asus ROG Phone 2 1.112.0
Qualcomm Snapdragon 855+ / 855 Plus GHz
Adreno 640
min:
118 fps, max:
121 fps
~ 90 fps
Average Gaming Qualcomm Adreno 640 → 100% Average Gaming 30-70 fps → 100%
Average Gaming Qualcomm Adreno 620 → 107% Average Gaming 30-70 fps → 75%
Qualcomm Adreno 620 low med. high ultra QHD 4K League of Legends: Wild Rift 60 60 60 Genshin Impact 52 23 Armajet 75 PUBG Mobile 38 40 31 Arena of Valor 45 45 Dead Trigger 2 91 Asphalt 9: Legends 30 29 < 30 fps < 60 fps < 120 fps ≥ 120 fps 3 1 2 1 1 3 1 1 1
For more games that might be playable and a list of all games and graphics cards visit our Gaming List
v1.26
log 24. 15:03:16
#0 checking url part for id 9446 +0s ... 0s
#1 checking url part for id 10317 +0s ... 0s
#2 not redirecting to Ajax server +0s ... 0s
#3 did not recreate cache, as it is less than 5 days old! Created at Mon, 22 Apr 2024 05:40:21 +0200 +0.001s ... 0.001s
#4 composed specs +0.084s ... 0.085s
#5 did output specs +0s ... 0.085s
#6 start showIntegratedCPUs +0s ... 0.085s
#7 getting avg benchmarks for device 9446 +0.032s ... 0.117s
#8 got single benchmarks 9446 +0.072s ... 0.19s
#9 getting avg benchmarks for device 10317 +0.002s ... 0.191s
#10 got single benchmarks 10317 +0.052s ... 0.243s
#11 got avg benchmarks for devices +0s ... 0.243s
#12 min, max, avg, median took s +0.127s ... 0.37s
#13 before gaming benchmark output +0s ... 0.37s
#14 Got 112 rows for game benchmarks. +0.047s ... 0.417s
#15 composed SQL query for gamebenchmarks +0s ... 0.417s
#16 got data and put it in $dataArray +0.006s ... 0.423s
#17 benchmarks composed for output. +0.028s ... 0.45s
#18 calculated avg scores. +0s ... 0.45s
#19 return log +0.044s ... 0.494s
Please share our article, every link counts!
Redaktion, 2017-09- 8 (Update: 2023-07- 1)
 Deutsch
 English
 Español
 Français
 Italiano
 Nederlands
 Polski
 Português
 Русский
 Türkçe
 Svenska
 Chinese
 Magyar