Notebookcheck Logo

Qualcomm Adreno 418 vs Qualcomm Adreno 405 vs Qualcomm Adreno 420

Qualcomm Adreno 418

► remove from comparison Qualcomm Adreno 418

The Qualcomm Adreno 418 is an integrated graphics card for (mostly Android based) smartphones and tablets. It is integrated in the Qualcomm Snapdragon 808 SoC and was announced in mid 2014. The GPU supports OpenGL ES 3.1 and DirectX 11 feature level 11_1 (with hardware tessellation). The graphics card uses a technology called FlexRender to intelligently switch between TBR (TBR Tile Based Renderer) and the classic direct rendering.

Compared to the Adreno 420, the performance of the 418 is about 20 percent slower (at 600 MHz). This puts the Adreno 418 in the upper middle class in 2015 and even demanding (Android) games should run fluently.

Qualcomm Adreno 405

► remove from comparison

The Qualcomm Adreno 405 is an integrated graphics card for (mostly Android based) smartphones and tablets. It was announced in 2014 and is used in SoCs like the Qualcomm Snapdragon 415, 425, 610 or 615. Depending on the used SoC and device, the clock rate of the Adreno 405 is around 550 MHz. 

The Adreno 405 features 48 ALUs (unified shaders) and supports OpenGL ES 3.1 and DirectX 11.2 (Feature Level 11_1).

The performance of the Adreno 405 reaches only 40 % of the high end Adreno 420 (in the Snapdragon 805). This means its on a level with the older Adreno 320 and the PowerVR G6200.

Qualcomm Adreno 420

► remove from comparison Qualcomm Adreno 420

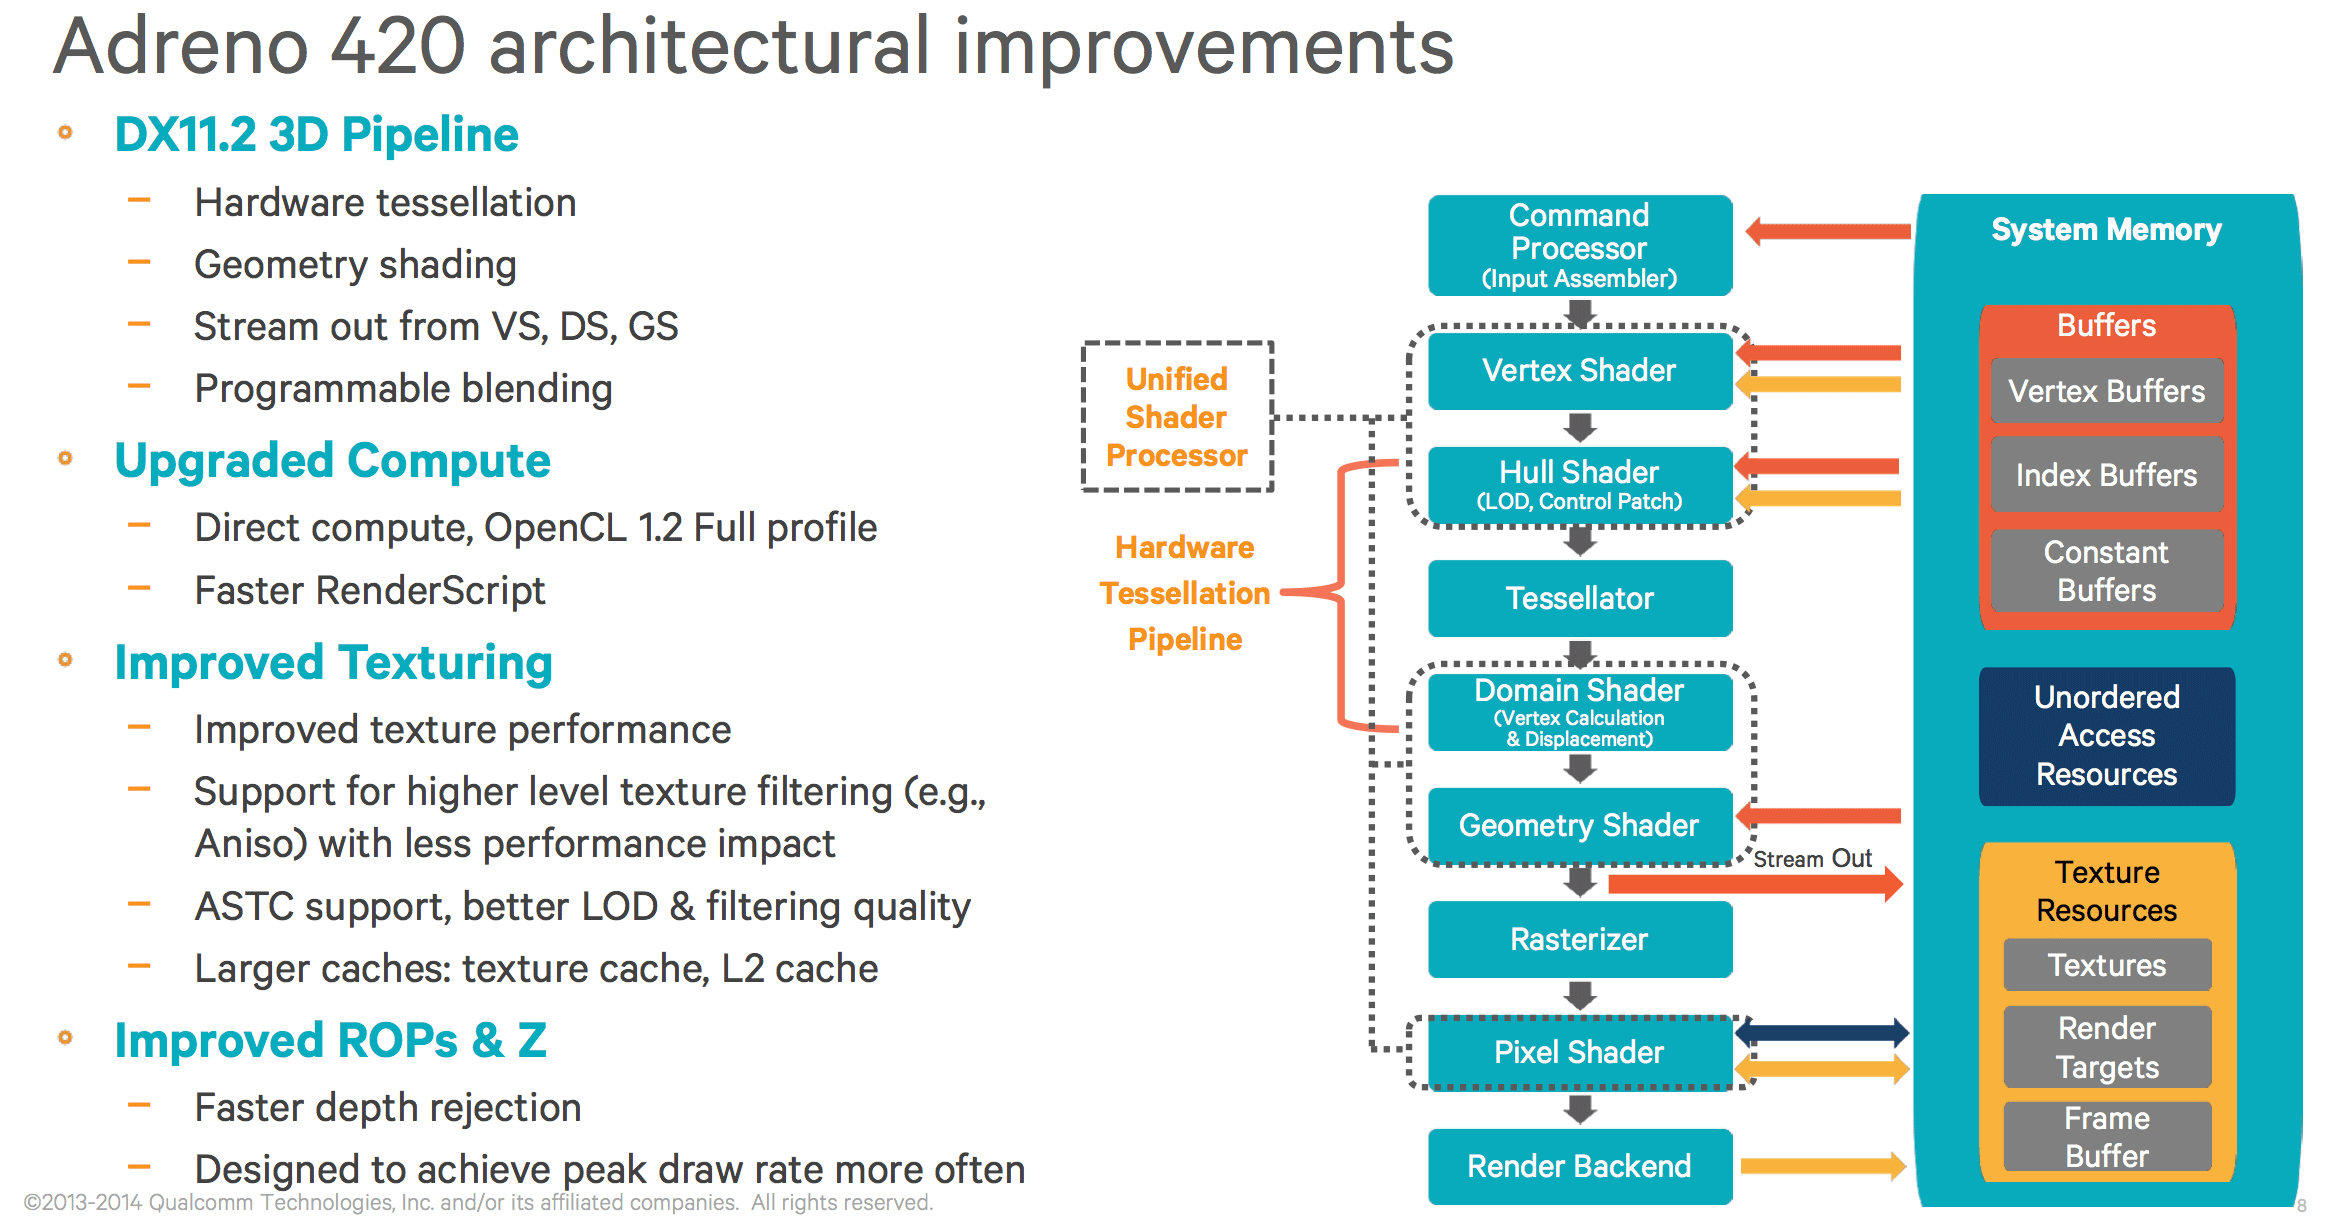
The Qualcomm Adreno 420 is an integrated graphics card for (mostly Android based) smartphones and tablets. It was introduced in the middle of 2014 and is integrated in the Qualcomm Snapdragon 805 SoC. The graphics card uses a technology called FlexRender. It can switch "intelligently" between TBR (TBR Tile Based Renderer) and the classic direct rendering. It supports OpenGL ES 3.1 and DirectX 11.2 Feature Level 11_1 (compared to ES 3.0 and DirectX 9_3 of the Adreno 330).

The graphics clock rate of the Adreno 420 differs from the used SoC and where it is built in. At launch it ranges from 500 to 600 MHz in the Snapdragon 805 APQ8084.

According to Qualcomm, the power consumption in comparison to the Snapdragon 800 has been reduced by up to 20% running GFXBench 2.7 T-Rex, while delivering up to 40% more performance. First benchmarks show even bigger gains; however, the performance will decrease over time to prevent too high temperatures (especially in smartphones). This is common amongst many other ARM SoCs. Nevertheless, the Adreno 420 beats the Mali-T628 MP6 (Samsung Exynos 5420/5430) as well as the PowerVR G6430 (Apple A7) and is one of the fastest mobile GPUs in mid-2014, but still significantly slower than the Nvidia Tegra K1 or the PowerVR GX6650 in Apple's A8X SoC (both mainly tablet GPUs).

Qualcomm Adreno 418Qualcomm Adreno 405Qualcomm Adreno 420
Adreno 400 Series
Adreno 430 192 @ 0.65 GHz
Adreno 420 128 @ 0.6 GHz
Adreno 418 128 @ 0.6 GHz
Adreno 405 48 @ 0.55 GHz
Adreno 430 192 @ 0.65 GHz
Adreno 420 128 @ 0.6 GHz
Adreno 418 128 @ 0.6 GHz
Adreno 405 48 @ 0.55 GHz
Adreno 430 192 @ 0.65 GHz
Adreno 420 128 @ 0.6 GHz
Adreno 418 128 @ 0.6 GHz
Adreno 405 48 @ 0.55 GHz
Pipelines128 - unified48 - unified128 - unified
Core Speed600 (Boost) MHz550 (Boost) MHz600 (Boost) MHz
Shared Memoryyesyesyes
APIDirectX 11.1, OpenGL ES 3.1DirectX 11, OpenGL ES 3.1DirectX 11, OpenGL ES 3.1
technology20 nm28 nm28 nm
FeaturesOpenCL 1.2OpenCL 1.2OpenCL 1.2
Date of Announcement23.06.2014 24.02.2014 23.06.2014
Link to Manufacturer Pagewww.qualcomm.comwww.qualcomm.com
CPU in Adreno 418GPU Base SpeedGPU Boost / Turbo
Qualcomm Snapdragon 808 MSM89926 x 2000 MHz? MHz600 MHz
CPU in Adreno 405GPU Base SpeedGPU Boost / Turbo
Qualcomm Snapdragon 617 MSM89528 x 1500 MHz? MHz550 MHz
Qualcomm Snapdragon 616 MSM8939v28 x 1700 MHz? MHz550 MHz
Qualcomm Snapdragon 615 MSM89398 x 1700 MHz? MHz550 MHz
min. - max.? MHz? - 600 MHz
CPU in Adreno 420GPU Base SpeedGPU Boost / Turbo
Qualcomm Snapdragon 805 APQ80844 x 2700 MHz600 MHz? MHz

Benchmarks

3DMark - 3DMark Ice Storm Unlimited Graphics
min: 17637     avg: 22445     median: 23298.5 (3%)     max: 24864 Points
min: 19019     avg: 21258     median: 20733 (2%)     max: 25480 Points
3DMark - 3DMark Ice Storm Extreme Graphics
10381 Points (1%)
3DMark - 3DMark Sling Shot (ES 3.0) Unlimited
1689 Points (7%)
min: 499     avg: 627     median: 660 (3%)     max: 690 Points
3DMark - 3DMark Sling Shot (ES 3.0) Unlimited Graphics
2012 Points (4%)
min: 437     avg: 565     median: 598.5 (1%)     max: 624 Points
3DMark - 3DMark Sling Shot Extreme (ES 3.1) Unlimited
1193 Points (6%)
min: 398     avg: 417     median: 423 (2%)     max: 430 Points
3DMark - 3DMark Sling Shot Extreme (ES 3.1) Unlimited Graphics
1207 Points (4%)
min: 341     avg: 355.3     median: 360 (1%)     max: 365 Points
GFXBench - GFXBench 5.0 Aztec Ruins High Tier Offscreen
1 fps (0%)
GFXBench - GFXBench 5.0 Aztec Ruins Normal Tier Offscreen
2.9 fps (0%)
GFXBench - GFXBench Car Chase Offscreen
7.2 fps (1%)
min: 2.2     avg: 2.5     median: 2.6 (0%)     max: 2.6 fps
GFXBench 3.1 - GFXBench Manhattan ES 3.1 Offscreen
min: 9.9     avg: 10.2     median: 10 (0%)     max: 11 fps
GFXBench 3.0 - GFXBench 3.0 Manhattan Offscreen
min: 12.3     avg: 14.5     median: 15 (1%)     max: 16 fps
min: 17.7     avg: 18.1     median: 17.9 (1%)     max: 19 fps
GFXBench (DX / GLBenchmark) 2.7
GFXBench T-Rex HD Offscreen C24Z16 + Qualcomm Adreno 418
GFXBench (DX / GLBenchmark) 2.7 - GFXBench T-Rex HD Offscreen C24Z16
min: 21.82     avg: 31.7     median: 34 (0%)     max: 38 fps
GFXBench T-Rex HD Offscreen C24Z16 + Qualcomm Adreno 405
GFXBench T-Rex HD Offscreen C24Z16 + Qualcomm Adreno 420
min: 39     avg: 41     median: 41.4 (0%)     max: 42.4 fps
Basemark ES 2.0 - Basemark ES 2.0
min: 59.7     avg: 59.8     median: 59.8 (99%)     max: 59.8 fps
59.5 fps (98%)
Basemark X 1.0 - Basemark X 1.0 Off-Screen
min: 21.1     avg: 21.1     median: 21.1 (99%)     max: 21.26 fps
Basemark X 1.1 - Basemark X 1.1 High Quality
12793 Points (29%)
min: 4803     avg: 6719     median: 5084 (12%)     max: 13570 Points
min: 17868     avg: 18483     median: 18680 (42%)     max: 18900 Points
Basemark X 1.1 - Basemark X 1.1 Medium Quality
min: 26223     avg: 26360     median: 26339 (59%)     max: 26519 Points
min: 6444     avg: 9754     median: 10631 (24%)     max: 10856 Points
min: 29551     avg: 31186     median: 31806 (71%)     max: 32200 Points
NenaMark2 - NenaMark2 Score
min: 59.8     avg: 59.9     median: 59.9 (89%)     max: 59.9 fps
59.9 fps (89%)
PassMark PerformanceTest Mobile V1 - PerformanceTest Mobile V1 2D Graphics Tests
min: 4601     avg: 4726     median: 4725.5 (5%)     max: 4850 Points
min: 1818     avg: 2945     median: 3421 (3%)     max: 3597 Points
min: 2283     avg: 3091     median: 3436 (3%)     max: 3554 Points
PassMark PerformanceTest Mobile V1 - PerformanceTest Mobile V1 3D Graphics Tests
min: 1935     avg: 2057     median: 2057 (4%)     max: 2179 Points
min: 851     avg: 935     median: 884 (2%)     max: 1069 Points
min: 1129     avg: 1732     median: 1979 (3%)     max: 2088 Points
Smartbench 2012 - Smartbench 2012 Gaming Index
min: 3873     avg: 4163     median: 4118 (90%)     max: 4399 Points
min: 2108     avg: 3733     median: 4224.5 (92%)     max: 4375 Points

Average Benchmarks Qualcomm Adreno 418 → 100% n=9

Average Benchmarks Qualcomm Adreno 405 → 47% n=9

Average Benchmarks Qualcomm Adreno 420 → 96% n=9

- Range of benchmark values for this graphics card
- Average benchmark values for this graphics card
* Smaller numbers mean a higher performance
1 This benchmark is not used for the average calculation
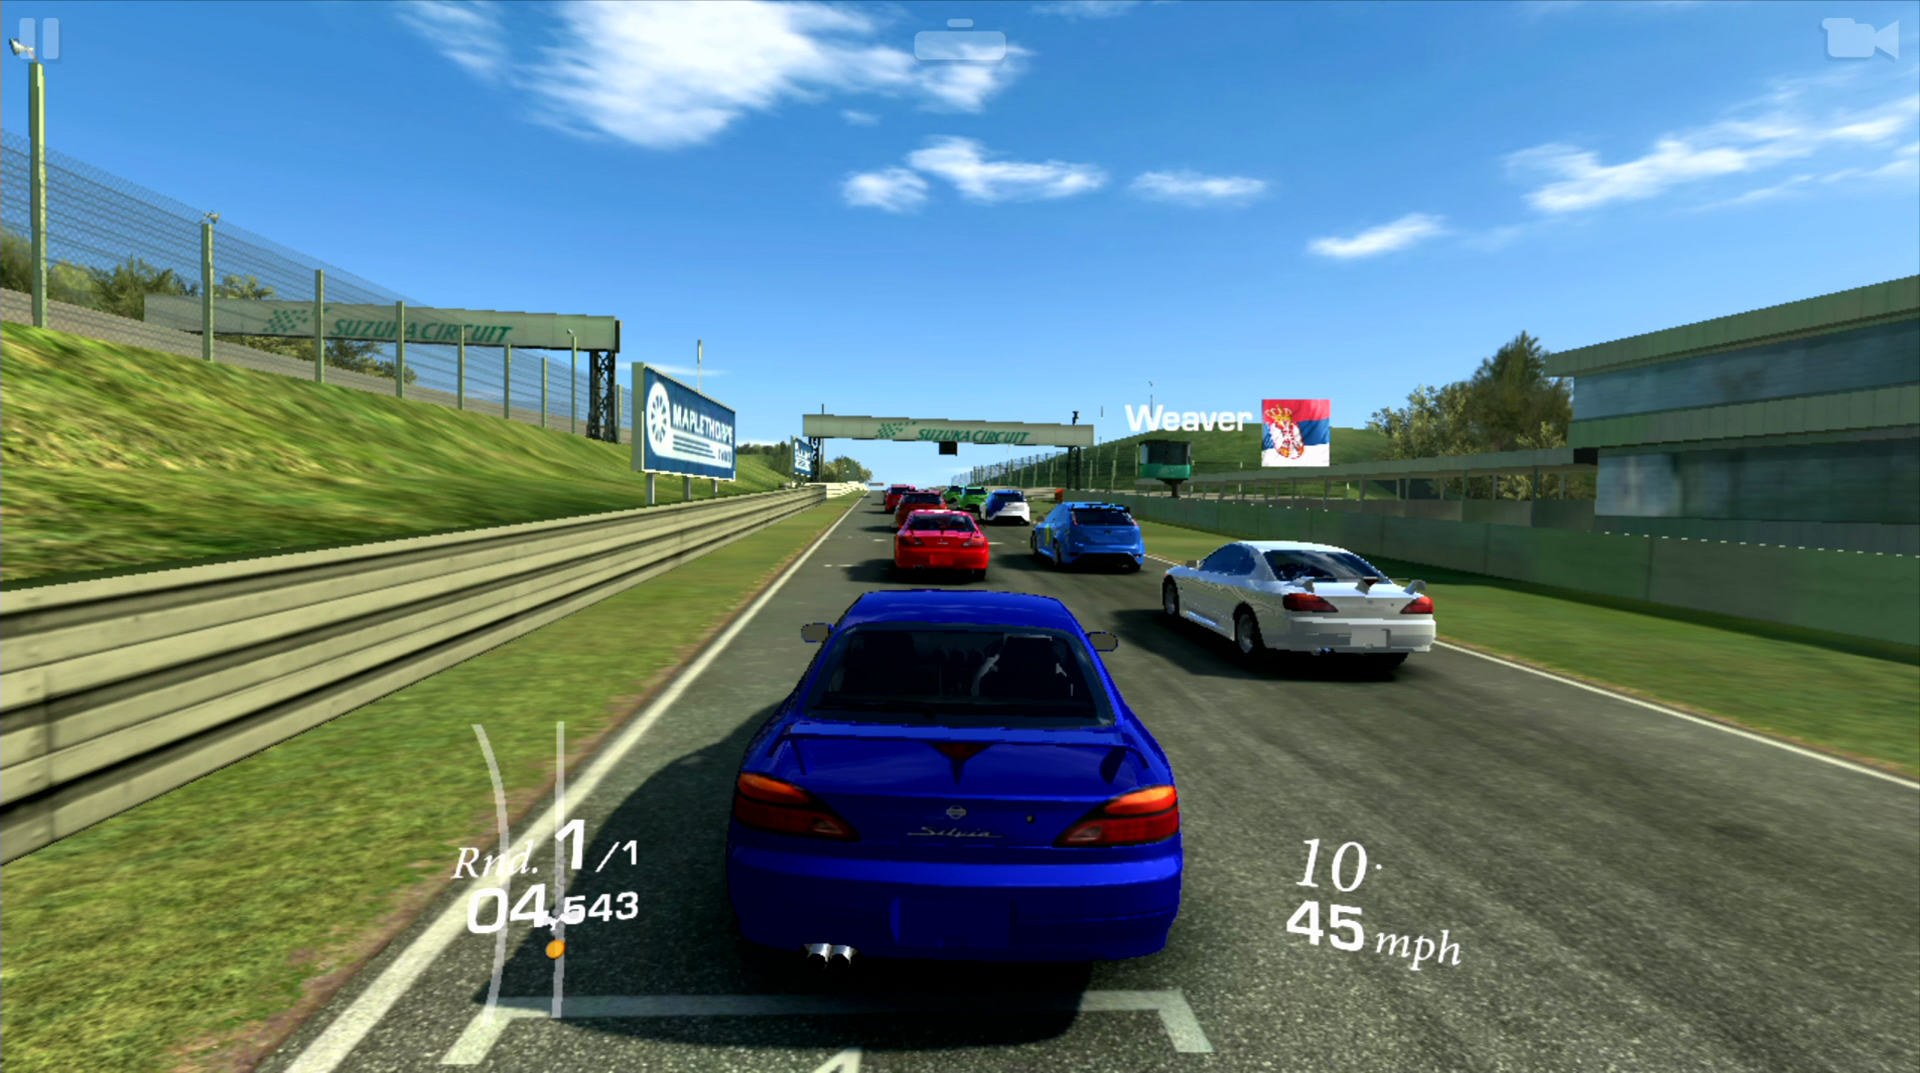
Game Benchmarks

The following benchmarks stem from our benchmarks of review laptops. The performance depends on the used graphics memory, clock rate, processor, system settings, drivers, and operating systems. So the results don't have to be representative for all laptops with this GPU. For detailed information on the benchmark results, click on the fps number.

PUBG Mobile

PUBG Mobile

2018
low
Adreno 405:
25  fps
World of Tanks Blitz

World of Tanks Blitz

2018
low
Adreno 405:
34  fps
high
Adreno 405:
27  fps
Arena of Valor

Arena of Valor

2018
low
Adreno 405:
30  fps
ultra
Adreno 405:
27  fps
Shadow Fight 3

Shadow Fight 3

2018
low
Adreno 405:
29  fps
high
Adreno 405:
30  fps
Battle Bay

Battle Bay

2018
high
Adreno 405:
29   fps
Dead Trigger 2

Dead Trigger 2

2013
high
100%
Adreno 418:
30 2560x1440 31.4 2560x1440 47 ~ 36 fps
83%
Adreno 405:
20 1920x1080 30 30 32 32 35 ~ 30 fps
Asphalt 8: Airborne

Asphalt 8: Airborne

2013
low
100%
Adreno 418:
28 28.6 2560x1440 29 2560x1440 ~ 29 fps
114%
Adreno 405:
26 28 35 42 1920x1080 ~ 33 fps
high
100%
Adreno 418:
24 28.3 2560x1440 29 2560x1440 ~ 27 fps
89%
Adreno 405:
20 21 21 25 26 32 1920x1080 ~ 24 fps
Gangstar Vegas

Gangstar Vegas

2013
ultra
100%
Adreno 418:
22.7 2560x1440  fps
Real Racing 3

Real Racing 3

2013
high
100%
Adreno 418:
28.6 2560x1440   fps
73%
Adreno 405:
21  fps
Temple Run 2

Temple Run 2

2013
high
100%
Adreno 418:
58.5 2560x1440 60 2560x1440 ~ 59 fps
Minecraft - Pocket Edition

Minecraft - Pocket Edition

2011
ultra
100%
Adreno 418:
51.9 2560x1440   fps

Average Gaming Qualcomm Adreno 418 → 100%

Average Gaming 30-70 fps → 100%

Average Gaming Qualcomm Adreno 405 → 90%

Average Gaming 30-70 fps → 114%

Qualcomm Adreno 405lowmed.highultraQHD4K
PUBG Mobile25
World of Tanks Blitz3427
Arena of Valor3027
Shadow Fight 32930
Battle Bay29
Dead Trigger 230
Asphalt 8: Airborne3324
Real Racing 321
< 30 fps
< 60 fps
< 120 fps
≥ 120 fps
2
3


4
2

1


Qualcomm Adreno 418lowmed.highultraQHD4K
Dead Trigger 236
Asphalt 8: Airborne2927
Gangstar Vegas22.7
Real Racing 328.6
Temple Run 259
Minecraft - Pocket Edition51.9
< 30 fps
< 60 fps
< 120 fps
≥ 120 fps
1


2
2

1
1


For more games that might be playable and a list of all games and graphics cards visit our Gaming List

v1.26
log 19. 12:11:01

#0 checking url part for id 6309 +0s ... 0s

#1 checking url part for id 6151 +0s ... 0s

#2 checking url part for id 5741 +0s ... 0s

#3 not redirecting to Ajax server +0s ... 0s

#4 did not recreate cache, as it is less than 5 days old! Created at Fri, 19 Apr 2024 05:40:26 +0200 +0.001s ... 0.001s

#5 composed specs +0.29s ... 0.291s

#6 did output specs +0s ... 0.291s

#7 start showIntegratedCPUs +0s ... 0.291s

#8 getting avg benchmarks for device 6309 +0.066s ... 0.357s

#9 got single benchmarks 6309 +0.022s ... 0.379s

#10 getting avg benchmarks for device 6151 +0.002s ... 0.381s

#11 got single benchmarks 6151 +0.08s ... 0.461s

#12 getting avg benchmarks for device 5741 +0.002s ... 0.463s

#13 got single benchmarks 5741 +0.015s ... 0.479s

#14 got avg benchmarks for devices +0s ... 0.479s

#15 No cached benchmark found, getting uncached values +0.113s ... 0.592s

#16 min, max, avg, median took s +0.053s ... 0.645s

#17 before gaming benchmark output +0s ... 0.645s

#18 Got 46 rows for game benchmarks. +0.027s ... 0.672s

#19 composed SQL query for gamebenchmarks +0s ... 0.672s

#20 got data and put it in $dataArray +0.006s ... 0.678s

#21 benchmarks composed for output. +0.04s ... 0.718s

#22 calculated avg scores. +0s ... 0.718s

#23 return log +0.002s ... 0.72s

Please share our article, every link counts!
> Expert Reviews and News on Laptops, Smartphones and Tech Innovations > Benchmarks / Tech > Graphics Card Comparison - Head 2 Head
Redaktion, 2017-09- 8 (Update: 2023-07- 1)