Notebookcheck Logo

Qualcomm Adreno 306 vs Qualcomm Adreno 308 vs Qualcomm Adreno 330

Qualcomm Adreno 306

► remove from comparison Qualcomm Adreno 306

The Qualcomm Adreno 306 is an integrated graphics unit for smartphones and tablets that is used for mainstream SoCs of the Qualcomm Snapdragon 410-series (e.g., Snapdragon 410 MSM8916). According the Qualcomm, the Adreno 306 offers a reduced power consumption compared to the older Adreno 305

The performance looks to be on par with the older Adreno 305 (at least in our review of a HTC Desire 510) leading to the assumtion that the technical specifications should be similar.

Qualcomm Adreno 308

► remove from comparison Qualcomm Adreno 308

The Qualcomm Adreno 308 is an integrated graphics unit for smartphones and tablets that is used for mainstream SoCs of the Qualcomm Snapdragon 425-series. Like the other Adreno 30x GPUs, the Adreno 308 most likely also features 24 ALUs (unified shaders). More information on the architecture of the A3xx series can be found on github.com.

Qualcomm Adreno 330

► remove from comparison Qualcomm Adreno 330

The Qualcomm Adreno 330 is a GPU for smartphones and tablets that is integrated into Qualcomm SoCs. It was introduced in the middle of 2013 and was primarily used for Android devices. The graphics card uses a technology called FlexRender. It can switch "intelligently" switch between TBR (TBR Tile Based Renderer) and the classic direct rendering. It supports OpenGL ES 3.0 and is mostly used in Android based smartphones and tablets.

The graphics clock rate of the Adreno 330 differs from the used SoC where it is built in. It ranges from 450 MHz in the Snapdragon 800 MSM8974, over 550 MHz in the MSM8974AB up to 578 MHz in the Snapdragon 801 MSM8974AC. In addition, there are some architectural changes compared to the former Adreno 320 (e.g. more shader cores).

As a high-end GPU (in 2013) for Android based SoCs, the Adreno 330 is able to cope with even demanding games and high resolution displays. As you can see in our tests benchmarks below, the performance is similar to the PowerVR G6430 in the Apple A7 SoC.

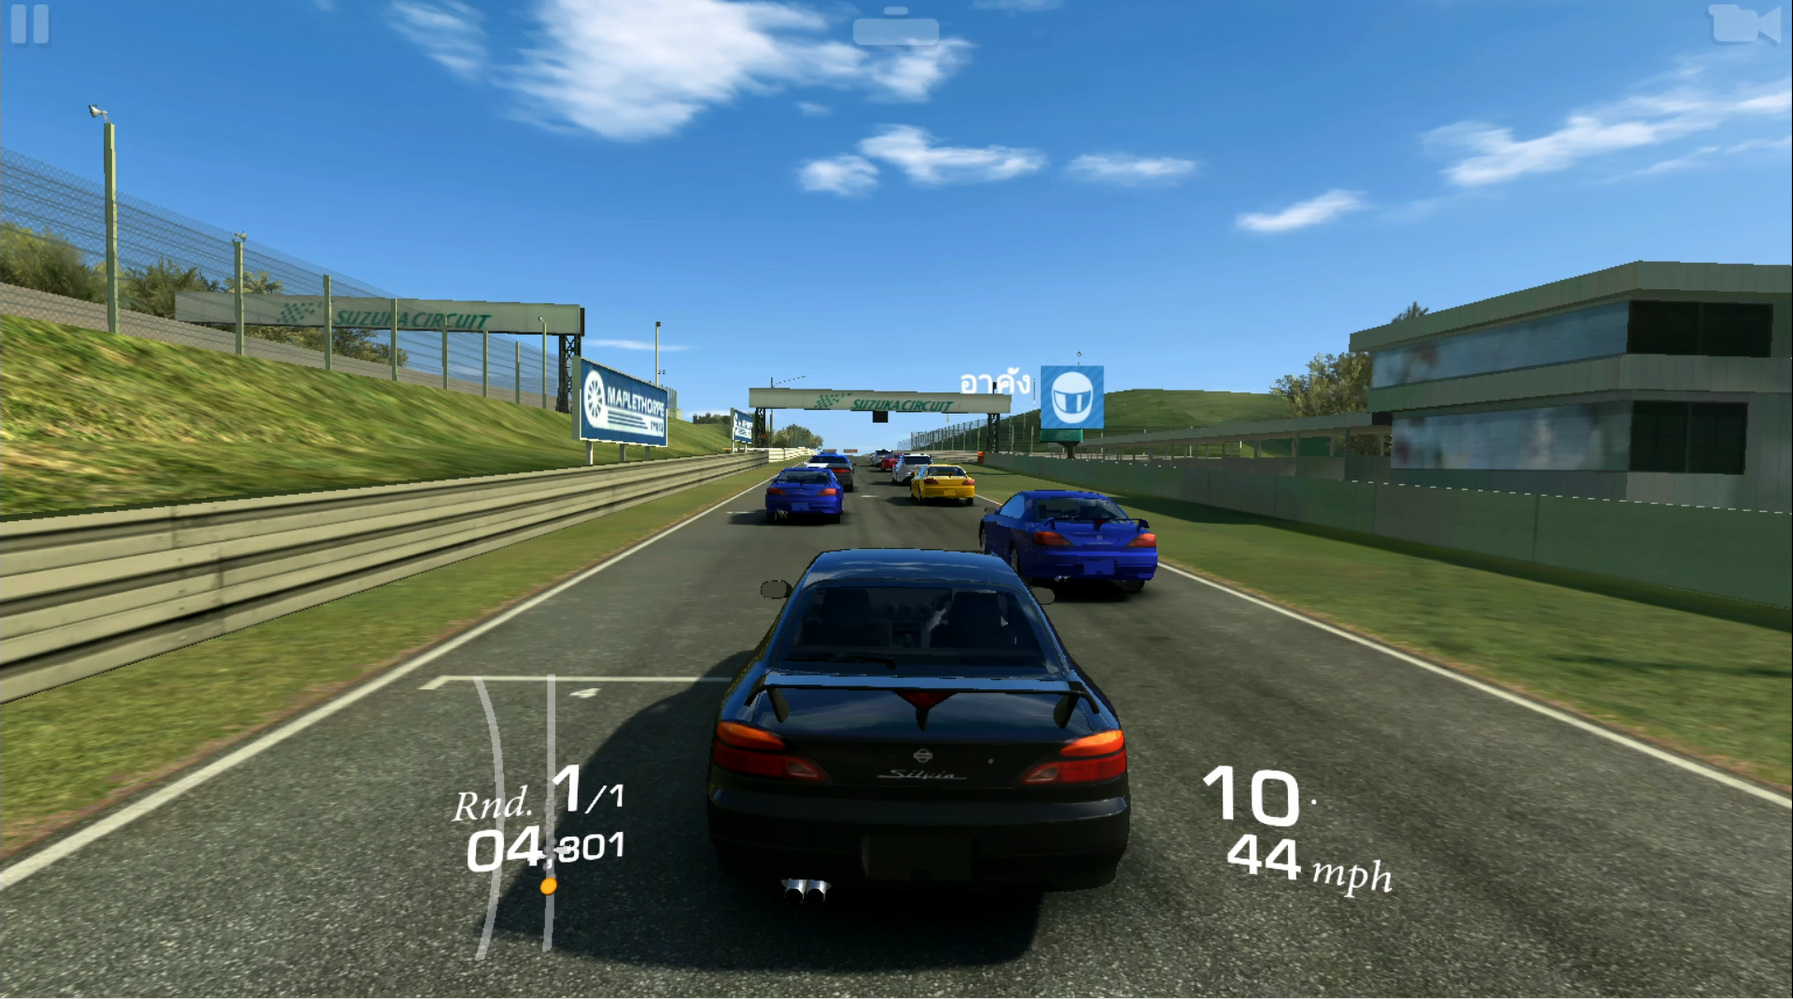
We tested a Snapdragon 800 MSM8974 with a 450 MHz clocked Adreno 330 in a Acer Liquid S2 (see our review). The games run in 1920x1080 on this phablet and are therefore quite demanding.

Real Racing 3 was running quite good on some tracks in "high" settings (set with RR3 Graphics App) and stuttering on other tracks with many cars visible. In medium settings it ran fluently all the time. However battery consumption (25% in 3 races with a total runtime of 45 min) and heat development (max 42°C = 108°F) were quite high.

Fifa 14 and Angry Birds Go were also well playable although there was some slight stuttering visible in both games (may be caused by the game itself). Angry Birds Go also felt like running most of the times in lower fps regions.

The older but still demanding GTA 3 was no problem for the Liquid S2 as were less demanding games like Subway Surf or Temple Run 2. Especially the later two ran in high fps regions.

Qualcomm Adreno 306Qualcomm Adreno 308Qualcomm Adreno 330
Adreno 300 Series
Adreno 330 32 @ 0.45 - 0.58 GHz
Adreno 320 16 @ 0.4 GHz
Adreno 308 6
Adreno 306 6 @ 0.45 GHz
Adreno 305 6 @ 0.45 GHz
Adreno 304 6 @ 0.4 GHz
Adreno 302 6 @ 0.4 GHz
Adreno 330 32 @ 0.45 - 0.58 GHz
Adreno 320 16 @ 0.4 GHz
Adreno 308 6
Adreno 306 6 @ 0.45 GHz
Adreno 305 6 @ 0.45 GHz
Adreno 304 6 @ 0.4 GHz
Adreno 302 6 @ 0.4 GHz
Adreno 330 32 @ 0.45 - 0.58 GHz
Adreno 320 16 @ 0.4 GHz
Adreno 308 6
Adreno 306 6 @ 0.45 GHz
Adreno 305 6 @ 0.45 GHz
Adreno 304 6 @ 0.4 GHz
Adreno 302 6 @ 0.4 GHz
Pipelines6 - unified6 - unified32 - unified
Core Speed450 MHz450 - 578 (Boost) MHz
Shared Memoryyesyesyes
APIDirectX 9.3, OpenGL ES 3.0DirectX 9.3, OpenGL ES 3.0DirectX 9_3, OpenGL ES 3.0
technology28 nm28 nm28 nm
FeaturesOpen CL 1.1e, RenderscriptOpen CL 1.1e, Renderscript
Date of Announcement01.09.2012 11.02.2016 07.01.2013
CPU in Adreno 306GPU Base SpeedGPU Boost / Turbo
Qualcomm Snapdragon 410 MSM89164 x 1400 MHz450 MHz? MHz
Qualcomm Snapdragon 410 APQ80164 x 1200 MHz? MHz? MHz
min. - max.? - 450 MHz? MHz
CPU in Adreno 308GPU Base SpeedGPU Boost / Turbo
Qualcomm Snapdragon 425 (MSM8917)4 x 1400 MHz? MHz? MHz
Qualcomm Snapdragon 2154 x 1300 MHz? MHz? MHz
min. - max.? - 450 MHz? MHz
CPU in Adreno 330GPU Base SpeedGPU Boost / Turbo
Qualcomm Snapdragon 801 MSM8974AC4 x 2450 MHz578 MHz? MHz
Qualcomm Snapdragon 801 APQ8074AB4 x 2360 MHz578 MHz? MHz
Qualcomm Snapdragon 801 MSM8974AB4 x 2360 MHz578 MHz? MHz
min. - max.450 - ? MHz? MHz

Benchmarks

3DMark - 3DMark Ice Storm Unlimited Graphics
min: 2190     avg: 3801     median: 3838 (0%)     max: 4037 Points
min: 10153     avg: 17810     median: 18007 (2%)     max: 22684 Points
min: 7283     avg: 9051     median: 9118 (1%)     max: 10768 Points
min: 10184     avg: 15992     median: 17935 (2%)     max: 21680 Points
3DMark - 3DMark Sling Shot (ES 3.0) Unlimited
min: 185     avg: 191.5     median: 187.5 (1%)     max: 206 Points
974 Points (4%)
3DMark - 3DMark Sling Shot (ES 3.0) Unlimited Graphics
min: 153     avg: 158.8     median: 156 (0%)     max: 170 Points
1030 Points (2%)
3DMark - 3DMark Sling Shot Extreme (ES 3.1) Unlimited
0 Points (0%)
0 Points (0%)
3DMark - 3DMark Sling Shot Extreme (ES 3.1) Unlimited Graphics
0 Points (0%)
GFXBench - GFXBench 5.0 Aztec Ruins High Tier Offscreen
0 fps (0%)
GFXBench - GFXBench 5.0 Aztec Ruins Normal Tier Offscreen
0 fps (0%)
GFXBench - GFXBench Car Chase Offscreen
min:      avg: 0 (0%)     max: 0 fps
GFXBench 3.0 - GFXBench 3.0 Manhattan Offscreen
min: 1.7     avg: 2     median: 1.8 (0%)     max: 4.3 fps
GFXBench (DX / GLBenchmark) 2.7
GFXBench T-Rex HD Offscreen C24Z16 + Qualcomm Adreno 306
GFXBench T-Rex HD Offscreen C24Z16 + Qualcomm Adreno 308
GFXBench T-Rex HD Offscreen C24Z16 + Qualcomm Adreno 330
min: 13     avg: 23.6     median: 24 (0%)     max: 28.1 fps
AnTuTu 3DRating - 3DRating V4.0 for OpenGL ES 2.0
min: 4826     avg: 5231     median: 5231 (39%)     max: 5636 Points
AnTuTu 3DRating - Antutu 3.0 3DRating Score
10143 Points (100%)
AnTuTu v3 - AnTuTu v3 GPU
9637 Points (100%)
Basemark ES 2.0 - Basemark ES 2.0
min: 25.31     avg: 37     median: 37 (61%)     max: 48.73 fps
Basemark X 1.0 - Basemark X 1.0 Off-Screen
min: 11.9     avg: 14.1     median: 14.2 (67%)     max: 15.6 fps
Basemark X 1.1 - Basemark X 1.1 High Quality
min: 1839     avg: 1867     median: 1880 (4%)     max: 1881 Points
min: 8851     avg: 11510     median: 11943 (27%)     max: 12943 Points
Basemark X 1.1 - Basemark X 1.1 Medium Quality
min: 3855     avg: 3993     median: 4014 (9%)     max: 4087 Points
min: 17913     avg: 22815     median: 23230 (52%)     max: 25299 Points
NenaMark2 - NenaMark2 Score
min: 54.6     avg: 57.3     median: 57.3 (85%)     max: 59.9 fps
PassMark PerformanceTest Mobile V1 - PerformanceTest Mobile V1 2D Graphics Tests
min: 2745     avg: 2822     median: 2792 (3%)     max: 2929 Points
PassMark PerformanceTest Mobile V1 - PerformanceTest Mobile V1 3D Graphics Tests
min: 665     avg: 756     median: 791 (1%)     max: 811 Points
min: 3414     avg: 4238     median: 4354 (95%)     max: 4568 Points

Average Benchmarks Qualcomm Adreno 306 → 100% n=5

Average Benchmarks Qualcomm Adreno 308 → 152% n=5

Average Benchmarks Qualcomm Adreno 330 → 543% n=5

- Range of benchmark values for this graphics card
- Average benchmark values for this graphics card
* Smaller numbers mean a higher performance
1 This benchmark is not used for the average calculation

Game Benchmarks

The following benchmarks stem from our benchmarks of review laptops. The performance depends on the used graphics memory, clock rate, processor, system settings, drivers, and operating systems. So the results don't have to be representative for all laptops with this GPU. For detailed information on the benchmark results, click on the fps number.

PUBG Mobile

PUBG Mobile

2018
low
Adreno 308:
22  fps
Arena of Valor

Arena of Valor

2018
low
Adreno 308:
30 31 31 ~ 31 fps
ultra
Adreno 308:
28 30 31 ~ 30 fps
Shadow Fight 3

Shadow Fight 3

2018
low
Adreno 308:
29 41.5 47 ~ 39 fps
high
Adreno 308:
34.5 39 ~ 37 fps
Battle Bay

Battle Bay

2018
high
Adreno 330:
34  fps
Dead Trigger 2

Dead Trigger 2

2013
high
100%
Adreno 306:
30 30 30 30 35 ~ 31 fps
97%
Adreno 308:
30 30 ~ 30 fps
97%
Adreno 330:
27 2392 x 1440 30 32 1920 x 1080 ~ 30 fps
Fifa 14 Mobile Android

Fifa 14 Mobile Android

2013
high
Adreno 330:
29 2392 x 1440 29.4 1920 x 1080 ~ 29 fps
Asphalt 8: Airborne

Asphalt 8: Airborne

2013
low
100%
Adreno 306:
29 31 ~ 30 fps
100%
Adreno 308:
29 30 ~ 30 fps
93%
Adreno 330:
28 2392 x 1440  fps
high
100%
Adreno 306:
14 15 16 16 16 ~ 15 fps
120%
Adreno 308:
18 18 ~ 18 fps
187%
Adreno 330:
27.7 2392 x 1440 28 1920 x 1080 28 29 1920x1080 ~ 28 fps
Gangstar Vegas

Gangstar Vegas

2013
ultra
Adreno 330:
16 2392 x 1440 20.3 1920 x 1080 ~ 18 fps
Real Racing 3

Real Racing 3

2013
low
Adreno 308:
49  fps
high
Adreno 308:
27  fps
Adreno 330:
23 2392 x 1440 28.5 1920x1080  ~ 26 fps
Temple Run 2

Temple Run 2

2013
high
Adreno 308:
54  fps
Adreno 330:
58  59 1440 x 2406 59 1920x1080 ~ 59 fps
Subway Surfers

Subway Surfers

2012
high
Adreno 330:
49 1440 x 2406 56 1920x1080  ~ 53 fps
Grand Theft Auto 3 Android

Grand Theft Auto 3 Android

2011
low
Adreno 330:
24.5 2392 x 1440 27 1920 x 1080 ~ 26 fps
Minecraft - Pocket Edition

Minecraft - Pocket Edition

2011
ultra
Adreno 330:
45 2392 x 1440 57.9 1920 x 1080 ~ 51 fps

Average Gaming Qualcomm Adreno 306 → 100%

Average Gaming 30-70 fps → 100%

Average Gaming Qualcomm Adreno 308 → 106%

Average Gaming Qualcomm Adreno 330 → 126%

Qualcomm Adreno 308lowmed.highultraQHD4K
PUBG Mobile22
Arena of Valor3130
Shadow Fight 33937
Dead Trigger 230
Asphalt 8: Airborne3018
Real Racing 34927
Temple Run 254
< 30 fps
< 60 fps
< 120 fps
≥ 120 fps
1
4


2
3


1


Qualcomm Adreno 330lowmed.highultraQHD4K
Battle Bay34
Dead Trigger 230
Fifa 14 Mobile Android29
Asphalt 8: Airborne2828
Gangstar Vegas18
Real Racing 326
Temple Run 259
Subway Surfers53
Grand Theft Auto 3 Android26
Minecraft - Pocket Edition51
< 30 fps
< 60 fps
< 120 fps
≥ 120 fps
2


3
4

1
1


Qualcomm Adreno 306lowmed.highultraQHD4K
Dead Trigger 231
Asphalt 8: Airborne3015
< 30 fps
< 60 fps
< 120 fps
≥ 120 fps

1


1
1


For more games that might be playable and a list of all games and graphics cards visit our Gaming List

v1.26
log 20. 18:40:00

#0 checking url part for id 5961 +0s ... 0s

#1 checking url part for id 7906 +0s ... 0s

#2 checking url part for id 4683 +0s ... 0s

#3 not redirecting to Ajax server +0s ... 0s

#4 did not recreate cache, as it is less than 5 days old! Created at Fri, 19 Apr 2024 05:40:26 +0200 +0.001s ... 0.001s

#5 composed specs +0.194s ... 0.195s

#6 did output specs +0s ... 0.195s

#7 start showIntegratedCPUs +0s ... 0.195s

#8 getting avg benchmarks for device 5961 +0.043s ... 0.238s

#9 got single benchmarks 5961 +0.066s ... 0.304s

#10 getting avg benchmarks for device 7906 +0.002s ... 0.306s

#11 got single benchmarks 7906 +0.049s ... 0.355s

#12 getting avg benchmarks for device 4683 +0.002s ... 0.357s

#13 got single benchmarks 4683 +0.069s ... 0.426s

#14 got avg benchmarks for devices +0s ... 0.426s

#15 No cached benchmark found, getting uncached values +0.113s ... 0.539s

#16 No cached benchmark found, getting uncached values +0.006s ... 0.544s

#17 No cached benchmark found, getting uncached values +0.006s ... 0.55s

#18 No cached benchmark found, getting uncached values +0.006s ... 0.556s

#19 No cached benchmark found, getting uncached values +0.005s ... 0.561s

#20 No cached benchmark found, getting uncached values +0.003s ... 0.563s

#21 No cached benchmark found, getting uncached values +0.002s ... 0.566s

#22 No cached benchmark found, getting uncached values +0.003s ... 0.569s

#23 No cached benchmark found, getting uncached values +0.003s ... 0.572s

#24 No cached benchmark found, getting uncached values +0.002s ... 0.574s

#25 No cached benchmark found, getting uncached values +0.002s ... 0.576s

#26 min, max, avg, median took s +0.049s ... 0.625s

#27 before gaming benchmark output +0s ... 0.625s

#28 Got 57 rows for game benchmarks. +0.05s ... 0.675s

#29 composed SQL query for gamebenchmarks +0s ... 0.675s

#30 got data and put it in $dataArray +0.007s ... 0.682s

#31 benchmarks composed for output. +0.044s ... 0.726s

#32 calculated avg scores. +0s ... 0.726s

#33 return log +0.002s ... 0.728s

Please share our article, every link counts!
> Expert Reviews and News on Laptops, Smartphones and Tech Innovations > Benchmarks / Tech > Graphics Card Comparison - Head 2 Head
Redaktion, 2017-09- 8 (Update: 2023-07- 1)