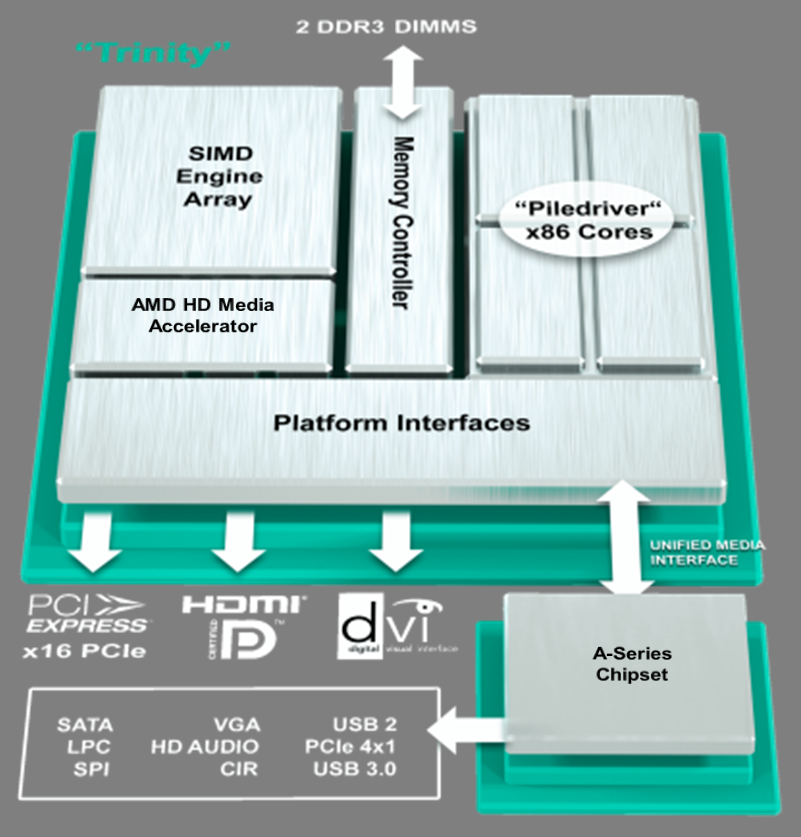
The AMD A6-6400K is a desktop APU from the Richland series. The chip is produced in a 32nm process and integrates 1 module with 2 CPU cores clocked at 3.9 to 4.1 GHz. Furthermore, the 6400K has a Radeon HD 8470D graphics unit and a DDR3-1600 memory controller.
The CPU cores are based on a reworked Bulldozer architecture called Piledriver. Although marketed as a Dual-core processor, the A6-6400K includes only one module with two integer-cores and one floating-point unit in total. As a result, the CPU is not a true dual-core processor.
The CPU performance of the A6-6400K is about on a level of a 2.2 to 2.4 GHz Pentium processor of the Sandy Bridge generation.
The integrated DirectX 11-compatible Radeon HD 8470D offers only 192 of the 384 shader cores of the Richland chip and a core clock of 800 MHz with no Turbo support.
The power consumption of the entire desktop APU is rated at 65 Watts.
The AMD A8-6600K is a desktop APU from the Richland series. The chip is produced in a 32nm process and integrates 2 modules with 4 CPU cores clocked at 3.9 to 4.2 GHz. Furthermore, the 6600K has a Radeon HD 8570D graphics unit and a DDR3-1866 memory controller. Due to the unlocked multiplier, the CPU can overclock very easily. Compared to the previous Trinity generation A10-5800K, the 6600K offers a similar clocked CPU (100 MHz higher base clock) and slightly slower GPU (less cores more clock rate). Otherwise, only small optimizations regarding power and turbo were made.
The CPU cores are based on a reworked Bulldozer architecture called Piledriver. Although marketed as a quad-core processor, the A8-6600K includes only two modules with four integer-cores and two floating-point units in total. As a result, the CPU is not a true quad-core processor.
Due to the similar core clock speed, the CPU performance of the A8-6600K is on a similar level as the old A10-5800K and therefore on average compareable to a Ivy Bridge Core i3 CPUs. The chip shows good performance on applications with high parallelization, whereas performance per thread is less impressive. For everyday tasks like Office, multimedia applications or Internet surfing, the 6600K is suitable without restrictions; even demanding 3D games are possible if paired with a dedicated graphics card.
The integrated DirectX 11-compatible Radeon HD 8570D offers only 256 of the 384 shader cores of the Richland chip and a core clock of 844 MHz with no Turbo support.
The power consumption of the entire desktop APU is rated at 100 Watts.
- Range of benchmark values for this graphics card - Average benchmark values for this graphics card * Smaller numbers mean a higher performance 1 This benchmark is not used for the average calculation
v1.26
log 25. 19:55:54
#0 checking url part for id 4411 +0s ... 0s
#1 checking url part for id 4412 +0s ... 0s
#2 not redirecting to Ajax server +0s ... 0s
#3 did not recreate cache, as it is less than 5 days old! Created at Thu, 25 Apr 2024 05:38:32 +0200 +0.001s ... 0.001s
#4 composed specs +0.019s ... 0.02s
#5 did output specs +0s ... 0.02s
#6 getting avg benchmarks for device 4411 +0.002s ... 0.022s
#7 got single benchmarks 4411 +0.008s ... 0.03s
#8 getting avg benchmarks for device 4412 +0.002s ... 0.032s
#9 got single benchmarks 4412 +0.007s ... 0.039s
#10 got avg benchmarks for devices +0s ... 0.039s
#11 min, max, avg, median took s +0.131s ... 0.169s
 Deutsch
 English
 Español
 Français
 Italiano
 Nederlands
 Polski
 Português
 Русский
 Türkçe
 Svenska
 Chinese
 Magyar