Notebookcheck Logo

AMD A8-5557M vs AMD A6-5357M vs AMD A10-5750M

AMD A8-5557M

► remove from comparison AMD A8-5557M

The AMD A8-5557M is a mobile quad-core processor based on the Richland-architecture. In contrast to the A8-5550M, the 5557M is a BGA version. As successor to the A8-4500M, the A8-5550M/5557M has a slightly higher CPU and graphics performance and settles in the lower middle class. The APU integrates 4 CPU cores, a DirectX 11 graphics unit and the Northbridge along with a DDR3 memory controller.

Compared to Trinity, Richland has been modified just slightly. Therefore, no changes in the feature set or the Pro-MHz performance can be reported. The design of the chip is still based on the Bulldozer architecture, which consists of so-called modules. Each of the two modules integrates 2 integer units, but only one FPU. Just like Trinity, Richland supports nearly all current techniques such as AVX (including FMA), AES or Turbo Core.

According to the clock rates of 2.1 to 3.1 GHz, the A8-5557M should perform about 15 percent slower than the A10-5750M and just reach a Core i3-2310M. Consequently, the performance in current applications and games is sufficient.

The graphics unit called Radeon HD 8550G offers 256 shader units (VLIW4) and clocks slightly higher than the HD 7640G at 554 -  720 MHz. With fast dual-channel memory, performance is expected to match a dedicated Radeon HD 7570M.

The power consumption of the entire APU is rated at 35 watts, which is comparable to conventional middle-class models of competition. Thus, the APU is best suited for 14 inch notebooks or bigger.

AMD A6-5357M

► remove from comparison AMD A6-5357M

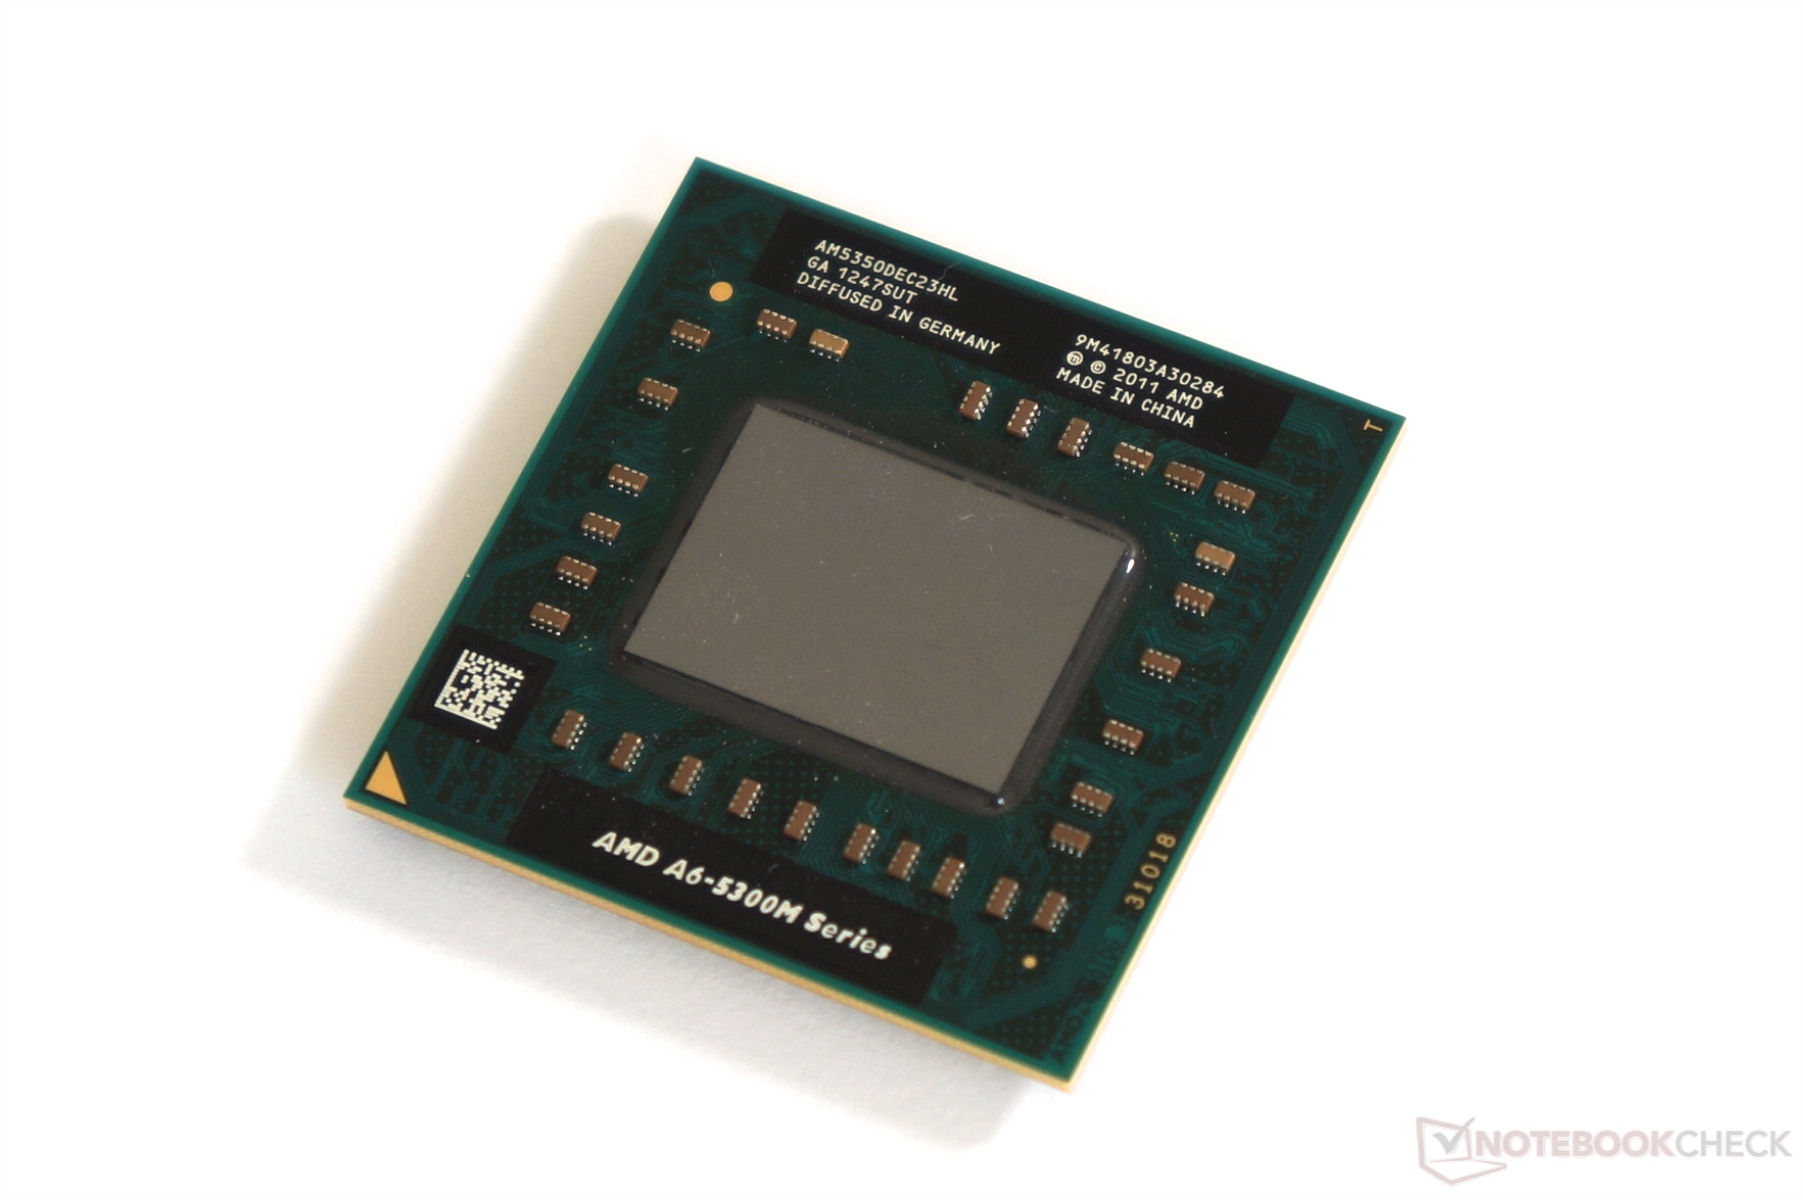
The AMD A6-5357M is a mobile dual-core processor based on the Richland-architecture. In contrast to the A6-5350M, the A6-5357M is a BGA version. As successor to the A6-4400M, the A6-5350M/5357M has a slightly higher CPU and graphics performance and settles in the low end segment. The APU integrates 2 CPU cores, a DirectX 11 graphics unit and the Northbridge along with a DDR3 memory controller.

Compared to Trinity, Richland has been modified just slightly. Therefore, no changes in the feature set or the Pro-MHz performance can be reported. The design of the chip is still based on the Bulldozer architecture, which consists of so-called modules. Each module integrates 2 integer units, but only one FPU. Just like Trinity, Richland supports nearly all current techniques such as AVX (including FMA), AES or Turbo Core.

According to the clock rates of 2.9 to 3.5 GHz, the A6-5357M should perform about 15 percent faster than the A6-4400M and just reach a Pentium P6100. Consequently, the performance in less demanding applications and games is sufficient.

The graphics unit called Radeon HD 8450G offers 192 shader units (VLIW4) and clocks slightly higher than the HD 7520G at 533 - 720 MHz. With fast dual-channel memory, performance is expected to match a dedicated Radeon HD 7470M.

The power consumption of the entire APU is rated at 35 watts, which is comparable to conventional middle-class models of competition. Thus, the APU is best suited for 14 inch notebooks or bigger.

AMD A10-5750M

► remove from comparison AMD A10-5750M

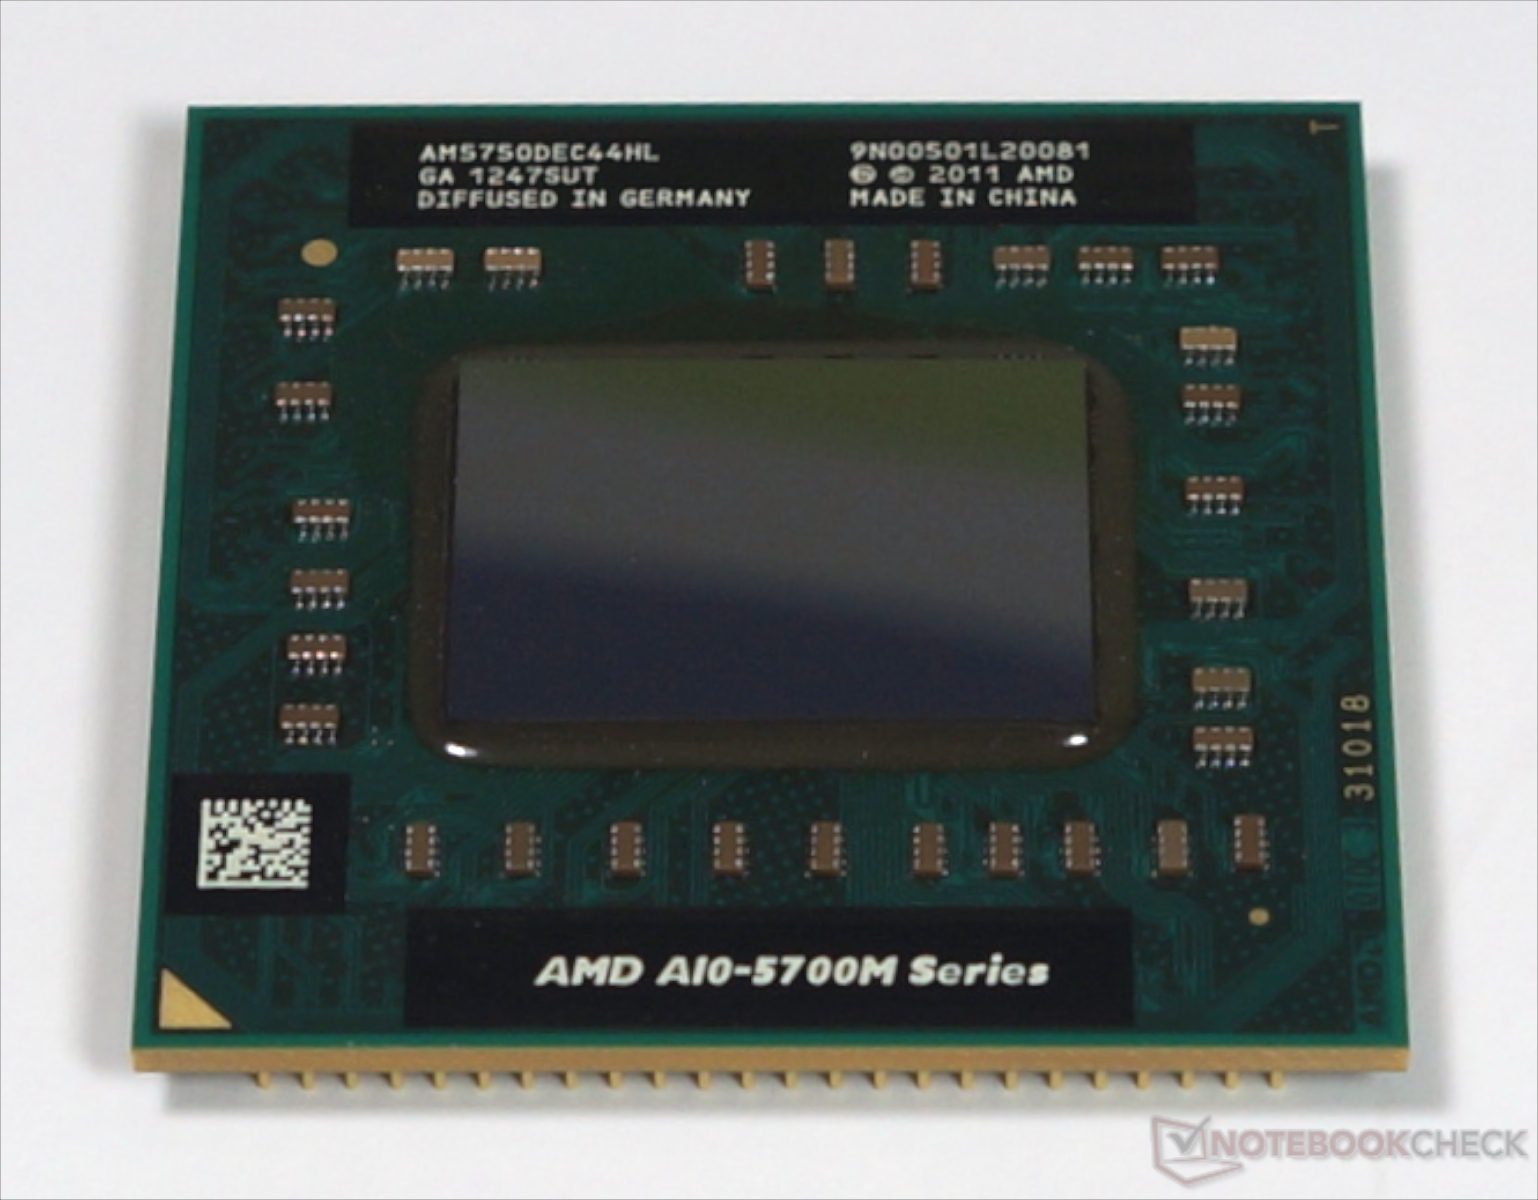
The AMD A10-5750M is a mobile quad-core processor based on the Richland-architecture. As the successor of the A10-4600M, the A10-5750M offers a slightly higher CPU and graphics performance and represents the new top model of the A-series (March 2013).

Compared to Trinity, Richland has been modified just slightly. Therefore, no changes in the feature set or the Pro-MHz performance can be reported. The design of the chip is still based on the Bulldozer architecture, which consists of so-called modules. Each of the two modules integrates 2 integer units, but only one FPU. Just like Trinity, Richland supports nearly all current techniques such as AVX (including FMA), AES or Turbo Core.

Our benchmarks show a performance increase of around 10 percent on the A10-4600M. Thus, the A10-5750M performs at the level of a Core i3-2330M (Sandy Bridge).

The graphics unit called Radeon HD 8650G offers 384 shader units (VLIW4) and clocks at 533 - 720 MHz (slightly higher than the HD 7660G). With fast dual-channel memory, performance is similar to a dedicated HD 7670M.

The power consumption of the entire APU is rated at 35 watts, which is comparable to conventional middle-class models of competition. Thus, the APU is best suited for 14 inch notebooks or bigger.

ModelAMD A8-5557MAMD A6-5357MAMD A10-5750M
SeriesAMD A-SeriesAMD A-SeriesAMD A-Series
CodenameRichlandRichlandRichland
Series: A-Series Richland
AMD A10-5750M2.5 - 3.5 GHz4 / 4 cores
AMD A10-5757M2.5 - 3.5 GHz4 / 4 cores
AMD A10-5745M2.1 - 2.9 GHz4 / 4 cores
AMD A8-5550M2.1 - 3.1 GHz4 / 4 cores
AMD A8-5557M « 2.1 - 3.1 GHz4 / 4 cores
AMD A8-5545M1.7 - 2.7 GHz4 / 4 cores
AMD A6-5350M2.9 - 3.5 GHz2 / 2 cores
AMD A6-5357M2.9 - 3.5 GHz2 / 2 cores
AMD A4-5150M2.7 - 3.3 GHz2 / 2 cores
AMD A6-5345M2.2 - 2.8 GHz2 / 2 cores
AMD A4-5145M2 - 2.6 GHz2 / 2 cores
AMD A10-5750M2.5 - 3.5 GHz4 / 4 cores
AMD A10-5757M2.5 - 3.5 GHz4 / 4 cores
AMD A10-5745M2.1 - 2.9 GHz4 / 4 cores
AMD A8-5550M2.1 - 3.1 GHz4 / 4 cores
AMD A8-5557M2.1 - 3.1 GHz4 / 4 cores
AMD A8-5545M1.7 - 2.7 GHz4 / 4 cores
AMD A6-5350M2.9 - 3.5 GHz2 / 2 cores
AMD A6-5357M « 2.9 - 3.5 GHz2 / 2 cores
AMD A4-5150M2.7 - 3.3 GHz2 / 2 cores
AMD A6-5345M2.2 - 2.8 GHz2 / 2 cores
AMD A4-5145M2 - 2.6 GHz2 / 2 cores
AMD A10-5750M « 2.5 - 3.5 GHz4 / 4 cores
AMD A10-5757M2.5 - 3.5 GHz4 / 4 cores
AMD A10-5745M2.1 - 2.9 GHz4 / 4 cores
AMD A8-5550M2.1 - 3.1 GHz4 / 4 cores
AMD A8-5557M2.1 - 3.1 GHz4 / 4 cores
AMD A8-5545M1.7 - 2.7 GHz4 / 4 cores
AMD A6-5350M2.9 - 3.5 GHz2 / 2 cores
AMD A6-5357M2.9 - 3.5 GHz2 / 2 cores
AMD A4-5150M2.7 - 3.3 GHz2 / 2 cores
AMD A6-5345M2.2 - 2.8 GHz2 / 2 cores
AMD A4-5145M2 - 2.6 GHz2 / 2 cores
Clock2100 - 3100 MHz2900 - 3500 MHz2500 - 3500 MHz
L2 Cache4 MB1 MB4 MB
Cores / Threads4 / 42 / 24 / 4
TDP35 Watt35 Watt35 Watt
Technology32 nm32 nm32 nm
SocketBGABGAFS1r2
FeaturesSSE (1, 2, 3, 3S, 4.1, 4.2, 4A), x86-64, AES, AVX, FMA, DDR3-1600 ControllerSSE (1, 2, 3, 3S, 4.1, 4.2, 4A), x86-64, AES, AVX, FMA, DDR3-1600 ControllerSSE (1, 2, 3, 3S, 4.1, 4.2, 4A), x86-64, AES, AVX, FMA, DDR3-1866 Controller
iGPUAMD Radeon HD 8550G (554 - 720 MHz)AMD Radeon HD 8450G (533 - 720 MHz)AMD Radeon HD 8650G (533 - 720 MHz)
Architecturex86x86x86
Announced

Benchmarks

Performance Rating - CB R15 + R20 + 7-Zip + X265 + Blender + 3DM11 CPU - A10-5750M
18.2 pt (25%)
Cinebench R20 - Cinebench R20 CPU (Single Core)
min: 154     avg: 162.5     median: 162.5 (18%)     max: 171 Points
Cinebench R20 - Cinebench R20 CPU (Multi Core)
min: 428     avg: 434.5     median: 434.5 (1%)     max: 441 Points
Cinebench R15 - Cinebench R15 CPU Multi 64 Bit
min: 198     avg: 207.2     median: 209 (1%)     max: 212 Points
Cinebench R15 - Cinebench R15 CPU Single 64 Bit
min: 72     avg: 75.5     median: 76 (23%)     max: 78.6 Points
Cinebench R11.5 - Cinebench R11.5 CPU Multi 64 Bit
1.9 Points (2%)
min: 2.19     avg: 2.3     median: 2.3 (3%)     max: 2.32 Points
Cinebench R11.5 - Cinebench R11.5 CPU Single 64 Bit
0.8 Points (19%)
min: 0.81     avg: 0.8     median: 0.9 (21%)     max: 0.88 Points
Cinebench R10 - Cinebench R10 Rend. Single (32bit)
2115 Points (13%)
min: 2451     avg: 2549     median: 2579 (16%)     max: 2672 Points
Cinebench R10 - Cinebench R10 Rend. Multi (32bit)
5259 Points (4%)
min: 6114     avg: 6418     median: 6451 (5%)     max: 6633 Points
Cinebench R10 - Cinebench R10 Rend. Multi (64bit)
7373 Points (5%)
min: 8603     avg: 8977     median: 9015 (6%)     max: 9342 Points
Cinebench R10 - Cinebench R10 Rend. Single (64bit)
2871 Points (3%)
min: 3203     avg: 3447     median: 3483 (4%)     max: 3617 Points
wPrime 2.10 - wPrime 2.0 1024m *
903 s (11%)
min: 780     avg: 784     median: 784 (9%)     max: 788 s
wPrime 2.10 - wPrime 2.0 32m *
26.8 s (5%)
min: 22.1     avg: 22.5     median: 22.5 (5%)     max: 22.9 s
WinRAR - WinRAR 4.0
1860 Points (3%)
min: 1992     avg: 2035     median: 2035 (3%)     max: 2078 Points
7-Zip 18.03 - 7-Zip 18.03 Multli Thread 4 runs
min: 7475     avg: 7608     median: 7608 (4%)     max: 7741 MIPS
7-Zip 18.03 - 7-Zip 18.03 Single Thread 4 runs
min: 2948     avg: 2956     median: 2955.5 (35%)     max: 2963 MIPS
X264 HD Benchmark 4.0 - x264 Pass 2
12.4 fps (4%)
min: 15     avg: 15.1     median: 15 (5%)     max: 15.37 fps
X264 HD Benchmark 4.0 - x264 Pass 1
62.5 fps (14%)
min: 75.5     avg: 77.6     median: 76 (18%)     max: 81.2 fps
HWBOT x265 Benchmark v2.2 - HWBOT x265 4k Preset
min: 1.26     avg: 1.7     median: 1.7 (3%)     max: 2.08 fps
TrueCrypt - TrueCrypt Serpent
0.1 GB/s (0%)
min: 0.164     avg: 0.2     median: 0.2 (0%)     max: 0.171 GB/s
TrueCrypt - TrueCrypt Twofish
0.2 GB/s (4%)
min: 0.297     avg: 0.3     median: 0.3 (5%)     max: 0.306 GB/s
TrueCrypt - TrueCrypt AES
1.1 GB/s (3%)
1.5 GB/s (4%)
Blender - Blender 2.79 BMW27 CPU *
2754 Seconds (19%)
R Benchmark 2.5 - R Benchmark 2.5 *
1.5 sec (33%)
3DMark 06 - CPU - 3DMark 06 - CPU
2747 Points (6%)
min: 2464     avg: 3070     median: 3238 (7%)     max: 3273 Points
Super Pi mod 1.5 XS 1M - Super Pi mod 1.5 XS 1M *
31.6 s (7%)
min: 27.97     avg: 28.5     median: 28.1 (6%)     max: 29.67 s
Super Pi mod 1.5 XS 2M - Super Pi mod 1.5 XS 2M *
71.9 s (3%)
min: 63.6     avg: 65     median: 63.9 (3%)     max: 68.8 s
Super Pi Mod 1.5 XS 32M - Super Pi mod 1.5 XS 32M *
1884 s (8%)
min: 1651     avg: 1693     median: 1666.5 (7%)     max: 1788 s
SiSoft Sandra Dhrystone (MIPS) - SiSoft Sandra Dhrystone (MIPS)
29520 MIPS (14%)
min: 32320     avg: 33980     median: 33980 (16%)     max: 35640 MIPS
SiSoft Sandra Whetstone (MFLOPS) - SiSoft Sandra Whetstone (MFLOPS)
21160 MFLOPS (16%)
min: 24800     avg: 24955     median: 24955 (19%)     max: 25110 MFLOPS
3DMark Vantage - 3DM Vant. Perf. CPU no Physx
6116 Points (5%)
min: 5544     avg: 7097     median: 7250 (6%)     max: 7803 Points
3DMark 11 - 3DM11 Performance Physics
2318 Points (6%)
min: 1445     avg: 2482     median: 2658 (7%)     max: 2790 Points
3DMark - 3DMark Ice Storm Physics
21396 Points (17%)
min: 13311     avg: 23944     median: 25232 (21%)     max: 28306 Points
3DMark - 3DMark Ice Storm Extreme Physics
24996 Points (20%)
3DMark - 3DMark Ice Storm Unlimited Physics
29277 Points (25%)
3DMark - 3DMark Cloud Gate Physics
1760 Points (4%)
min: 1008     avg: 1952     median: 2070 (5%)     max: 2326 Points
3DMark - 3DMark Fire Strike Standard Physics
2441 Points (4%)
min: 1488     avg: 2785     median: 2946 (5%)     max: 3230 Points
Geekbench 5.5 - Geekbench 5.1 - 5.4 64 Bit Single-Core
493 Points (21%)
Geekbench 5.5 - Geekbench 5.1 - 5.4 64 Bit Multi-Core
1326 Points (2%)
Geekbench 5.0 - Geekbench 5.0 64 Bit Single-Core
495 Points (2%)
Geekbench 5.0 - Geekbench 5.0 64 Bit Multi-Core
1320 Points (4%)
Geekbench 4.4 - Geekbench 4.1 - 4.4 64 Bit Single-Core
2260 Points (23%)
Geekbench 4.4 - Geekbench 4.1 - 4.4 64 Bit Multi-Core
5292 Points (6%)
Geekbench 4.0 - Geekbench 4.0 64 Bit Single-Core
2175 Points (30%)
Geekbench 4.0 - Geekbench 4.0 64 Bit Multi-Core
4963 Points (12%)
Geekbench 3 - Geekbench 3 32 Bit Multi-Core
3498 Points (6%)
min: 4776     avg: 4787     median: 4787 (8%)     max: 4798 Points
Geekbench 3 - Geekbench 3 32 Bit Single-Core
1591 Points (31%)
min: 1800     avg: 1816     median: 1816 (35%)     max: 1832 Points
Geekbench 2 - 32 Bit - Geekbench Stream
3331 Points (27%)
min: 3865     avg: 4282     median: 4281.5 (35%)     max: 4698 Points
Geekbench 2 - 32 Bit - Geekbench Memory
2913 Points (26%)
min: 3251     avg: 3354     median: 3354 (30%)     max: 3457 Points
Geekbench 2 - 32 Bit - Geekbench Floating Point
5444 Points (11%)
min: 4907     avg: 4926     median: 4925.5 (10%)     max: 4944 Points
Geekbench 2 - 32 Bit - Geekbench Integer
4222 Points (8%)
min: 5469     avg: 5484     median: 5483.5 (11%)     max: 5498 Points
Geekbench 2 - 32 Bit - Geekbench Total Score
4298 Points (11%)
min: 4691     avg: 4742     median: 4741.5 (12%)     max: 4792 Points
Mozilla Kraken 1.1 - Kraken 1.1 Total Score *
2402 ms (3%)
WebXPRT 3 - WebXPRT 3 Score
80.1 Points (17%)

Average Benchmarks AMD A8-5557M → 0% n=

Average Benchmarks AMD A10-5750M → 0% n=

- Range of benchmark values for this graphics card
- Average benchmark values for this graphics card
* Smaller numbers mean a higher performance
1 This benchmark is not used for the average calculation

v1.26
log 19. 12:36:37

#0 checking url part for id 4156 +0s ... 0s

#1 checking url part for id 4157 +0s ... 0s

#2 checking url part for id 4154 +0s ... 0s

#3 not redirecting to Ajax server +0s ... 0s

#4 did not recreate cache, as it is less than 5 days old! Created at Fri, 19 Apr 2024 05:38:49 +0200 +0.001s ... 0.001s

#5 composed specs +0.057s ... 0.058s

#6 did output specs +0s ... 0.058s

#7 getting avg benchmarks for device 4156 +0.003s ... 0.061s

#8 got single benchmarks 4156 +0.009s ... 0.069s

#9 getting avg benchmarks for device 4157 +0.002s ... 0.072s

#10 got single benchmarks 4157 +0s ... 0.072s

#11 getting avg benchmarks for device 4154 +0.018s ... 0.09s

#12 got single benchmarks 4154 +0.028s ... 0.119s

#13 got avg benchmarks for devices +0s ... 0.119s

#14 min, max, avg, median took s +0.282s ... 0.4s

#15 return log +0s ... 0.4s

Please share our article, every link counts!
> Expert Reviews and News on Laptops, Smartphones and Tech Innovations > Benchmarks / Tech > Processor Comparison - Head 2 Head
Redaktion, 2017-09- 8 (Update: 2023-07- 1)