 Deutsch
 English
 Español
 Français
 Italiano
 Nederlands
 Polski
 Português
 Русский
 Türkçe
 Svenska
 Chinese
 Magyar
AMD A6-4400M vs AMD A8-4557M
AMD A6-4400M
► remove from comparison
The AMD A6-4400M is a mobile dual-core processor based on the Trinity architecture. Officially introduced in Q2 2012, it is the direct successor to the Llano A-series of APUs (Accelerated Processing Unit). The processing unit is manufactured in 32nm SOI and integrates a 2.7 GHz CPU (up to 3.2 GHz w/ Turbo Core) with a Radeon HD 7520G GPU alongside a dual-channel memory controller, video de- and encoders and a northbridge.
The CPU cores are based on a reworked Bulldozer architecture, called Piledriver. Although marketed as a dual-core processor, the A6-4400M includes only one module with two integer-cores and one floating-point core. As a result, the CPU is not a true dual-core processor.
When compared to previous Bulldozer cores, AMD has managed to improve upon the IPC (instructions per clock) performance of Trinity cores while allowing for higher clock frequencies. However, when compared to its Llano predecessor, the multithreaded performance of Trinity has only been slightly improved. The enhanced Turbo Core 3.0 feature functions well in speeding up single threaded performance, although it is still not on the same level as Intel’s Turbo Boost equivalent. Regardless, AMD has managed to include other features as well, such as the AVX extension (including FMA) and support for AES encryption.
In terms of raw general performance, the A6-4400M performs similar to the Llano-based A4-3330MX. Single-threaded workloads can especially benefit from the new architecture and the updated Turbo Core functionality. If compared to Intels Pentium-series, the A6-4400M offers less performance in most cases. Nonetheless, CPU performance from the AMD processor should be sufficient for all daily workloads like Office and Internet browsing, but will reach its limits in more demanding applications.
The integrated DirectX 11-compatible Radeon HD 7520G offers only 192 shader cores of the Trinity chip (7660G: 384) and, thanks to Turbo Core, will operate anywhere between 497 to 686 MHz depending on the current application demand. On average, the performance of the HD 7520G GPU should be somewhere between the Llano-based Radeon HD 6620G and the HD Graphics 4000 as found in Intel’s Ivy Bridge.
The power consumption of the A6-4400M APU is rated at 35 Watt TDP and is therefore comparable to dual-core Ivy Bridge processors. Consequently, the A6-4400M is best suited for 14-inch notebooks or larger.
AMD A8-4557M
► remove from comparison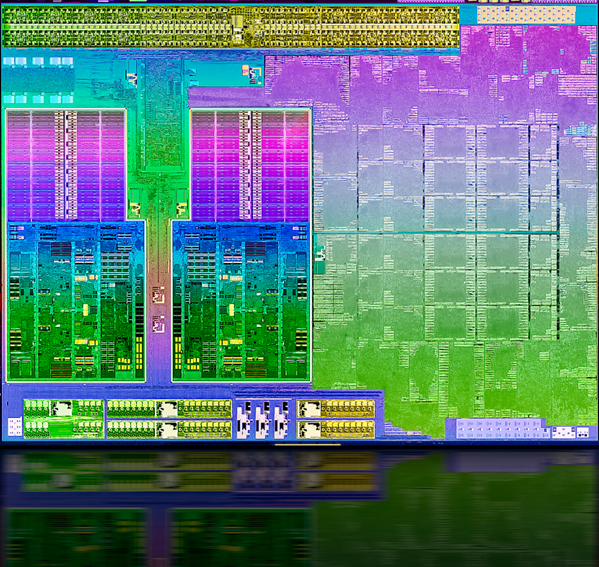
The AMD A8-4557M is a mobile quad-core processor based on the Trinity architecture and the direct successor to the Llano A-series of APUs (Accelerated Processing Unit). The processing unit is manufactured in 32nm SOI and integrates a 1.9 GHz CPU (up to 2.8 GHz w/ Turbo Core) with a relatively fast Radeon HD 7640G GPU alongside a dual-channel memory controller, video decoders and a northbridge. The A8-4557M is the BGA version of the A8-4500M.
The CPU cores are based on a reworked Bulldozer architecture called Piledriver. Although marketed as a quad-core processor, the A8-4557M includes only two modules with four integer-cores and two floating-point cores total. As a result, the CPU is not a true quad-core processor.
When compared to previous Bulldozer cores, AMD has managed to improve upon the IPC (instructions per clock) performance of Trinity cores while allowing for higher clock frequencies. However, when compared to its Llano predecessor, the multithreaded performance of Trinity has only been slightly improved. The enhanced Turbo Core 3.0 feature performs well in speeding up single-threaded applications, although it still underperforms compared to Intel’s Turbo Boost equivalent. Regardless, AMD has managed to include other features as well, such as the AVX extension (including FMA) and support for AES encryption.
In terms of raw general performance, the A8-4557M performs similarly to the Llano-based A8-3500M. Single-threaded workloads can especially benefit from the new architecture and the updated Turbo Core functionality. If compared to Intel's Core-i3 series, the A8-4557M offers less performance in most cases. Nonetheless, CPU performance from the AMD processor should be sufficient for all daily workloads like Office, Internet browsing and even light video editing or gaming.
The integrated DirectX 11-compatible Radeon HD 7640G offers only 256 shader cores of the Trinity chip (7660G: 384) and, thanks to Turbo Core, will operate anywhere between 497 to 686 MHz depending on the current application demand. On average, the performance of the HD 7640G GPU is comparable to a dedicated Radeon HD 7610M and is faster than the HD Graphics 4000 as found on Intel’s Ivy Bridge platform.
The power consumption of the A8-4557M APU is rated at 35 Watt TDP and is therefore comparable to mid-range dual-core Ivy Bridge processors. Consequently, the A8-4557M is best suited for 14-inch notebooks or larger.
| Model | AMD A6-4400M | AMD A8-4557M | ||||||||||||||||||||||||||||||||||||||||||||||||||||||||||||||||||||||||||||||||
| Series | AMD A-Series | AMD A-Series | ||||||||||||||||||||||||||||||||||||||||||||||||||||||||||||||||||||||||||||||||
| Codename | Trinity | Trinity | ||||||||||||||||||||||||||||||||||||||||||||||||||||||||||||||||||||||||||||||||
| Series: A-Series Trinity |
|
| ||||||||||||||||||||||||||||||||||||||||||||||||||||||||||||||||||||||||||||||||
| Clock | 2700 - 3200 MHz | 1900 - 2800 MHz | ||||||||||||||||||||||||||||||||||||||||||||||||||||||||||||||||||||||||||||||||
| L2 Cache | 1 MB | 4 MB | ||||||||||||||||||||||||||||||||||||||||||||||||||||||||||||||||||||||||||||||||
| Cores / Threads | 2 | 4 / 4 | ||||||||||||||||||||||||||||||||||||||||||||||||||||||||||||||||||||||||||||||||
| TDP | 35 Watt | 35 Watt | ||||||||||||||||||||||||||||||||||||||||||||||||||||||||||||||||||||||||||||||||
| Transistors | 1303 Million | 1303 Million | ||||||||||||||||||||||||||||||||||||||||||||||||||||||||||||||||||||||||||||||||
| Technology | 32 nm | 32 nm | ||||||||||||||||||||||||||||||||||||||||||||||||||||||||||||||||||||||||||||||||
| Die Size | 246 mm2 | 246 mm2 | ||||||||||||||||||||||||||||||||||||||||||||||||||||||||||||||||||||||||||||||||
| Features | SSE (1, 2, 3, 3S, 4.1, 4.2, 4A), x86-64, AES, AVX, FMA | SSE (1, 2, 3, 3S, 4.1, 4.2, 4A), x86-64, AES, AVX, FMA | ||||||||||||||||||||||||||||||||||||||||||||||||||||||||||||||||||||||||||||||||
| iGPU | AMD Radeon HD 7520G (496 - 685 MHz) | AMD Radeon HD 7640G (497 - 655 MHz) | ||||||||||||||||||||||||||||||||||||||||||||||||||||||||||||||||||||||||||||||||
| Architecture | x86 | x86 | ||||||||||||||||||||||||||||||||||||||||||||||||||||||||||||||||||||||||||||||||
| Announced | ||||||||||||||||||||||||||||||||||||||||||||||||||||||||||||||||||||||||||||||||||
| Socket | BGA |
