Notebookcheck Logo

Apple A5 vs Broadcom BCM28155 vs Texas Instruments OMAP 4430

Apple A5

► remove from comparison

The Apple A5 is a dual-core processor that contains two Cortex A9 cores. Each core is max. clocked at 900 MHz. Furthermore, the A5 integrates a relative fast PowerVR SGX 543MP2 graphics card and 512MB ram (in the same package for the iPad 2). Apple states a maximum of 2x the performance compared to the previous single core Apple A4.

Broadcom BCM28155

► remove from comparison Broadcom BCM28155

The Broadcom BCM28155 is a Dual-Core Cortex-A9 SoC with an integrated VideoCore-IV graphics card and UMTS/HSPA+ (no LTE). The two ARM Cortex-A9 processor cores run with up to 1.2 GHz. The integrated modem supports UMTS and HSPA+ but no LTE.

Texas Instruments OMAP 4430

► remove from comparison  OMAP 4430

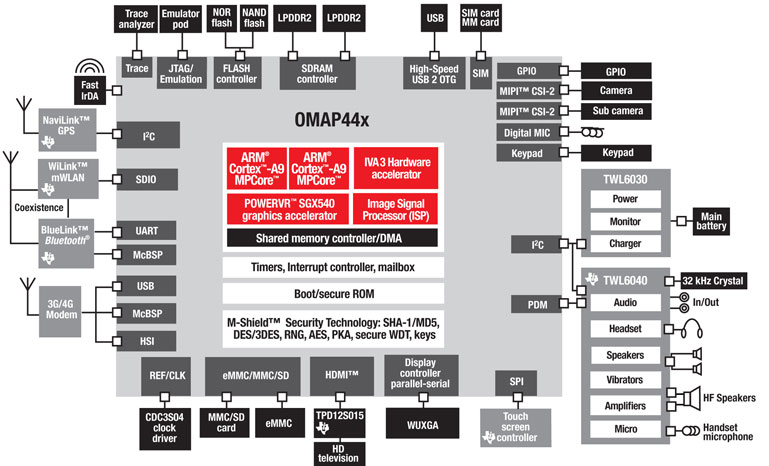
The Texas Instruments (TI) OMAP 4430 is a SoC with two ARM Cortex-A9 cores including NEON SIMD engine, two Cortex M3 cores (to save power), a PowerVR SGX540 graphics card (304-365 MHz) and a dual channel LPDDR2 memory controller (max 400 MHz).

ModelApple A5Broadcom BCM28155Texas Instruments OMAP 4430
SeriesApple Broadcom
CodenameCortex A9Cortex A9Cortex A9
Series: Cortex A9
Texas Instruments OMAP 44701.5 GHz2 / 2 cores Cortex A9
Texas Instruments OMAP 44601.2 GHz2 / 2 cores Cortex A9
Broadcom BCM281551.2 GHz2 / 2 cores Cortex A9
Texas Instruments OMAP 44301 GHz2 / 2 cores Cortex A9
Apple A5x1 GHzcores Cortex A9
Apple A5 « 1 GHzcores Cortex A9
Texas Instruments OMAP 44701.5 GHz2 / 2 cores Cortex A9
Texas Instruments OMAP 44601.2 GHz2 / 2 cores Cortex A9
Broadcom BCM28155 « 1.2 GHz2 / 2 cores Cortex A9
Texas Instruments OMAP 44301 GHz2 / 2 cores Cortex A9
Apple A5x1 GHzcores Cortex A9
Apple A51 GHzcores Cortex A9
Texas Instruments OMAP 44701.5 GHz2 / 2 cores Cortex A9
Texas Instruments OMAP 44601.2 GHz2 / 2 cores Cortex A9
Broadcom BCM281551.2 GHz2 / 2 cores Cortex A9
Texas Instruments OMAP 4430 « 1 GHz2 / 2 cores Cortex A9
Apple A5x1 GHzcores Cortex A9
Apple A51 GHzcores Cortex A9
Clock1000 MHz1200 MHz1000 MHz
Cores / Threads22 / 22 / 2
Technology40, 32 nm40 nm45 nm
ArchitectureARMARMARM
Announced
FeaturesDual Channel LPDDR2 400MHz Memory Controller, VideoCore-IV GPUDual Channel LPDDR 400MHz Memory Controller, IVA 3 Multimedia Accelerator, PowerVR SGX 540 Graphics Core, Image Signal Processor
Manufacturerwww.broadcom.comwww.ti.com
L1 Cache1 MB
TDP0.6 Watt

Benchmarks

Geekbench 2 - 32 Bit - Geekbench Stream
100%
A5 +
min: 297     avg: 317.7     median: 323 (3%)     max: 333 Points
min: 149     avg: 240.5     median: 240.5 (2%)     max: 332 Points
191 Points (2%)
Geekbench 2 - 32 Bit - Geekbench Memory
100%
A5 +
min: 751     avg: 807     median: 833 (8%)     max: 838 Points
min: 731     avg: 738     median: 737.5 (7%)     max: 744 Points
923 Points (8%)
Geekbench 2 - 32 Bit - Geekbench Floating Point
100%
A5 +
min: 737     avg: 855     median: 906 (2%)     max: 923 Points
min: 555     avg: 930     median: 930 (2%)     max: 1305 Points
183 Points (0%)
Geekbench 2 - 32 Bit - Geekbench Integer
100%
A5 +
min: 552     avg: 638     median: 671 (1%)     max: 691 Points
min: 324     avg: 533     median: 533 (1%)     max: 742 Points
449 Points (1%)
Geekbench 2 - 32 Bit - Geekbench Total Score
100%
A5 +
min: 631     avg: 715     median: 750 (2%)     max: 764 Points
min: 468     avg: 679     median: 679 (2%)     max: 890 Points
424 Points (1%)
Linpack Android / IOS - Linpack Multi Thread
100%
A5 +
min: 124.4     avg: 127.1     median: 127.1 (4%)     max: 129.8 MFLOPS
min: 24.39     avg: 52     median: 52 (2%)     max: 79.7 MFLOPS
min: 38.78     avg: 59.5     median: 63.7 (2%)     max: 71.9 MFLOPS
Linpack Android / IOS - Linpack Single Thread
100%
A5 +
min: 78.1     avg: 81.8     median: 81.8 (8%)     max: 85.4 MFLOPS
min: 26.08     avg: 36.2     median: 36.2 (4%)     max: 46.3 MFLOPS
min: 36.48     avg: 40.8     median: 40.6 (4%)     max: 45.39 MFLOPS
Sunspider - Sunspider 0.9.1 Total Score *
100%
A5 +
min: 1557     avg: 1863     median: 1888.5 (18%)     max: 2118 ms
min: 1434     avg: 1701     median: 1701 (16%)     max: 1968 ms
min: 1761     avg: 1955     median: 1895.5 (18%)     max: 2269 ms
Quadrant Standard Edition 2.0 - Quadrant Standard 2.0 Total Score
3909 points (9%)
min: 2475     avg: 2571     median: 2571 (6%)     max: 2666 points
AnTuTu v3 - AnTuTu v3 CPU
min: 1169     avg: 1255     median: 1255 (8%)     max: 1341 Points

Average Benchmarks Apple A5 → 100% n=8

Average Benchmarks Broadcom BCM28155 → 78% n=8

Average Benchmarks Texas Instruments OMAP 4430 → 64% n=8

- Range of benchmark values for this graphics card
- Average benchmark values for this graphics card
* Smaller numbers mean a higher performance
1 This benchmark is not used for the average calculation

v1.26
log 24. 21:13:36

#0 checking url part for id 2331 +0s ... 0s

#1 checking url part for id 3771 +0s ... 0s

#2 checking url part for id 3004 +0s ... 0s

#3 not redirecting to Ajax server +0s ... 0s

#4 did not recreate cache, as it is less than 5 days old! Created at Tue, 23 Apr 2024 05:40:15 +0200 +0.001s ... 0.001s

#5 composed specs +0.129s ... 0.13s

#6 did output specs +0s ... 0.13s

#7 getting avg benchmarks for device 2331 +0.003s ... 0.132s

#8 got single benchmarks 2331 +0.011s ... 0.143s

#9 getting avg benchmarks for device 3771 +0.003s ... 0.146s

#10 got single benchmarks 3771 +0.008s ... 0.154s

#11 getting avg benchmarks for device 3004 +0.003s ... 0.156s

#12 got single benchmarks 3004 +0.012s ... 0.168s

#13 got avg benchmarks for devices +0s ... 0.168s

#14 min, max, avg, median took s +0.053s ... 0.221s

#15 return log +0s ... 0.221s

Please share our article, every link counts!
> Expert Reviews and News on Laptops, Smartphones and Tech Innovations > Benchmarks / Tech > Processor Comparison - Head 2 Head
Redaktion, 2017-09- 8 (Update: 2023-07- 1)