 Deutsch
 English
 Español
 Français
 Italiano
 Nederlands
 Polski
 Português
 Русский
 Türkçe
 Svenska
 Chinese
 Magyar
Apple A13 Bionic vs Intel Core i5-8210Y vs Intel Core i3-10100Y
Apple A13 Bionic
► remove from comparison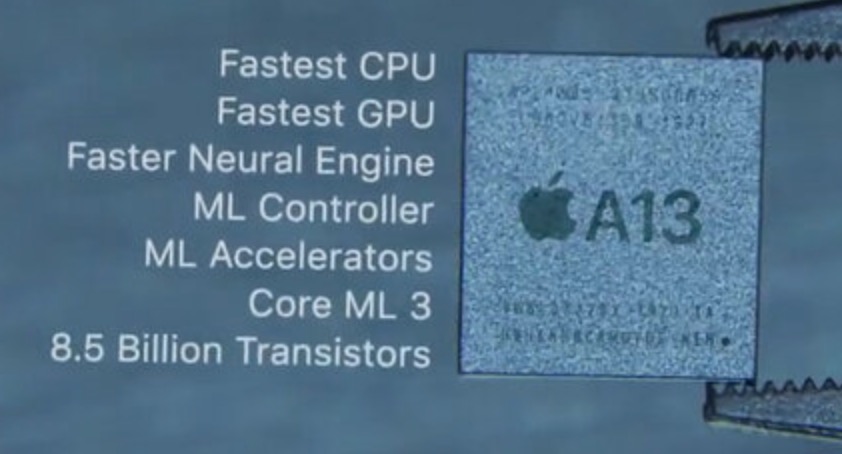
The Apple A13 Bionic is a System on a Chip (SoC) from Apple that is found in the iPhone 11 series. It was announced late 2019 and offers 6 cores divided in 2 performance cores and four power efficiency cores. Compared to the previous A12 Bionic, the A13 should offer a 20% improved CPU performance at 40% lower power (according to Apple).
With 8.5 billion transistors, the A13 Bionic is a big chip especially compared to the Snapdragon 835 (3 Billion) or a Skylake desktop quad-core Soc (1.75 Billion).
Intel Core i5-8210Y
► remove from comparisonThe Intel Core i5-8210Y is a very efficient dual-core SoC for (passively) cooled notebooks based on the Amber Lake generation and was announced on 30th October 2018 with the new MacBook Air. The CPU consists of two processor cores clocked at 1.6 - 3.6 GHz and a TDP of 7 Watt. Thanks to Hyper Threading, the processor can execute up to four threads simultaneously. The chips also includes the Intel HD Graphics 617 GPU, a dual-channel memory controller (DDR3L/LPDDR3) as well as VP9 and H.265 video de- and encoder. Compared to the Kaby Lake-Y predecessors (e.g. Core i7-7Y75), Amber Lake uses the same architecture produced in the improved 14nm+ FinFET process (no 14nm++) but offers higher clock speeds at an increased TDP rating. The Core i5-8200Y is very similar when configured to 7 Watt (cTDP up) and offers even higher Turbo clocks, but a slightly slower GPU (-100 MHz).
Architecture
Intel basically used the familiar micro architecture from the Skylake / Kaby Lake generation, so the per-MHz performance is identical.
Performance
The performance of the Y series is highly depending on the cooling solution of the laptop / tablet and the TDP settings for sustained load. Therefore, the differences between a Core m3 and a i7 may be rather slim, if the thermals are very limited. The high Turbo clock speeds in Amber Lake should however lead to a very good single thread performance for short bursts.
Graphics
The integrated Intel HD Graphics 617 GPU has 24 Execution Units (EUs) like the old HD Graphics 515 and runs with clocks between 300 and 1050 MHz in combination with this processor. The performance heavily depends on the TDP limit as well as the memory configuration; with fast LPDDR3-1866 RAM in dual-channel mode, the GPU should sometimes be able to compete with the HD Graphics 520, but can also be much slower in other scenarios. Modern games from 2016 will, if at all, only run smoothly in the lowest settings.
Contrary to Skylake, Kaby Lake and Amber Lake now also supports hardware decoding for H.265/HEVC Main10 with a 10-bit color depth as well as Google's VP9 codec.
Power Consumption
The chip is manufactured in the 14 nm+ process with FinFET transistors. The typical TDP for the Amber Lake Y-series is specified at 5 Watts, but the i5-8210Y is specified at 7 Watt (for the MacBook Air).
Intel Core i3-10100Y
► remove from comparisonThe Intel Core i3-10100Y is a efficient dual-core SoC for tablets and passively cooled laptops based on the old Amber Lake generation from 2018. It was announced in Q1 2021 and is similar to the old Core i5-8200Y. The only difference is a slightly higher GPU clock (+50 MHz).
The CPU consists of two processor cores clocked at 1.3 - 3.9 GHz. Thanks to Hyper Threading, the processor can execute up to four threads simultaneously. The chips also includes the Intel HD Graphics 615 GPU, a dual-channel memory controller (DDR3L/LPDDR3) as well as VP9 and H.265 video de- and encoder.
Architecture
Intel basically used the familiar micro architecture from the Skylake / Kaby Lake generation, so the per-MHz performance is identical.
Performance
The average 10100Y in our database is just a little ahead of the AMD 3050e, as far as multi-thread benchmark scores are concerned, the latter being an entry-level, dual-core processor of the same energy efficiency based on the Zen architecture. This makes the Core i3 an OK option for basic day-to-day activities, as of mid 2022.
Your mileage may vary depending on how high the CPU power limits are.
Graphics
The integrated Intel UHD Graphics 615 iGPU has 24 Execution Units (EUs) not unlike the older HD Graphics 515 and runs at up to 1,000 MHz. The performance heavily depends on the TDP limit as well as the memory configuration; with fast LPDDR3-1866 RAM in dual-channel mode, the GPU should sometimes be able to compete with the HD Graphics 520, but can also be much slower in other scenarios. Modern games from 2016 will, if at all, only run smoothly in the lowest settings.
Contrary to Skylake, Kaby Lake and Amber Lake now also supports hardware decoding for H.265/HEVC Main10 with a 10-bit color depth as well as Google's VP9 codec.
Power consumption
This little Core i3 here has a default TDP, also known as the long-term power limit, of 5 W that laptop makers are free to change to anything between 3.5 W and 7 W with clock speeds and performance changing accordingly as a result. Either way, the values are low and thus good enough for passively cooled tablets, laptops, mini-PCs and handhelds.
The i3-10100Y is built with one of the old 14 nm Intel manufacturing processes for low, as of early 2023, energy efficiency.
| Model | Apple A13 Bionic | Intel Core i5-8210Y | Intel Core i3-10100Y | ||||||||||||||||||||||||||||||||||||||||||||||||||||||||||||||||||||||||
| Series | Apple Apple A-Series | Intel Amber Lake | Intel Amber Lake | ||||||||||||||||||||||||||||||||||||||||||||||||||||||||||||||||||||||||
| Codename | Lightning and Thunder | Amber Lake-Y | Amber Lake-Y | ||||||||||||||||||||||||||||||||||||||||||||||||||||||||||||||||||||||||
| Clock | <=2660 MHz | 1600 - 3600 MHz | 1300 - 3900 MHz | ||||||||||||||||||||||||||||||||||||||||||||||||||||||||||||||||||||||||
| L1 Cache | 832 KB | 128 KB | 128 KB | ||||||||||||||||||||||||||||||||||||||||||||||||||||||||||||||||||||||||
| L2 Cache | 12 MB | 512 KB | 512 KB | ||||||||||||||||||||||||||||||||||||||||||||||||||||||||||||||||||||||||
| Cores / Threads | 6 / 6 | 2 / 4 | 2 / 4 | ||||||||||||||||||||||||||||||||||||||||||||||||||||||||||||||||||||||||
| Transistors | 6900 Million | ||||||||||||||||||||||||||||||||||||||||||||||||||||||||||||||||||||||||||
| Technology | 7 nm | 14 nm | 14 nm | ||||||||||||||||||||||||||||||||||||||||||||||||||||||||||||||||||||||||
| Features | ARMv8 Instruction Set | Dual-Channel DDR3L-1600/LPDDR3-2133 Memory Controller (16 GB max), HyperThreading, AVX, AVX2, Quick Sync, Virtualization, AES-NI, vPro, TXT | DDR3L-1600/LPDDR3-1866 RAM, PCIe 3, 4 GT/s bus, MMX, SSE, SSE2, SSE3, SSSE3, SSE4.1, SSE4.2, AVX, AVX2, BMI2, ABM, FMA, ADX, VMX, SMEP, SMAP, MPX, EIST, TM1, TM2, HT, Turbo, SST, AES-NI, RDRAND, RDSEED, SGX | ||||||||||||||||||||||||||||||||||||||||||||||||||||||||||||||||||||||||
| iGPU | Apple A13 Bionic GPU | Intel UHD Graphics 617 (300 - 1050 MHz) | Intel UHD Graphics 615 (300 - 1000 MHz) | ||||||||||||||||||||||||||||||||||||||||||||||||||||||||||||||||||||||||
| Architecture | ARM | x86 | x86 | ||||||||||||||||||||||||||||||||||||||||||||||||||||||||||||||||||||||||
| Announced | |||||||||||||||||||||||||||||||||||||||||||||||||||||||||||||||||||||||||||
| Series: Amber Lake Amber Lake-Y |
|
| |||||||||||||||||||||||||||||||||||||||||||||||||||||||||||||||||||||||||
| L3 Cache | 4 MB | 4 MB | |||||||||||||||||||||||||||||||||||||||||||||||||||||||||||||||||||||||||
| TDP | 7 Watt | 5 Watt | |||||||||||||||||||||||||||||||||||||||||||||||||||||||||||||||||||||||||
| max. Temp. | 100 °C | 100 °C | |||||||||||||||||||||||||||||||||||||||||||||||||||||||||||||||||||||||||
| Socket | BGA | BGA1377 | |||||||||||||||||||||||||||||||||||||||||||||||||||||||||||||||||||||||||
| $281 U.S. | |||||||||||||||||||||||||||||||||||||||||||||||||||||||||||||||||||||||||||
| Manufacturer | ark.intel.com | ark.intel.com |

