Notebookcheck Logo

Apple A12X Bionic vs Apple A12 Bionic vs Apple A14 Bionic

Apple A12X Bionic

► remove from comparison Apple A12X Bionic

The Apple A12X Bionic is a System on a Chip (SoC) from Apple that is found in the iPad Pro 11 and 12.5-inch from 2018. It offers 8 cores divided in four performance cores and four power efficiency cores (up from the 6 cores in the A12 of the iPhone XS). Compared to the previous A10X in the old iPad Pro models, Apple advertises up to 95% higher performance of the CPU cores.

The chip also includes a new GPU with 7 cores, the M12 Motion co-processor and a Neural Engine with 8 cores for up to 5 trillion operations per second.

With 10 billion transistors (A12 6.9 billion), the A12X Bionic is a big chip especially compared to the Snapdragon 835 (3 Billion) or a Skylake desktop quad-core Soc (1.75 Billion).

Apple A12 Bionic

► remove from comparison Apple A12 Bionic

The Apple A12 Bionic is a System on a Chip (SoC) from Apple that is found in the iPhone Xs and Xr. It was announced late 2018 and offers 6 cores divided in 2 performance cores and four power efficiency cores. Compared to the previous A11 Bionic, the A12 should offer a 15% improved CPU performance for the performance cores and a 50% lower power consumption for the efficiency cores (both according to Apple).

The chip also includes a new GPU that is advertised as 50% faster, the M12 Motion co-processor and a Neural Engine with 8 cores for up to 5 trillion operations per second.

With 6.9 billion transistors, the A12 Bionic is a big chip especially compared to the Snapdragon 835 (3 Billion) or a Skylake desktop quad-core Soc (1.75 Billion). Compared to the A11, the A12 integrates 60% more transistors.

Apple A14 Bionic

► remove from comparison Apple A14

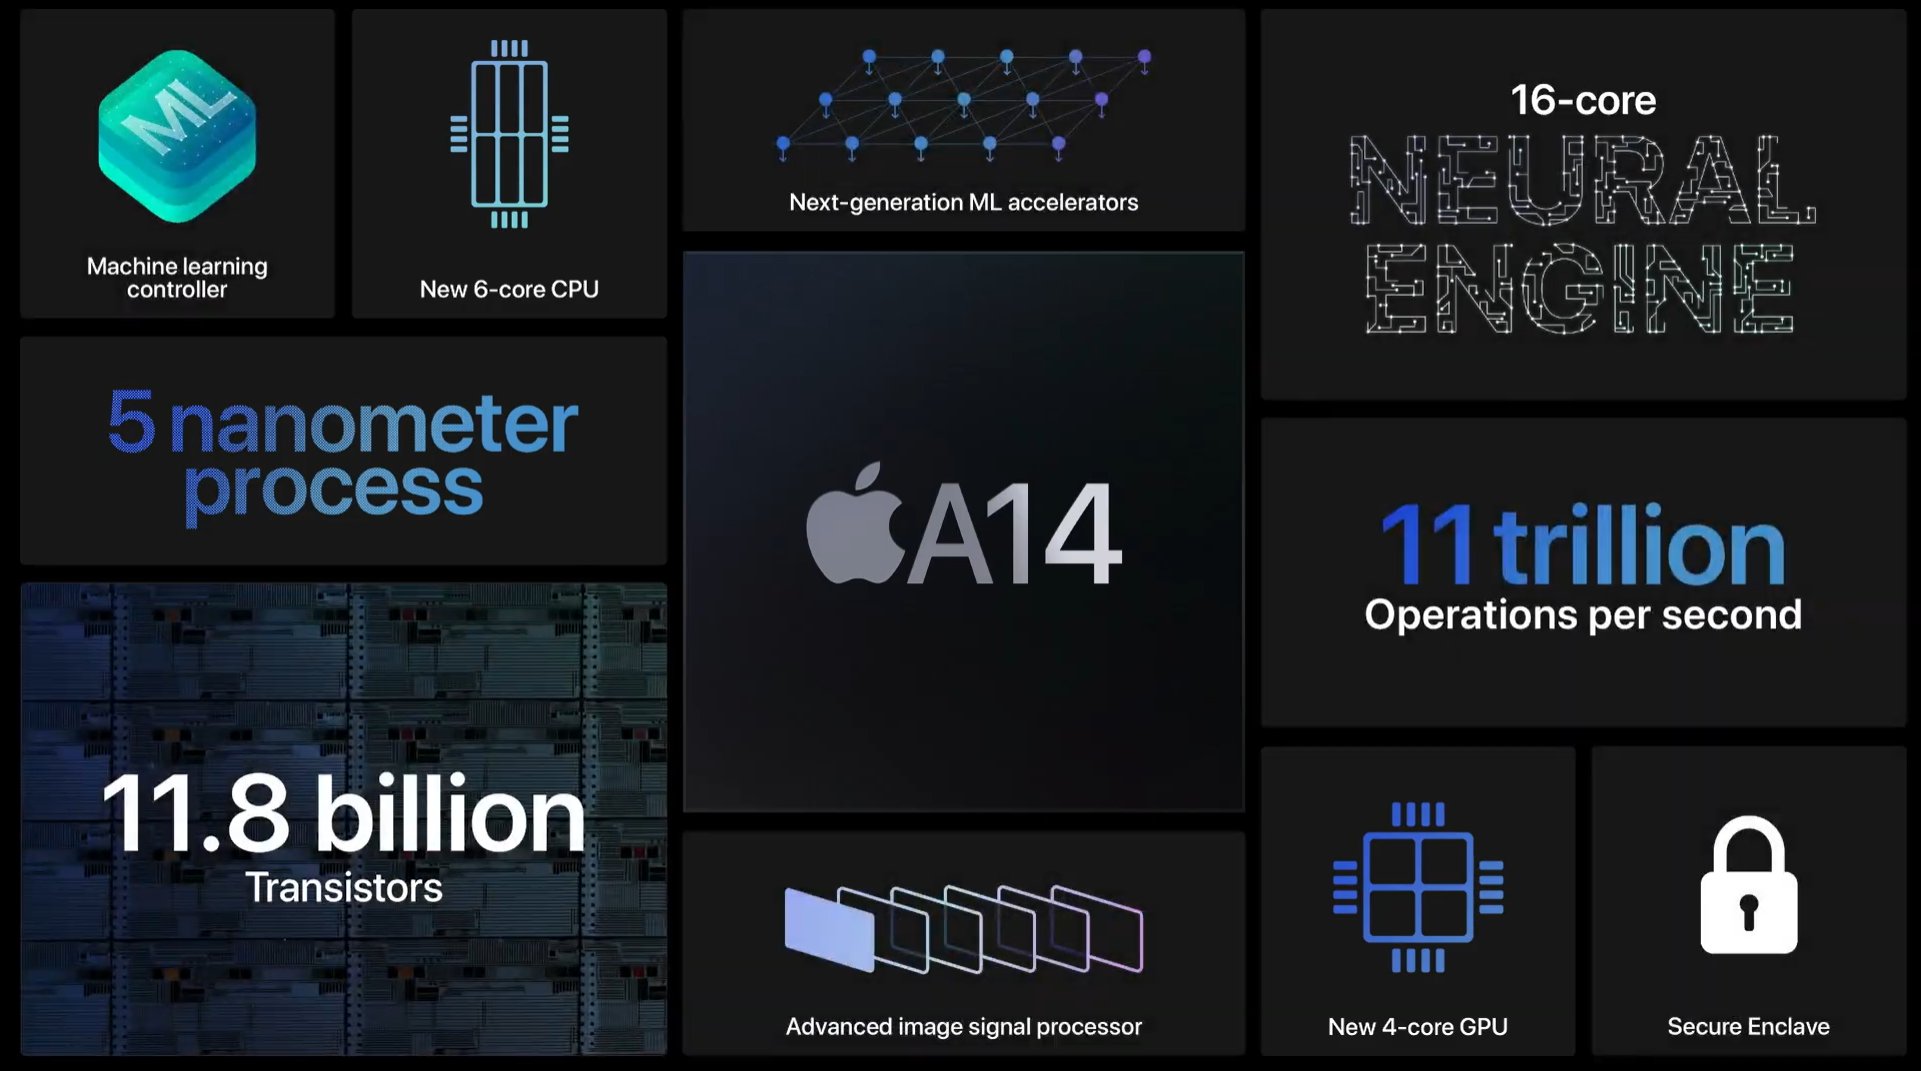
The Apple A14 Bionic is a System on a Chip (SoC) from Apple that is found in the iPhone 12 and iPad Air (2020) models. It was announced late 2020 and offers 6 cores divided in 2 performance cores (Firestorm) and four power efficiency cores (Icestorm). Apple states that the A14 offers a 40 percent higher CPU performance than the old A12 in the iPad Air 2019. That should translate to a modest gain of around 20% compared to the Apple A13. The A14 integrates a fast 4-core-GPU and a 16-core Neural Engine that is able to reach a maximum of 11 TOPS. The memory controller supports LPDDR4X and 4 or 6 GB are directly above the chip (package on package - PoP).

The chip is manufactured in 5nm and integrates 11.8 billion transistors.

ModelApple A12X BionicApple A12 BionicApple A14 Bionic
SeriesApple Apple A-SeriesApple Apple A-SeriesApple Apple A-Series
CodenameVortex, TempestFirestorm / Icestorm
Series: Apple A-Series
Apple A12Z Bionic - 2.49 GHz8 / 8 cores Vortex, Tempest
Apple A12X Bionic « - 2.49 GHz8 / 8 cores Vortex, Tempest
Apple A15 Bionic2.02 - 3.23 GHz6 / 6 cores32 MB L3
Apple A12 Bionic « - 2.49 GHz6 / 6 cores
Clock <=2490 MHz <=2490 MHz1800 - 3100 MHz
L1 Cache2 MB256 KB
L2 Cache8 MB8 MB12 MB
Cores / Threads8 / 86 / 66 / 6
Transistors10000 Million6900 Million11800 Million
Technology7 nm7 nm5 nm
FeaturesARMv8 Instruction SetARMv8 Instruction SetARMv8 Instruction Set, Machine Learning Controller, 16-Core Neural Engine, Secure Enclave, Advanced Image Signal Processor
iGPUApple A12X Bionic GPUApple A12 Bionic GPUApple A14 Bionic GPU
ArchitectureARMARMARM
Announced
L3 Cache16 MB

Benchmarks

3DMark - 3DMark Ice Storm Unlimited Physics
39393 Points (33%)
min: 27400     avg: 27548     median: 27547 (23%)     max: 27717 Points
99%
A14 +
min: 38650     avg: 39042     median: 39161.5 (33%)     max: 39194 Points
3DMark - 3DMark Sling Shot Extreme (ES 3.1) Unlimited Physics
min: 2723     avg: 3064     median: 3056 (36%)     max: 3347 Points
95%
1 A14 +
min: 2631     avg: 2892     median: 2890 (34%)     max: 3187 Points
3DMark - 3DMark Sling Shot (ES 3.0) Unlimited Physics
4700 Points (54%)
65%
A14 +
min: 2622     avg: 2953     median: 3053 (35%)     max: 3084 Points
Geekbench 6.2 - Geekbench 6.2 Single-Core
1313 Points (40%)
Geekbench 6.2 - Geekbench 6.2 Multi-Core
4660 Points (18%)
Geekbench 5.5 - Geekbench 5.1 - 5.4 64 Bit Single-Core
1120 Points (47%)
min: 1116     avg: 1118     median: 1117.5 (47%)     max: 1119 Points
142%
A14 +
min: 1326     avg: 1549     median: 1588.5 (67%)     max: 1604 Points
Geekbench 5.5 - Geekbench 5.1 - 5.4 64 Bit Multi-Core
4620 Points (8%)
min: 2772     avg: 2815     median: 2814.5 (5%)     max: 2857 Points
89%
A14 +
min: 3476     avg: 4019     median: 4093.5 (7%)     max: 4334 Points
Geekbench 5.0 - Geekbench 5.0 64 Bit Single-Core
1114 Points (5%)
1118 Points (5%)
Geekbench 5.0 - Geekbench 5.0 64 Bit Multi-Core
4661 Points (15%)
2910 Points (9%)
Geekbench 4.4 - Geekbench 4.1 - 4.4 64 Bit Single-Core
min: 4984     avg: 4993     median: 4993 (50%)     max: 5002 Points
min: 4750     avg: 4779     median: 4774 (48%)     max: 4824 Points
Geekbench 4.4 - Geekbench 4.1 - 4.4 64 Bit Multi-Core
min: 17691     avg: 17866     median: 17866 (20%)     max: 18041 Points
min: 11244     avg: 11418     median: 11480 (13%)     max: 11598 Points
Mozilla Kraken 1.1 - Kraken 1.1 Total Score *
min: 603     avg: 609     median: 608.5 (1%)     max: 614 ms
min: 603     avg: 627     median: 626.5 (1%)     max: 653 ms
100%
A14 +
min: 459.6     avg: 476.6     median: 462.8 (1%)     max: 547 ms
Sunspider - Sunspider 1.0 Total Score *
114 ms (1%)
100%
1 A14 +
min: 85.6     avg: 85.9     median: 85.9 (1%)     max: 86.1 ms
Octane V2 - Octane V2 Total Score
min: 44425     avg: 45080     median: 45079.5 (41%)     max: 45734 Points
min: 41367     avg: 42312     median: 42333.5 (38%)     max: 43280 Points
130%
A14 +
min: 55710     avg: 58132     median: 58528 (53%)     max: 59963 Points
WebXPRT 4 - WebXPRT 4 Score
100%
1 A14 +
147 Points (42%)
WebXPRT 3 - WebXPRT 3 Score
min: 172     avg: 177     median: 177 (37%)     max: 182 Points
min: 155     avg: 159.5     median: 159.5 (33%)     max: 166 Points
109%
A14 +
min: 191     avg: 196.3     median: 193.5 (40%)     max: 214 Points
AnTuTu v7 - AnTuTu v7 MEM
min: 14010     avg: 14312     median: 14311.5 (44%)     max: 14613 Points
min: 7312     avg: 9998     median: 10135.5 (31%)     max: 12409 Points
AnTuTu v7 - AnTuTu v7 UX
min: 62524     avg: 64951     median: 64950.5 (80%)     max: 67377 Points
min: 59570     avg: 65177     median: 66701 (82%)     max: 67735 Points
AnTuTu v7 - AnTuTu v7 GPU
min: 312218     avg: 317206     median: 317206 (98%)     max: 322193 Points
min: 129473     avg: 147840     median: 151931 (47%)     max: 158023 Points
AnTuTu v7 - AnTuTu v7 CPU
min: 162798     avg: 163060     median: 163060 (100%)     max: 163321 Points
min: 106600     avg: 124761     median: 127986 (78%)     max: 136472 Points
AnTuTu v7 - AnTuTu v7 Total Score
min: 552676     avg: 559527     median: 559527 (99%)     max: 566378 Points
min: 302955     avg: 347775     median: 358800 (63%)     max: 370545 Points
AnTuTu v8 - AnTuTu v8 UX
76371 Points (64%)
min: 71574     avg: 71607     median: 71606.5 (60%)     max: 71639 Points
120%
A14 +
min: 64361     avg: 86794     median: 91444 (76%)     max: 96435 Points
AnTuTu v8 - AnTuTu v8 MEM
63887 Points (52%)
min: 45962     avg: 56767     median: 56767 (46%)     max: 67572 Points
154%
A14 +
min: 83561     avg: 98724     median: 98475 (79%)     max: 113467 Points
AnTuTu v8 - AnTuTu v8 GPU
350192 Points (64%)
min: 166588     avg: 170290     median: 170290 (31%)     max: 173992 Points
69%
A14 +
min: 211292     avg: 242531     median: 240861 (44%)     max: 264957 Points
AnTuTu v8 - AnTuTu v8 CPU
187788 Points (68%)
min: 98561     avg: 122385     median: 122385 (44%)     max: 146209 Points
79%
A14 +
min: 123814     avg: 152893     median: 149088 (54%)     max: 179419 Points
AnTuTu v8 - AnTuTu v8 Total Score
678238 Points (65%)
min: 411764     avg: 421049     median: 421048 (41%)     max: 430333 Points
84%
A14 +
min: 510245     avg: 580942     median: 569468 (55%)     max: 647374 Points
Antutu v9 - AnTuTu v9 Total Score
549549 Points (33%)
129%
1 A14 +
min: 691084     avg: 725392     median: 708280 (43%)     max: 776812 Points
Antutu v9 - AnTuTu v9 CPU
129427 Points (35%)
150%
1 A14 +
min: 189239     avg: 198226     median: 194080 (53%)     max: 211360 Points
PassMark PerformanceTest Mobile V1 - PerformanceTest Mobile V1 CPU Tests
min: 756889     avg: 758432     median: 758432 (100%)     max: 759975 Points
min: 482773     avg: 486852     median: 486197 (64%)     max: 491585 Points
44785 Points (6%)
CrossMark - CrossMark Overall
100%
1 A14 +
min: 987     avg: 1002     median: 1000 (38%)     max: 1022 Points
Power Consumption - Geekbench 5.5 Power Consumption 150cd *
8.5 Watt (4%)
101%
1 A14 +
7.3 Watt (3%)
Power Consumption - Idle Power Consumption 150cd 1min *
2.2 Watt (2%)
99%
1 A14 +
3.1 Watt (3%)

Average Benchmarks Apple A12X Bionic → 100% n=13

Average Benchmarks Apple A12 Bionic → 77% n=13

Average Benchmarks Apple A14 Bionic → 96% n=13

- Range of benchmark values for this graphics card
- Average benchmark values for this graphics card
* Smaller numbers mean a higher performance
1 This benchmark is not used for the average calculation

v1.26
log 20. 00:53:47

#0 checking url part for id 10881 +0s ... 0s

#1 checking url part for id 10166 +0s ... 0s

#2 checking url part for id 12759 +0s ... 0s

#3 not redirecting to Ajax server +0s ... 0s

#4 did not recreate cache, as it is less than 5 days old! Created at Fri, 19 Apr 2024 05:38:49 +0200 +0.001s ... 0.001s

#5 composed specs +0.018s ... 0.019s

#6 did output specs +0s ... 0.019s

#7 getting avg benchmarks for device 10881 +0.002s ... 0.021s

#8 got single benchmarks 10881 +0.009s ... 0.03s

#9 getting avg benchmarks for device 10166 +0.003s ... 0.032s

#10 got single benchmarks 10166 +0.012s ... 0.044s

#11 getting avg benchmarks for device 12759 +0.002s ... 0.046s

#12 got single benchmarks 12759 +0.012s ... 0.059s

#13 got avg benchmarks for devices +0s ... 0.059s

#14 min, max, avg, median took s +0.163s ... 0.222s

#15 return log +0s ... 0.222s

Please share our article, every link counts!
> Expert Reviews and News on Laptops, Smartphones and Tech Innovations > Benchmarks / Tech > Processor Comparison - Head 2 Head
Redaktion, 2017-09- 8 (Update: 2023-07- 1)