Notebookcheck Logo

Apple A12 Bionic vs Apple A10 Fusion vs Apple A13 Bionic

Apple A12 Bionic

► remove from comparison Apple A12 Bionic

The Apple A12 Bionic is a System on a Chip (SoC) from Apple that is found in the iPhone Xs and Xr. It was announced late 2018 and offers 6 cores divided in 2 performance cores and four power efficiency cores. Compared to the previous A11 Bionic, the A12 should offer a 15% improved CPU performance for the performance cores and a 50% lower power consumption for the efficiency cores (both according to Apple).

The chip also includes a new GPU that is advertised as 50% faster, the M12 Motion co-processor and a Neural Engine with 8 cores for up to 5 trillion operations per second.

With 6.9 billion transistors, the A12 Bionic is a big chip especially compared to the Snapdragon 835 (3 Billion) or a Skylake desktop quad-core Soc (1.75 Billion). Compared to the A11, the A12 integrates 60% more transistors.

Apple A10 Fusion

► remove from comparison Apple A10 Fusion

The Apple A10 Fusion is a system on a chip (SoC) from Apple that is built into the iPhone 7 and iPhone 7 Plus. It integrates four 64 Bit cores that are divided in two clusters. Two high performance cores are clocked at up to 2.34 GHz and should be around 40% faster than the Apple A9 (according to Apple) and two low power cores (up to 1.1 GHz?). Up to now its unclear if all four cores can be used at once (that need only 1/5 th of the energy in some use cases). At the release of the iPhone 7 it looks like that IOS is only using two cores at a time and automatically switches between the two clusters. Therefore, apps are seeing only a dual core. The principle is similar to the first generation of ARMs big.LITTLE concept.

The integrated graphics card of the SoC will most likely stem from PowerVR (again) and perform 50% faster at 2/3 of the power consumption (according to Apple). 

All in all the chip includes 3.3 billion transistors, which is more than a current AMD Bristol Ridge (3.1) and Skylake Quad-Core (1.75)  X86 SoCs.

Sources: Apple Keynote, Ars Technica

Apple A13 Bionic

► remove from comparison Apple A13 Bionic

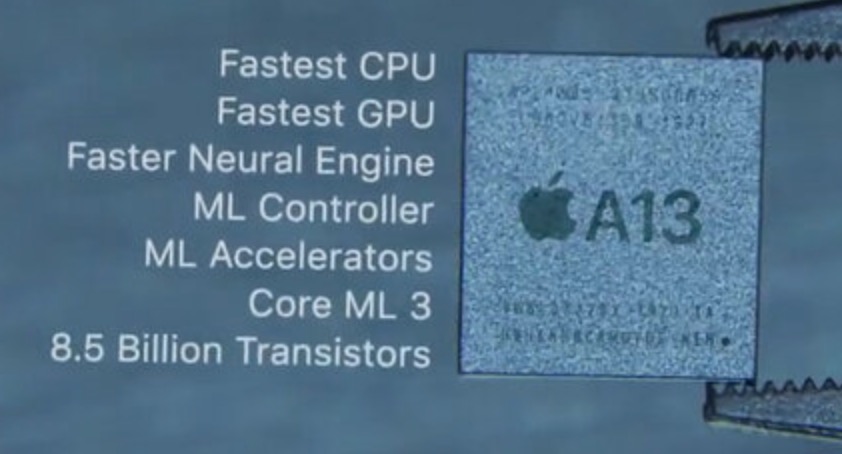
The Apple A13 Bionic is a System on a Chip (SoC) from Apple that is found in the iPhone 11 series. It was announced late 2019 and offers 6 cores divided in 2 performance cores and four power efficiency cores. Compared to the previous A12 Bionic, the A13 should offer a 20% improved CPU performance at 40% lower power (according to Apple).

With 8.5 billion transistors, the A13 Bionic is a big chip especially compared to the Snapdragon 835 (3 Billion) or a Skylake desktop quad-core Soc (1.75 Billion).

ModelApple A12 BionicApple A10 FusionApple A13 Bionic
SeriesApple Apple A-SeriesApple Apple A-SeriesApple Apple A-Series
Series: Apple A-Series
Apple A15 Bionic2.02 - 3.23 GHz6 / 6 cores32 MB L3
Apple A12 Bionic « - 2.49 GHz6 / 6 cores
Clock <=2490 MHz2340 MHz <=2660 MHz
L1 Cache256 KB832 KB
L2 Cache8 MB12 MB
Cores / Threads6 / 64 / 26 / 6
Transistors6900 Million3300 Million6900 Million
Technology7 nm16 nm7 nm
FeaturesARMv8 Instruction SetARMv8 Instruction SetARMv8 Instruction Set
iGPUApple A12 Bionic GPUApple A10 Fusion GPU / PowerVR (900 MHz)Apple A13 Bionic GPU
ArchitectureARMARMARM
Announced
CodenameAPL1021 Hurricane / ZephyrLightning and Thunder

Benchmarks

3DMark - 3DMark Ice Storm Unlimited Physics
min: 27400     avg: 27548     median: 27547 (23%)     max: 27717 Points
min: 9189     avg: 14249     median: 15479 (13%)     max: 15626 Points
min: 33851     avg: 33885     median: 33881 (29%)     max: 33925 Points
3DMark - 3DMark Sling Shot Extreme (ES 3.1) Unlimited Physics
min: 2723     avg: 3064     median: 3056 (36%)     max: 3347 Points
min: 1252     avg: 1437     median: 1434.5 (17%)     max: 1627 Points
min: 2078     avg: 2803     median: 2958 (35%)     max: 3219 Points
3DMark - 3DMark Sling Shot (ES 3.0) Unlimited Physics
min: 2880     avg: 3129     median: 2961 (34%)     max: 3493 Points
min: 1408     avg: 1525     median: 1518 (17%)     max: 1690 Points
min: 3411     avg: 3780     median: 3877 (44%)     max: 4052 Points
Geekbench 5.5 - Geekbench 5.1 - 5.4 64 Bit Single-Core
min: 1116     avg: 1118     median: 1117.5 (47%)     max: 1119 Points
min: 766     avg: 773     median: 777 (33%)     max: 777 Points
min: 1326     avg: 1333     median: 1332 (56%)     max: 1342 Points
Geekbench 5.5 - Geekbench 5.1 - 5.4 64 Bit Multi-Core
min: 2772     avg: 2815     median: 2814.5 (5%)     max: 2857 Points
min: 1361     avg: 1403     median: 1421 (3%)     max: 1426 Points
min: 3235     avg: 3381     median: 3378.5 (6%)     max: 3531 Points
Geekbench 5.0 - Geekbench 5.0 64 Bit Single-Core
1118 Points (5%)
min: 767     avg: 771     median: 771 (3%)     max: 775 Points
min: 1343     avg: 1343     median: 1343 (6%)     max: 1344 Points
Geekbench 5.0 - Geekbench 5.0 64 Bit Multi-Core
2910 Points (9%)
min: 1426     avg: 1429     median: 1429 (5%)     max: 1432 Points
min: 3242     avg: 3427     median: 3463 (11%)     max: 3575 Points
Geekbench 4.4 - Geekbench 4.1 - 4.4 64 Bit Single-Core
min: 4750     avg: 4779     median: 4774 (48%)     max: 4824 Points
min: 2672     avg: 3233     median: 3499 (35%)     max: 3527 Points
Geekbench 4.4 - Geekbench 4.1 - 4.4 64 Bit Multi-Core
min: 11244     avg: 11418     median: 11480 (13%)     max: 11598 Points
min: 4508     avg: 5461     median: 5922 (7%)     max: 5952 Points
Geekbench 4.0 - Geekbench 4.0 64 Bit Single-Core
min: 3476     avg: 3483     median: 3483 (47%)     max: 3490 Points
Geekbench 4.0 - Geekbench 4.0 64 Bit Multi-Core
min: 5585     avg: 5608     median: 5607.5 (14%)     max: 5630 Points
Mozilla Kraken 1.1 - Kraken 1.1 Total Score *
min: 603     avg: 627     median: 626.5 (1%)     max: 653 ms
min: 1026     avg: 1178     median: 1113 (1%)     max: 1531 ms
min: 545     avg: 562     median: 571 (1%)     max: 573 ms
Octane V2 - Octane V2 Total Score
min: 41367     avg: 42312     median: 42333.5 (38%)     max: 43280 Points
min: 19783     avg: 25316     median: 26053 (23%)     max: 27967 Points
min: 47288     avg: 48727     median: 48991 (44%)     max: 49388 Points
WebXPRT 3 - WebXPRT 3 Score
min: 155     avg: 159.5     median: 159.5 (33%)     max: 166 Points
min: 79     avg: 95     median: 95 (20%)     max: 111 Points
min: 146     avg: 179.2     median: 183 (38%)     max: 202 Points
AnTuTu v6 - AnTuTu v6 Total Score
min: 142532     avg: 153966     median: 153966 (52%)     max: 165399 Points
AnTuTu v7 - AnTuTu v7 MEM
min: 7312     avg: 9998     median: 10135.5 (31%)     max: 12409 Points
min: 6141     avg: 9979     median: 10439 (32%)     max: 12895 Points
min: 10494     avg: 12510     median: 12592 (39%)     max: 14443 Points
AnTuTu v7 - AnTuTu v7 UX
min: 59570     avg: 65177     median: 66701 (82%)     max: 67735 Points
min: 32746     avg: 45782     median: 47936.5 (59%)     max: 54510 Points
min: 77118     avg: 77810     median: 78032 (96%)     max: 78279 Points
AnTuTu v7 - AnTuTu v7 GPU
min: 129473     avg: 147840     median: 151931 (47%)     max: 158023 Points
min: 45772     avg: 54850     median: 52519 (16%)     max: 68591 Points
min: 218738     avg: 219891     median: 218937 (68%)     max: 221998 Points
AnTuTu v7 - AnTuTu v7 CPU
min: 106600     avg: 124761     median: 127986 (78%)     max: 136472 Points
min: 50770     avg: 65083     median: 60084.5 (37%)     max: 89394 Points
min: 147281     avg: 149542     median: 148191 (91%)     max: 153154 Points
AnTuTu v7 - AnTuTu v7 Total Score
min: 302955     avg: 347775     median: 358800 (63%)     max: 370545 Points
min: 160578     avg: 175694     median: 165802 (29%)     max: 210596 Points
min: 456891     avg: 459752     median: 459850 (81%)     max: 462516 Points
AnTuTu v8 - AnTuTu v8 UX
min: 71574     avg: 71607     median: 71606.5 (60%)     max: 71639 Points
min: 64361     avg: 75201     median: 78294 (65%)     max: 82947 Points
AnTuTu v8 - AnTuTu v8 MEM
min: 45962     avg: 56767     median: 56767 (46%)     max: 67572 Points
min: 67691     avg: 75819     median: 74262 (60%)     max: 85504 Points
AnTuTu v8 - AnTuTu v8 GPU
min: 166588     avg: 170290     median: 170290 (31%)     max: 173992 Points
min: 190559     avg: 203672     median: 209164 (38%)     max: 211292 Points
AnTuTu v8 - AnTuTu v8 CPU
min: 98561     avg: 122385     median: 122385 (44%)     max: 146209 Points
min: 149088     avg: 156731     median: 152919 (55%)     max: 168185 Points
AnTuTu v8 - AnTuTu v8 Total Score
min: 411764     avg: 421049     median: 421048 (41%)     max: 430333 Points
min: 489463     avg: 511422     median: 510245 (49%)     max: 534558 Points
Antutu v9 - AnTuTu v9 Total Score
549549 Points (33%)
622382 Points (38%)
Antutu v9 - AnTuTu v9 CPU
129427 Points (35%)
147649 Points (40%)
PassMark PerformanceTest Mobile V1 - PerformanceTest Mobile V1 CPU Tests
min: 482773     avg: 486852     median: 486197 (64%)     max: 491585 Points
min: 49294     avg: 49329     median: 49329 (6%)     max: 49364 Points
min: 650706     avg: 678820     median: 683897 (90%)     max: 701856 Points
CrossMark - CrossMark Overall
359 Points (14%)
min: 776     avg: 835     median: 849 (33%)     max: 864 Points
Power Consumption - Geekbench 5.5 Power Consumption 150cd *
7 Watt (3%)
Power Consumption - Idle Power Consumption 150cd 1min *
2.9 Watt (3%)

Average Benchmarks Apple A12 Bionic → 100% n=16

Average Benchmarks Apple A10 Fusion → 58% n=16

Average Benchmarks Apple A13 Bionic → 121% n=16

- Range of benchmark values for this graphics card
- Average benchmark values for this graphics card
* Smaller numbers mean a higher performance
1 This benchmark is not used for the average calculation

v1.26
log 24. 19:00:51

#0 checking url part for id 10166 +0s ... 0s

#1 checking url part for id 8178 +0s ... 0s

#2 checking url part for id 11496 +0s ... 0s

#3 not redirecting to Ajax server +0s ... 0s

#4 did not recreate cache, as it is less than 5 days old! Created at Tue, 23 Apr 2024 05:40:15 +0200 +0.001s ... 0.001s

#5 composed specs +0.027s ... 0.028s

#6 did output specs +0s ... 0.029s

#7 getting avg benchmarks for device 10166 +0.003s ... 0.031s

#8 got single benchmarks 10166 +0.017s ... 0.048s

#9 getting avg benchmarks for device 8178 +0.003s ... 0.051s

#10 got single benchmarks 8178 +0.015s ... 0.066s

#11 getting avg benchmarks for device 11496 +0.003s ... 0.069s

#12 got single benchmarks 11496 +0.016s ... 0.085s

#13 got avg benchmarks for devices +0s ... 0.085s

#14 min, max, avg, median took s +0.197s ... 0.281s

#15 return log +0s ... 0.281s

Please share our article, every link counts!
> Expert Reviews and News on Laptops, Smartphones and Tech Innovations > Benchmarks / Tech > Processor Comparison - Head 2 Head
Redaktion, 2017-09- 8 (Update: 2023-07- 1)