Notebookcheck Logo

Apple A11 Bionic vs Qualcomm Snapdragon 845 vs Qualcomm Snapdragon 850

Apple A11 Bionic

► remove from comparison

The Apple A11 Bionic is a System on a Chip (SoC) from Apple that is found in the iPhone 8, iPhone 8 Plus and iPhone X. It was announced late 2017 and offers 6 cores divided in 2 performance cores and four power efficiency cores. In comparison to the A10X all 6 cores can be used at once, leading to a much higher theoretical performance. In our benchmarks the SoC however is not only faster in multi threaded tests (+77% versus A10 Fusion in Geekbench), but also in single threaded tests (+19%). Apple states 25% more performance compared to the A10 in the iPhone 7.

With 4.3 Billion transistors, the A11 Bionic is a rather big chip especially compared to the Snapdragon 835 (3 Billion) or a Skylake desktop quad-core Soc (1.75 Billion).

Qualcomm Snapdragon 845

► remove from comparison Qualcomm SD 845

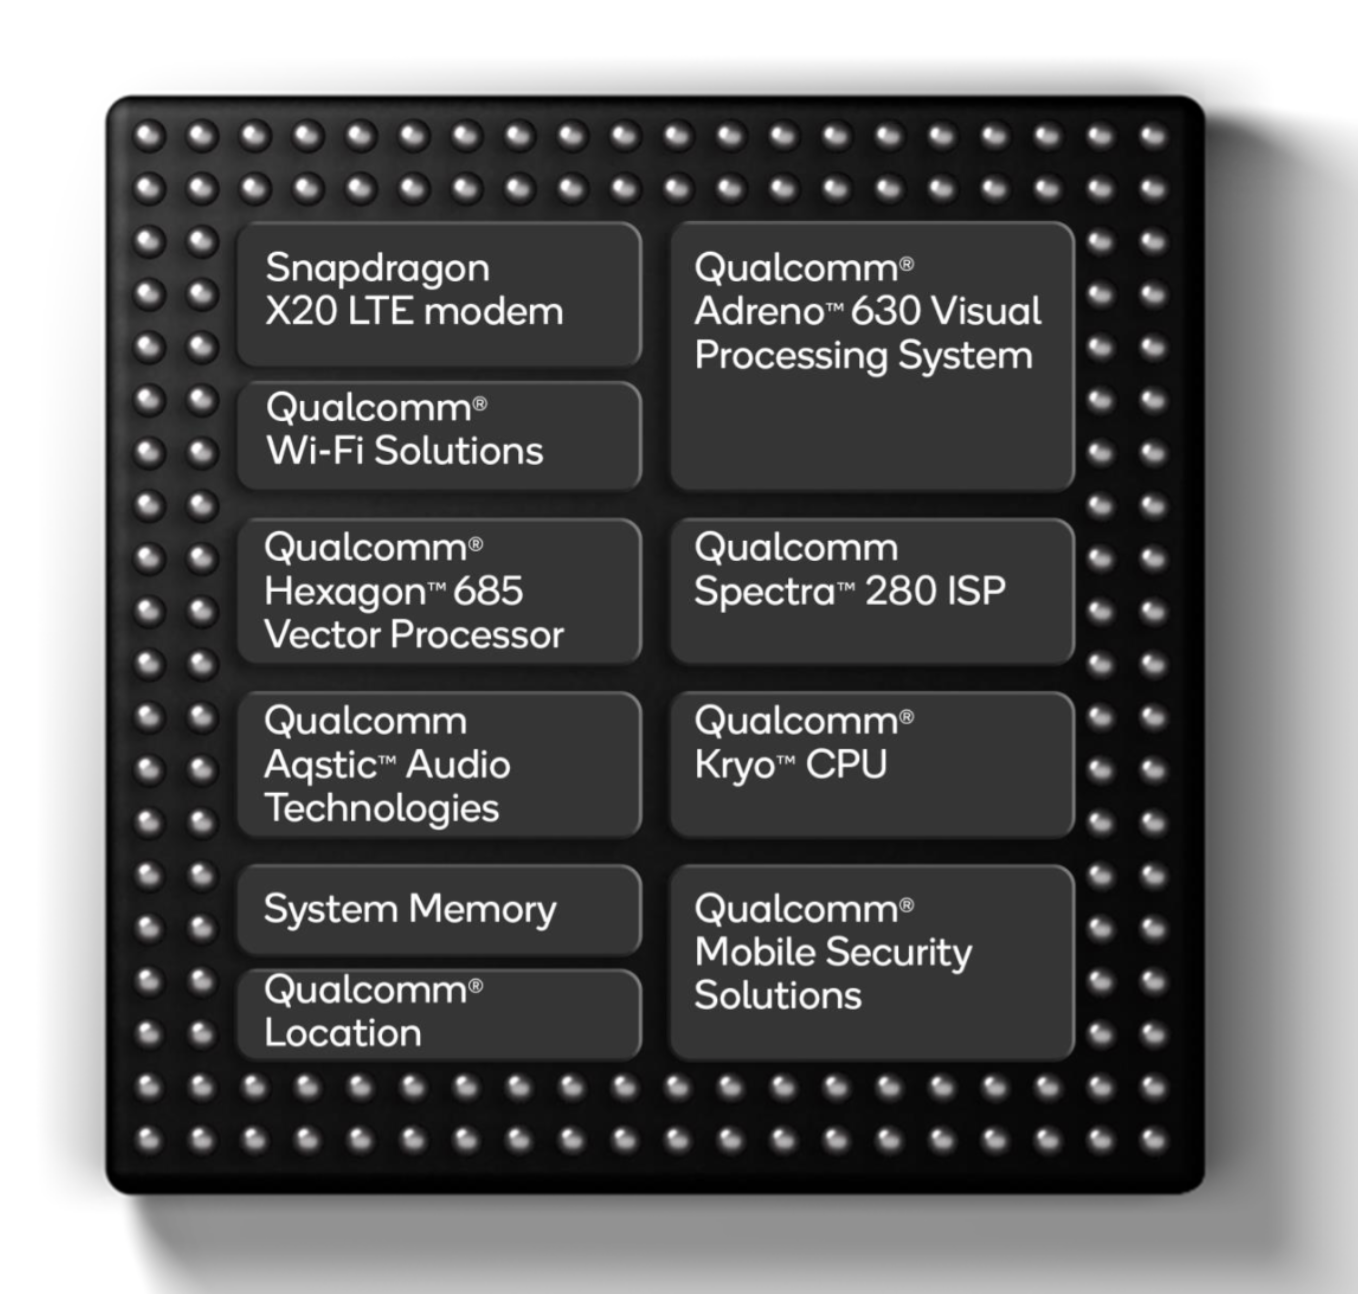
The Qualcomm Snapdragon 845 Mobile Platform (or SD845) is a high-end SoC for smartphones that was introduced in early 2018 and manufactured in 10 nm LPP FinFET at TSMC. Integrates 4x Kryo 385 cores (Cortex-A75) at up to 2.8 GHz (max) for performance and 4x Kryo 385 at 1.8 GHz (max) for efficiency. Furthermore offers an X20 LTE modem (Cat. 18 1.2 Gbps downlink, Cat 13 150 Mbps uplink), ac-WiFi and a dual-channel 32-Bit 1866 MHz LPDDR4x memory controller.

Qualcomm Snapdragon 850

► remove from comparison Qualcomm SD 850

The Qualcomm Snapdragon 850 Mobile Compute Platform (or SD850) is a ARM based SoC for Windows laptops. It is a higher clocked version (3 versus 2.8 GHz) of the Snapdragon 845 for smartphones and also manufactured in 10 nm LPP FinFET at TSMC. It integrates 4x Kryo 385 cores (Cortex-A75) at up to 2.95 GHz (max) for performance and 4x Kryo 385 (at 1.8 GHz?) for efficiency. Furthermore offers an X20 LTE modem (Cat. 18 1.2 Gbps downlink, Cat 13 150 Mbps uplink), ac-WiFi and a dual-channel 32-Bit 1866 MHz LPDDR4x memory controller.

The performance of the Snapdragon 850 in Windows is in theory similar to a Intel Core i5 of the Y-series (e.g. Core i5-7y54). However, this is only the case for native ARM64 compiled applications and games. 32-bit applications that are not compiled for the ARM architecture only run in an emulation and perform much worse (e.g. see Cinebench R11.5 benchmark). 64-bit Intel/AMD apps are not supported at all.

The chip is very power efficient as its produced at TSMC in the modern 10nm LPP process. Therefore, laptops using the Snapdragon 850 can be passively cooled (no fan) and should not throttle under constant load.

ModelApple A11 BionicQualcomm Snapdragon 845Qualcomm Snapdragon 850
SeriesApple Apple A-SeriesQualcomm SnapdragonQualcomm Snapdragon
CodenameMonsoon / MistralCortex-A75 / A55 (Kryo 385)Cortex-A75 / A55 (Kryo 385)
Clock <=2390 MHz2800 MHz2750 - 2960 MHz
L1 Cache64 KB768 KB
L2 Cache8 MB1.5 MB
Cores / Threads6 / 68 / 88 / 8
Transistors4300 Million
Technology10 nm10 nm10 nm
FeaturesARMv8 Instruction SetX20 LTE Modem, Adreno 630 GPUX20 LTE Modem, Adreno 630 GPU
iGPUApple A11 Bionic GPUQualcomm Adreno 630Qualcomm Adreno 630
ArchitectureARMARMARM
Announced
Series: Snapdragon Cortex-A75 / A55 (Kryo 385)
Qualcomm Snapdragon 8502.75 - 2.96 GHz8 / 8 cores2 MB L3 Cortex-A75 / A55 (Kryo 385)
Qualcomm Snapdragon 845 « 2.8 GHz8 / 8 cores2 MB L3 Cortex-A75 / A55 (Kryo 385)
Qualcomm Snapdragon 850 « 2.75 - 2.96 GHz8 / 8 cores2 MB L3 Cortex-A75 / A55 (Kryo 385)
Qualcomm Snapdragon 8452.8 GHz8 / 8 cores2 MB L3 Cortex-A75 / A55 (Kryo 385)
L3 Cache2 MB2 MB
Manufacturerwww.qualcomm.comwww.qualcomm.com

Benchmarks

Performance Rating - Geekbench 5.5, PCM Work, Sling Shot Physics, Antutu v8 CPU - SD 845
0.7 pt (55%)
Cinebench R10 - Cinebench R10 Rend. Single (32bit)
100%
1 SD 850 +
1166 Points (7%)
Cinebench R10 - Cinebench R10 Rend. Multi (32bit)
100%
1 SD 850 +
2284 Points (2%)
wPrime 2.10 - wPrime 2.0 1024m *
100%
1 SD 850 +
1456 s (17%)
wPrime 2.10 - wPrime 2.0 32m *
100%
1 SD 850 +
37 s (7%)
WinRAR - WinRAR 4.0
100%
1 SD 850 +
4745 Points (8%)
X264 HD Benchmark 4.0 - x264 Pass 2
100%
1 SD 850 +
4.9 fps (2%)
X264 HD Benchmark 4.0 - x264 Pass 1
100%
1 SD 850 +
28 fps (6%)
R Benchmark 2.5 - R Benchmark 2.5 *
100%
1 SD 850 +
2.3 sec (51%)
Super Pi mod 1.5 XS 1M - Super Pi mod 1.5 XS 1M *
100%
1 SD 850 +
34 s (7%)
Super Pi mod 1.5 XS 2M - Super Pi mod 1.5 XS 2M *
100%
1 SD 850 +
75 s (3%)
Super Pi Mod 1.5 XS 32M - Super Pi mod 1.5 XS 32M *
100%
1 SD 850 +
1678 s (7%)
3DMark - 3DMark Ice Storm Physics
100%
1 SD 850 +
13397 Points (11%)
3DMark - 3DMark Ice Storm Extreme Physics
100%
1 SD 850 +
12345 Points (10%)
3DMark - 3DMark Ice Storm Unlimited Physics
min: 24131     avg: 25135     median: 25633 (22%)     max: 25641 Points
16059 Points (14%)
3DMark - 3DMark Cloud Gate Physics
100%
1 SD 850 +
1116 Points (3%)
3DMark - 3DMark Fire Strike Standard Physics
100%
1 SD 850 +
2132 Points (4%)
3DMark - 3DMark Sling Shot Extreme (ES 3.1) Unlimited Physics
min: 1854     avg: 2101     median: 2187 (26%)     max: 2262 Points
Geekbench 5.5 - Geekbench 5.1 - 5.4 64 Bit Single-Core
927 Points (39%)
466 Points (20%)
488 Points (21%)
Geekbench 5.5 - Geekbench 5.1 - 5.4 64 Bit Multi-Core
2339 Points (4%)
2012 Points (4%)
1923 Points (3%)
Geekbench 5.0 - Geekbench 5.0 64 Bit Single-Core
935 Points (4%)
54%
1 SD 845 +
501 Points (2%)
Geekbench 5.0 - Geekbench 5.0 64 Bit Multi-Core
2510 Points (8%)
79%
1 SD 845 +
1986 Points (6%)
Geekbench 4.4 - Geekbench 4.1 - 4.4 64 Bit Single-Core
min: 4162     avg: 4230     median: 4263 (43%)     max: 4265 Points
2269 Points (23%)
Geekbench 4.4 - Geekbench 4.1 - 4.4 64 Bit Multi-Core
min: 10255     avg: 10398     median: 10380 (12%)     max: 10558 Points
7118 Points (8%)
Geekbench 4.0 - Geekbench 4.0 64 Bit Single-Core
100%
1 SD 845 +
min: 2490     avg: 2506     median: 2505.5 (34%)     max: 2521 Points
Geekbench 4.0 - Geekbench 4.0 64 Bit Multi-Core
100%
1 SD 845 +
min: 8164     avg: 8174     median: 8174 (20%)     max: 8184 Points
Geekbench 3 - Geekbench 3 64 Bit Multi-Core
100%
1 SD 845 +
min: 8291     avg: 8296     median: 8296 (13%)     max: 8301 Points
Geekbench 3 - Geekbench 3 64 Bit Single-Core
100%
1 SD 845 +
min: 2360     avg: 2379     median: 2378.5 (36%)     max: 2397 Points
Geekbench 2 - 32 Bit - Geekbench Stream
100%
1 SD 845 +
min: 4106     avg: 4114     median: 4114 (33%)     max: 4122 Points
Geekbench 2 - 32 Bit - Geekbench Memory
100%
1 SD 845 +
min: 3970     avg: 4154     median: 4153.5 (38%)     max: 4337 Points
Geekbench 2 - 32 Bit - Geekbench Floating Point
100%
1 SD 845 +
min: 19254     avg: 19347     median: 19346.5 (38%)     max: 19439 Points
Geekbench 2 - 32 Bit - Geekbench Integer
100%
1 SD 845 +
min: 8052     avg: 8077     median: 8077 (16%)     max: 8102 Points
Geekbench 2 - 32 Bit - Geekbench Total Score
100%
1 SD 845 +
min: 10836     avg: 10840     median: 10839.5 (28%)     max: 10843 Points
Mozilla Kraken 1.1 - Kraken 1.1 Total Score *
min: 718     avg: 723     median: 720 (1%)     max: 731 ms
min: 2154     avg: 2905     median: 2384.5 (3%)     max: 11204 ms
2836 ms (3%)
Sunspider - Sunspider 1.0 Total Score *
149 ms (2%)
97%
1 SD 845 +
451 ms (5%)
Octane V2 - Octane V2 Total Score
min: 34163     avg: 34876     median: 35209 (32%)     max: 35255 Points
min: 3991     avg: 15153     median: 16369.5 (15%)     max: 18275 Points
13947 Points (13%)
WebXPRT 3 - WebXPRT 3 Score
130 Points (27%)
75%
1 SD 845 +
min: 19     avg: 90.2     median: 97 (20%)     max: 103 Points
AnTuTu v6 - AnTuTu v6 Total Score
min: 197851     avg: 206760     median: 204270 (70%)     max: 218158 Points
AnTuTu v7 - AnTuTu v7 MEM
11107 Points (34%)
AnTuTu v7 - AnTuTu v7 UX
50699 Points (62%)
AnTuTu v7 - AnTuTu v7 GPU
94618 Points (29%)
AnTuTu v7 - AnTuTu v7 CPU
99873 Points (61%)
AnTuTu v7 - AnTuTu v7 Total Score
256297 Points (45%)
AnTuTu v8 - AnTuTu v8 UX
100%
1 SD 845 +
46667 Points (39%)
AnTuTu v8 - AnTuTu v8 MEM
100%
1 SD 845 +
44476 Points (36%)
AnTuTu v8 - AnTuTu v8 GPU
100%
1 SD 845 +
111126 Points (20%)
AnTuTu v8 - AnTuTu v8 CPU
100%
1 SD 845 +
82538 Points (30%)
AnTuTu v8 - AnTuTu v8 Total Score
100%
1 SD 845 +
284807 Points (27%)
PassMark PerformanceTest Mobile V1 - PerformanceTest Mobile V1 CPU Tests
min: 447370     avg: 452346     median: 453409 (60%)     max: 456258 Points
54%
1 SD 845 +
min: 244130     avg: 244932     median: 244932 (32%)     max: 245734 Points

Average Benchmarks Apple A11 Bionic → 100% n=7

Average Benchmarks Qualcomm Snapdragon 845 → 80% n=7

Average Benchmarks Qualcomm Snapdragon 850 → 65% n=7

- Range of benchmark values for this graphics card
- Average benchmark values for this graphics card
* Smaller numbers mean a higher performance
1 This benchmark is not used for the average calculation

v1.26
log 20. 02:31:28

#0 checking url part for id 9250 +0s ... 0s

#1 checking url part for id 9958 +0s ... 0s

#2 checking url part for id 11391 +0s ... 0s

#3 not redirecting to Ajax server +0s ... 0s

#4 did not recreate cache, as it is less than 5 days old! Created at Fri, 19 Apr 2024 05:38:49 +0200 +0.001s ... 0.001s

#5 composed specs +0.035s ... 0.036s

#6 did output specs +0s ... 0.036s

#7 getting avg benchmarks for device 9250 +0.003s ... 0.039s

#8 got single benchmarks 9250 +0.013s ... 0.052s

#9 getting avg benchmarks for device 9958 +0.019s ... 0.07s

#10 got single benchmarks 9958 +0.062s ... 0.132s

#11 getting avg benchmarks for device 11391 +0.003s ... 0.135s

#12 got single benchmarks 11391 +0.009s ... 0.144s

#13 got avg benchmarks for devices +0s ... 0.144s

#14 min, max, avg, median took s +0.278s ... 0.422s

#15 return log +0s ... 0.422s

Please share our article, every link counts!
> Expert Reviews and News on Laptops, Smartphones and Tech Innovations > Benchmarks / Tech > Processor Comparison - Head 2 Head
Redaktion, 2017-09- 8 (Update: 2023-07- 1)