 Deutsch
 English
 Español
 Français
 Italiano
 Nederlands
 Polski
 Português
 Русский
 Türkçe
 Svenska
 Chinese
 Magyar
AllWinner A10 vs Texas Instruments OMAP 3622
AllWinner A10
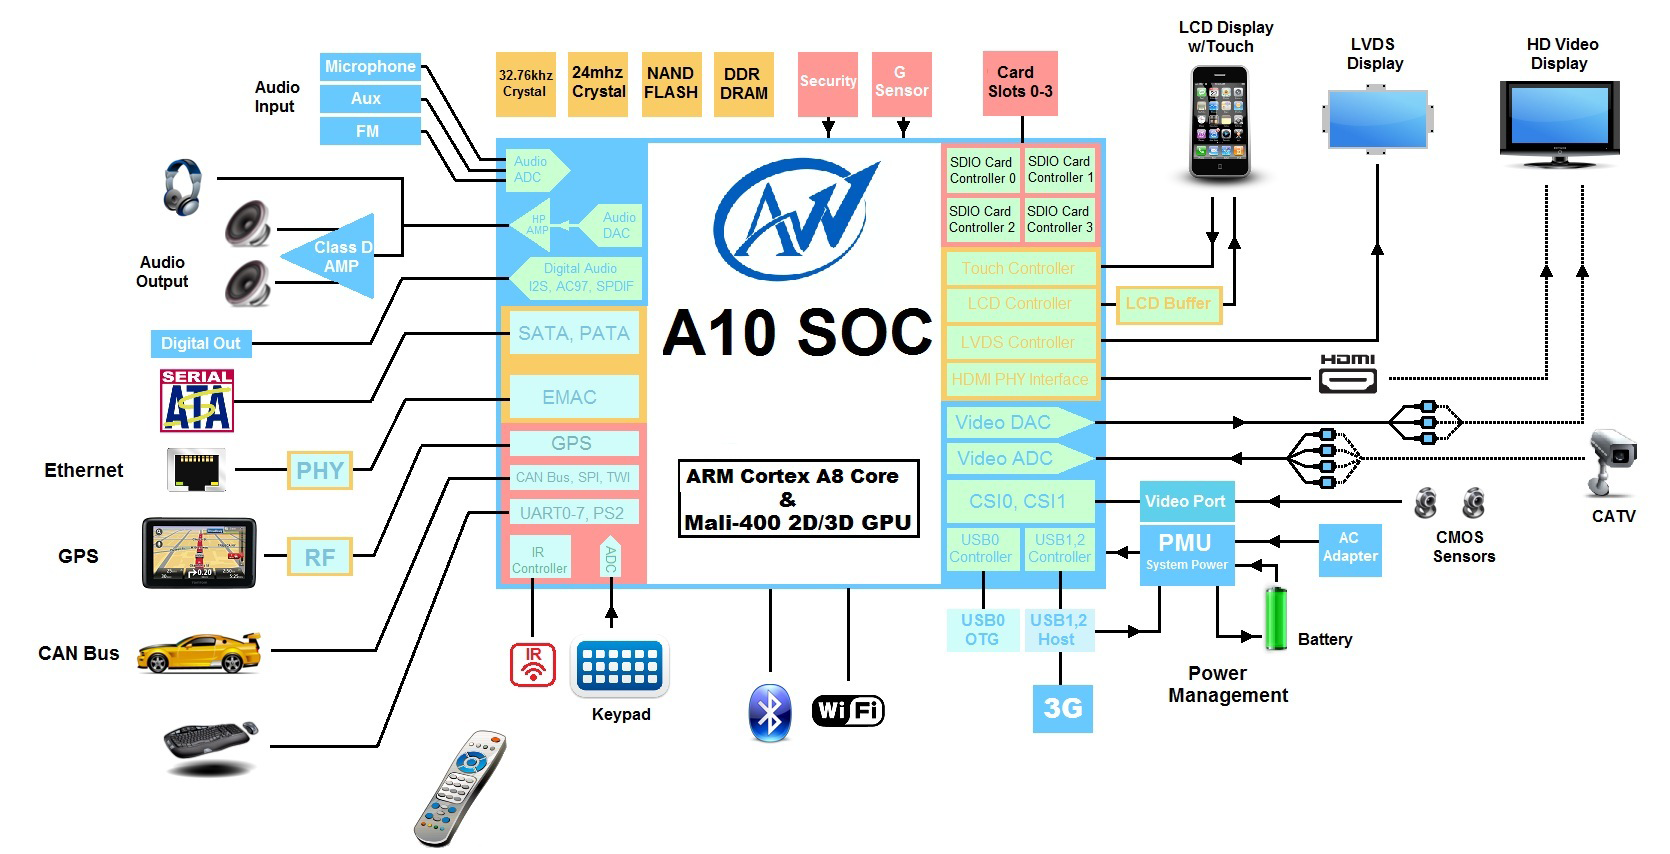
The AllWinner A10 is a cheap SoC for smartphones and tablets of 2012. It contains a 1.2 GHz ARM Cortex A8 core (ARMv7), a ARM Mali 400 (single core) graphics card and a video processing unit. It is produced in 55nm and mostly used for systems using Android or Linux.
Specifications (from Wikipedia):
Video Processing Unit
- HD Video Decoding (Super HD 2160P/3D Film)
- Support all popular video formats, including VP8, AVS, H.264 MVC, VC-1, MPEG-1/2/4
- HD Video Encoding (H.264 High Profile)
- Support encoding in H.264 format
Digital processing Unit
- Multi-channel HD displays
- Built-in HDMI
- YPbPr, CVBS, VGA
- LCD interfaces: CPU, RGB, LVDS up to Full 1080P HDTV
Memory
- DDR2/DDR3 SDRAM, 32-bit
- SLC/MLC/TLC/DDR NAND
Connectivity
- USB 2.0
- CSI, TS
- SD Card 3.0
- 10/100 Ethernet controller
- CAN bus, (A10 only)[5] Built-in SATA 2.0 Interface
- I²C, SPDIF and AC97 audio interfaces
- PS2, SPI , TWI and UART
Storage and boot devices
Texas Instruments OMAP 3622
► remove from comparison| Model | AllWinner A10 | Texas Instruments OMAP 3622 | ||||||||||||||||||||||||||||||||||||||||
| Series | ||||||||||||||||||||||||||||||||||||||||||
| Codename | Cortex A8 | Cortex A8 | ||||||||||||||||||||||||||||||||||||||||
| Series: Cortex A8 |
|
| ||||||||||||||||||||||||||||||||||||||||
| Clock | 1200 MHz | 1000 MHz | ||||||||||||||||||||||||||||||||||||||||
| Cores / Threads | 1 / 1 | 1 / 1 | ||||||||||||||||||||||||||||||||||||||||
| Technology | 55 nm | 45 nm | ||||||||||||||||||||||||||||||||||||||||
| Architecture | ARM | ARM | ||||||||||||||||||||||||||||||||||||||||
| Announced | ||||||||||||||||||||||||||||||||||||||||||
| Manufacturer | www.allwinner.com |

Benchmarks
102 Points (1%)