Notebookcheck Logo

Apple A10 Fusion vs Apple A9

Apple A10 Fusion

► remove from comparison Apple A10 Fusion

The Apple A10 Fusion is a system on a chip (SoC) from Apple that is built into the iPhone 7 and iPhone 7 Plus. It integrates four 64 Bit cores that are divided in two clusters. Two high performance cores are clocked at up to 2.34 GHz and should be around 40% faster than the Apple A9 (according to Apple) and two low power cores (up to 1.1 GHz?). Up to now its unclear if all four cores can be used at once (that need only 1/5 th of the energy in some use cases). At the release of the iPhone 7 it looks like that IOS is only using two cores at a time and automatically switches between the two clusters. Therefore, apps are seeing only a dual core. The principle is similar to the first generation of ARMs big.LITTLE concept.

The integrated graphics card of the SoC will most likely stem from PowerVR (again) and perform 50% faster at 2/3 of the power consumption (according to Apple). 

All in all the chip includes 3.3 billion transistors, which is more than a current AMD Bristol Ridge (3.1) and Skylake Quad-Core (1.75)  X86 SoCs.

Sources: Apple Keynote, Ars Technica

Apple A9

► remove from comparison Apple A9

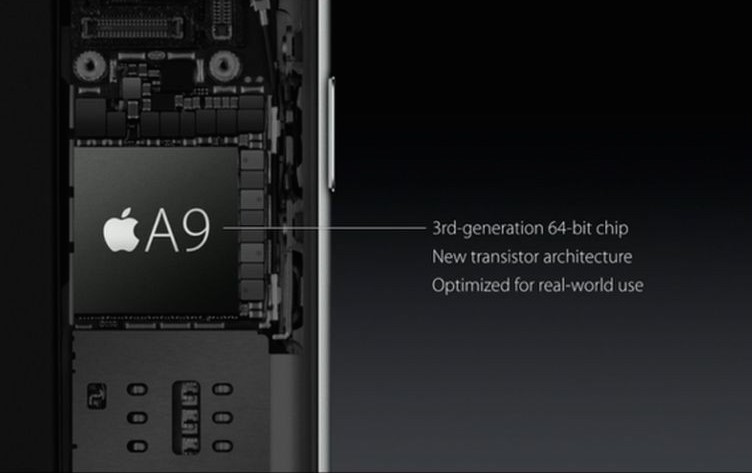
The Apple A9 is a high-end dual-core ARM SoC for smartphones. It was announced in Sept. 2015 in the new iPhone 6s and 6s Plus. Technical details were not published, but the CPU part should be about 70% and the GPU 90% faster than the previous Apple A8. Therefore, the performance should be on par with high-end Android SoCs in 2015.

It is based on the third generation of Apples 64 Bit architectures (Cyclone 3?) and uses a "new transistor technology". It is manufactured at Samsung in 14nm (slightly smaller die) and TSMC at 16nm (both FINFET 3D transistors). A performance difference of both versions are not noticable.

Furthermore, the chip now integrates the M9 motion coprocessor and a 4K video de- and encoder (as the iPhones 6s supports 4K video recording). The integrated graphics card should be still based on PowerVR technology.

The power consumption could be lower than the A8 due to the new process technology and the fact that the iPhones now got a smaller battery (due to the haptic engine part).

ModelApple A10 FusionApple A9
SeriesApple Apple A-SeriesApple
CodenameAPL1021 Hurricane / ZephyrCyclone 3
Clock2340 MHz1800 MHz
Cores / Threads4 / 22 / 2
Transistors3300 Million
Technology16 nm14/16 nm
FeaturesARMv8 Instruction SetARMv8 Instruction Set
iGPUApple A10 Fusion GPU / PowerVR (900 MHz)Apple A9 / PowerVR GT7600
ArchitectureARMARM
Announced
Series: Cyclone 3
Apple A9X compare2.26 GHz2 / 2 cores Cyclone 3
Apple A9 « 1.8 GHz2 / 2 cores Cyclone 3

Benchmarks

3DMark - 3DMark Ice Storm Unlimited Physics
min: 9189     avg: 14249     median: 15479 (13%)     max: 15626 Points
85%
A9 +
min: 12854     avg: 13248     median: 13210.5 (11%)     max: 13717 Points
3DMark - 3DMark Sling Shot Extreme (ES 3.1) Unlimited Physics
min: 1252     avg: 1437     median: 1434.5 (17%)     max: 1627 Points
76%
A9 +
1094 Points (13%)
3DMark - 3DMark Sling Shot (ES 3.0) Unlimited Physics
min: 1408     avg: 1525     median: 1518 (17%)     max: 1690 Points
72%
A9 +
1093 Points (12%)
Geekbench 5.5 - Geekbench 5.1 - 5.4 64 Bit Single-Core
min: 766     avg: 773     median: 777 (33%)     max: 777 Points
68%
A9 +
531 Points (22%)
Geekbench 5.5 - Geekbench 5.1 - 5.4 64 Bit Multi-Core
min: 1361     avg: 1403     median: 1421 (3%)     max: 1426 Points
68%
A9 +
970 Points (2%)
Geekbench 5.0 - Geekbench 5.0 64 Bit Single-Core
min: 767     avg: 771     median: 771 (3%)     max: 775 Points
Geekbench 5.0 - Geekbench 5.0 64 Bit Multi-Core
min: 1426     avg: 1429     median: 1429 (5%)     max: 1432 Points
Geekbench 4.4 - Geekbench 4.1 - 4.4 64 Bit Single-Core
min: 2672     avg: 3233     median: 3499 (35%)     max: 3527 Points
73%
A9 +
2556 Points (26%)
Geekbench 4.4 - Geekbench 4.1 - 4.4 64 Bit Multi-Core
min: 4508     avg: 5461     median: 5922 (7%)     max: 5952 Points
75%
A9 +
4459 Points (5%)
Geekbench 4.0 - Geekbench 4.0 64 Bit Single-Core
min: 3476     avg: 3483     median: 3483 (47%)     max: 3490 Points
73%
A9 +
min: 2503     avg: 2527     median: 2526.5 (34%)     max: 2550 Points
Geekbench 4.0 - Geekbench 4.0 64 Bit Multi-Core
min: 5585     avg: 5608     median: 5607.5 (14%)     max: 5630 Points
78%
A9 +
min: 4286     avg: 4359     median: 4359 (11%)     max: 4432 Points
Geekbench 3 - Geekbench 3 64 Bit Multi-Core
100%
1 A9 +
min: 4386     avg: 4412     median: 4422 (7%)     max: 4429 Points
Geekbench 3 - Geekbench 3 64 Bit Single-Core
100%
1 A9 +
min: 2533     avg: 2537     median: 2538 (38%)     max: 2539 Points
Linpack Android / IOS - Linpack Multi Thread
100%
1 A9 +
min: 1225     avg: 1260     median: 1260 (43%)     max: 1295 MFLOPS
Linpack Android / IOS - Linpack Single Thread
100%
1 A9 +
min: 669     avg: 677     median: 677 (66%)     max: 685 MFLOPS
Mozilla Kraken 1.1 - Kraken 1.1 Total Score *
min: 1026     avg: 1178     median: 1113 (1%)     max: 1531 ms
99%
A9 +
min: 1458     avg: 1656     median: 1712 (2%)     max: 1743 ms
Sunspider - Sunspider 1.0 Total Score *
100%
1 A9 +
223 ms (2%)
Octane V2 - Octane V2 Total Score
min: 19783     avg: 25316     median: 26053 (23%)     max: 27967 Points
63%
A9 +
min: 15967     avg: 16716     median: 16375 (15%)     max: 18148 Points
WebXPRT 3 - WebXPRT 3 Score
min: 79     avg: 95     median: 95 (20%)     max: 111 Points
AnTuTu v5 - AnTuTu v5 Total Score
100%
1 A9 +
min: 58869     avg: 58977     median: 58976.5 (59%)     max: 59084 Points
AnTuTu v6 - AnTuTu v6 Total Score
min: 142532     avg: 153966     median: 153966 (52%)     max: 165399 Points
84%
A9 +
min: 126969     avg: 129767     median: 128706 (44%)     max: 133626 Points
AnTuTu v7 - AnTuTu v7 MEM
min: 6141     avg: 9979     median: 10439 (32%)     max: 12895 Points
AnTuTu v7 - AnTuTu v7 UX
min: 32746     avg: 45782     median: 47936.5 (59%)     max: 54510 Points
AnTuTu v7 - AnTuTu v7 GPU
min: 45772     avg: 54850     median: 52519 (16%)     max: 68591 Points
AnTuTu v7 - AnTuTu v7 CPU
min: 50770     avg: 65083     median: 60084.5 (37%)     max: 89394 Points
AnTuTu v7 - AnTuTu v7 Total Score
min: 160578     avg: 175694     median: 165802 (29%)     max: 210596 Points
PassMark PerformanceTest Mobile V1 - PerformanceTest Mobile V1 CPU Tests
min: 49294     avg: 49329     median: 49329 (6%)     max: 49364 Points
99%
A9 +
min: 46285     avg: 48479     median: 48849 (6%)     max: 49934 Points
CrossMark - CrossMark Overall
359 Points (14%)

Average Benchmarks Apple A10 Fusion → 100% n=13

Average Benchmarks Apple A9 → 78% n=13

- Range of benchmark values for this graphics card
- Average benchmark values for this graphics card
* Smaller numbers mean a higher performance
1 This benchmark is not used for the average calculation

Add one or more devices and compare

In the following list you can select (and also search for) devices that should be added to the comparison. You can select more than one device.

restrict list:

show all (including archived), 2024, 2023
v1.26
log 19. 13:39:42

#0 checking url part for id 8178 +0s ... 0s

#1 checking url part for id 7085 +0s ... 0s

#2 not redirecting to Ajax server +0s ... 0s

#3 did not recreate cache, as it is less than 5 days old! Created at Fri, 19 Apr 2024 05:38:49 +0200 +0.001s ... 0.001s

#4 composed specs +0.055s ... 0.056s

#5 did output specs +0s ... 0.056s

#6 getting avg benchmarks for device 8178 +0.003s ... 0.059s

#7 got single benchmarks 8178 +0.013s ... 0.072s

#8 getting avg benchmarks for device 7085 +0.003s ... 0.075s

#9 got single benchmarks 7085 +0.011s ... 0.085s

#10 got avg benchmarks for devices +0s ... 0.085s

#11 min, max, avg, median took s +0.111s ... 0.197s

#12 return log +0.024s ... 0.221s

Please share our article, every link counts!
> Expert Reviews and News on Laptops, Smartphones and Tech Innovations > Benchmarks / Tech > Processor Comparison - Head 2 Head
Redaktion, 2017-09- 8 (Update: 2023-07- 1)