

AMD A10-9620P vs Intel Core i5-3339Y
AMD A10-9620P
► remove from comparison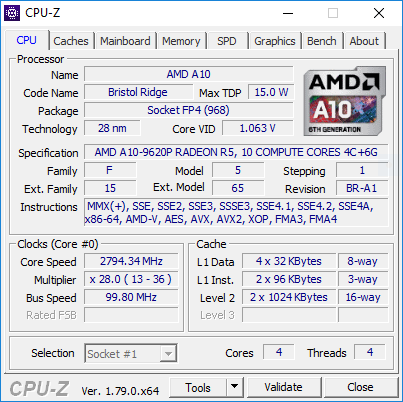
The AMD A10-9620P is a mid-range APU of the Bristol Ridge series (7th generation of APUs) with 4 CPU-cores (two Excavator modules) clocked at 2.5 - 3.4 GHz. In our tests the A10-9620P even hit 3.6 GHz.
It was announced in 2017 and is based on the same silicon as Carrizo but with more and refined features. It is a ULV-chip with a TDP of 15 Watt and integrates a Radeon R5 graphics card (384 shader cores / 6 compute cores) and a dual-channel DDR4-18600 memory controller. As Carrizo its a full featured SoC that offers all I/O ports on the chip.
The A10-9620P is a bit faster than the old 15-Watt top model of Carrizo, the FX-8800P. See our Bristol Ridge article for more information on the architecture and improvements compared to Carrizo.
Intel Core i5-3339Y
► remove from comparisonThe Intel Core i5-3339Y is an ULV-processor for ultrabooks and tablets based on the Ivy Bridge architecture. Due to Hyperthreading, the two cores can handle up to four threads in parallel leading to better utilization of the CPU. Each core offers a base speed of 1.5 GHz but can dynamically increase clock rates with Turbo Boost up to 1.8 GHz (for 2 active cores) and 2.0 GHz (for 1 active core). As other dual core Core i5, it offers a 3 MB L3-Cache.
Ivy Bridge is an enhanced die shrink of the Sandy Bridge architecture with improvements on both GPU and CPU performance. The CPUs are produced in 22nm (versus 32nm Sandy Bridge CPUs) and are the first to introduce 3D transistors for increased energy efficiency when compared to similarly clocked Sandy Bridge processors. Other new features are integrated PCI Express 3.0 and DDR3(L)-1600 support.
The performance of the Core i5-3339Y is limited by the very low TDP. Nevertheless, the 3339Y is still a bit faster than the Core i3-3217U with a slightly higher TDP.
The integrated Intel HD Graphics 4000 offers 16 Execution Units (EUs) clocked at 350 MHz up to 850 MHz with Turbo Boost, delivering a performance comparable with an AMD Radeon HD 6520G.
The 3339Y is rated at a TDP of 13 W including graphics card and memory controller. If necessary, the TDP can be set to an even lower value of 10 W (cTDP Down). Therefore, the CPU is suited for tablets and ultrabooks.
| Model | AMD A10-9620P | Intel Core i5-3339Y | ||||||||||||||||||||||||||||||||||||||||||||||||||||||||||||||||||||||||||||||||||||
| Codename | Bristol Ridge | Ivy Bridge | ||||||||||||||||||||||||||||||||||||||||||||||||||||||||||||||||||||||||||||||||||||
| Series | AMD Bristol Ridge | Intel Core i5 | ||||||||||||||||||||||||||||||||||||||||||||||||||||||||||||||||||||||||||||||||||||
| Series: Core i5 Ivy Bridge |
|
| ||||||||||||||||||||||||||||||||||||||||||||||||||||||||||||||||||||||||||||||||||||
| Clock | 2500 - 3400 MHz | 1500 - 2000 MHz | ||||||||||||||||||||||||||||||||||||||||||||||||||||||||||||||||||||||||||||||||||||
| L2 Cache | 2 MB | 512 KB | ||||||||||||||||||||||||||||||||||||||||||||||||||||||||||||||||||||||||||||||||||||
| Cores / Threads | 4 / 4 | 2 / 4 | ||||||||||||||||||||||||||||||||||||||||||||||||||||||||||||||||||||||||||||||||||||
| TDP | 15 Watt | 13 Watt | ||||||||||||||||||||||||||||||||||||||||||||||||||||||||||||||||||||||||||||||||||||
| Transistors | 3100 Million | |||||||||||||||||||||||||||||||||||||||||||||||||||||||||||||||||||||||||||||||||||||
| Technology | 28 nm | 22 nm | ||||||||||||||||||||||||||||||||||||||||||||||||||||||||||||||||||||||||||||||||||||
| Die Size | 250 mm2 | 118 mm2 | ||||||||||||||||||||||||||||||||||||||||||||||||||||||||||||||||||||||||||||||||||||
| max. Temp. | 90 °C | 105 °C | ||||||||||||||||||||||||||||||||||||||||||||||||||||||||||||||||||||||||||||||||||||
| Socket | FP4 | BGA | ||||||||||||||||||||||||||||||||||||||||||||||||||||||||||||||||||||||||||||||||||||
| Features | Dual-Channel DDR3/DDR4-1866 Memory Controller, PCIe 3.0 x8 | Turbo Boost 2.0, Hyper-Threading, Virtualization VT-x, AES, Intel 64, Anti-Theft, My WiFi, Idle States, Enhanced SpeedStep, Thermal Monitorin, Execute Disable Bit | ||||||||||||||||||||||||||||||||||||||||||||||||||||||||||||||||||||||||||||||||||||
| iGPU | AMD Radeon R5 (Bristol Ridge) ( - 758 MHz) | Intel HD Graphics 4000 (350 - 850 MHz) | ||||||||||||||||||||||||||||||||||||||||||||||||||||||||||||||||||||||||||||||||||||
| Architecture | x86 | x86 | ||||||||||||||||||||||||||||||||||||||||||||||||||||||||||||||||||||||||||||||||||||
| Announced | ||||||||||||||||||||||||||||||||||||||||||||||||||||||||||||||||||||||||||||||||||||||
| L1 Cache | 128 KB | |||||||||||||||||||||||||||||||||||||||||||||||||||||||||||||||||||||||||||||||||||||
| L3 Cache | 3 MB | |||||||||||||||||||||||||||||||||||||||||||||||||||||||||||||||||||||||||||||||||||||
| $250 U.S. | ||||||||||||||||||||||||||||||||||||||||||||||||||||||||||||||||||||||||||||||||||||||
| Manufacturer | ark.intel.com |

Benchmarks
Average Benchmarks AMD A10-9620P → 100% n=17
Average Benchmarks Intel Core i5-3339Y → 84% n=17
* Smaller numbers mean a higher performance
1 This benchmark is not used for the average calculation