Reviews for the AMD Ryzen 5 5600H processor
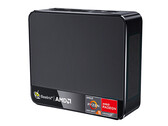
Minisforum Venus Series UM560 XT Desktop PC reviewed: A mini PC with an AMD Cezanne SoC at an affordable price!
Minisforum's Venus series offers a lot of power in the smallest of footprints. We have already put the top model, aka the UM690, through its paces. Now we turn ...
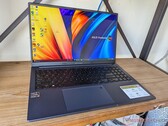
AMD Ryzen 5 5600H | AMD Radeon RX Vega 7 | | 652 g1080p OLED for the masses: Asus VivoBook 15X M1503QA laptop review
There are a handful of VivoBook 15 models to keep track of and the VivoBook 15X OLED is the latest one on the list. It sports an updated design from the existin...
AMD Ryzen 5 5600H | AMD Radeon RX Vega 7 | 15.60" | 1.7 kgBeelink SER5 Pro 5600H mini PC review: NUC 11 speeds with AMD Ryzen
The SER5 Pro continues the streak of affordable HTPCs from Beelink all designed to be cheaper alternatives to the Intel NUC series. This latest model challenges...
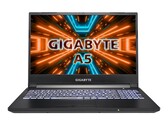
AMD Ryzen 5 5600H | AMD Radeon RX Vega 7 | | 498 gGigabyte A5 K1 review: Old-school gaming notebook
The Gigabyte A5 K1 presents itself as a classic gaming laptop that does not put emphasis on a thin and particularly light case. The focus is rather on a good pr...
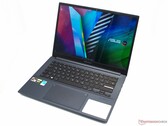
AMD Ryzen 5 5600H | NVIDIA GeForce RTX 3060 Laptop GPU | 15.60" | 2.2 kgAsus Vivobook Pro 14 OLED in review: Pantone Validated laptop packs a lot of processing power
With a particularly color-accurate display, a GeForce RTX 3050 with Nvidia Studio drivers, and a powerful Ryzen 5 5600H, the Asus VivoBook Pro 14 OLED is a lapt...
AMD Ryzen 5 5600H | NVIDIA GeForce RTX 3050 4GB Laptop GPU | 14.00" | 1.5 kgHP Victus 16-e0145ng: NVIDIA GeForce RTX 3050 Ti Laptop GPU, 16.10", 2.4 kg
Review » HP Victus 16 review: Affordable gaming laptop with AMD CPU and Nvidia GPU
Lenovo Legion 5 15ACH6A-82NW0010GE: AMD Radeon RX 6600M, 15.60", 2.5 kg
Review » Lenovo Legion 5 15 review: AMD's new Radeon RX 6600M meets Ryzen 5 5600H
Honor MagicBook 16 2022: AMD Radeon RX Vega 7, 16.10", 1.8 kg
Review » Honor MagicBook 16 2022 review - Good multimedia laptop with weak power adapter
MSI Bravo 15 B5DD-010US: AMD Radeon RX 5500M, 15.60", 2.3 kg
Review » MSI Bravo 15 B5DD laptop review: Terrible Radeon RX 5500M performance-per-dollar
Lenovo Legion 5 17ACH6H-82JY0003GE: NVIDIA GeForce RTX 3060 Laptop GPU, 17.30", 3.1 kg
Review » Lenovo Legion 5 17 with RTX 3060 in review: Strong gaming laptop with current-gen AMD Ryzen CPU
Asus VivoBook 15 Pro M3500QC-L1062: NVIDIA GeForce RTX 3050 4GB Laptop GPU, 15.60", 1.7 kg
Review » Asus VivoBook 15 Pro OLED review: Affordable multimedia laptop with a high performance
Acer Nitro 5 AN515-45-R05E: NVIDIA GeForce GTX 1650 Mobile, 15.60", 2.3 kg
Review » Preview Acer Nitro 5 in 15- & 17-inch: Ryzen 5000H for gamers
HP Victus 16-e0145ng: NVIDIA GeForce RTX 3050 Ti Laptop GPU, 16.10", 2.4 kg
External Review » HP Victus 16-e0145ng
MSI Alpha 15 B5EEK: AMD Radeon RX 6600M, 15.60", 2.4 kg
External Review » MSI Alpha 15 B5EEK
HP Victus 15-fb0035ns: AMD Radeon RX 6500M, 15.60", 2.3 kg
External Review » HP Victus 15-fb0035ns
MSI Bravo 15 B5ED: AMD Radeon RX 6500M, 15.60", 2.4 kg
External Review » MSI Bravo 15 B5ED
HP Victus 16-e0222nd: NVIDIA GeForce RTX 3060 Laptop GPU, 16.10", 2.5 kg
External Review » HP Victus 16-e0222nd
Asus VivoBook 17X M1703, R5 5600H: AMD Radeon RX Vega 7, 17.30", 2.1 kg
External Review » Asus VivoBook 17X M1703, R5 5600H
HP Victus 16-e0085ns: NVIDIA GeForce GTX 1650 Mobile, 16.10", 2.5 kg
External Review » HP Victus 16-e0085ns
Asus Vivobook 16X M1603QA, R5 5600H: AMD Radeon RX Vega 7, 16.00", 1.9 kg
External Review » Asus Vivobook 16X M1603QA, R5 5600H
MSI Bravo 15 B5DD-010US: AMD Radeon RX 5500M, 15.60", 2.3 kg
External Review » MSI Bravo 15 B5DD-010US
HP Victus 15-fb0152ng: NVIDIA GeForce GTX 1650 Mobile, 16.00", 2.3 kg
External Review » HP Victus 15-fb0152ng
Lenovo IdeaPad Gaming 3 15ACH6, 5600H RTX 3060: NVIDIA GeForce RTX 3060 Laptop GPU, 15.60", 2.3 kg
External Review » Lenovo IdeaPad Gaming 3 15ACH6, 5600H RTX 3060
HP Victus 16-e0091ns: NVIDIA GeForce RTX 3050 Ti Laptop GPU, 16.10", 2.5 kg
External Review » HP Victus 16-e0091ns
Asus Vivobook 14X M1403Q: AMD Radeon RX Vega 7, 14.00", 1.6 kg
External Review » Asus Vivobook 14X M1403Q
Asus VivoBook S 14 Flip TN3402QA, Ryzen 5 5600H: AMD Radeon RX Vega 7, 14.00", 1.5 kg
External Review » Asus VivoBook S 14 Flip TN3402QA, Ryzen 5 5600H
Asus Vivobook Pro 14 M3400, R5 5600H: AMD Radeon RX Vega 7, 14.00", 1.4 kg
External Review » Asus Vivobook Pro 14 M3400, R5 5600H
Lenovo IdeaPad Gaming 3 15ACH6-82K201SRSP: NVIDIA GeForce GTX 1650 Mobile, 15.60", 2.3 kg
External Review » Lenovo IdeaPad Gaming 3 15ACH6-82K201SRSP
Asus Vivobook 15X M1503, R5 5600H: AMD Radeon RX Vega 7, 15.60", 1.7 kg
External Review » Asus Vivobook 15X M1503, R5 5600H
HP Victus 15-fb0009AX: NVIDIA GeForce RTX 3050 4GB Laptop GPU, 15.60", 2.9 kg
External Review » HP Victus 15-fb0009AX
Gigabyte A5 K1: NVIDIA GeForce RTX 3060 Laptop GPU, 15.60", 2.2 kg
External Review » Gigabyte A5 K1
Lenovo Legion 5 15ACH6H-82JU0127MH: NVIDIA GeForce RTX 3060 Laptop GPU, 15.60", 2.4 kg
External Review » Lenovo Legion 5 15ACH6H-82JU0127MH
HP Victus 15-fb0011AX: AMD Radeon RX 6500M, 15.60", 2.3 kg
External Review » HP Victus 15-fb0011AX
HP Victus 16-e0053ns: AMD Radeon RX 5500M, 16.10", 2.5 kg
External Review » HP Victus 16-e0053ns
Lenovo IdeaPad Gaming 3 15ACH6-82K201HEMH: NVIDIA GeForce GTX 1650 Mobile, 15.60", 2.3 kg
External Review » Lenovo IdeaPad Gaming 3 15ACH6-82K201HEMH
Asus VivoBook Pro 15 M3500QC-L1063: NVIDIA GeForce RTX 3050 4GB Laptop GPU, 15.60", 1.7 kg
External Review » Asus VivoBook Pro 15 M3500QC-L1063
HP Victus 16-e0017ns: AMD Radeon RX 5500M, 16.10", 2.5 kg
External Review » HP Victus 16-e0017ns
Huawei MateBook 16 R5 5600H: AMD Radeon RX Vega 6 (Ryzen 4000/5000), 16.00", 2 kg
External Review » Huawei MateBook 16 R5 5600H
HP Victus 16-e0040ns: NVIDIA GeForce GTX 1650 Mobile, 16.10", 2.5 kg
External Review » HP Victus 16-e0040ns
Lenovo IdeaPad Gaming 3 15ACH6-82K201DHMH: NVIDIA GeForce GTX 1650 Mobile, 15.60", 2.3 kg
External Review » Lenovo IdeaPad Gaming 3 15ACH6-82K201DHMH
Asus VivoBook Pro 14 M3401QC-KM007W: NVIDIA GeForce RTX 3050 4GB Laptop GPU, 14.00", 1.5 kg
External Review » Asus VivoBook Pro 14 M3401QC-KM007W
Lenovo Thinkbook 14p G2 ACH, 5600H: AMD Radeon RX Vega 6 (Ryzen 4000/5000), 14.00", 1.4 kg
External Review » Lenovo Thinkbook 14p G2 ACH, 5600H
Honor MagicBook 16 2022: AMD Radeon RX Vega 7, 16.10", 1.8 kg
External Review » Honor MagicBook 16 2022
HP Victus 16-e0010ns: NVIDIA GeForce GTX 1650 Mobile, 16.10", 2.5 kg
External Review » HP Victus 16-e0010ns
Honor MagicBook 16: AMD Radeon RX Vega 6 (Ryzen 4000/5000), 16.10", 1.8 kg
External Review » Honor MagicBook 16
HP Pavilion Gaming 15-ec2010AX: NVIDIA GeForce RTX 3050 4GB Laptop GPU, 15.60", 2 kg
External Review » HP Pavilion Gaming 15-ec2010AX
Lenovo IdeaPad Gaming 3 15ACH6, 5600H RTX 3050: NVIDIA GeForce RTX 3050 4GB Laptop GPU, 15.60", 2.2 kg
External Review » Lenovo IdeaPad Gaming 3 15ACH6, 5600H RTX 3050
Lenovo IdeaPad Gaming 3 15ACH6-82K200UTUS: NVIDIA GeForce GTX 1650 Mobile, 15.60", 2.3 kg
External Review » Lenovo IdeaPad Gaming 3 15ACH6-82K200UTUS
HP Victus 16-e0914ng: NVIDIA GeForce RTX 3050 4GB Laptop GPU, 16.10", 2.5 kg
External Review » HP Victus 16-e0914ng
Lenovo ThinkBook 16p G2 ACH-20YM001SPB: NVIDIA GeForce RTX 3060 Laptop GPU, 16.00", 2 kg
External Review » Lenovo ThinkBook 16p G2 ACH-20YM001SPB
HP Pavilion Gaming 15-ec2047AX: NVIDIA GeForce GTX 1650 Mobile, 15.60", 2 kg
External Review » HP Pavilion Gaming 15-ec2047AX
Asus VivoBook Pro 14X M7400QC, 5600H RTX 3050: NVIDIA GeForce RTX 3050 4GB Laptop GPU, 14.00", 1.5 kg
External Review » Asus VivoBook Pro 14X M7400QC, 5600H RTX 3050
HP Pavilion Gaming 15-ec2005ns: NVIDIA GeForce GTX 1650 Mobile, 15.60", 2 kg
External Review » HP Pavilion Gaming 15-ec2005ns
HP Victus 16-e0088AX: NVIDIA GeForce RTX 3060 Laptop GPU, 16.10", 2.5 kg
External Review » HP Victus 16-e0088AX
Asus VivoBook Pro 15 M3500QA-L1149T: AMD Radeon RX Vega 6 (Ryzen 4000/5000), 15.60", 1.7 kg
External Review » Asus VivoBook Pro 15 M3500QA-L1149T
Asus VivoBook Pro 15 M3500QC-L1062: NVIDIA GeForce RTX 3050 4GB Laptop GPU, 15.60", 1.7 kg
External Review » Asus VivoBook Pro 15 M3500QC-L1062
Asus VivoBook 15 Pro M3500QC-L1062: NVIDIA GeForce RTX 3050 4GB Laptop GPU, 15.60", 1.7 kg
External Review » Asus VivoBook 15 Pro M3500QC-L1062
Acer Nitro 5 AN515-45-NH.QCLSI.001: NVIDIA GeForce RTX 3050 4GB Laptop GPU, 15.60", 2.3 kg
External Review » Acer Nitro 5 AN515-45-NH.QCLSI.001
HP Victus 16-e0048ns: AMD Radeon RX 5500M, 16.10", 2.5 kg
External Review » HP Victus 16-e0048ns
Dell G15 5515, 5600H RTX 3050 Ti: NVIDIA GeForce RTX 3050 Ti Laptop GPU, 15.60", 2.6 kg
External Review » Dell G15 5515, 5600H RTX 3050 Ti
HP Victus 16-e0352ng: AMD Radeon RX 5500M, 16.10", 2.5 kg
External Review » HP Victus 16-e0352ng
Lenovo Legion S7 15ACH6-82K8CTO1WW: NVIDIA GeForce RTX 3050 Ti Laptop GPU, 15.60", 1.9 kg
External Review » Lenovo Legion S7 15ACH6-82K8CTO1WW
Asus ZenBook 14X UM5401, 5600H: AMD Radeon RX Vega 6 (Ryzen 4000/5000), 14.00", 1.4 kg
External Review » Asus ZenBook 14X UM5401, 5600H
HP Pavilion Gaming 15-ec2002ns: NVIDIA GeForce GTX 1650 Mobile, 15.60", 2 kg
External Review » HP Pavilion Gaming 15-ec2002ns
Acer Nitro 5 AN515-45-R19D: NVIDIA GeForce RTX 3060 Laptop GPU, 15.60", 2.3 kg
External Review » Acer Nitro 5 AN515-45-R19D
Lenovo IdeaPad 5 Pro 16ACH6-82L5005TMH: AMD Radeon RX Vega 6 (Ryzen 4000/5000), 16.10", 1.9 kg
External Review » Lenovo IdeaPad 5 Pro 16ACH6-82L5005TMH
Dell G15 5515, 5600H RTX 3050: NVIDIA GeForce RTX 3050 4GB Laptop GPU, 15.60", 2.6 kg
External Review » Dell G15 5515, 5600H RTX 3050
Lenovo IdeaPad Gaming 3 15ACH6-82K20015US: NVIDIA GeForce GTX 1650 Mobile, 15.60", 2.3 kg
External Review » Lenovo IdeaPad Gaming 3 15ACH6-82K20015US
HP Pavilion Gaming 15-ec2009ns: NVIDIA GeForce GTX 1650 Mobile, 15.60", 2 kg
External Review » HP Pavilion Gaming 15-ec2009ns
HP Victus 16-e0004ns: NVIDIA GeForce GTX 1650 Mobile, 16.10", 2.5 kg
External Review » HP Victus 16-e0004ns
Lenovo Yoga Slim 7 Pro 14ARH5-82MS0073SB: AMD Radeon RX Vega 6 (Ryzen 4000/5000), 14.00", 1.3 kg
External Review » Lenovo Yoga Slim 7 Pro 14ARH5-82MS0073SB
Asus Vivobook Pro 16X-M7600QC: NVIDIA GeForce RTX 3050 4GB Laptop GPU, 16.00", 2 kg
External Review » Asus Vivobook Pro 16X-M7600QC
HP Pavilion Gaming 15-ec2007ns: NVIDIA GeForce GTX 1650 Mobile, 15.60", 2 kg
External Review » HP Pavilion Gaming 15-ec2007ns
HP Omen 15-en1268ng: NVIDIA GeForce RTX 3060 Laptop GPU, 15.60", 2.5 kg
External Review » HP Omen 15-en1268ng
Lenovo Legion 5 Pro 16ACH6H-82JQ009HGE: NVIDIA GeForce RTX 3060 Laptop GPU, 16.00", 2.5 kg
External Review » Lenovo Legion 5 Pro 16ACH6H-82JQ009HGE
MSI Bravo 15 B5DD-006XES: AMD Radeon RX 5500M, 15.60", 2.4 kg
External Review » MSI Bravo 15 B5DD-006XES
HP Pavilion Gaming 15-ec2008ns: NVIDIA GeForce GTX 1650 Mobile, 15.60", 2 kg
External Review » HP Pavilion Gaming 15-ec2008ns
HP Pavilion Gaming 15z-ec200: NVIDIA GeForce GTX 1650 Mobile, 15.60", 2.3 kg
External Review » HP Pavilion Gaming 15z-ec200
Lenovo Legion 5 17ACH6-82K0000RMH: NVIDIA GeForce GTX 1650 Mobile, 17.30", 3 kg
External Review » Lenovo Legion 5 17ACH6-82K0000RMH
Lenovo Legion 5 15ACH-82JU000JGE: NVIDIA GeForce RTX 3060 Laptop GPU, 15.60", 2.4 kg
External Review » Lenovo Legion 5 15ACH-82JU000JGE
HP Pavilion Gaming 15-ec2253ng: NVIDIA GeForce GTX 1650 Mobile, 15.60", 2.3 kg
External Review » HP Pavilion Gaming 15-ec2253ng
Acer Nitro 5 AN515-45-R9GZ: NVIDIA GeForce RTX 3060 Laptop GPU, 15.60", 2.3 kg
External Review » Acer Nitro 5 AN515-45-R9GZ
HP Victus 15-fb0354ng: AMD Radeon RX 6500M, 15.60", 2.3 kg
Article » Tested: Quiet AMD gaming notebook for €599 - HP Victus 15
HP Victus 16-e0145ng: NVIDIA GeForce RTX 3050 Ti Laptop GPU, 16.10", 2.4 kg
» Affordable HP Victus 15 gaming laptop records massive 33% discount at Best Buy
Asus Vivobook Pro 14 M3401QC-KM007T: NVIDIA GeForce RTX 3050 4GB Laptop GPU, 14.00", 1.5 kg
» Asus Vivobook Pro 14 laptop reviewed: Almost a hidden gem
MSI Bravo 15 B5DD-010US: AMD Radeon RX 5500M, 15.60", 2.3 kg
» The latest MSI Bravo 15 B5DD is a step backwards for the series
Asus VivoBook 15 Pro M3500QC-L1062: NVIDIA GeForce RTX 3050 4GB Laptop GPU, 15.60", 1.7 kg
» The Asus VivoBook 15 Pro multimedia laptop offers a high performance but outdated connections
 Deutsch
 English
 Español
 Français
 Italiano
 Nederlands
 Polski
 Português
 Русский
 Türkçe
 Svenska
 Chinese
 Magyar