Notebookcheck Logo

Qualcomm Snapdragon 855 vs Apple A12 Bionic vs Apple A13 Bionic

Qualcomm Snapdragon 855

► remove from comparison Qualcomm SD 855

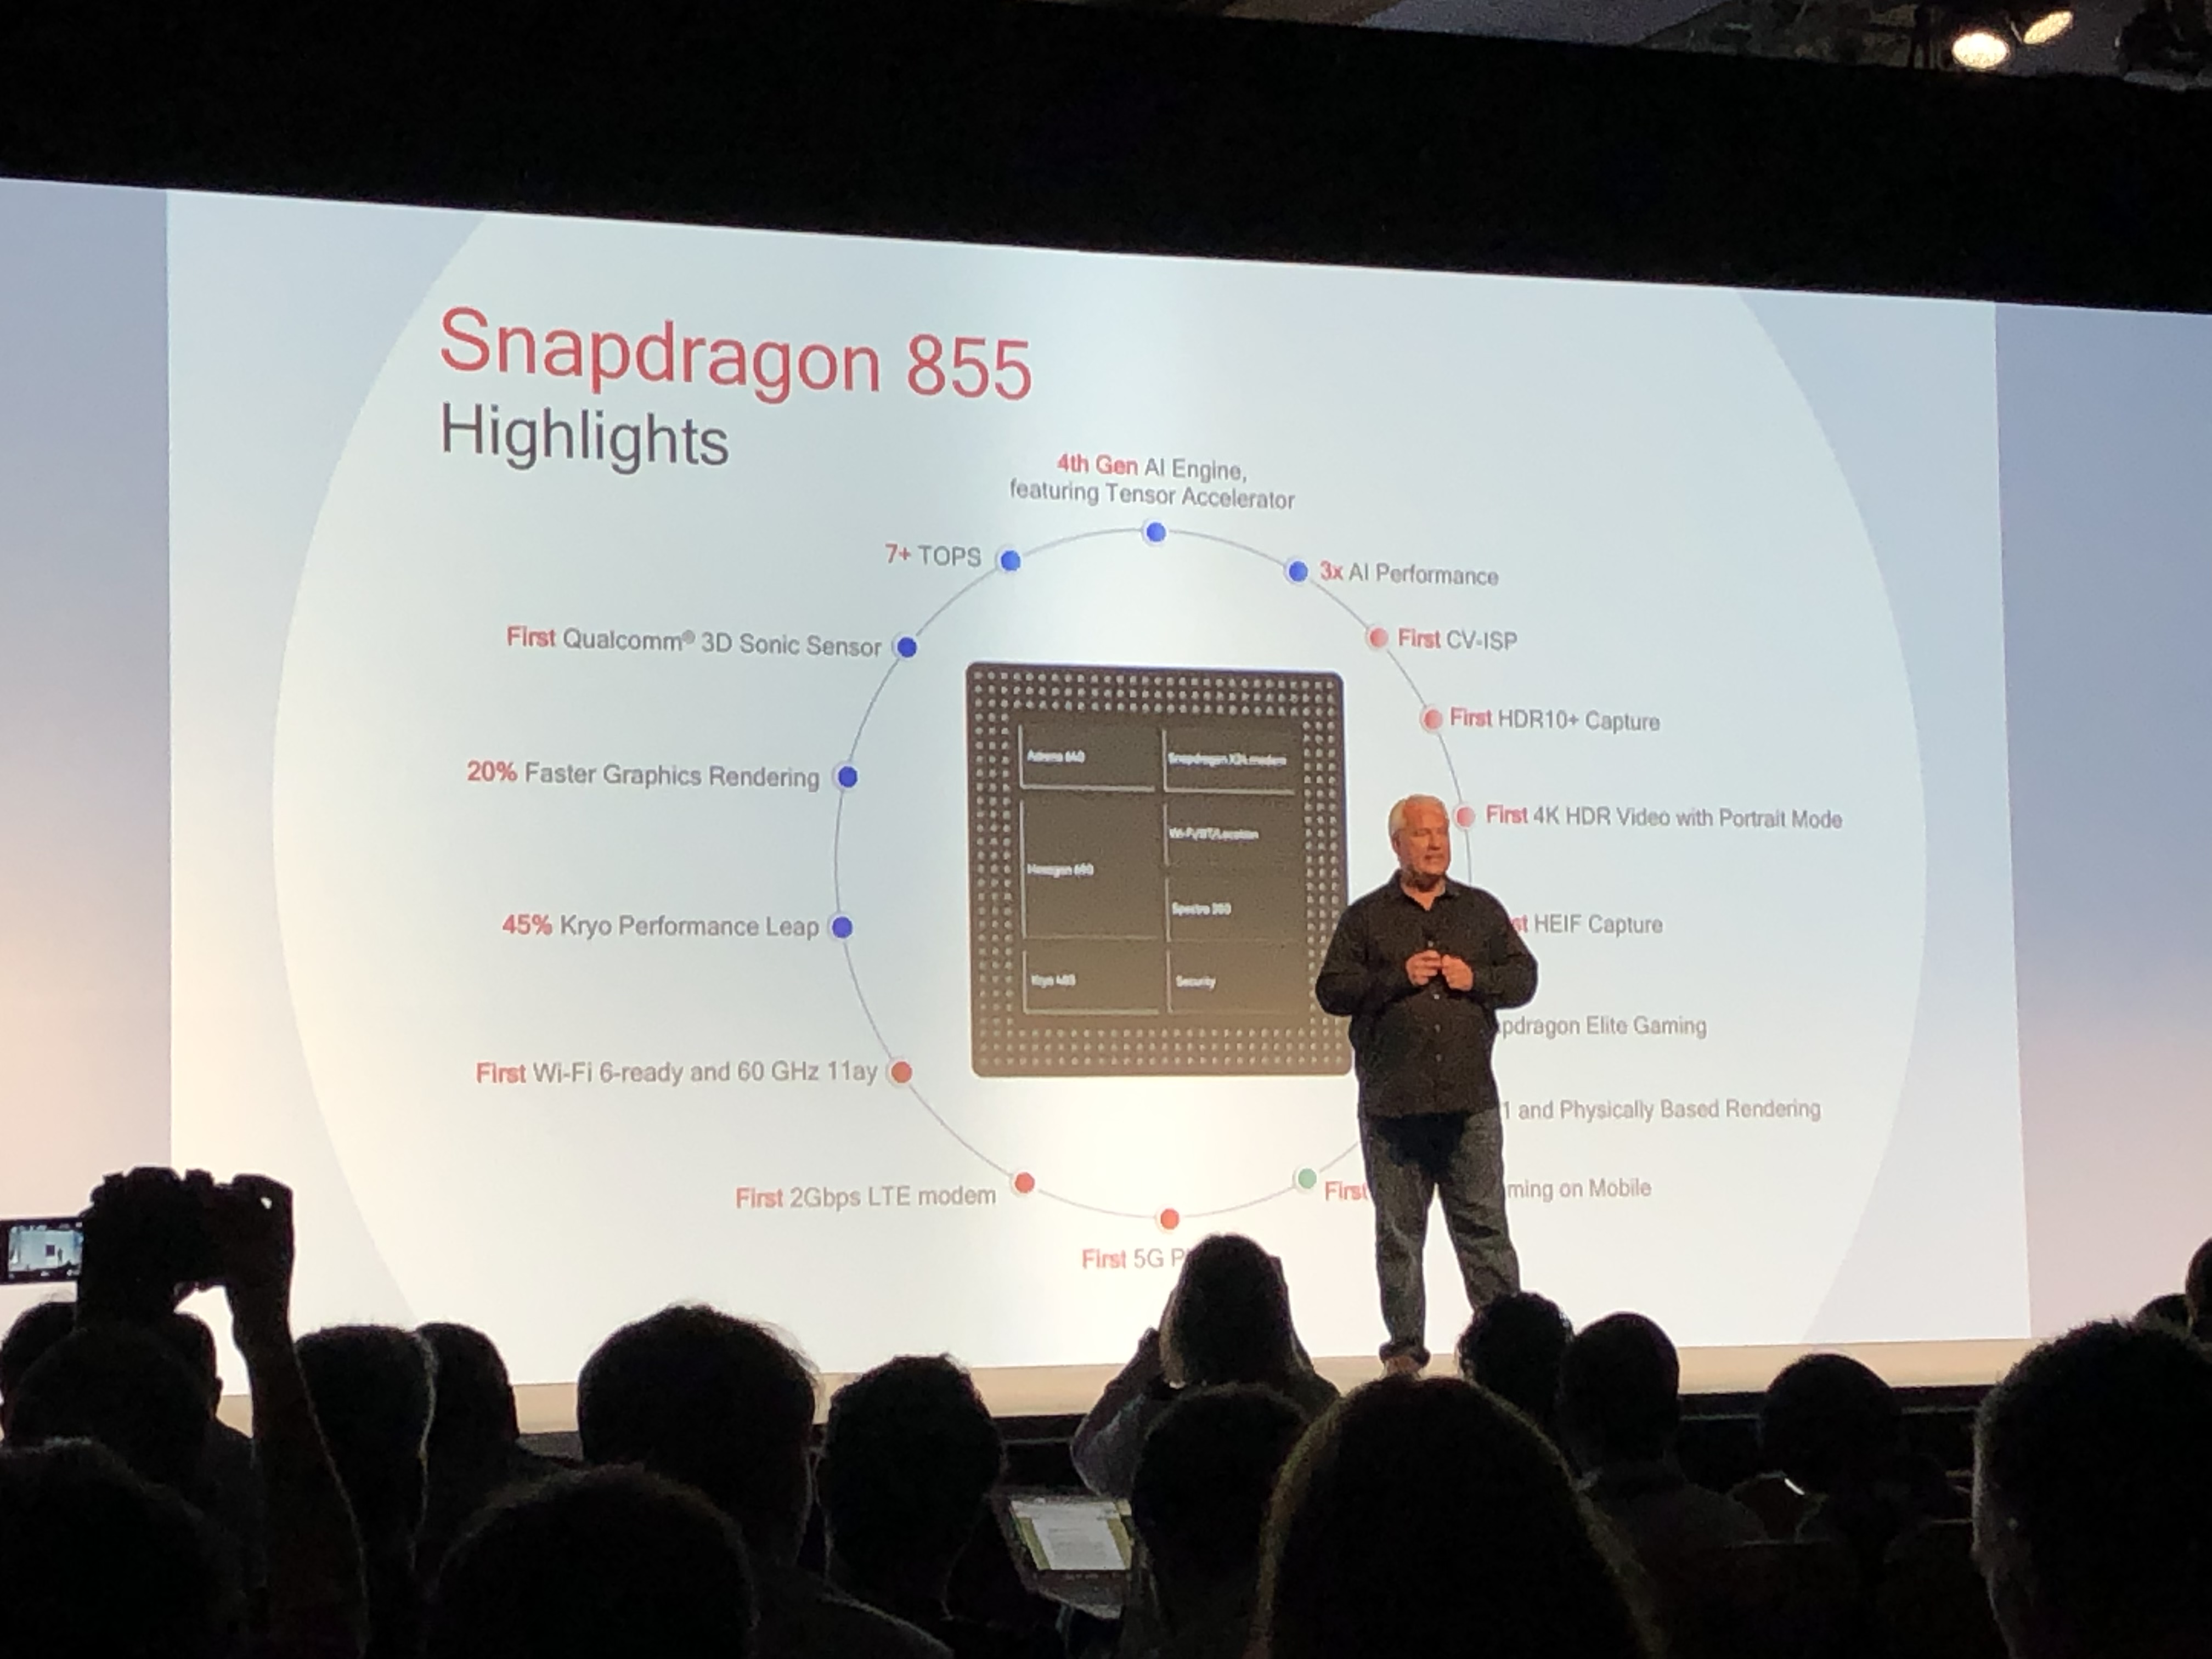
The Qualcomm Snapdragon 855 Mobile Platform is a high-end smartphone and tablet SoC that Qualcomm announced in December 2018. The SoC integrates a fast ‘Prime Core’ that clocks up to 2.84 GHz and three further fast ARM Cortex-A76 performance cores, which can reach up to 2.42 GHz. These are complemented by four power-saving ARM Cortex-A55 cores that clock up to a maximum of 1.8 GHz. The higher ‘Prime Core’ clock speed should provide significantly better single core performance than the Snapdragon 845, but we suspect that the Snapdragon 855 will fall short of the Apple A12 Bionic. The new SoC should have up to 45% faster single-core performance and 35% multi-core performance than its predecessor. Qualcomm praises the Snapdragon 855’s ability to maintain its performance when faced with sustained load, beating the Apple A12 Bionic SoC and the HiSilicon Kirin 980.

The SoC also integrates the new X24 LTE modem that Qualcomm promises will deliver up to 2 Gbit/s maximum download speed over LTE Cat.20 and up to 316 Mbit/s upload speeds. The Snapdragon 855 can be configured with the company’s new X50 5G modem too.

Qualcomm has also improved the integrated Wi-Fi modem, which is Wi-Fi 6-ready, has 8x8 Sounding and supports up to 802.11 ay Wi-Fi. The Wi-Fi modem can utilise the 60 GHz mmWave band for up to 10 Gbit/s internet speeds.

The Hexagon 690 DSP has undergone the most revisions of that which Qualcomm has integrated into the Snapdragon 855. The new DSP incorporates a neural processing unit (NPU) with dedicated Tensor-cores that can execute up to 7 trillion operations per second in conjunction with the CPU and GPU. In short, the Snapdragon 855 should be three times faster than the Snapdragon 845 and two times faster than the Kirin 980 SoC.

The Snapdragon 855 also has a Spectra 380 ISP onboard, which is the world’s first chip to incorporate a Computer Vision Engine (CV-ISP) that can perform depth calculations in videos at up to 60 FPS. The Snapdragon 855 should deliver real-time portrait modes or be able to detect objects with relatively low power consumption.

The built-in memory controller supports up to 16 GB LPDDR4x RAM (4 x 16-bit). Moreover, the Adreno 640 has 50% more compute units (ALUs) than the Adreno 630, while Qualcomm claims that it should be 20% faster than its predecessor. We currently do not know what clock speeds the Adreno 640 will operate at as Qualcomm did not announce these during the announcement of the Snapdragon 855.

Qualcomm will manufacturer the Snapdragon 855 at the Taiwan Semiconductor Manufacturing Company (TSMC) using a 7 nm FinFET process. The switch to 7 nm manufacturing should make the SD855 20% more efficient than the SD845. Qualcomm has not officially announced the thermal design power (TDP) of the SD855, but we suspect that the SoC will reach a maximum of 5 W and will average around 3.5 W under load.

Apple A12 Bionic

► remove from comparison Apple A12 Bionic

The Apple A12 Bionic is a System on a Chip (SoC) from Apple that is found in the iPhone Xs and Xr. It was announced late 2018 and offers 6 cores divided in 2 performance cores and four power efficiency cores. Compared to the previous A11 Bionic, the A12 should offer a 15% improved CPU performance for the performance cores and a 50% lower power consumption for the efficiency cores (both according to Apple).

The chip also includes a new GPU that is advertised as 50% faster, the M12 Motion co-processor and a Neural Engine with 8 cores for up to 5 trillion operations per second.

With 6.9 billion transistors, the A12 Bionic is a big chip especially compared to the Snapdragon 835 (3 Billion) or a Skylake desktop quad-core Soc (1.75 Billion). Compared to the A11, the A12 integrates 60% more transistors.

Apple A13 Bionic

► remove from comparison Apple A13 Bionic

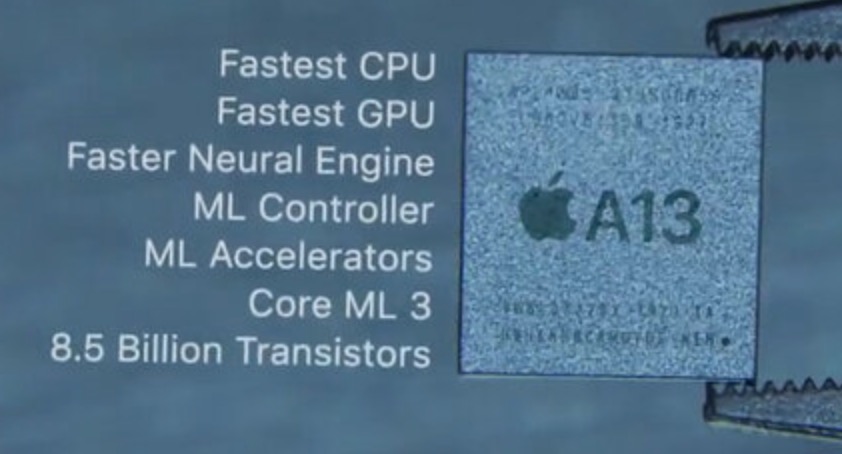
The Apple A13 Bionic is a System on a Chip (SoC) from Apple that is found in the iPhone 11 series. It was announced late 2019 and offers 6 cores divided in 2 performance cores and four power efficiency cores. Compared to the previous A12 Bionic, the A13 should offer a 20% improved CPU performance at 40% lower power (according to Apple).

With 8.5 billion transistors, the A13 Bionic is a big chip especially compared to the Snapdragon 835 (3 Billion) or a Skylake desktop quad-core Soc (1.75 Billion).

ModelQualcomm Snapdragon 855Apple A12 BionicApple A13 Bionic
SeriesQualcomm SnapdragonApple Apple A-SeriesApple Apple A-Series
CodenameCortex-A76 / A55 (Kryo 485)Lightning and Thunder
Series: Apple A-Series
Qualcomm Snapdragon 860 - 2.96 GHz8 / 8 cores5 MB L3 Cortex-A76 / A55 (Kryo 485)
Qualcomm Snapdragon 855+ / 855 Plus - 2.96 GHz8 / 8 cores5 MB L3 Cortex-A76 / A55 (Kryo 485)
Qualcomm Snapdragon 855 « 2.84 GHz8 / 8 cores5 MB L3 Cortex-A76 / A55 (Kryo 485)
Apple A15 Bionic2.02 - 3.23 GHz6 / 6 cores32 MB L3
Apple A12 Bionic « - 2.49 GHz6 / 6 cores
Clock2840 MHz <=2490 MHz <=2660 MHz
L2 Cache1.8 MB8 MB12 MB
L3 Cache5 MB
Cores / Threads8 / 86 / 66 / 6
TDP5 Watt
Technology7 nm7 nm7 nm
FeaturesX24 LTE Modem, Adreno 640 GPUARMv8 Instruction SetARMv8 Instruction Set
iGPUQualcomm Adreno 640 ( - 585 MHz)Apple A12 Bionic GPUApple A13 Bionic GPU
ArchitectureARMARMARM
Announced
Manufacturerwww.qualcomm.com
L1 Cache256 KB832 KB
Transistors6900 Million6900 Million

Benchmarks

Performance Rating - Geekbench 5.5, PCM Work, Sling Shot Physics, Antutu v8 CPU - SD 855
1 pt (73%)
min: 27400     avg: 27548     median: 27547 (23%)     max: 27717 Points
min: 33851     avg: 33885     median: 33881 (29%)     max: 33925 Points
min: 2078     avg: 2803     median: 2958 (35%)     max: 3219 Points
min: 3411     avg: 3780     median: 3877 (44%)     max: 4052 Points
Geekbench 6.2 - Geekbench 6.2 Single-Core
100%
1 SD 855 +
1008 Points (31%)
Geekbench 6.2 - Geekbench 6.2 Multi-Core
100%
1 SD 855 +
2757 Points (11%)
Geekbench 5.5 - Geekbench 5.1 - 5.4 64 Bit Single-Core
min: 552     avg: 717     median: 744 (31%)     max: 751 Points
min: 1116     avg: 1118     median: 1117.5 (47%)     max: 1119 Points
min: 1326     avg: 1333     median: 1332 (56%)     max: 1342 Points
Geekbench 5.5 - Geekbench 5.1 - 5.4 64 Bit Multi-Core
min: 2164     avg: 2572     median: 2666 (5%)     max: 2856 Points
min: 2772     avg: 2815     median: 2814.5 (5%)     max: 2857 Points
min: 3235     avg: 3381     median: 3378.5 (6%)     max: 3531 Points
Geekbench 5.0 - Geekbench 5.0 64 Bit Single-Core
min: 725     avg: 742     median: 742 (3%)     max: 750 Points
1118 Points (5%)
min: 1343     avg: 1343     median: 1343 (6%)     max: 1344 Points
Geekbench 5.0 - Geekbench 5.0 64 Bit Multi-Core
min: 2441     avg: 2616     median: 2589.5 (8%)     max: 2852 Points
2910 Points (9%)
min: 3242     avg: 3427     median: 3463 (11%)     max: 3575 Points
Geekbench 4.4 - Geekbench 4.1 - 4.4 64 Bit Single-Core
100%
1 SD 855 +
min: 3406     avg: 3480     median: 3491 (35%)     max: 3537 Points
min: 4750     avg: 4779     median: 4774 (48%)     max: 4824 Points
Geekbench 4.4 - Geekbench 4.1 - 4.4 64 Bit Multi-Core
100%
1 SD 855 +
min: 10187     avg: 10955     median: 10987.5 (12%)     max: 11388 Points
min: 11244     avg: 11418     median: 11480 (13%)     max: 11598 Points
Geekbench 4.0 - Geekbench 4.0 64 Bit Single-Core
100%
1 SD 855 +
min: 3295     avg: 3548     median: 3548 (48%)     max: 3801 Points
Geekbench 4.0 - Geekbench 4.0 64 Bit Multi-Core
100%
1 SD 855 +
min: 10163     avg: 10529     median: 10529 (26%)     max: 10895 Points
Geekbench 3 - Geekbench 3 32 Bit Multi-Core
100%
1 SD 855 +
9555 Points (17%)
Geekbench 3 - Geekbench 3 32 Bit Single-Core
100%
1 SD 855 +
2891 Points (56%)
Geekbench 3 - Geekbench 3 64 Bit Multi-Core
0 Points (0%)
Geekbench 3 - Geekbench 3 64 Bit Single-Core
0 Points (0%)
Geekbench 2 - 32 Bit - Geekbench Stream
100%
1 SD 855 +
min: 1658     avg: 1926     median: 1926 (16%)     max: 2194 Points
Geekbench 2 - 32 Bit - Geekbench Memory
100%
1 SD 855 +
min: 3919     avg: 4247     median: 4247 (39%)     max: 4575 Points
Geekbench 2 - 32 Bit - Geekbench Floating Point
100%
1 SD 855 +
min: 11986     avg: 14903     median: 14902.5 (29%)     max: 17819 Points
Geekbench 2 - 32 Bit - Geekbench Integer
100%
1 SD 855 +
min: 5470     avg: 6620     median: 6619.5 (13%)     max: 7769 Points
Geekbench 2 - 32 Bit - Geekbench Total Score
100%
1 SD 855 +
min: 7059     avg: 8575     median: 8574.5 (22%)     max: 10090 Points
Mozilla Kraken 1.1 - Kraken 1.1 Total Score *
min: 1852     avg: 2147     median: 2114 (2%)     max: 2611 ms
min: 603     avg: 627     median: 626.5 (1%)     max: 653 ms
min: 545     avg: 562     median: 571 (1%)     max: 573 ms
Sunspider - Sunspider 1.0 Total Score *
100%
1 SD 855 +
384.2 ms (4%)
Octane V2 - Octane V2 Total Score
min: 17011     avg: 23749     median: 24044 (22%)     max: 33918 Points
min: 41367     avg: 42312     median: 42333.5 (38%)     max: 43280 Points
min: 47288     avg: 48727     median: 48991 (44%)     max: 49388 Points
WebXPRT 3 - WebXPRT 3 Score
min: 90     avg: 105.2     median: 106.5 (22%)     max: 129 Points
min: 155     avg: 159.5     median: 159.5 (33%)     max: 166 Points
min: 146     avg: 179.2     median: 183 (38%)     max: 202 Points
AnTuTu v6 - AnTuTu v6 Total Score
100%
1 SD 855 +
min: 239512     avg: 255436     median: 255924 (87%)     max: 268271 Points
min: 7312     avg: 9998     median: 10135.5 (31%)     max: 12409 Points
min: 10494     avg: 12510     median: 12592 (39%)     max: 14443 Points
AnTuTu v7 - AnTuTu v7 UX
min: 53266     avg: 73247     median: 74726 (92%)     max: 79058 Points
min: 59570     avg: 65177     median: 66701 (82%)     max: 67735 Points
min: 77118     avg: 77810     median: 78032 (96%)     max: 78279 Points
AnTuTu v7 - AnTuTu v7 GPU
min: 67537     avg: 152512     median: 156467 (49%)     max: 191221 Points
min: 129473     avg: 147840     median: 151931 (47%)     max: 158023 Points
min: 218738     avg: 219891     median: 218937 (68%)     max: 221998 Points
AnTuTu v7 - AnTuTu v7 CPU
min: 85969     avg: 115207     median: 118475 (73%)     max: 127208 Points
min: 106600     avg: 124761     median: 127986 (78%)     max: 136472 Points
min: 147281     avg: 149542     median: 148191 (91%)     max: 153154 Points
AnTuTu v7 - AnTuTu v7 Total Score
min: 217967     avg: 354450     median: 368232 (65%)     max: 398720 Points
min: 302955     avg: 347775     median: 358800 (63%)     max: 370545 Points
min: 456891     avg: 459752     median: 459850 (81%)     max: 462516 Points
AnTuTu v8 - AnTuTu v8 UX
min: 51228     avg: 63930     median: 64229 (54%)     max: 72343 Points
min: 71574     avg: 71607     median: 71606.5 (60%)     max: 71639 Points
min: 64361     avg: 75201     median: 78294 (65%)     max: 82947 Points
AnTuTu v8 - AnTuTu v8 MEM
min: 52596     avg: 61638     median: 59373 (48%)     max: 75544 Points
min: 45962     avg: 56767     median: 56767 (46%)     max: 67572 Points
min: 67691     avg: 75819     median: 74262 (60%)     max: 85504 Points
AnTuTu v8 - AnTuTu v8 GPU
min: 158097     avg: 167704     median: 167146 (31%)     max: 175532 Points
min: 166588     avg: 170290     median: 170290 (31%)     max: 173992 Points
min: 190559     avg: 203672     median: 209164 (38%)     max: 211292 Points
AnTuTu v8 - AnTuTu v8 CPU
min: 114777     avg: 135173     median: 139365 (50%)     max: 140166 Points
min: 98561     avg: 122385     median: 122385 (44%)     max: 146209 Points
min: 149088     avg: 156731     median: 152919 (55%)     max: 168185 Points
AnTuTu v8 - AnTuTu v8 Total Score
min: 376698     avg: 428445     median: 432658 (42%)     max: 451559 Points
min: 411764     avg: 421049     median: 421048 (41%)     max: 430333 Points
min: 489463     avg: 511422     median: 510245 (49%)     max: 534558 Points
Antutu v9 - AnTuTu v9 Total Score
549549 Points (33%)
622382 Points (38%)
Antutu v9 - AnTuTu v9 CPU
129427 Points (35%)
147649 Points (40%)
PassMark PerformanceTest Mobile V1 - PerformanceTest Mobile V1 CPU Tests
min: 197214     avg: 236383     median: 246456 (32%)     max: 265478 Points
min: 482773     avg: 486852     median: 486197 (64%)     max: 491585 Points
min: 650706     avg: 678820     median: 683897 (90%)     max: 701856 Points
PCMark for Android - PCM f. Android Storage 2.0 random write internal
100%
1 SD 855 +
50.5 MB/s (37%)
PCMark for Android - PCM f. Android Storage 2.0 seq write internal
100%
1 SD 855 +
304 MB/s (9%)
PCMark for Android - PCM f. Android Storage 2.0 random read internal
100%
1 SD 855 +
32.9 MB/s (40%)
PCMark for Android - PCM f. Android Storage 2.0 seq read internal
100%
1 SD 855 +
1246 MB/s (35%)
PCMark for Android - PCM f. Android Storage 2.0 score
100%
1 SD 855 +
27144 Points (48%)
PCMark for Android - PCM f. Android Work Score 3.0
100%
1 SD 855 +
8421 Points (39%)
PCMark for Android - PCM f. Android Computer Vision
100%
1 SD 855 +
min: 5121     avg: 6872     median: 6326.5 (33%)     max: 12391 Points
PCMark for Android - PCM f. Android Storage
100%
1 SD 855 +
min: 5578     avg: 11793     median: 11067 (24%)     max: 18491 Points
CrossMark - CrossMark Overall
min: 776     avg: 835     median: 849 (33%)     max: 864 Points
Power Consumption - Geekbench 5.5 Power Consumption 150cd *
7 Watt (3%)
Power Consumption - Idle Power Consumption 150cd 1min *
2.9 Watt (3%)

Average Benchmarks Qualcomm Snapdragon 855 → 100% n=21

Average Benchmarks Apple A12 Bionic → 111% n=21

Average Benchmarks Apple A13 Bionic → 135% n=21

- Range of benchmark values for this graphics card
- Average benchmark values for this graphics card
* Smaller numbers mean a higher performance
1 This benchmark is not used for the average calculation

v1.26
log 18. 11:18:57

#0 checking url part for id 11011 +0s ... 0s

#1 checking url part for id 10166 +0s ... 0s

#2 checking url part for id 11496 +0s ... 0s

#3 not redirecting to Ajax server +0s ... 0s

#4 did not recreate cache, as it is less than 5 days old! Created at Tue, 16 Apr 2024 05:37:29 +0200 +0.001s ... 0.001s

#5 composed specs +0.023s ... 0.024s

#6 did output specs +0s ... 0.024s

#7 getting avg benchmarks for device 11011 +0.014s ... 0.038s

#8 got single benchmarks 11011 +0.05s ... 0.088s

#9 getting avg benchmarks for device 10166 +0.003s ... 0.091s

#10 got single benchmarks 10166 +0.014s ... 0.105s

#11 getting avg benchmarks for device 11496 +0.002s ... 0.107s

#12 got single benchmarks 11496 +0.015s ... 0.122s

#13 got avg benchmarks for devices +0s ... 0.122s

#14 No cached benchmark found, getting uncached values +0.118s ... 0.24s

#15 No cached benchmark found, getting uncached values +0.002s ... 0.242s

#16 min, max, avg, median took s +0.133s ... 0.375s

#17 return log +0s ... 0.375s

Please share our article, every link counts!
> Expert Reviews and News on Laptops, Smartphones and Tech Innovations > Benchmarks / Tech > Processor Comparison - Head 2 Head
Redaktion, 2017-09- 8 (Update: 2023-07- 1)