The Samsung 850 Series EVO is a solid state drive with a capacity of 1024 GB. The drive relies on the not-so-modern SATA III bus for data transfer.
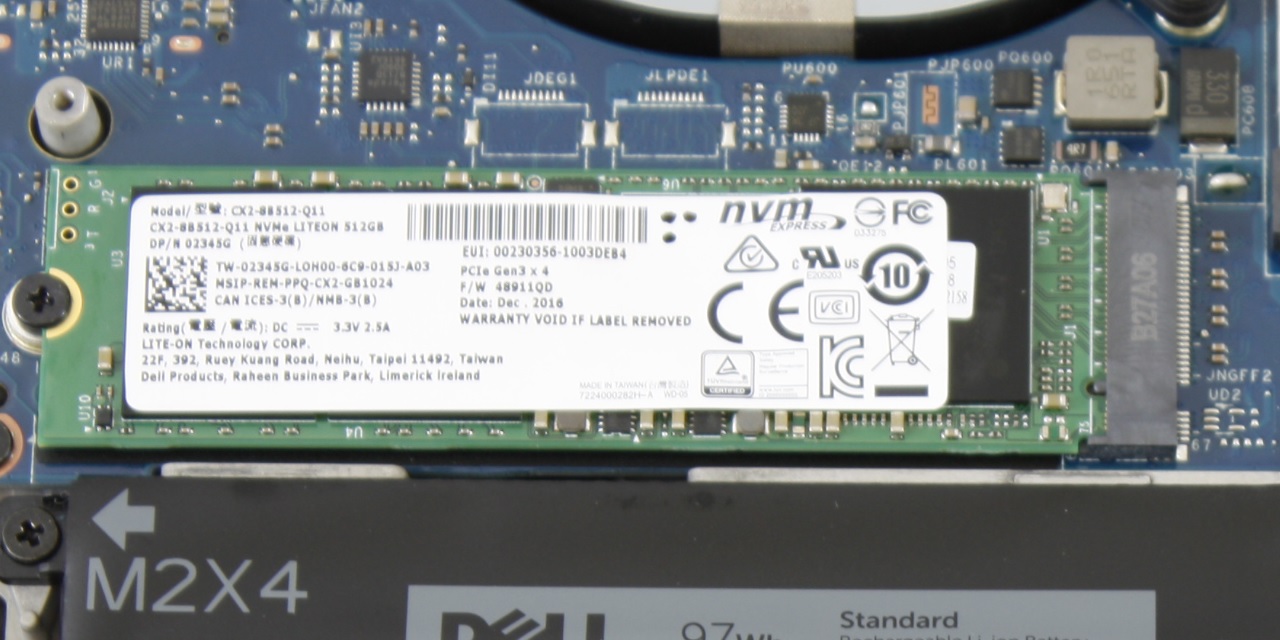
Lite-On CX2-8B512-Q11
The Lite-on CX2-8B512-Q11 is an M.2 type solid state drive with a capacity of 512 GB. The drive makes use of a modern PCIe 3.0 x4 (NVMe) interface. The data transfer rates are mid-tier as of Q1 2020.
Notebookcheck says:
... The 512 GB Lite-On CX2-8B512 NVMe SSD in our test unit is about on par with the Apple SM1024L SSD in the MacBook and the Toshiba XG3 in the HP Spectre x360 15 with some slight differences. Sequential write speeds and both reading and writing of small QD32 blocks (...) are slower than on the MacBook according to CDM. (...) Results will likely differ on SKUs with the 256 GB or 1 TB SSD option - Dell XPS 15 9560 Laptop Review | March 2017
Average Benchmarks Samsung SSD 850 EVO 1TB → 100%n=23
Average Benchmarks Lite-On CX2-8B512-Q11 → 205%n=23
- Range of benchmark values for this graphics card - Average benchmark values for this graphics card * Smaller numbers mean a higher performance 1 This benchmark is not used for the average calculation
v1.26
log 25. 15:17:45
#0 checking url part for id 785 +0s ... 0s
#1 checking url part for id 948 +0s ... 0s
#2 not redirecting to Ajax server +0s ... 0s
#3 did not recreate cache, as it is less than 5 days old! Created at Sun, 21 Apr 2024 17:34:57 +0200 +0.001s ... 0.001s
#4 composed specs +0.014s ... 0.015s
#5 did output specs +0s ... 0.015s
#6 getting avg benchmarks for device 785 +0.002s ... 0.016s
#7 got single benchmarks 785 +0.008s ... 0.025s
#8 getting avg benchmarks for device 948 +0.002s ... 0.026s
#9 got single benchmarks 948 +0.009s ... 0.035s
#10 got avg benchmarks for devices +0s ... 0.035s
#11 min, max, avg, median took s +0.254s ... 0.29s
 Deutsch
 English
 Español
 Français
 Italiano
 Nederlands
 Polski
 Português
 Русский
 Türkçe
 Svenska
 Chinese
 Magyar