ERROR: No CPU found with the ID:820

getCPUInfos: Perhaps the translation is missing or the German CPU is not selected in the page header (or a wrong one is selected) Intel Core i7-820QM vs vs Rockchip RK3066 1.5 GHz
Notebookcheck Logo

Intel Core i7-820QM vs vs Rockchip RK3066 1.5 GHz

Intel Core i7-820QM

► remove from comparison Intel 820QM

The Intel Core i7 820QM is a high end quad core CPU in 2009. It features 4 cores (quad core CPU) and Hyperthreading. Therefore, 8 threads can be worked on simultaneously.

Because of the Turbo Mode, the CPU is clocked with up to 3.06 GHz and therefore can perform very well in single core applications like older games.

The Core i7 line has an integrated memory controller for DDR3 bars (1066 or 1333). Therefore, the memory performance is very good (compared to older CPUs with external memory controllers). Still, this also leads to the higher TDP of the whole chip.

The Core micro-architecture is still very similar to the one used in the Core 2 CPUs, therefore the performance per MHz (neglecting the integrated memory controller, hyperthreading and Turbo Boost) is similar.

The power consumption of up to 45 Watt (TDP) is quite high for a laptop CPU and because of the Turbo Mode, the power consumption should reach these high values. Therefore, the CPU is only suited for large laptops.


Rockchip RK3066 1.5 GHz

► remove from comparison  RK3066

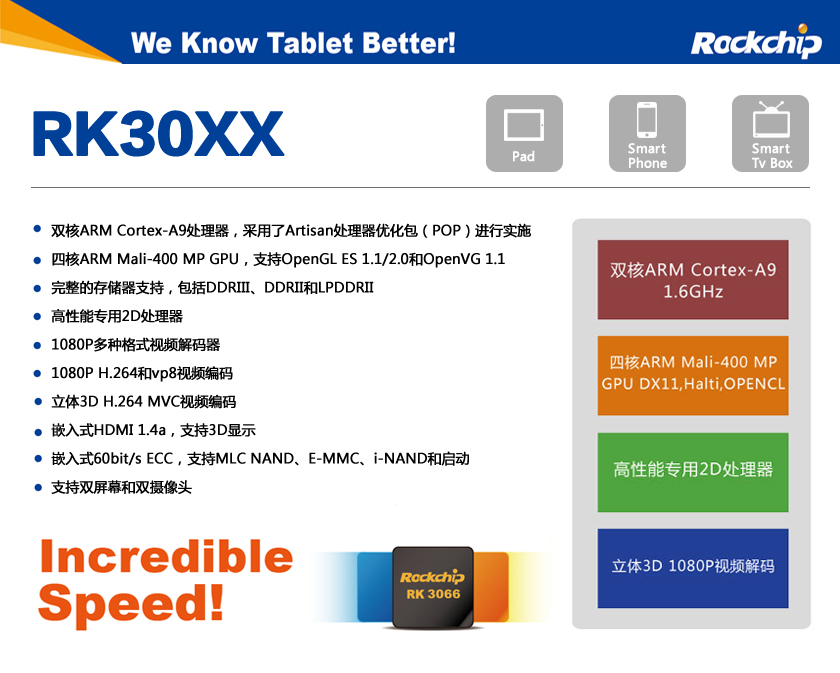
The Rockchip RK3066 is a cheap ARM based SoC for Tablets and Smartphones. It integrates two ARM Cortex-A9 (ARMv7) CPU cores with NEON extensions, a ARM Mali-400MP4 (quad-core clocked at 250 MHz) graphics card and a video de- and encoder as main components. The integrated memory controller supports a maximum of 2 GB DDR1, DDR2 or DDR3 memory.

The CPU cores can be clocked up to 1.6 GHz depending on the cooling solution of the tablet / smartphone.

Additional Features according to Wikipedia

  • VPU (Video Processing Unit) Multi-Media Processor supporting 1080p image and video decoding
  • HDMI 1.4 Interface
  • 2-channels TFT LCD Interface with 5 layers and 3D Display (1920×1080 Maximum Display Size)
  • USB 2.0 Interface
  • SD/MMC Interface

ModelIntel Core i7-820QMRockchip RK3066 1.5 GHz
SeriesIntel Core i7
CodenameClarksfield
Series:
Intel Core i7-940XM2.13 - 3.33 GHz4 / 8 cores8 MB L3
Intel Core i7-920XM2 - 3.2 GHz4 / 8 cores8 MB L3
Intel Core i7-840QM1.86 - 3.2 GHz4 / 8 cores8 MB L3
Intel Core i7-820QM « 1.73 - 3.06 GHz4 / 8 cores8 MB L3
Intel Core i7-740QM1.73 - 2.93 GHz4 / 8 cores6 MB L3
Intel Core i7-720QM1.6 - 2.8 GHz4 / 8 cores6 MB L3
HiSilicon Kirin 9000W1.53 - 2.49 GHz12 / 12 cores
UNISOC Tiger T3101.8 - 2 GHz4 / 4 cores
Rockchip RK32881.8 GHz4 / 4 cores
Apple A6x1.4 GHzcores
Apple A61 GHzcores
Apple S52 / 2 cores
HiSilicon k3v2 Hi36201.2 GHz4 / 4 cores
Rockchip RK3066 1.5 GHz « 1.5 GHz2 / 2 cores
Amlogic AML8726-MX1.5 GHz2 / 2 cores
Rockchip RK31681.2 GHz2 / 2 cores
Rockchip RK2918 1.2 GHz1.2 GHz1 / 1 cores
ARM Cortex A8 1.2 GHz1.2 GHz1 / 1 cores
Telechips TCC8803 1GHz1 GHz1 / 1 cores
Loongson 2F 900MHz0.9 GHz1 / 1 cores
CSR86700.08 GHzcores
ARM Cortex-M4 cores
HiSilicon Hi6262 cores
DK3.5+STcores
unknown cores
Clock1730 - 3060 MHz1500 MHz
FSB2500
L1 Cache256 KB
L2 Cache1 MB512 KB
L3 Cache8 MB
Cores / Threads4 / 82 / 2
TDP45 Watt
Transistors774 Million
Technology45 nm40 nm
Die Size296 mm2
max. Temp.100 °C
SocketRPGA989
Architecturex86ARM
$546 U.S.
Announced
Manufacturerark.intel.comwww.rock-chips.com
FeaturesMali-400 MP4, Single Channel DDR3 Memory Controller
iGPUARM Mali-400 MP4 (250 MHz)

Benchmarks

Cinebench R11.5 - Cinebench R11.5 CPU Multi 64 Bit
100%
1 820QM +
min: 2.95     avg: 3.1     median: 3 (4%)     max: 3.44 Points
Cinebench R10 - Cinebench R10 Rend. Single (32bit)
100%
1 820QM +
min: 3075     avg: 3457     median: 3271.5 (20%)     max: 4185 Points
Cinebench R10 - Cinebench R10 Rend. Multi (32bit)
100%
1 820QM +
min: 8341     avg: 9174     median: 8559 (6%)     max: 11966 Points
Cinebench R10 - Cinebench R10 Rend. Multi (64bit)
100%
1 820QM +
min: 10222     avg: 10498     median: 10317 (7%)     max: 11311 Points
Cinebench R10 - Cinebench R10 Rend. Single (64bit)
100%
1 820QM +
min: 3709     avg: 3952     median: 3987 (5%)     max: 4101 Points
wPrime 2.10 - wPrime 2.0 1024m *
100%
1 820QM +
min: 424     avg: 1140     median: 1361.5 (16%)     max: 1412 s
wPrime 2.10 - wPrime 2.0 32m *
100%
1 820QM +
min: 13.73     avg: 35.2     median: 42 (8%)     max: 43 s
3DMark 06 - CPU - 3DMark 06 - CPU
100%
1 820QM +
min: 3053     avg: 3226     median: 3149 (7%)     max: 3629 Points
Super Pi mod 1.5 XS 1M - Super Pi mod 1.5 XS 1M *
100%
1 820QM +
14 s (3%)
Super Pi mod 1.5 XS 2M - Super Pi mod 1.5 XS 2M *
100%
1 820QM +
min: 31     avg: 31.7     median: 32 (1%)     max: 32 s
Super Pi Mod 1.5 XS 32M - Super Pi mod 1.5 XS 32M *
100%
1 820QM +
min: 765     avg: 787     median: 780 (3%)     max: 817 s
PCMark 05 - PCMark 05 - Standard
100%
1 820QM +
7734 Points (16%)
Windows 7 Experience Index - Win7 CPU
100%
1 820QM +
min: 7.1     avg: 7.2     median: 7.2 (92%)     max: 7.2 Points
3DMark Vantage - 3DM Vant. Perf. CPU no Physx
100%
1 820QM +
min: 10851     avg: 11570     median: 11251.5 (10%)     max: 12631 Points
3DMark 11 - 3DM11 Performance Physics
100%
1 820QM +
4002 Points (11%)
3DMark - 3DMark Ice Storm Physics
100%
1 RK3066 +
min: 4687     avg: 4990     median: 5059 (4%)     max: 5161 Points
3DMark - 3DMark Ice Storm Extreme Physics
100%
1 RK3066 +
4890 Points (4%)
Geekbench 2 - 32 Bit - Geekbench Stream
100%
1 RK3066 +
min: 206     avg: 398.6     median: 390 (3%)     max: 621 Points
Geekbench 2 - 32 Bit - Geekbench Memory
100%
1 RK3066 +
min: 389     avg: 1072     median: 1071 (10%)     max: 1439 Points
Geekbench 2 - 32 Bit - Geekbench Floating Point
100%
1 RK3066 +
min: 843     avg: 1408     median: 1342 (3%)     max: 2107 Points
Geekbench 2 - 32 Bit - Geekbench Integer
100%
1 RK3066 +
min: 490     avg: 798     median: 788.5 (2%)     max: 1201 Points
Geekbench 2 - 32 Bit - Geekbench Total Score
100%
1 RK3066 +
min: 694     avg: 1026     median: 1007.5 (3%)     max: 1518 Points
Linpack Android / IOS - Linpack Multi Thread
100%
1 RK3066 +
min: 50.7     avg: 80     median: 82.5 (3%)     max: 104.6 MFLOPS
Linpack Android / IOS - Linpack Single Thread
100%
1 RK3066 +
min: 24.87     avg: 52.1     median: 54.8 (5%)     max: 62.1 MFLOPS
Sunspider - Sunspider 1.0 Total Score *
100%
1 RK3066 +
1959 ms (21%)
Sunspider - Sunspider 0.9.1 Total Score *
100%
1 RK3066 +
min: 1150     avg: 1418     median: 1355.5 (13%)     max: 1884 ms
Quadrant Standard Edition 2.0 - Quadrant Standard 2.0 Total Score
100%
1 RK3066 +
min: 3105     avg: 3862     median: 3974 (9%)     max: 4257 points
AnTuTu v3 - AnTuTu v3 CPU
100%
1 RK3066 +
min: 2135     avg: 3577     median: 3734 (24%)     max: 4267 Points
PassMark PerformanceTest Mobile V1 - PerformanceTest Mobile V1 CPU Tests
100%
1 RK3066 +
5852 Points (1%)

Average Benchmarks Intel Core i7-820QM → 0% n=

Average Benchmarks Rockchip RK3066 1.5 GHz → 0% n=

- Range of benchmark values for this graphics card
- Average benchmark values for this graphics card
* Smaller numbers mean a higher performance
1 This benchmark is not used for the average calculation

v1.26
log 20. 01:07:44

#0 checking url part for id 518 +0s ... 0s

#1 checking url part for id 820 +0s ... 0s

#2 checking url part for id 3576 +0s ... 0s

#3 not redirecting to Ajax server +0s ... 0s

#4 did not recreate cache, as it is less than 5 days old! Created at Fri, 19 Apr 2024 05:38:49 +0200 +0.001s ... 0.001s

#5 composed specs +0.081s ... 0.082s

#6 did output specs +0s ... 0.082s

#7 getting avg benchmarks for device 518 +0.003s ... 0.085s

#8 got single benchmarks 518 +0.043s ... 0.128s

#9 getting avg benchmarks for device 820 +0.003s ... 0.131s

#10 got single benchmarks 820 +0s ... 0.131s

#11 getting avg benchmarks for device 3576 +0.003s ... 0.134s

#12 got single benchmarks 3576 +0.023s ... 0.157s

#13 got avg benchmarks for devices +0s ... 0.157s

#14 min, max, avg, median took s +0.088s ... 0.245s

#15 return log +0s ... 0.245s

Please share our article, every link counts!
> Expert Reviews and News on Laptops, Smartphones and Tech Innovations > Benchmarks / Tech > Processor Comparison - Head 2 Head
Redaktion, 2017-09- 8 (Update: 2023-07- 1)