Notebookcheck Logo

Intel Core i7-7700HQ vs AMD A10-9620P vs AMD A12-9720P

Intel Core i7-7700HQ

► remove from comparison Intel i7-7700HQ

The Intel Core i7-7700HQ is a fast quad-core processor for notebooks based on the Kaby Lake H architecture (7th generation Core), which was announced in January 2017 at CES. It is the successor to the Core i7-6700HQ from the Skylake generation and is manufactured in an improved 14 nm+ process, so the clocks are 200 MHz higher at the same TDP. The architecture was not changed, only the video engine got an update (see our Kaby Lake article).

The integrated graphics card is called Intel HD Graphics 630, but the architecture does not differ from the 530 GPU from the Skylake generation and only the clocks are slightly higher. 

Performance

Thanks to the 200 MHz higher clocks (5.5-7.6% depending on the Boost), the CPU performance is increased and roughly on par with the Core i7-6970HQ (2.8-3.7 GHz but with 128 MB eDRAM). The TDP can also be reduced to 35 Watts (cTDP down), but this will reduce the performance.

Power Consumption

Due to its 45-Watt TDP, the CPU will be used in bigger notebooks with at least 15 inches most of the time.

AMD A10-9620P

► remove from comparison AMD A10-9620P

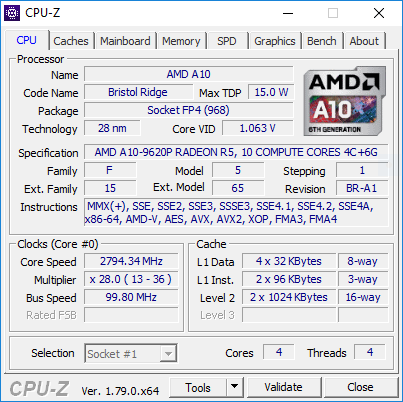
The AMD A10-9620P is a mid-range APU of the Bristol Ridge series (7th generation of APUs) with 4 CPU-cores (two Excavator modules) clocked at 2.5 - 3.4 GHz. In our tests the A10-9620P even hit 3.6 GHz.

It was announced in 2017 and is based on the same silicon as Carrizo but with more and refined features. It is a ULV-chip with a TDP of 15 Watt and integrates a Radeon R5 graphics card (384 shader cores / 6 compute cores) and a dual-channel DDR4-18600 memory controller. As Carrizo its a full featured SoC that offers all I/O ports on the chip.

The A10-9620P is a bit faster than the old 15-Watt top model of Carrizo, the FX-8800P. See our Bristol Ridge article for more information on the architecture and improvements compared to Carrizo.

AMD A12-9720P

► remove from comparison AMD A12-9720P

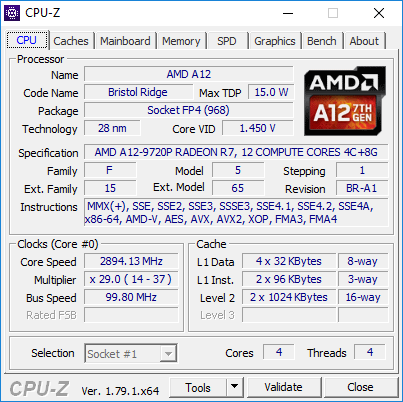
The AMD A12-9720P is a mainstream SoC from the Bristol Ridge APU series for notebooks (7th APU generation), which was introduced in 2017. The ULV chip with a TDP of 15 Watts (can be configured to 12 Watts, not verified) has four CPU cores (two Excavator modules) clocked at 2.7 - 3.8 GHz (4.05 GHz for single core were briefly achievable in our test sample), a Radeon R7 iGPU as well as a dual-channel DDR4-1866 memory controller. Carrizo is a full-fledged SoC and is also equipped with an integrated chipset, which provides all I/0 ports.

Architecture

Bristol Ridge is the successor of the Carrizo architecture and the design is almost identical. Thanks to optimized manufacturing processes and more aggressive Boost behavior, however, the clocks are a bit higher at the same power consumption. The memory controller now also supports DDR4-RAM, in this case up to 1866 MHz. More technical details are available in the following articles:

Performance

The average A12-9720P in our database is in the same league as the Core i5-4210U, as far as multi-thread benchmark scores are concerned, making the former a fairly slow chip that's suitable for basic day-to-day activities only as of late 2022.

Graphics

The integrated Radeon R7 (Bristol Ridge) GPU has 512 active shader units (8 compute cores) clocked at up to 758 MHz. Thanks to the better utilization of the clock range as well as faster DDR4-RAM, the GPU can slightly beat its predecessors Radeon R7 (Carrizo) and competes with a dedicated GeForce 920MX in the best-case scenario (dual-channel memory, low CPU requirements). Many games from 2015/2016 can be played smoothly at low settings.

Power Consumption

AMD specifies the TDP of the A12-9720P with 15 Watts, which is comparable to Intel's ULV models. This means the CPU is a good choice for thin notebooks starting with a 12-inch screen.

ModelIntel Core i7-7700HQAMD A10-9620PAMD A12-9720P
SeriesIntel Kaby LakeAMD Bristol RidgeAMD Bristol Ridge
CodenameKaby LakeBristol RidgeBristol Ridge
Series: Bristol Ridge Bristol Ridge
Intel Core i7-7700K4.2 - 4.5 GHz4 / 8 cores8 MB L3
Intel Core i7-77003.6 - 4.2 GHz4 / 8 cores8 MB L3
Intel Xeon E3-1535M v63.1 - 4.2 GHz4 / 8 cores8 MB L3
Intel Core i7-7920HQ3.1 - 4.1 GHz4 / 8 cores8 MB L3
Intel Core i7-7700T2.9 - 3.8 GHz4 / 8 cores8 MB L3
Intel Core i5-7600K3.8 - 4.2 GHz4 / 4 cores8 MB L3
Intel Xeon E3-1505M v63 - 4 GHz4 / 8 cores8 MB L3
Intel Core i7-7820HQ2.9 - 3.9 GHz4 / 8 cores8 MB L3
Intel Core i7-7820HK2.9 - 3.9 GHz4 / 8 cores8 MB L3
Intel Core i7-7700HQ « 2.8 - 3.8 GHz4 / 8 cores6 MB L3
Intel Core i5-75003.4 - 3.8 GHz4 / 4 cores6 MB L3
Intel Core i5-7440HQ2.8 - 3.8 GHz4 / 4 cores6 MB L3
Intel Core i7-7567U3.5 - 4 GHz2 / 4 cores4 MB L3
Intel Core i7-7660U2.5 - 4 GHz2 / 4 cores4 MB L3
Intel Core i7-7600U2.8 - 3.9 GHz2 / 4 cores4 MB L3
Intel Core i5-7300HQ2.5 - 3.5 GHz4 / 4 cores6 MB L3
Intel Core i5-7500T2.7 - 3.3 GHz4 / 4 cores6 MB L3
Intel Core i5-7287U3.3 - 3.7 GHz2 / 4 cores4 MB L3
Intel Core i7-7560U2.4 - 3.8 GHz2 / 4 cores4 MB L3
Intel Core i5-7267U3.1 - 3.5 GHz2 / 4 cores4 MB L3
Intel Core i5-7360U2.3 - 3.6 GHz2 / 4 cores4 MB L3
Intel Core i7-7500U2.7 - 3.5 GHz2 / 4 cores4 MB L3
Intel Core i5-7300U2.6 - 3.5 GHz2 / 4 cores3 MB L3
Intel Core i5-7260U2.2 - 3.4 GHz2 / 4 cores4 MB L3
Intel Core i5-7200U2.5 - 3.1 GHz2 / 4 cores3 MB L3
Intel Core i3-7100H3 GHz2 / 4 cores3 MB L3
Intel Core i3-7167U2.8 GHz2 / 4 cores3 MB L3
Intel Core i7-7Y751.3 - 3.6 GHz2 / 4 cores4 MB L3
Intel Core i5-7Y571.2 - 3.3 GHz2 / 4 cores4 MB L3
Intel Core i5-7Y541.2 - 3.2 GHz2 / 4 cores4 MB L3
Intel Core i3-7100U2.4 GHz2 / 4 cores3 MB L3
Intel Core m3-7Y321 - 3 GHz2 / 4 cores4 MB L3
Intel Pentium Gold 4415U2.3 GHz2 / 4 cores2 MB L3
Intel Core m3-7Y301 - 2.6 GHz2 / 4 cores4 MB L3
Intel Celeron 3965U2.2 GHz2 / 2 cores2 MB L3
Intel Core i3-7020U2.3 GHz2 / 4 cores3 MB L3
Intel Celeron 3867U1.8 GHz2 / 2 cores2 MB L3
Intel Celeron 3865U1.8 GHz2 / 2 cores2 MB L3
Intel Pentium Gold 4425Y1.7 GHz2 / 4 cores2 MB L3
Intel Pentium Gold 4415Y1.6 GHz2 / 4 cores2 MB L3
Intel Pentium Gold 4410Y1.5 GHz2 / 4 cores2 MB L3
Intel Celeron 3965Y1.5 GHz2 / 2 cores2 MB L3
AMD FX-9830P3 - 3.7 GHz4 / 4 cores
AMD PRO A12-9830B3 - 3.7 GHz4 / 4 cores
AMD FX-9800P2.7 - 3.6 GHz4 / 4 cores
AMD PRO A12-9800B2.7 - 3.6 GHz4 / 4 cores
AMD A12-9720P2.7 - 3.6 GHz4 / 4 cores
AMD A12-9700P2.5 - 3.4 GHz4 / 4 cores
AMD A10-9620P « 2.5 - 3.4 GHz4 / 4 cores
AMD A10-9600P2.4 - 3.3 GHz4 / 4 cores
AMD PRO A8-9600B2.4 - 3.3 GHz4 / 4 cores
AMD FX-9830P3 - 3.7 GHz4 / 4 cores
AMD PRO A12-9830B3 - 3.7 GHz4 / 4 cores
AMD FX-9800P2.7 - 3.6 GHz4 / 4 cores
AMD PRO A12-9800B2.7 - 3.6 GHz4 / 4 cores
AMD A12-9720P « 2.7 - 3.6 GHz4 / 4 cores
AMD A12-9700P2.5 - 3.4 GHz4 / 4 cores
AMD A10-9620P2.5 - 3.4 GHz4 / 4 cores
AMD A10-9600P2.4 - 3.3 GHz4 / 4 cores
AMD PRO A8-9600B2.4 - 3.3 GHz4 / 4 cores
Clock2800 - 3800 MHz2500 - 3400 MHz2700 - 3600 MHz
L1 Cache256 KB
L2 Cache1 MB2 MB2 MB
L3 Cache6 MB
Cores / Threads4 / 84 / 44 / 4
TDP45 Watt15 Watt15 Watt
Technology14 nm28 nm28 nm
max. Temp.100 °C90 °C90 °C
SocketBGAFP4FP4
FeaturesDual-Channel DDR3L-1600/DDR4-2133 Memory Controller, AVX, AVX2, Quick Sync, Virtualization, AES-NI saveDual-Channel DDR3/DDR4-1866 Memory Controller, PCIe 3.0 x8DDR4-1866 RAM, PCIe 3, MMX, SSE, SSE2, SSE3, SSSE3, SSE4A, SSE4.1, SSE4.2, AVX, AVX2, BMI2, ABM, TBM, FMA4, XOP, SMEP, CPB, AES-NI, RDRAND
iGPUIntel HD Graphics 630 (350 - 1100 MHz)AMD Radeon R5 (Bristol Ridge) ( - 758 MHz)AMD Radeon R7 (Bristol Ridge) ( - 758 MHz)
Architecturex86x86x86
$378 U.S.
Announced
Transistors3100 Million3100 Million
Die Size250 mm2250 mm2

Benchmarks

Performance Rating - CB R15 + R20 + 7-Zip + X265 + Blender + 3DM11 CPU - i7-7700HQ
28.2 pt (39%)
Cinebench R20 - Cinebench R20 CPU (Single Core)
min: 358     avg: 370     median: 370 (41%)     max: 382 Points
Cinebench R20 - Cinebench R20 CPU (Multi Core)
min: 1765     avg: 1774     median: 1774 (4%)     max: 1783 Points
Cinebench R15 - Cinebench R15 CPU Multi 64 Bit
min: 603     avg: 727     median: 734 (5%)     max: 747 Points
230 Points (1%)
min: 229     avg: 234.5     median: 234.5 (1%)     max: 240 Points
Cinebench R15 - Cinebench R15 CPU Single 64 Bit
min: 120     avg: 155.4     median: 159 (48%)     max: 162 Points
72 Points (22%)
min: 69     avg: 72.5     median: 72.5 (22%)     max: 76 Points
Cinebench R11.5 - Cinebench R11.5 CPU Multi 64 Bit
min: 6.67     avg: 8     median: 8.1 (11%)     max: 8.23 Points
2.7 Points (3%)
min: 2.6     avg: 2.7     median: 2.7 (3%)     max: 2.7 Points
Cinebench R11.5 - Cinebench R11.5 CPU Single 64 Bit
min: 1.36     avg: 1.8     median: 1.8 (45%)     max: 1.84 Points
0.8 Points (20%)
min: 0.93     avg: 0.9     median: 0.9 (23%)     max: 0.94 Points
Cinebench R10 - Cinebench R10 Rend. Single (32bit)
min: 5426     avg: 5882     median: 5910 (36%)     max: 7214 Points
2277 Points (14%)
min: 2640     avg: 2743     median: 2743 (17%)     max: 2846 Points
Cinebench R10 - Cinebench R10 Rend. Multi (32bit)
min: 19409     avg: 22384     median: 22152 (16%)     max: 29209 Points
7420 Points (5%)
min: 7200     avg: 7361     median: 7361 (5%)     max: 7522 Points
Cinebench R10 - Cinebench R10 Rend. Multi (64bit)
min: 28341     avg: 28770     median: 28724.5 (20%)     max: 29210 Points
Cinebench R10 - Cinebench R10 Rend. Single (64bit)
min: 7347     avg: 7559     median: 7584 (9%)     max: 7795 Points
wPrime 2.10 - wPrime 2.0 1024m *
min: 210.4     avg: 257.2     median: 225.7 (3%)     max: 379 s
470.9 s (6%)
415.5 s (5%)
wPrime 2.10 - wPrime 2.0 32m *
min: 6.932     avg: 8.7     median: 7.5 (2%)     max: 20.1 s
14.4 s (3%)
13 s (3%)
wPrime 1.55 - wPrime 1.55 1024m *
212.2 s (1%)
wPrime 1.55 - wPrime 1.55 32m *
7.6 s (4%)
WinRAR - WinRAR 4.0
min: 3763     avg: 4418     median: 4541.5 (7%)     max: 4903 Points
7-Zip 18.03 - 7-Zip 18.03 Multli Thread 4 runs
min: 18417     avg: 20916     median: 19916 (11%)     max: 25414 MIPS
7-Zip 18.03 - 7-Zip 18.03 Single Thread 4 runs
min: 3986     avg: 4405     median: 4088 (49%)     max: 5457 MIPS
X264 HD Benchmark 4.0 - x264 Pass 2
min: 36.55     avg: 44.6     median: 46 (16%)     max: 46.45 fps
16.3 fps (6%)
X264 HD Benchmark 4.0 - x264 Pass 1
min: 156.9     avg: 168.1     median: 168.4 (39%)     max: 175 fps
76.6 fps (18%)
HWBOT x265 Benchmark v2.2 - HWBOT x265 4k Preset
min: 5.97     avg: 6.2     median: 6 (11%)     max: 6.39 fps
TrueCrypt - TrueCrypt Serpent
min: 0.361     avg: 0.4     median: 0.4 (0%)     max: 0.6 GB/s
0.2 GB/s (0%)
TrueCrypt - TrueCrypt Twofish
min: 0.529     avg: 0.7     median: 0.7 (12%)     max: 0.724 GB/s
0.4 GB/s (6%)
TrueCrypt - TrueCrypt AES
min: 2.4     avg: 4     median: 4.1 (11%)     max: 4.2 GB/s
1.8 GB/s (5%)
Blender - Blender 2.79 BMW27 CPU *
min: 597     avg: 631     median: 631 (4%)     max: 665 Seconds
R Benchmark 2.5 - R Benchmark 2.5 *
min: 0.7217     avg: 0.7     median: 0.7 (16%)     max: 0.7605 sec
3DMark 06 - CPU - 3DMark 06 - CPU
min: 6876     avg: 7596     median: 7686 (16%)     max: 7839 Points
Super Pi mod 1.5 XS 1M - Super Pi mod 1.5 XS 1M *
min: 9     avg: 10.3     median: 10 (2%)     max: 14.8 s
18.2 s (4%)
min: 17.77     avg: 19.6     median: 19.6 (4%)     max: 21.4 s
Super Pi mod 1.5 XS 2M - Super Pi mod 1.5 XS 2M *
min: 22     avg: 23.3     median: 22.7 (1%)     max: 33.4 s
40.3 s (2%)
min: 39.77     avg: 44.1     median: 44.1 (2%)     max: 48.5 s
Super Pi Mod 1.5 XS 32M - Super Pi mod 1.5 XS 32M *
min: 511     avg: 565     median: 551 (2%)     max: 921 s
977 s (4%)
min: 864     avg: 902     median: 901.5 (4%)     max: 939 s
3DMark Vantage - 3DM Vant. Perf. CPU no Physx
min: 22514     avg: 25520     median: 26567 (23%)     max: 26880 Points
3DMark 11 - 3DM11 Performance Physics
min: 6007     avg: 8386     median: 8833 (24%)     max: 9653 Points
2399 Points (6%)
2761 Points (7%)
3DMark - 3DMark Ice Storm Physics
min: 13754     avg: 46073     median: 47945 (39%)     max: 52765 Points
22553 Points (18%)
25648 Points (21%)
3DMark - 3DMark Ice Storm Extreme Physics
min: 33185     avg: 46275     median: 47639 (39%)     max: 52753 Points
24032 Points (19%)
24747 Points (20%)
3DMark - 3DMark Ice Storm Unlimited Physics
min: 42156     avg: 50621     median: 50806 (43%)     max: 53642 Points
min: 24457     avg: 27079     median: 27079 (23%)     max: 29701 Points
3DMark - 3DMark Cloud Gate Physics
min: 4328     avg: 7329     median: 7518.5 (19%)     max: 7867 Points
2338 Points (6%)
min: 2258     avg: 2330     median: 2329.5 (6%)     max: 2401 Points
3DMark - 3DMark Fire Strike Standard Physics
min: 6143     avg: 10428     median: 10617.5 (19%)     max: 10953 Points
3175 Points (6%)
min: 3179     avg: 3265     median: 3264.5 (6%)     max: 3350 Points
3DMark - 3DMark Time Spy CPU
min: 2863     avg: 3938     median: 3951 (17%)     max: 4383 Points
Geekbench 5.5 - Geekbench 5.1 - 5.4 64 Bit Single-Core
1004 Points (42%)
Geekbench 5.5 - Geekbench 5.1 - 5.4 64 Bit Multi-Core
3742 Points (7%)
Geekbench 5.0 - Geekbench 5.0 64 Bit Single-Core
1030 Points (4%)
Geekbench 5.0 - Geekbench 5.0 64 Bit Multi-Core
3924 Points (12%)
Geekbench 4.4 - Geekbench 4.1 - 4.4 64 Bit Single-Core
min: 4415     avg: 4638     median: 4635 (46%)     max: 4808 Points
Geekbench 4.4 - Geekbench 4.1 - 4.4 64 Bit Multi-Core
min: 13053     avg: 14679     median: 14783 (16%)     max: 15111 Points
Geekbench 4.0 - Geekbench 4.0 64 Bit Single-Core
min: 4119     avg: 4477     median: 4452.5 (61%)     max: 4740 Points
Geekbench 4.0 - Geekbench 4.0 64 Bit Multi-Core
min: 12384     avg: 13663     median: 14009.5 (34%)     max: 14596 Points
Geekbench 3 - Geekbench 3 32 Bit Multi-Core
min: 13290     avg: 13780     median: 13936.5 (25%)     max: 14275 Points
Geekbench 3 - Geekbench 3 32 Bit Single-Core
min: 3256     avg: 3641     median: 3675 (72%)     max: 3843 Points
Geekbench 3 - Geekbench 3 64 Bit Multi-Core
min: 13753     avg: 14103     median: 14102.5 (22%)     max: 14452 Points
Geekbench 3 - Geekbench 3 64 Bit Single-Core
min: 3532     avg: 3715     median: 3715 (56%)     max: 3898 Points
Geekbench 2 - 32 Bit - Geekbench Stream
7620 Points (61%)
Geekbench 2 - 32 Bit - Geekbench Memory
7210 Points (65%)
Geekbench 2 - 32 Bit - Geekbench Floating Point
12792 Points (25%)
Geekbench 2 - 32 Bit - Geekbench Integer
13091 Points (26%)
Geekbench 2 - 32 Bit - Geekbench Total Score
11263 Points (29%)
PassMark PerformanceTest 9 - PerformanceTest 9.0 CPU Mark
10003 Points (52%)
Mozilla Kraken 1.1 - Kraken 1.1 Total Score *
min: 919     avg: 982     median: 965 (1%)     max: 1244 ms
2422 ms (3%)
Sunspider - Sunspider 1.0 Total Score *
min: 67.2     avg: 75.1     median: 72.4 (1%)     max: 108.5 ms
min: 146.6     avg: 192.1     median: 192.1 (2%)     max: 237.6 ms
Octane V2 - Octane V2 Total Score
min: 30332     avg: 38344     median: 38801 (35%)     max: 41638 Points
min: 14783     avg: 16961     median: 16960.5 (15%)     max: 19138 Points
WebXPRT 3 - WebXPRT 3 Score
152 Points (32%)
Power Consumption - Prime95 Power Consumption - external Monitor *
min: 70     avg: 76.1     median: 72.5 (12%)     max: 94 Watt
Power Consumption - Cinebench R15 Multi Power Consumption - external Monitor *
min: 60     avg: 64.2     median: 63.5 (12%)     max: 70 Watt
Power Consumption - Cinebench R15 Multi Power Efficiency - external Monitor
min: 10.6     avg: 11.3     median: 11.3 (8%)     max: 11.9 Points per Watt

Average Benchmarks Intel Core i7-7700HQ → 100% n=16

Average Benchmarks AMD A10-9620P → 56% n=16

Average Benchmarks AMD A12-9720P → 58% n=16

- Range of benchmark values for this graphics card
- Average benchmark values for this graphics card
* Smaller numbers mean a higher performance
1 This benchmark is not used for the average calculation

v1.26
log 23. 13:49:48

#0 checking url part for id 8400 +0s ... 0s

#1 checking url part for id 9188 +0s ... 0s

#2 checking url part for id 9192 +0s ... 0s

#3 not redirecting to Ajax server +0s ... 0s

#4 did not recreate cache, as it is less than 5 days old! Created at Tue, 23 Apr 2024 05:40:15 +0200 +0.001s ... 0.001s

#5 composed specs +0.054s ... 0.055s

#6 did output specs +0s ... 0.055s

#7 getting avg benchmarks for device 8400 +0.022s ... 0.077s

#8 got single benchmarks 8400 +0.584s ... 0.661s

#9 getting avg benchmarks for device 9188 +0.003s ... 0.664s

#10 got single benchmarks 9188 +0.01s ... 0.674s

#11 getting avg benchmarks for device 9192 +0.003s ... 0.677s

#12 got single benchmarks 9192 +0.014s ... 0.691s

#13 got avg benchmarks for devices +0s ... 0.691s

#14 min, max, avg, median took s +0.439s ... 1.13s

#15 return log +0s ... 1.13s

Please share our article, every link counts!
> Expert Reviews and News on Laptops, Smartphones and Tech Innovations > Benchmarks / Tech > Processor Comparison - Head 2 Head
Redaktion, 2017-09- 8 (Update: 2023-07- 1)