

Intel Core i5-540M vs Intel Pentium B980 vs Intel Pentium B960
Intel Core i5-540M
► remove from comparison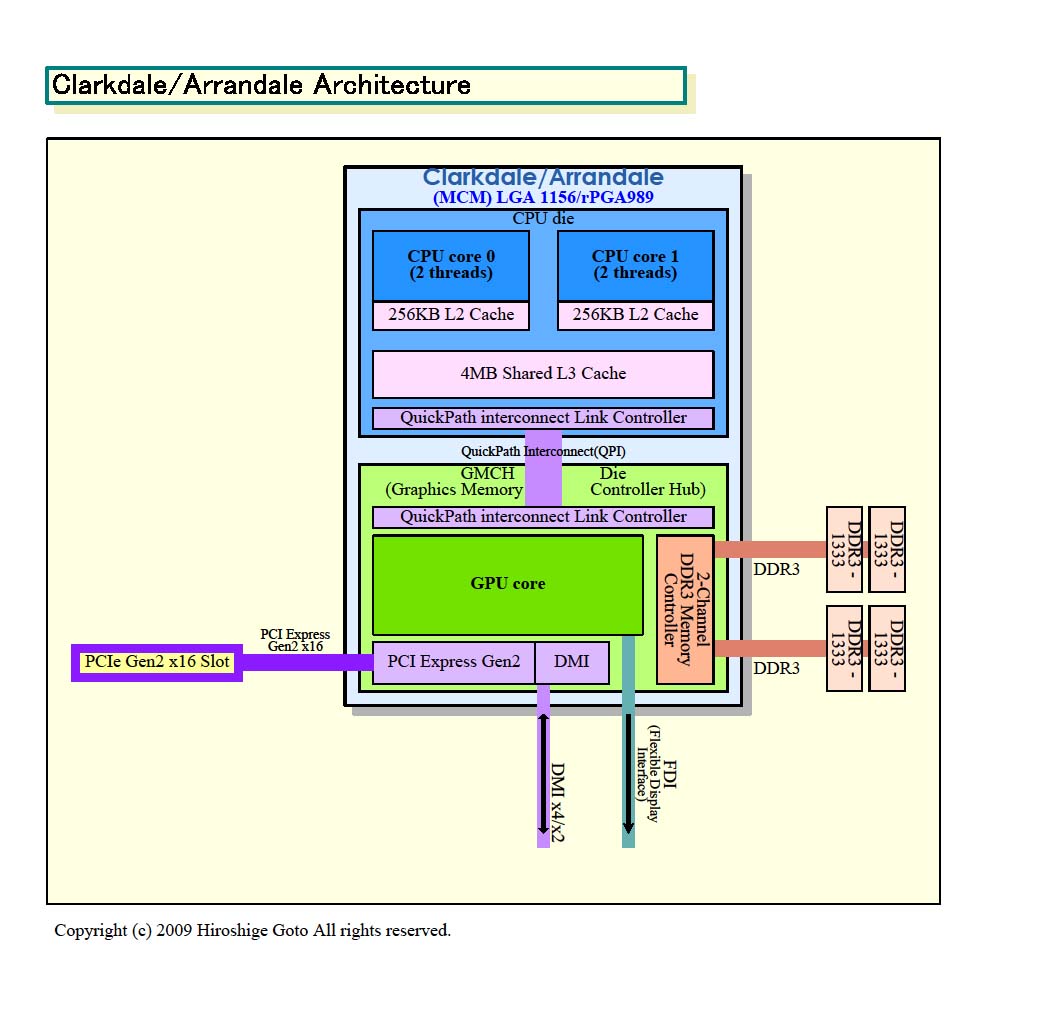
The Intel Core i5-540M is a mid-range dual core CPU for laptops and clocks (due to the Turbo Mode) from 2.53 to 3.06 GHz. Each core is based on the Nehalem (Westmere) micro-architecture. Hyperthreading enables the Dual Core CPU to handle 4 threads at once (for a better usage of the pipeline). Compared to the faster Core i7-620M, the 540M only has 3 MB Level 3 Cache and a lower clock speed.
A feature of the new Core i5-540M is the integrated graphics card called GMA HD and memory controller. Both are on a separate die that is still manufactured in 45nm whereas the CPU die is already manufactured in the new 32nm process.
The performance of the Core i5-540M is on average faster than a 2.8 GHz Core 2 Duo T9800 and in some benchmarks even faster than the fastest Core 2 Duo T9900 (e.g. 3DMark 06 CPU Score). Therefore, the Core i5-540M is a high end dual core cpu which should handle all daily work and gaming tasks. Only the quad core i7 CPUs can be noticeably faster at tasks that require four or more threads (e.g. rendering).
The 32nm cpu cores of the Westmere generation can also process some new instructions to accelerate AES encryptions.
The integrated Intel Graphics Media Accelerator HD (GMA HD) graphics card is known to be clocked up to 500-766 MHz and should be clearly faster than the old GMA 4500MHD. A GeForce 9400M (ION) should still be a faster (especially as Nvidia and ATI cards have a better driver support than Intel up to now). According to rumors, the GMA core will also use the Turbo Mode regulate the clock speed.
The power consumption of 35 Watt TDP (max.) counts for the whole package and therefore it is clearly better than the 35 Watt TDP of the Core 2 Duo T-series (CPU alone). Due to the Turbo Boost, the Core i5 is likely to use the whole TDP of 35 Watt under load and therefore can use more power than a similar specified Core 2 Duo. In Idle mode, the i5 uses clearly less power than the Core 2 Duo CPUs.
Intel Pentium B980
► remove from comparison
The Intel Pentium B980 is a dual core processor for entry-level laptops. It is based on the Sandy Bridge architecture but many of the features like Turbo Boost for the CPU part, HyperThreading, AES, Virtualization (VT-x and VT-d), Trusted Execution or Intel Quick Sync are deactivated. The Pentium B980 integrates a graphics card called Intel HD Graphics that is based on the desktop HD Graphics 2000 clocked at 650 / 1150 (with Turbo Boost).
The performance of the Pentium B980 should be clearly faster than a similar clocked Arrandale Pentium CPU. Due to the high clock speed, the missing HyperThreading and smaller last level cache should be equalized and therefore, the performance should be similar to a Intel Core i3-2310M with 2.1 GHz.
The 35W TDP rating includes the integrated GPU and DDR3-1333 memory controller.
Intel Pentium B960
► remove from comparison
The Intel Pentium B960 is a dual core processor for entry-level laptops. It is based on the Sandy Bridge architecture but many of the features like Turbo Boost for the CPU part, HyperThreading, AES, Virtualization (VT-x and VT-d), Trusted Execution or Intel Quick Sync are deactivated. The Pentium B960 integrates a graphics card called Intel HD Graphics that is based on the HD Graphics 2000 clocked at 650 / 1100 (with Turbo Boost).
The performance of the Pentium B960 should be faster than a similar clocked Arrandale Pentium CPU. Therefore, the B960 should perform similar to the Core i3-330M with 2.13 GHz, HyperThreading and 3MB Cache.
The 35W TDP rating includes the integrated GPU and DDR3-1333 memory controller.
| Model | Intel Core i5-540M | Intel Pentium B980 | Intel Pentium B960 | ||||||||||||||||||||||||||||||||||||||||||||||||||||||||||||||||||||||||||||||||||||||||||||||||||||||||||||||||||||||||||||||||||||
| Codename | Arrandale | Sandy Bridge | Sandy Bridge | ||||||||||||||||||||||||||||||||||||||||||||||||||||||||||||||||||||||||||||||||||||||||||||||||||||||||||||||||||||||||||||||||||||
| Series | Intel Core i5 | Intel Pentium | Intel Pentium | ||||||||||||||||||||||||||||||||||||||||||||||||||||||||||||||||||||||||||||||||||||||||||||||||||||||||||||||||||||||||||||||||||||
| Series: Pentium Sandy Bridge |
|
|
| ||||||||||||||||||||||||||||||||||||||||||||||||||||||||||||||||||||||||||||||||||||||||||||||||||||||||||||||||||||||||||||||||||||
| Clock | 2530 - 3066 MHz | 2400 MHz | 2200 MHz | ||||||||||||||||||||||||||||||||||||||||||||||||||||||||||||||||||||||||||||||||||||||||||||||||||||||||||||||||||||||||||||||||||||
| FSB | 2500 | ||||||||||||||||||||||||||||||||||||||||||||||||||||||||||||||||||||||||||||||||||||||||||||||||||||||||||||||||||||||||||||||||||||||
| L1 Cache | 128 KB | 128 KB | 128 KB | ||||||||||||||||||||||||||||||||||||||||||||||||||||||||||||||||||||||||||||||||||||||||||||||||||||||||||||||||||||||||||||||||||||
| L2 Cache | 512 KB | 512 KB | 512 KB | ||||||||||||||||||||||||||||||||||||||||||||||||||||||||||||||||||||||||||||||||||||||||||||||||||||||||||||||||||||||||||||||||||||
| L3 Cache | 3 MB | 2 MB | 2 MB | ||||||||||||||||||||||||||||||||||||||||||||||||||||||||||||||||||||||||||||||||||||||||||||||||||||||||||||||||||||||||||||||||||||
| Cores / Threads | 2 / 4 | 2 / 2 | 2 / 2 | ||||||||||||||||||||||||||||||||||||||||||||||||||||||||||||||||||||||||||||||||||||||||||||||||||||||||||||||||||||||||||||||||||||
| TDP | 35 Watt | 35 Watt | 35 Watt | ||||||||||||||||||||||||||||||||||||||||||||||||||||||||||||||||||||||||||||||||||||||||||||||||||||||||||||||||||||||||||||||||||||
| Transistors | 382+177 Million | 624 Million | 624 Million | ||||||||||||||||||||||||||||||||||||||||||||||||||||||||||||||||||||||||||||||||||||||||||||||||||||||||||||||||||||||||||||||||||||
| Technology | 32 nm | 32 nm | 32 nm | ||||||||||||||||||||||||||||||||||||||||||||||||||||||||||||||||||||||||||||||||||||||||||||||||||||||||||||||||||||||||||||||||||||
| Die Size | 81+114 mm2 | 149 mm2 | 149 mm2 | ||||||||||||||||||||||||||||||||||||||||||||||||||||||||||||||||||||||||||||||||||||||||||||||||||||||||||||||||||||||||||||||||||||
| max. Temp. | 105 °C | 85 °C | 85 °C | ||||||||||||||||||||||||||||||||||||||||||||||||||||||||||||||||||||||||||||||||||||||||||||||||||||||||||||||||||||||||||||||||||||
| Socket | BGA1288, PGA988 | rPGA988B | rPGA988B | ||||||||||||||||||||||||||||||||||||||||||||||||||||||||||||||||||||||||||||||||||||||||||||||||||||||||||||||||||||||||||||||||||||
| Features | Turbo Boost, Hyper Threading, Enhanced Speedstep, integrierte GMA HD 733MHz, | HD Graphics, DDR3 Memory Controller | HD Graphics, DDR3 Memory Controller | ||||||||||||||||||||||||||||||||||||||||||||||||||||||||||||||||||||||||||||||||||||||||||||||||||||||||||||||||||||||||||||||||||||
| Architecture | x86 | x86 | x86 | ||||||||||||||||||||||||||||||||||||||||||||||||||||||||||||||||||||||||||||||||||||||||||||||||||||||||||||||||||||||||||||||||||||
| $257 U.S. | $125 U.S. | ||||||||||||||||||||||||||||||||||||||||||||||||||||||||||||||||||||||||||||||||||||||||||||||||||||||||||||||||||||||||||||||||||||||
| Announced | |||||||||||||||||||||||||||||||||||||||||||||||||||||||||||||||||||||||||||||||||||||||||||||||||||||||||||||||||||||||||||||||||||||||
| Manufacturer | ark.intel.com | ark.intel.com | |||||||||||||||||||||||||||||||||||||||||||||||||||||||||||||||||||||||||||||||||||||||||||||||||||||||||||||||||||||||||||||||||||||
| iGPU | Intel HD Graphics (Sandy Bridge) (650 - 1100 MHz) | Intel HD Graphics (Sandy Bridge) (650 - 1100 MHz) |

Benchmarks

Average Benchmarks Intel Core i5-540M → 100% n=15
Average Benchmarks Intel Pentium B980 → 83% n=15
Average Benchmarks Intel Pentium B960 → 78% n=15
* Smaller numbers mean a higher performance
1 This benchmark is not used for the average calculation