Notebookcheck Logo

Intel Core i3-5010U vs AMD A12-9720P

Intel Core i3-5010U

► remove from comparison Intel 5010U

The Intel Core i3-5010U is an ULV (ultra low voltage) dual-core processor based on the Broadwell architecture, which has been launched in January 2015. In addition to two CPU cores with Hyper-Threading clocked at 2.1 GHz (no Turbo), the chip also integrates an HD Graphics 5500 GPU and a dual-channel DDR3(L)-1600 memory controller. The Core i3 is manufactured in a 14 nm process with FinFET transistors.

Architecture

Broadwell represents the "Tick" in Intel's Tick-Tock model, which means a shrink of its predecessor Haswell. The new 14 nm manufacturing process with three-dimensional FinFET transistors allows not only improvements in energy efficiency, but also a significantly smaller die size fit for more compact packages and devices.

Further advantages result from the revised microarchitecture of Broadwell. Due to its improved branch prediction, bigger buffer sizes (1500 instead of 1000 entries in the L2 TLB) and other tweaks, the performance per clock has been increased by more than 5 percent over its predecessor. There are also some new instruction set extensions designed for cryptographic applications.

Performance

Thanks to its improved architecture and the slightly higher clock rate, the Core i3-5010U ends up 10 - 15 percent faster than the Core i3-4030U (1.9 GHz, Haswell). Thus, the CPU has sufficient power for office and multimedia purposes as well as more demanding applications and multitasking.

Graphics

The integrated HD Graphics 5500 offers 24 Execution Units (EUs), however only 23 EUs (clocked at 300 - 900 MHz) are active in this case. Similar to the CPU core, the GPU architecture (Intel Gen 8) has been thoroughly revised for improved performance-per-clock. Therefore, the HD Graphics 5500 is able to beat the HD Graphics 4400 (20 EUs) as well as the HD Graphics 5000 (40 EUs), both part of the Haswell generation. Nevertheless, most games as of 2015 will be playable only in low settings.

Broadwell is the first Intel chip to fully support DirectX 11.2 as well as OpenCL 1.3/2.0 and OpenGL 4.3. Video will output natively via DisplayPort 1.2 or HDMI 1.4a. However, the new HDMI 2.0 standard is not supported.

Power Consumption

The i3-5010U is rated at a TDP of 15 W (10 W cTDP Down) including the graphics card, memory controller, VRMs and the integrated chipset. Therefore, the CPU is suited even for small ultrabooks 11-inches and greater.

AMD A12-9720P

► remove from comparison AMD A12-9720P

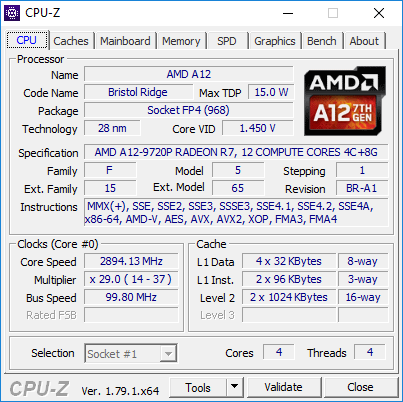
The AMD A12-9720P is a mainstream SoC from the Bristol Ridge APU series for notebooks (7th APU generation), which was introduced in 2017. The ULV chip with a TDP of 15 Watts (can be configured to 12 Watts, not verified) has four CPU cores (two Excavator modules) clocked at 2.7 - 3.8 GHz (4.05 GHz for single core were briefly achievable in our test sample), a Radeon R7 iGPU as well as a dual-channel DDR4-1866 memory controller. Carrizo is a full-fledged SoC and is also equipped with an integrated chipset, which provides all I/0 ports.

Architecture

Bristol Ridge is the successor of the Carrizo architecture and the design is almost identical. Thanks to optimized manufacturing processes and more aggressive Boost behavior, however, the clocks are a bit higher at the same power consumption. The memory controller now also supports DDR4-RAM, in this case up to 1866 MHz. More technical details are available in the following articles:

Performance

The average A12-9720P in our database is in the same league as the Core i5-4210U, as far as multi-thread benchmark scores are concerned, making the former a fairly slow chip that's suitable for basic day-to-day activities only as of late 2022.

Graphics

The integrated Radeon R7 (Bristol Ridge) GPU has 512 active shader units (8 compute cores) clocked at up to 758 MHz. Thanks to the better utilization of the clock range as well as faster DDR4-RAM, the GPU can slightly beat its predecessors Radeon R7 (Carrizo) and competes with a dedicated GeForce 920MX in the best-case scenario (dual-channel memory, low CPU requirements). Many games from 2015/2016 can be played smoothly at low settings.

Power Consumption

AMD specifies the TDP of the A12-9720P with 15 Watts, which is comparable to Intel's ULV models. This means the CPU is a good choice for thin notebooks starting with a 12-inch screen.

ModelIntel Core i3-5010UAMD A12-9720P
SeriesIntel Core i3AMD Bristol Ridge
CodenameBroadwellBristol Ridge
Series: Bristol Ridge Bristol Ridge
Intel Core i3-5157U compare2.5 GHz2 / 4 cores3 MB L3
Intel Core i3-5020U compare2.2 GHz2 / 4 cores3 MB L3
Intel Core i3-5010U « 2.1 GHz2 / 4 cores3 MB L3
Intel Core i3-5015U compare2.1 GHz2 / 4 cores3 MB L3
Intel Core i3-5005U compare2 GHz2 / 4 cores3 MB L3
AMD FX-9830P compare3 - 3.7 GHz4 / 4 cores
AMD PRO A12-9830B compare3 - 3.7 GHz4 / 4 cores
AMD FX-9800P compare2.7 - 3.6 GHz4 / 4 cores
AMD PRO A12-9800B compare2.7 - 3.6 GHz4 / 4 cores
AMD A12-9720P « 2.7 - 3.6 GHz4 / 4 cores
AMD A12-9700P compare2.5 - 3.4 GHz4 / 4 cores
AMD A10-9620P compare2.5 - 3.4 GHz4 / 4 cores
AMD A10-9600P compare2.4 - 3.3 GHz4 / 4 cores
AMD PRO A8-9600B compare2.4 - 3.3 GHz4 / 4 cores
Clock2100 MHz2700 - 3600 MHz
L1 Cache128 KB
L2 Cache512 KB2 MB
L3 Cache3 MB
Cores / Threads2 / 44 / 4
TDP15 Watt15 Watt
Transistors1300 Million3100 Million
Technology14 nm28 nm
Die Size82 mm2250 mm2
max. Temp.105 °C90 °C
SocketBGAFP4
FeaturesDDR3(L)-1600 Memory Controller, HyperThreading, AVX, AVX2, Quick Sync, Virtualization, AES-NIDDR4-1866 RAM, PCIe 3, MMX, SSE, SSE2, SSE3, SSSE3, SSE4A, SSE4.1, SSE4.2, AVX, AVX2, BMI2, ABM, TBM, FMA4, XOP, SMEP, CPB, AES-NI, RDRAND
iGPUIntel HD Graphics 5500 (300 - 900 MHz)AMD Radeon R7 (Bristol Ridge) ( - 758 MHz)
Architecturex86x86
$281 U.S.
Announced
Manufacturerark.intel.com

Benchmarks

Cinebench R23 - Cinebench R23 Multi Core
100%
1 5010U +
834 Points (1%)
Cinebench R23 - Cinebench R23 Single Core
100%
1 5010U +
411 Points (17%)
Cinebench R20 - Cinebench R20 CPU (Single Core)
100%
1 5010U +
200 Points (22%)
Cinebench R20 - Cinebench R20 CPU (Multi Core)
100%
1 5010U +
491 Points (1%)
Cinebench R15 - Cinebench R15 CPU Multi 64 Bit
min: 211     avg: 216.8     median: 218 (1%)     max: 220 Points
min: 229     avg: 234.5     median: 234.5 (1%)     max: 240 Points
Cinebench R15 - Cinebench R15 CPU Single 64 Bit
min: 84     avg: 85.3     median: 85 (26%)     max: 87 Points
min: 69     avg: 72.5     median: 72.5 (22%)     max: 76 Points
Cinebench R11.5 - Cinebench R11.5 CPU Multi 64 Bit
min: 2.32     avg: 2.4     median: 2.4 (3%)     max: 2.41 Points
min: 2.6     avg: 2.7     median: 2.7 (3%)     max: 2.7 Points
Cinebench R11.5 - Cinebench R11.5 CPU Single 64 Bit
min: 0.92     avg: 0.9     median: 0.9 (24%)     max: 0.97 Points
min: 0.93     avg: 0.9     median: 0.9 (23%)     max: 0.94 Points
Cinebench R10 - Cinebench R10 Rend. Single (32bit)
3114 Points (19%)
min: 2640     avg: 2743     median: 2743 (17%)     max: 2846 Points
Cinebench R10 - Cinebench R10 Rend. Multi (32bit)
7222 Points (5%)
min: 7200     avg: 7361     median: 7361 (5%)     max: 7522 Points
Cinebench R10 - Cinebench R10 Rend. Multi (64bit)
100%
1 5010U +
7576 Points (5%)
Cinebench R10 - Cinebench R10 Rend. Single (64bit)
100%
1 5010U +
4196 Points (5%)
wPrime 2.10 - wPrime 2.0 1024m *
min: 730     avg: 746     median: 732 (9%)     max: 775 s
415.5 s (5%)
wPrime 2.10 - wPrime 2.0 32m *
min: 23.1     avg: 23.4     median: 23.2 (5%)     max: 23.89 s
13 s (3%)
WinRAR - WinRAR 4.0
100%
1 5010U +
min: 2111     avg: 2131     median: 2119 (3%)     max: 2162 Points
7-Zip 18.03 - 7-Zip 18.03 Multli Thread 4 runs
100%
1 5010U +
6040 MIPS (3%)
7-Zip 18.03 - 7-Zip 18.03 Single Thread 4 runs
100%
1 5010U +
2132 MIPS (25%)
X264 HD Benchmark 4.0 - x264 Pass 2
100%
1 5010U +
min: 13.5     avg: 13.6     median: 13.6 (5%)     max: 13.75 fps
X264 HD Benchmark 4.0 - x264 Pass 1
100%
1 5010U +
min: 67.7     avg: 71.9     median: 73.9 (17%)     max: 74 fps
HWBOT x265 Benchmark v2.2 - HWBOT x265 4k Preset
0 fps (0%)
TrueCrypt - TrueCrypt Serpent
min: 0.116     avg: 0.1     median: 0.1 (0%)     max: 0.133 GB/s
0.2 GB/s (0%)
TrueCrypt - TrueCrypt Twofish
min: 0.199     avg: 0.2     median: 0.2 (3%)     max: 0.203 GB/s
0.4 GB/s (6%)
TrueCrypt - TrueCrypt AES
min: 1.2     avg: 1.3     median: 1.3 (3%)     max: 1.3 GB/s
1.8 GB/s (5%)
Blender - Blender 3.3 Classroom CPU *
100%
1 5010U +
3836 Seconds (49%)
R Benchmark 2.5 - R Benchmark 2.5 *
100%
1 5010U +
1.3 sec (28%)
3DMark 06 - CPU - 3DMark 06 - CPU
100%
1 5010U +
min: 2772     avg: 2829     median: 2828.5 (6%)     max: 2885 Points
Super Pi mod 1.5 XS 1M - Super Pi mod 1.5 XS 1M *
min: 18.2     avg: 25.7     median: 18.3 (4%)     max: 40.5 s
min: 17.77     avg: 19.6     median: 19.6 (4%)     max: 21.4 s
Super Pi mod 1.5 XS 2M - Super Pi mod 1.5 XS 2M *
min: 40.9     avg: 51     median: 40.9 (2%)     max: 71.3 s
min: 39.77     avg: 44.1     median: 44.1 (2%)     max: 48.5 s
Super Pi Mod 1.5 XS 32M - Super Pi mod 1.5 XS 32M *
min: 898     avg: 1012     median: 903 (4%)     max: 1236 s
min: 864     avg: 902     median: 901.5 (4%)     max: 939 s
3DMark Vantage - 3DM Vant. Perf. CPU no Physx
100%
1 5010U +
min: 8083     avg: 8137     median: 8137 (7%)     max: 8191 Points
3DMark 11 - 3DM11 Performance Physics
min: 2741     avg: 2938     median: 3002 (8%)     max: 3072 Points
2761 Points (7%)
3DMark - 3DMark Ice Storm Physics
min: 29311     avg: 29383     median: 29383 (24%)     max: 29455 Points
25648 Points (21%)
3DMark - 3DMark Ice Storm Extreme Physics
28754 Points (23%)
24747 Points (20%)
3DMark - 3DMark Ice Storm Unlimited Physics
min: 24457     avg: 27079     median: 27079 (23%)     max: 29701 Points
3DMark - 3DMark Cloud Gate Physics
min: 2441     avg: 2470     median: 2470 (6%)     max: 2499 Points
min: 2258     avg: 2330     median: 2329.5 (6%)     max: 2401 Points
3DMark - 3DMark Fire Strike Standard Physics
min: 3495     avg: 3504     median: 3503 (6%)     max: 3514 Points
min: 3179     avg: 3265     median: 3264.5 (6%)     max: 3350 Points
3DMark - 3DMark Time Spy CPU
100%
1 5010U +
1199 Points (5%)
Geekbench 4.4 - Geekbench 4.1 - 4.4 64 Bit Single-Core
100%
1 5010U +
2613 Points (26%)
Geekbench 4.4 - Geekbench 4.1 - 4.4 64 Bit Multi-Core
100%
1 5010U +
5066 Points (6%)
Geekbench 3 - Geekbench 3 32 Bit Multi-Core
100%
1 5010U +
min: 4540     avg: 4546     median: 4545.5 (8%)     max: 4551 Points
Geekbench 3 - Geekbench 3 32 Bit Single-Core
100%
1 5010U +
min: 2164     avg: 2166     median: 2165.5 (42%)     max: 2167 Points
Geekbench 3 - Geekbench 3 64 Bit Multi-Core
100%
1 5010U +
min: 4777     avg: 4795     median: 4794.5 (8%)     max: 4812 Points
Geekbench 3 - Geekbench 3 64 Bit Single-Core
100%
1 5010U +
min: 2293     avg: 2297     median: 2296.5 (34%)     max: 2300 Points
Geekbench 2 - 32 Bit - Geekbench Stream
100%
1 5010U +
min: 6698     avg: 6746     median: 6745.5 (54%)     max: 6793 Points
Geekbench 2 - 32 Bit - Geekbench Memory
100%
1 5010U +
min: 5336     avg: 5382     median: 5382 (49%)     max: 5428 Points
Geekbench 2 - 32 Bit - Geekbench Floating Point
100%
1 5010U +
min: 4801     avg: 4822     median: 4822 (9%)     max: 4843 Points
Geekbench 2 - 32 Bit - Geekbench Integer
100%
1 5010U +
min: 4398     avg: 4417     median: 4417 (9%)     max: 4436 Points
Geekbench 2 - 32 Bit - Geekbench Total Score
100%
1 5010U +
min: 4971     avg: 4984     median: 4984 (13%)     max: 4997 Points
Mozilla Kraken 1.1 - Kraken 1.1 Total Score *
min: 1727     avg: 2710     median: 3171 (4%)     max: 3232 ms
2422 ms (3%)
Sunspider - Sunspider 1.0 Total Score *
min: 146.7     avg: 153.5     median: 153.5 (2%)     max: 160.3 ms
min: 146.6     avg: 192.1     median: 192.1 (2%)     max: 237.6 ms
Octane V2 - Octane V2 Total Score
min: 10182     avg: 13330     median: 10221 (9%)     max: 19588 Points
min: 14783     avg: 16961     median: 16960.5 (15%)     max: 19138 Points
WebXPRT 4 - WebXPRT 4 Score
100%
1 5010U +
77.2 Points (22%)
Power Consumption - Prime95 Power Consumption - external Monitor *
100%
1 5010U +
24.1 Watt (4%)
Power Consumption - Cinebench R15 Multi Power Consumption - external Monitor *
100%
1 5010U +
17.4 Watt (3%)
Power Consumption - Cinebench R15 Multi Power Efficiency - external Monitor
100%
1 5010U +
12.6 Points per Watt (9%)

Average Benchmarks Intel Core i3-5010U → 100% n=22

Average Benchmarks AMD A12-9720P → 110% n=22

- Range of benchmark values for this graphics card
- Average benchmark values for this graphics card
* Smaller numbers mean a higher performance
1 This benchmark is not used for the average calculation

Add one or more devices and compare

In the following list you can select (and also search for) devices that should be added to the comparison. You can select more than one device.

restrict list:

show all (including archived), 2024, 2023
v1.26
log 19. 21:48:02

#0 checking url part for id 6389 +0s ... 0s

#1 checking url part for id 9192 +0s ... 0s

#2 not redirecting to Ajax server +0s ... 0s

#3 did not recreate cache, as it is less than 5 days old! Created at Fri, 19 Apr 2024 05:38:49 +0200 +0.001s ... 0.001s

#4 composed specs +0.04s ... 0.041s

#5 did output specs +0s ... 0.041s

#6 getting avg benchmarks for device 6389 +0.004s ... 0.045s

#7 got single benchmarks 6389 +0.024s ... 0.068s

#8 getting avg benchmarks for device 9192 +0.003s ... 0.071s

#9 got single benchmarks 9192 +0.014s ... 0.085s

#10 got avg benchmarks for devices +0s ... 0.085s

#11 No cached benchmark found, getting uncached values +0.09s ... 0.174s

#12 min, max, avg, median took s +0.161s ... 0.335s

#13 return log +0.024s ... 0.359s

Please share our article, every link counts!
> Expert Reviews and News on Laptops, Smartphones and Tech Innovations > Benchmarks / Tech > Processor Comparison - Head 2 Head
Redaktion, 2017-09- 8 (Update: 2023-07- 1)